The EIA STEO was published recently the estimate below is based on data from that report and statistics from the EIA International Energy Statistics. The EIA expects the 2018 peak for annual average World C+C output will be surpassed in 2025.
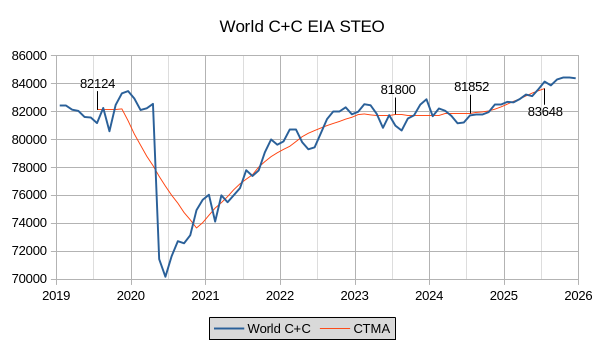
Beyond 2024 the EIA forecast looks optimistic to me, my expectation is slightly higher output in 2024 (annual average World C+C output) of about 82100 kb/d (about 250 kb/d higher than the EIA forecast) and about 82400 kb/d in 2025 (roughly 1250 kb/d less than the EIA forecast).
There have been a number of revisions since last month which are detailed below.
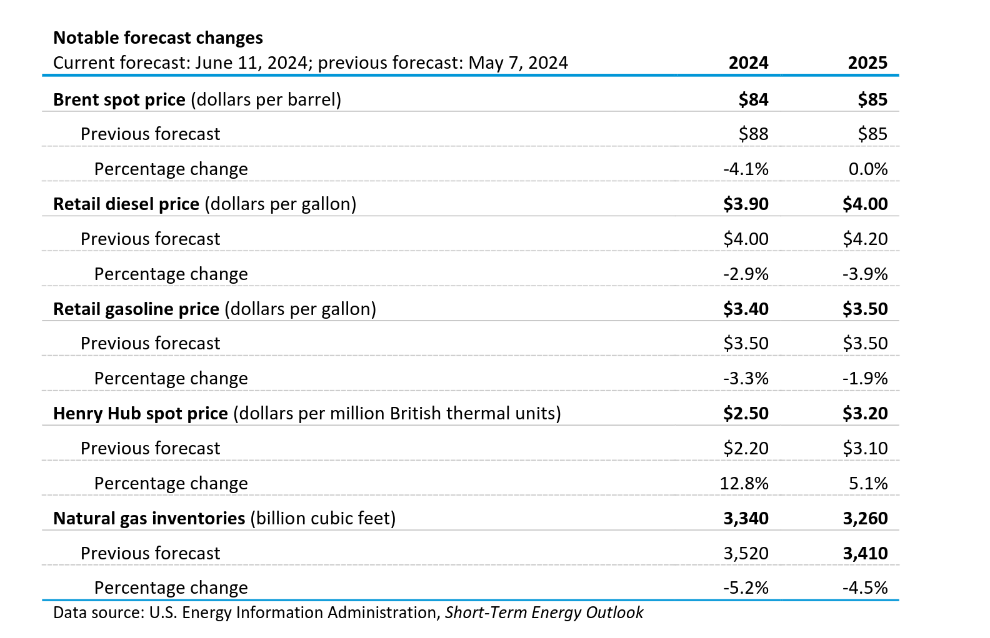
Oil, diesel and gasoline prices are lower and natural gas prices higher than forecast last month.
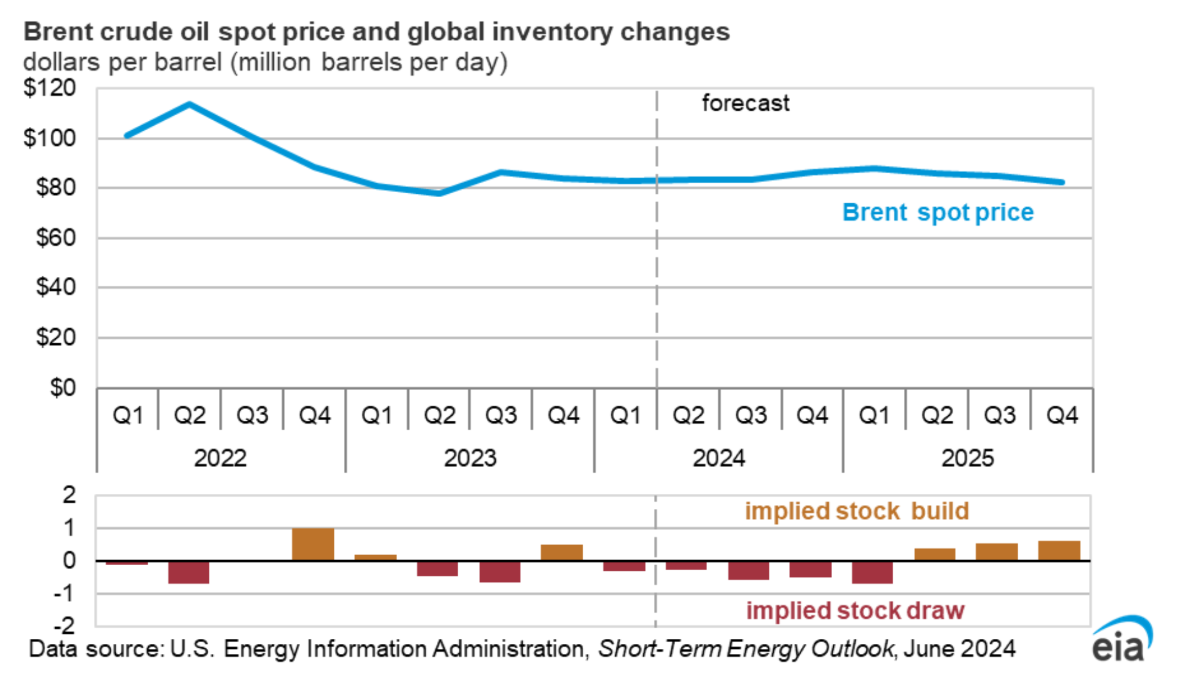
It is not clear why these relatively flat Brent prices would result in the strong increase in production in World C+C output from May 2024 to December 2025 that has been forecast by the EIA, in my view flat output would be more in line with this oil price forecast.
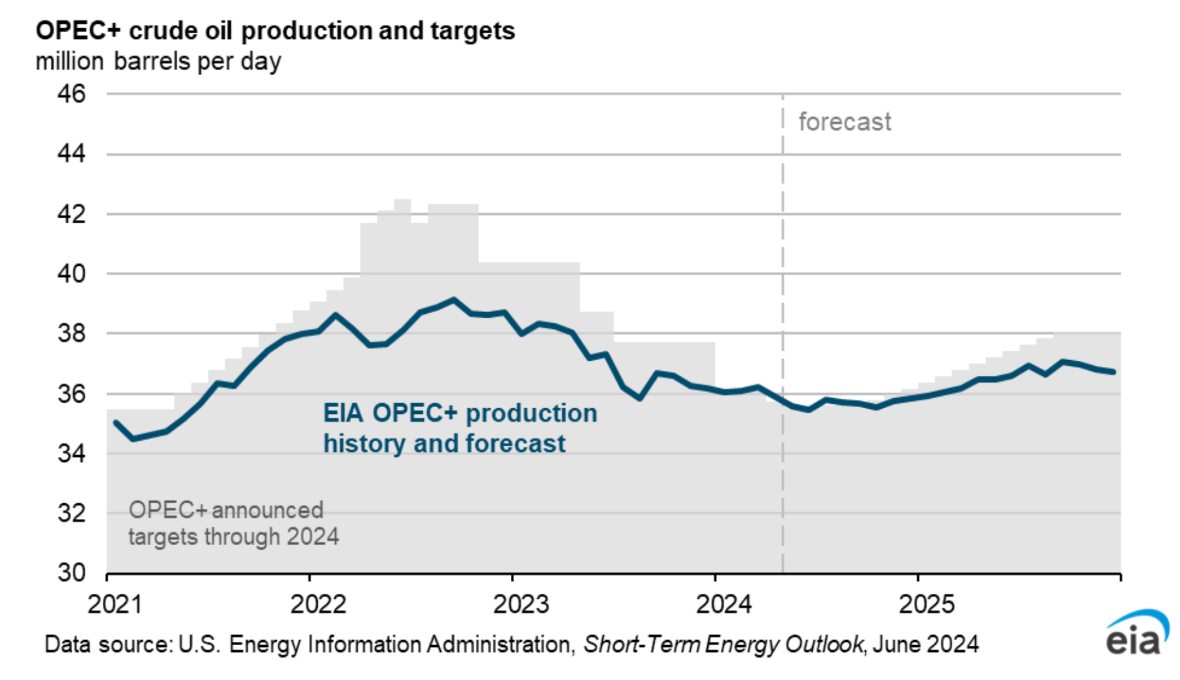
The EIA expects slightly less output from OPEC+ than the targets announced by OPEC+ (shown in gray in the chart above).
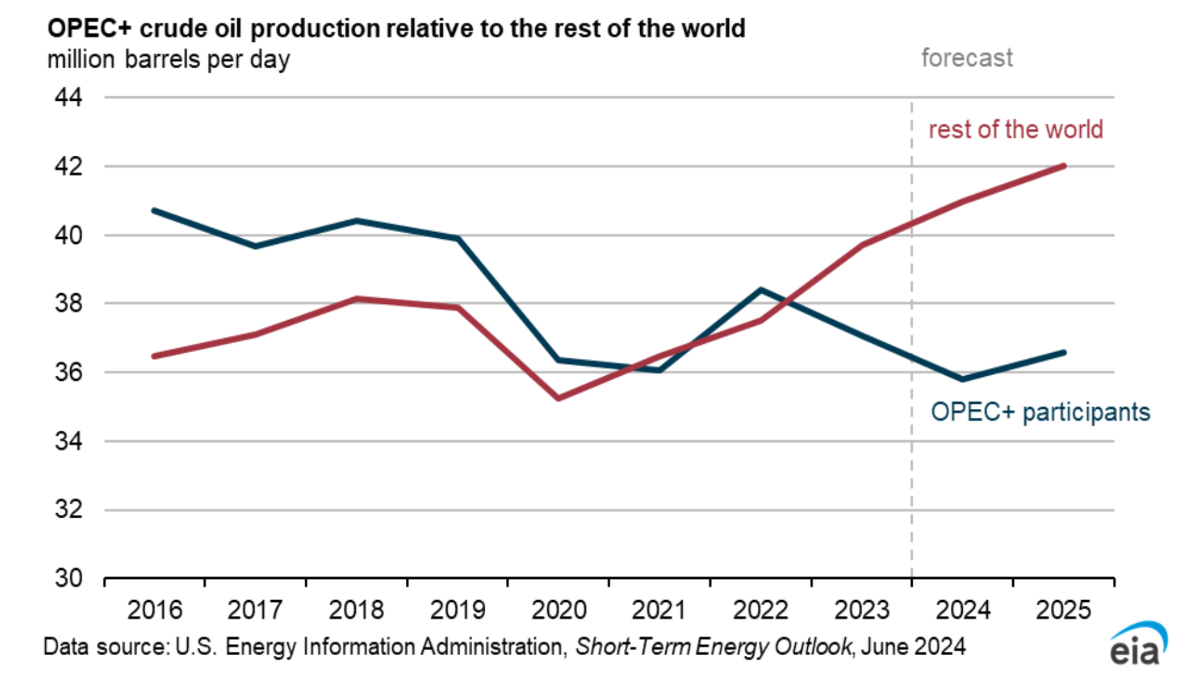
The chart above contrasts the strong increases in output from non-OPEC+ producers relative to OPEC+ especially since 2022 and the srong increase is forecast to continue in 2024 and 2025.
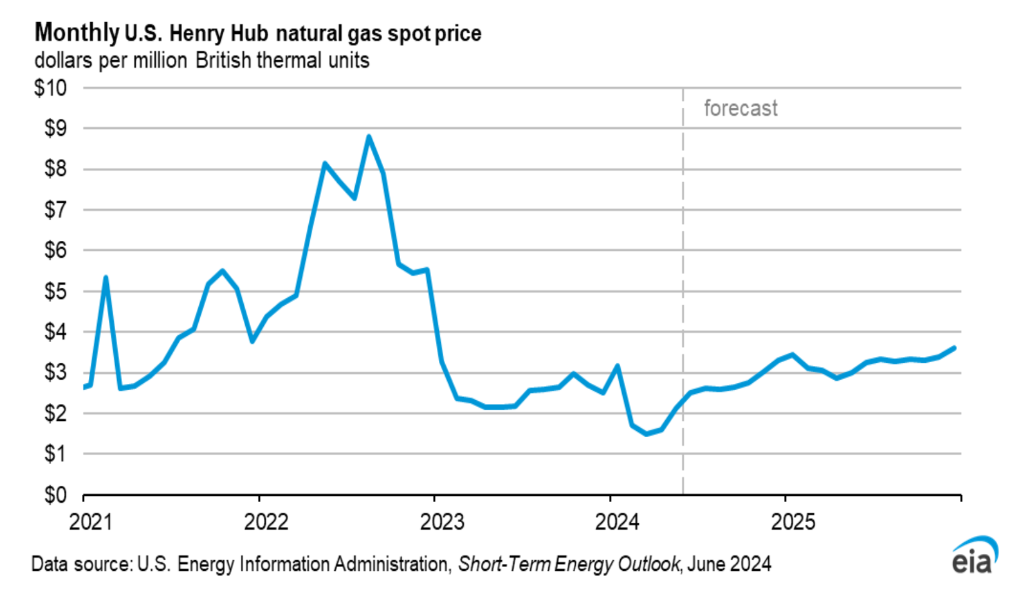
Rising natural gas prices might help profitability in the Permian basin, but note that typically Waha Hub prices which reflect the natural gas price that Permian producers may see is often $1 or more lower than the Henry Hub price. Note also the huge fluctuation in natural gas prices from almost $9/ MMbtu in 2022 to under $2/ MMbtu in 2024, 4.5 times lower. For oil at $40/b a similar level of change would mean an increase to $180/b, natural gas prices are much more volatile than oil prices.
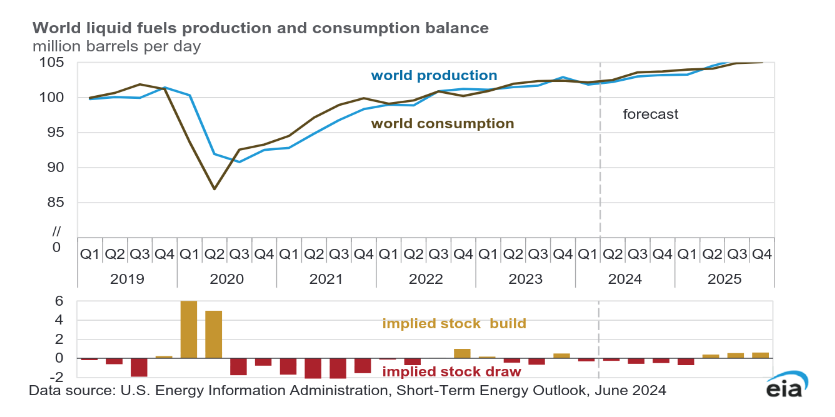
Stock draws are expected in 2024 followed by stock builds in 2025 based on the EIA forecast in June.
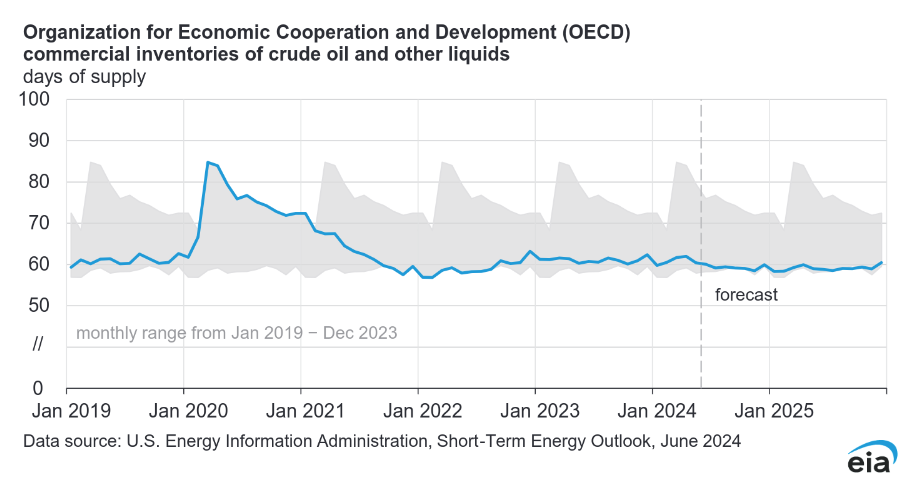
OECD commercial liquids inventory is expected to be close to the 5 year low over the forecast period.
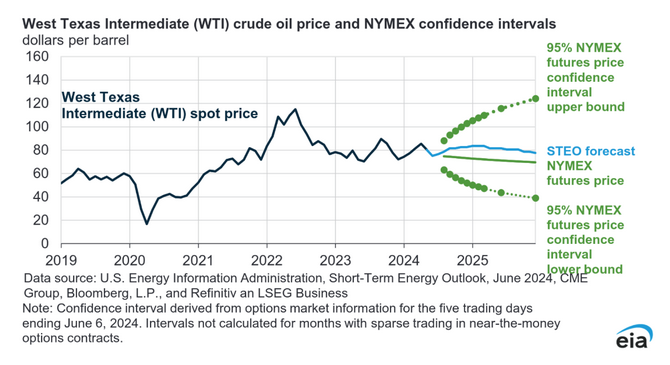
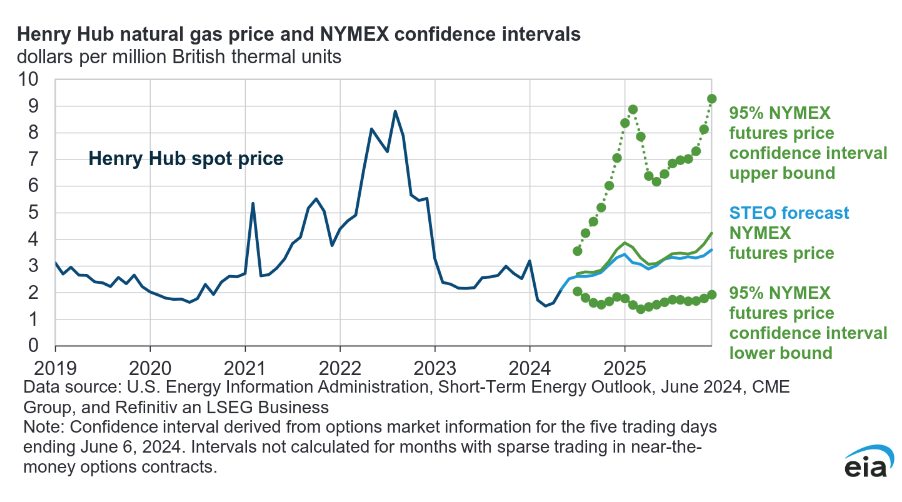
Note the difference in symmetry between the 95% confidence intervals in oil price vs natural gas price. For oil the range for December 2025 is 40 to 120 per barrel with the STEO best guess at about 80/b. For natural gas the range is 2/MMbtu to 9/MMbtu with the STEO best guess at about $3.50/MMbtu. There is much higher upside variability for natural gas compared to oil (the equivalent for the high estimate for oil would be about $206/b).
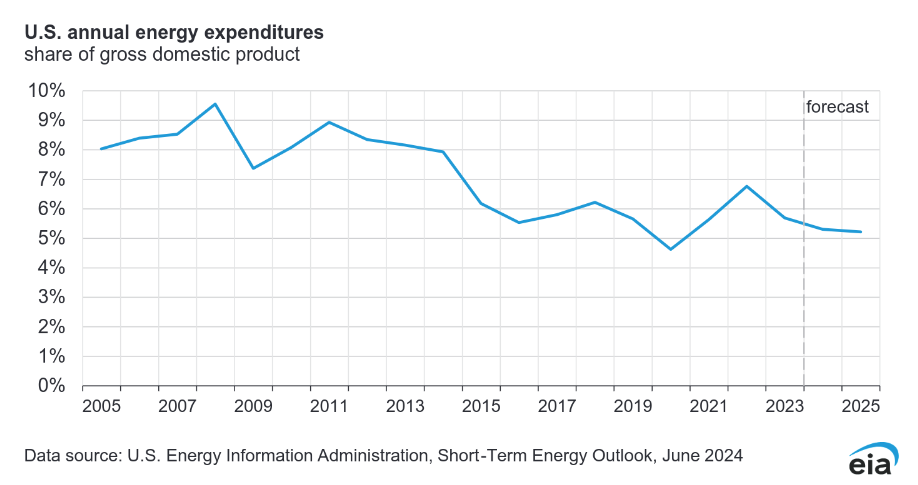
In the US, energy expenditures as a share of GDP have been generally decreasing over the 2005 to 2024 period.
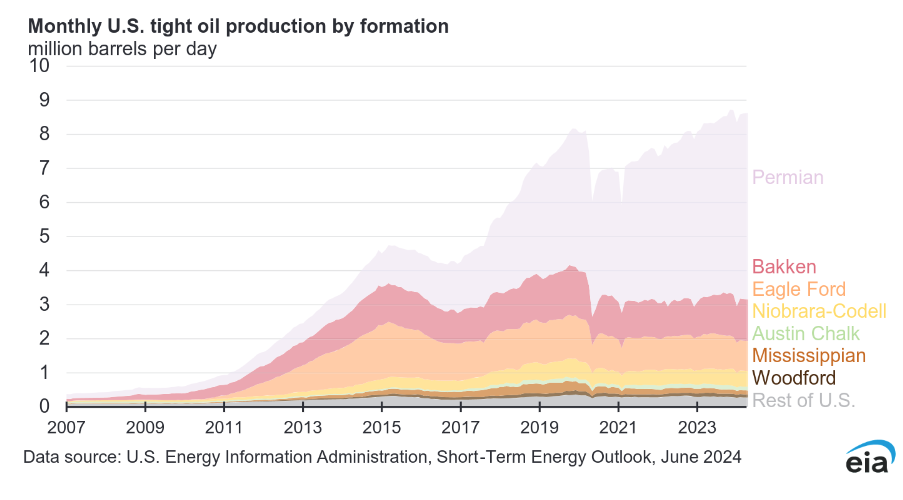
This chart indicates the dominance of the Permian basin especially since 2021, with most of the tight oil increase from 2021 to 2024 coming from the Permian.
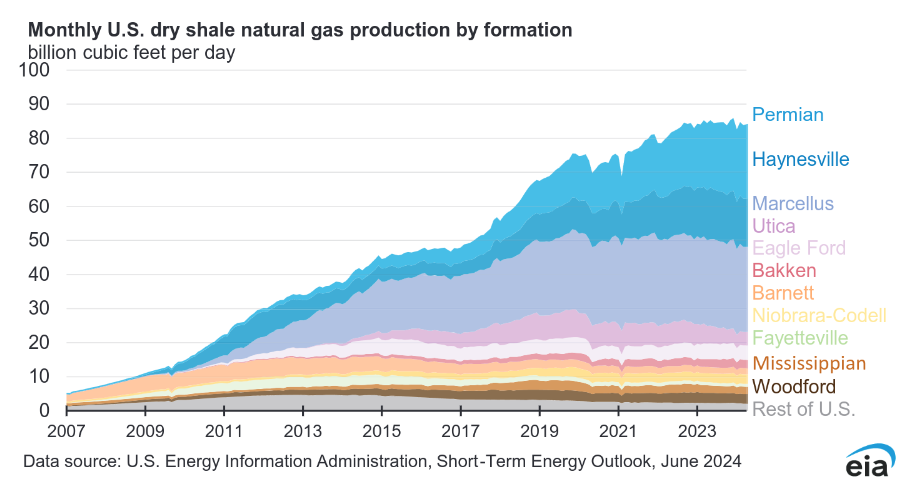
The Permian also played an important role in keeping overall shale gas output pretty flat since the end of 2022 (with other basins as a group showing decreasing shale gas output since the end of 2022.)
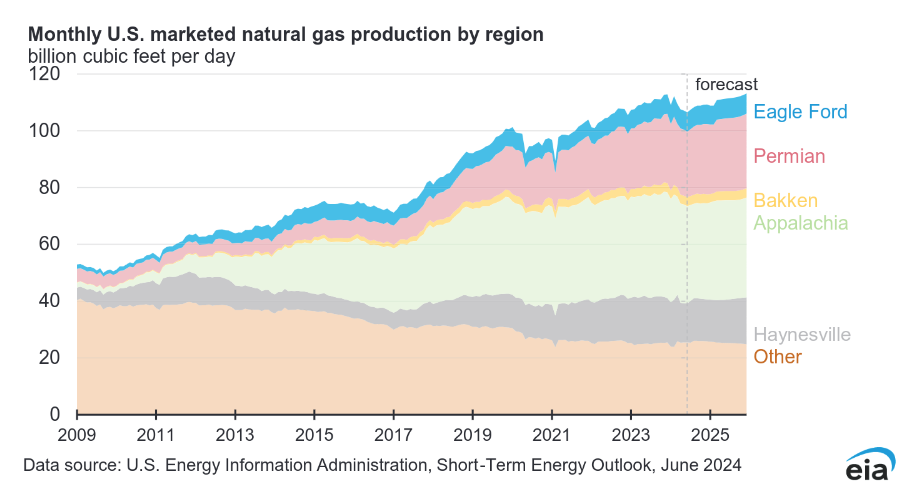
The chart above includes NGL output with dry shale gas output and also includes conventional natural gas from each region.
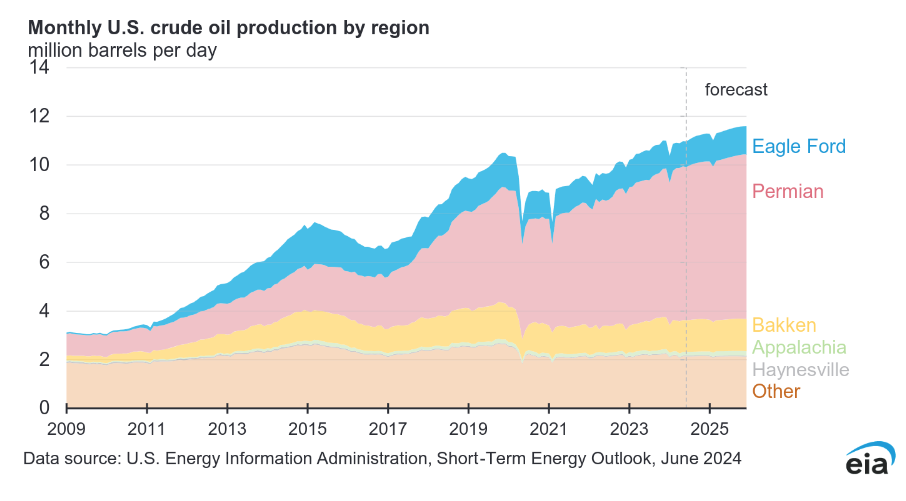
The chart above shows that for the US C+C output since 2021, most of the increase has been from the Permian basin, it also shows that future annual rate of increase from April 2024 to December 2025 is expected to be smaller than the Jan 2021 to April 2024 period. I believe the EIA forecast for the Permian Basin may be a bit optimistic. The chart above includes both tight oil and conventional C+C from each region.
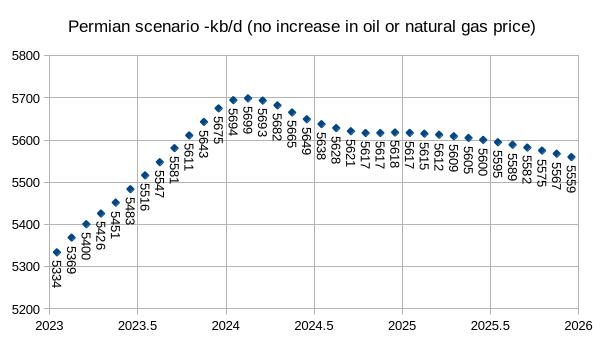
The scenario above assumes the EIA forecast for oil and natural gas prices from April 2024 to December 2025 is correct, it is for Permian tight oil output only rather than regional Permian C+C output (C+C output would be roughly 400 kb/d higher than tight oil output from 2023 to 2025 in the Permian basin.) Compared to the EIA forecast for the Permian basin, this scenario’s centered 12 month average is about 247 kb/d lower in 2024 and 632 kb/d lower in 2025 than the EIA’s forecast for Permian tight oil output in 2024 and 2025.
89 responses to “Short Term Energy Outlook, June 2024”
Great work Dennis!
https://www.youtube.com/watch?v=BRqIezbVMHM
7 minutes
The Energy Crisis in Europe due to Russia
juicy info in here!!
Banned for what….posting a link to energy content on an energy blog?
Sorry Andre this comment refers to “R” who had posted an anti-Semitic comment in reply, not to you. Their comment has since been removed. Dennis or Ovi, can you clean up this message thread so it doesn’t look like we are referring to Andre? Thank you!
no worries mate!
Why the STEO figure doesn’t clearly demarcate the real historical data from the projected data
Svaya,
Sorry about that.
Thanks,
Much better IMHO
You’re welcome, I agree.
What? No cliff?
Kidding aside, on the US ‘energy expenditures’ do you know what that includes?
Just purchases of fossil fuels?, or would it include uranium, photovoltaics, transformers, LNG export terminals, sand for fracking, and the other myriad expenses that comprise energy sector costs?
That chart indicates a dramatic drop in national energy expense as a percent of GDP.
Maybe other component expenses of national GDP have skyrocketed, such as obesity treatment and political advertising.
Hickory,
Pretty sure it is all spending on energy as a percentage of GDP.
Hickory,
I checked on this and yes it it expenditures on all energy (not just fossil fuel). Here is a chart with data from 1970 to 2022 (data for 2023 not out yet) and no data before 1970. The straight line is the OLS trend which probably is not meaningful. The chart is for the US only.
Thank you Dennis. This will surprise many people.
A take home message is that ‘GDP’ includes many things, some components having grown very fast.
Hickory,
GDP includes all goods and services produced.
See https://fred.stlouisfed.org/release/tables?rid=53&eid=14897#snid=14923
for some of the detail.
If you are concerned about financial and insurance and recreation expenditures, the chart below subtracts those from GDP and looks at energy expenditures percentage as a share of this “alternate GDP”
I am assuming this is in part due to efficiency. We have managed to get more unit output per unit Joule.
To get an exact understanding, i guess one has to look at how GDP is measured, which may or may not have changed over time, which may also give us the wrong impression and worldview.
Iron Mike,
The ratio is nominal energy expenditures to nominal GDP so inflation measures are not part of the equation. Statistics are never perfect, this is just the best the US government has to offer, data goes back to 1929 for US GDP, we only have energy expenditure data from 1970 to 2022.
For GDP see
https://apps.bea.gov/iTable/?reqid=19&step=2&isuri=1&categories=survey&_gl=1*14nkq3v*_ga*MjY1NDE0MTAwLjE3MTQwNzE2MjE.*_ga_J4698JNNFT*MTcxOTU4ODM0Ny45LjEuMTcxOTU4ODY3Ni4xOS4wLjA.#eyJhcHBpZCI6MTksInN0ZXBzIjpbMSwyLDMsM10sImRhdGEiOltbImNhdGVnb3JpZXMiLCJTdXJ2ZXkiXSxbIk5JUEFfVGFibGVfTGlzdCIsIjUiXSxbIkZpcnN0X1llYXIiLCIyMDIyIl0sWyJMYXN0X1llYXIiLCIyMDI0Il0sWyJTY2FsZSIsIi05Il0sWyJTZXJpZXMiLCJBIl0sWyJTZWxlY3RfYWxsX3llYXJzIiwiMSJdXX0=
for energy expenditures see
https://www.eia.gov/totalenergy/data/browser/?tbl=T01.07#/?f=M
Thanks for the link Dennis, very interesting datasets.
Just a sidenote according to vox.com:
The basic formula — consumption plus investment plus government spending plus net exports — never has, but the US in 2013 made a big change to its GDP accounting when it added both artistic creation and research and development to the total, which it had never done before. The change came because the international standards, the System for National Accounting, changed in 2008 and the US wanted to make sure its statistics would remain comparable to the rest of the world’s (this means the rest of the world has also or is also making these changes).
Those changes started including intangible things like the production costs on movies or a drug company creating a new treatment as investment, rather than intermediate costs. In addition, the BEA also started counting defined benefit pensions differently, adding them to GDP when workers recieved the payouts, not when employers paid money in.
Not sure if removing those components would have much of an impact but good to know eitherway.
Dennis,
Regarding your second link EIA’s primary energy consumption, I’d like to overlay that data with world birthrate, i think there might be some correlation there.
I’d go along with efficiency gains, but also include the exporting of so much heavy industry and manufacturing as well. It’s the latter that means we should be looking at the world as a whole for this type of number.
On the efficiency gains, they give us a false sense of everything being OK providing we keep increasing efficiency. It’s a trap..
Let’s assume we get so good, ‘we’ get to 100% efficiency, or whatever physics theoretical maximum efficiency is for something simple like crushing and grinding rocks to liberate the minerals, at some point in xx years time.
10 years later we will be mining lower grade ore, meaning more rock to crush and grind to gain the same quantity of minerals, so more energy has to be used to do it, an ever increasing quantity of energy to produce the same quantity of minerals as the years go by. In the long run it’s physically not possible to continue like this on a finite planet.
Hideaway,
You are generally correct and you are looking at it from a physicist/scientist viewpoint. Lets expand on that perspective and add an economist/technologist viewpoint:
You mention 10 years later we will be mining lower grade ore. This is true, but human ingenuity will allow the lower grade ores to be mined efficiently. So technology will definitely play a factor and kick the proverbial can further down the road.
These topics are complex and multifaceted and it doesn’t help to look at it myopically. Yes, the fact is there is a limit, but that limit maybe significantly delayed due to human ingenuity.
Hideaway,
I agree looking at it at the World level is better as high energy use industries have mostly left the US.
The best we can do at the World scale is energy consumed per unit of real GDP because we don’t have the energy expenditure data for the World, only energy consumption in EJ or TWh. Chart below gives World Fossil fuel consumption in MJ per 2015$ of real GDP from 1965 to 2023 using World Bank data for real GDP
https://data.worldbank.org/indicator/NY.GDP.MKTP.KD
and Statistical Review of World Energy data for Fossil fuel consumption
https://www.energyinst.org/statistical-review
I agree that for energy in general there will be a physical efficiency limit, but for fossil fuel, energy use might eventually be reduced to zero (some fossil fuel may continue to be used for material inputs for some products).
I also agree growth cannot continue indefinitely, but I expect the demographic transition will result in a peak and decline in population and that eventually we might reach a steady state (real GDP growth of zero.) Though that would be 100 to 200 years in the future.
HIDEAWAY —
I’m not sure metals are getting more dilute. We are producing a lot of scrap metal, which is a less dilute source of metal than ore.
Most of the metal we use is steel with is mostly iron. We produce a lot of steel from ore because steel products have a long lifetime and because demand is growing. When demand levels off, iron mining is likely to decline significantly.
In some cases scrap is harder to work with than ore, because it contains unwanted metals. This is currently a problem with aluminum.
Dennis, …. ” we might reach a steady state”.
Except that steady state is not a physical possibility..
No matter how much we try it is impossible to recycle everything due to entropy and dissipation in the environment.
Therefore a civilization that uses ANY non renewable resources, at any level, will have to continually mine ‘some’ new materials. As we always use the highest grade, closest and easiest to get first, then the resources needed will have to get on average lower grade, further away and likely deeper as well.
Even if we had 100% efficiency in obtaining these resources, then next year would require more energy to gain the constant supply.
Therefore civilization that uses non renewable resources has to keep growing to provide the extra energy needed every year to mine the lower grade resources needed over the very long term, no exceptions.
We’ve had efficiency gains that muddy the waters, with some thinking we can continue to access lower grade ores with a constant amount of energy, even though when it’s been studied (Calvo and Mudd 2016) we had to increase energy use by 46% to increase copper production by 30%. We have used up the easy to access efficiency gains.
Every one of your arguments about the ‘green’ future with maintained modernity, relies upon massive mining and processing of new materials on a gargantuan scale. I keep asking you to show some numbers on a world wide scale, of how much energy would be needed to do the mining and building of all the aspects you suggest, like hydrogen storage, synthetic fuels, electric mining and long distance travel, but you never do. I suspect it’s because the world wide numbers clearly show an impossibility.
BTW using GDP these days when it has not been adjusted for new debt is never going to be accurate, so real GDP should be minus new debt plus debt repayment, to see the ‘real’ picture. It’s why I use energy use as the marker for real activity in the human economy.
Hideaway,
Yes in the very long term the sun becomes a red giant the planet becomes too hot to support life. In the mean time there is not likely to be an energy shortage.
On a planet wide scale for every debt there is a liability, the net is zero, GDP is income and is fairly accurate, it is the goods and services which people are willing to purchase, the steady state I refer to is population declining at a rate equal to GDP per capita growth (recently for the World this has been roughly 1.5% per year).
As the World becomes wealthier and population reaches some steady state level (perhaps 1 billion for the planet or less if necessary) GDP per capita growth rate might approach zero, this would be far into the future and what this future looks like is impossible to imagine correctly.
Iron Mike,
I agree likely due to increased efficiency (if underlying data is roughly correct). Chart below looks at energy consumed (in thousands of btu) per dollar of real GDP (2017$), in this case an inflation index is used (chained 2017 $) to convert from nominal to “real” GDP. Data from 1949 to 2022. Note that CO2 emissions per dollar of real GDP (2017$) (a rough proxy for fossil fuel consumption) decreased by about a factor of 5 from 1949 to 2022 where energy consumption rather than the factor of 3.27 decrease in Energy consumption per $ of real GDP (2017$).
Thanks Dennis,
If you have the data, can you overlay U.S population growth rate with that dataset to see if there is a correlation. I don’t have the dataset to do it myself.
Iron Mike,
See https://www.eia.gov/totalenergy/data/browser/?tbl=T01.07#/?f=M
for the data, it is unclear what you are looking for.
Dennis,
Have a look at the chart in the link, scroll down. Annual growth rate of the population for U.S.
https://www.macrotrends.net/global-metrics/countries/USA/united-states/population-growth-rate
There seems to be a correlation with US energy consumption. Seems like a possible causation too in my opinion. As the birthrate drops so does the energy consumption. Could be another factor on top of efficiency. I could be wrong though just going off shape of the curves.
Ill try to get the datasets and see the R^2.
R^2 is ~ 53%
I think it could still be a possible causation as to less energy per unit GDP, declining birthrates. I could very well be wrong though.
Iron Mike,
An aging population could also reduce energy consumption perhaps. US population vs energy consumption, correlation from 1982 to 2007 is good, but 2008 to 2022 not very good, R squared about 0.083.
We do have a significant immigration component to population in the US…not just domestic birthrate.
Dennis,
That’s a great point and that demographic change would be another factor.
Hickory,
My bad I shouldn’t have wrote birthrate, it is actually the U.S population growth rate which includes immigration.
As far as energy embodied in sand for fracking, probably only included as far as costs passed on when energy products is sold, the expenditures are on final energy products such as natural gas for heating a home gasoline or diesel at the pump or electricity sold to final consumers.
https://www.oilystuff.com/forumstuff/forum-stuff/down-to-one-bench-in-saudi-america
Saudi America down to one bench
Very interesting article. Did Exxon got played? Early signs are “yes”.
I am not sure if the minor benches can sustain the plateau, but I am sure they will be drilled, even if production flows are disappointing. As the wells decay, the more wells you have per pad, the more late-stage production per pad you have, the better utilization of the pad infrastructure: gathering, separation, transport, water disposal, etc.
Some companies are drilling up to 30 wells per pad in some areas, the economics is favorable…
The Short-Term Energy Outlook for the next two or three months is based on estimated production. After that, it is based on estimated demand. The EIA just assumes whatever the demand is, production will rise to meet it. Therefore, the predicted production is based entirely on the predicted demand.
Perhaps they are right. But I don’t think that is the case.
I have worked in an Energy Organisation.
We used linear regression to forecast electricity demand and capital/operational budgeting.
linear regression doesn’t work well if things aren’t linear!
None of us were electrical engineers or boots on the ground.
The higher ups had the ability to override the forecasts.
And u can’t change the forecasting algorithm because u think u have a better idea!!!!
Try suggesting a non-normal generalised polynomial regression and hear the gasps throughout the organisation.
And don’t forget all the stakeholders using that data to form decisions. Companies are doing their budgeting on what the EIA says!!!
The EIA may be inaccurate, but they are not sinister. Atleast not the guys/gals actually doing the work and not playing politics
I’ll bet atleast 95% of people working at the EIA don’t know what Peak Oil is or it is a bullshit conspiracy. And those that do … are afraid to speak up.
Ron,
I agree.
Thanks Dennis,
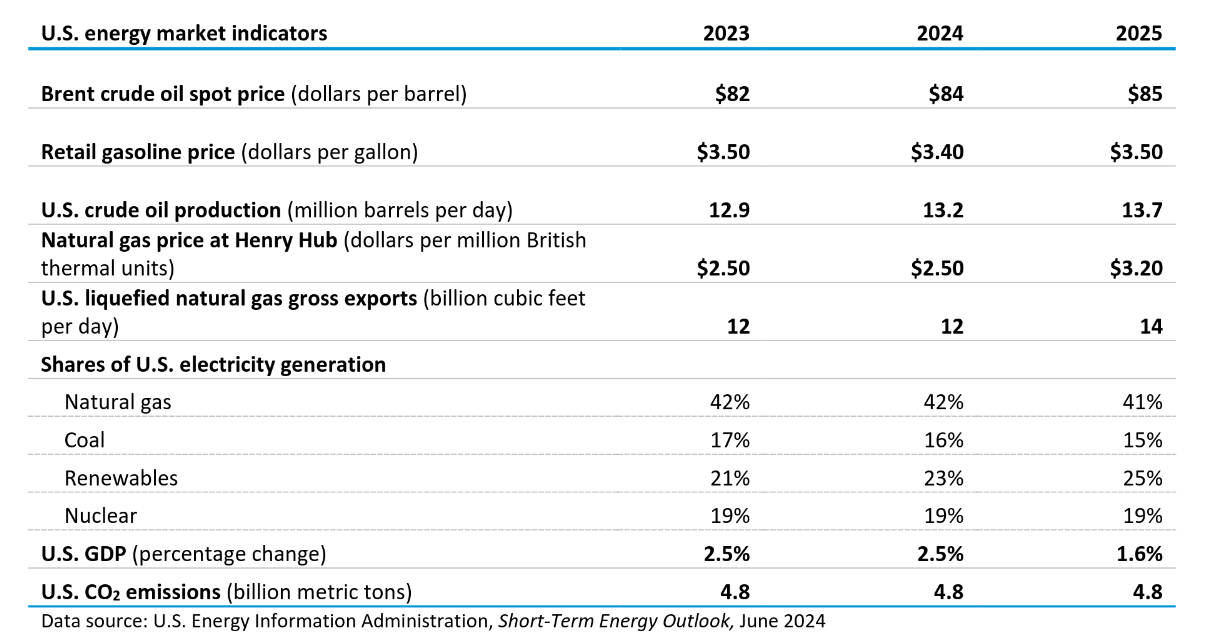
As usual i find the EIA’s forecast as odd. Looking at the second chart, the table shows that in 2025 US GDP to drop down to 1.6%. While brent crude and gas prices are higher on average than the previous year.
So they are seeing an economic slowdown but higher energy prices. I find that rather peculiar.
Also as you noted, they see a much higher volatility in gas prices compared to oil. Which again for me is a bit strange. I wonder if they have any possible causation as to why this is in their modelling.
Iron Mike,
You are welcome, thank you for the feedback.
The price for Brent Crude would be determined by the change in World GDP as it is determined by the World oil market, for natural gas they might be expecting that there will be higher exports of LNG, the 95% confidence interval is based on the futures market data for Brent and Henry Hub markets as far as I understand.
Generally at the EIA they think in linear terms so if last year plugin vehicle sales increased by x million units (I don’t have that number) they would tend to assume that same increase would occur in 2024 and 2025. I tend to see past exponential growth as continuing so reach a different conclusion, but I may well be wrong. Generally plugin vehicle sales have increased more than I have estimated in the past, perhaps in this case I am over estimating.
In June 2019 I did a “realistic” EV scenario which had the World plugin light duty vehicle fleet at 37.5 million at the end of 2023, current estimate is about 42 million for World light duty plugin vehicle fleet. I was not accounting for the pandemic in my model as I had no idea of the impending pandemic back in the summer of 2019.
914 out, with a moderate monthly increase, for APR24 data.
https://www.eia.gov/petroleum/production/
OH back in front of LA. (MT and KS not that far behind, also.)
I still would put (quite literally) money on ND breaking 1.3 before year end. You all underestimate its recovery from winter, often.
“Rigs targeting oil in the Permian Basin fell by 3 to 303, and rigs in the Eagle Ford also lost 3 to 44.”
https://seekingalpha.com/news/4120700-us-drilling-rigs-drop-for-eighth-time-in-10-weeks-in-baker-hughes-count?source=content_type%3Areact%7Cfirst_level_url%3Amarket-news%7Csection_asset%3Amain
The Rig report for the week ending June 28
– US Hz oil rigs decreased by 7 to 431. This is the eight consecutive weekly drop, down 28 from 8 weeks ago and the lowest since January 22 when the rig count was 434 and rising after the Xmas break.
– The Texas rig count dropped by 5 to 236 rigs and is down 90 from January 2023 . Of the 5 rigs, 3 were from the Eagle Ford basin and there were 2 more from the Texas Permian.
– Texas Permian dropped 2 to 190 while the New Mexico Permian dropped 1 to 102. The Texas Permian is down 54 rigs from the May 2023 high of 244.
– In Texas, both Martin and Midland counties were unchanged at 30 and 18 respectively.
– Eagle Ford dropped 3 to 43.
– In New Mexico Lea was unchanged at 50 while Eddy dropped by 1 to 51.
– NG Hz rigs were unchanged at 86. (Not shown).
Frac Spread report for the week ending June 28.
The frac spread count dropped by 9 to 237 and is down 35 from one year ago. It is also down by 35 spreads since March 8. The overall trend in frac spreads appears to be down.
This is a big weekly drop and raises the question; “What is behind this big drop in such a short period?”
If I were into TA I would guess that the 250 support is under severe pressure with lower lows, but I´m not, so I guess there is some fundamental financial reason behind the quite steady average drop.
Could be a shortage of viable areas (at current prices of course) perhaps?
(Just saw related comments below, will be interesting to follow, no position : )
US April Oil Production
Production rose by 72 kb/d to 13,248 kb/d with Texas being the biggest contributor, 53 kb/d. On a YoY basis, April production is 598 kb/d higher.
It is difficult to understand how Texas is increasing production while dropping rigs and fracs.
Ovi,
We don’t know the frac count for Texas, Texas rigs have been pretty flat from Aug 2023 to May 2024, if there is a 7 month lag between drilling and first flow the drop in rig count starting in May wouldn’t show up until November. Surprising we have seen a drop in New Mexico output this month.
Dennis
Yes I realize this won’t show up till the end of the year. Rigs are real time and this makes me wonder if the drop in rigs is due to a one time event in Texas, WTI price or fewer Tier 1 wells????
As for NM, I wasn’t surprised. Eddy’s drop overwhelmed Lea’s small increase in April. See attached Eddy chart which will be part of the next US update. The two month methodology is working fine for NM but not so much for Tx. More on that in the upcoming US update.
“Mergers and acquisitions in the U.S. shale oil and gas space could lead to a decline in production, industry executives said in the latest edition of the Dallas Fed Energy Survey.”
https://oilprice.com/Energy/Crude-Oil/Shale-Consolidation-Could-Reverse-Output-Growth-Trend.html
The current production is coming from oil wells fractured long ago when the frac spread was increasing?
Jean
In the above chart, the rigs data has been shifted forward by 8 months since I think that production should follow rigs provided only a few DUCs or preferably none are being used. That is a good assumption for the last year. We should expect a further drop in production for the next few months.
Production should then increase starting around July. The interesting question is “Will production get back to the February 811 kb/d level. I don’t think so because of the increasing legacy decline.
“It is difficult to understand how Texas is increasing production while dropping rigs and fracs.”
I often see this misunderstanding, which is annoying given the number of years you people (trademark Ross Perot) have been amateur analyzing this stuff.
1. AT a given level (say 5.5 MM bopd), there is a certain base decline and to offset it a certain number of new completions needed. (Yes, the base decline itself may vary over time and the new production per completion may change also. However, in near term, it is static…what matters is the number of new completions. The DPR sort of looks at things this way. Although they use rigs (not frac suites or completions), they are inherently looking at new oil versus base decline. The important realization then is that if we are ABOVE that level X for base replacement (i.e. in a growth regime), then a drop in rigs (or frac suites or completions) will not lead to a drop in production UNTIL the amount of new oil/month drops below base decline.
It’s as if I need the gas pedal at halfway, to maintain 60mph on the highway. If I floor it, I will start accelerating. If I then (rapidly and before major changes in my speed itself), move the pedal to 3/4 floored, I continue to speed up! This is because we are still in the growth regime. Similarly, if I had the pedal not depressed at all…at 60 and then pushed it down halfway, I would NOT stop decelerating. Since I’m still giving less gas than the equilibrium (half in this example) setpoint.
This is very clear if you have ever worked with control circuits or physics or differential equations. It’s something Enno would grasp intuitively. But I see hoi polloi confound themselves with it often (and from both sides of the aisle).
2. You’re looking at APR oil and recent frack count. although I grant you, it’s been trending down for a while. But still you can’t compare this weeks frack count with two month ago oil.
3. There is some slop, some play in the system. A jitter in fracs (or rigs or completions) won’t immediately show up in new oil. It’s like wiggling the rudder on an ocean liner, you need to wait for the response. It’s not a sports car.
4. There are still efficiencies, improvements growing in the system. Even if well productivity is not going up (although it went up for several years, like 2014-2019 when peakers said we were already used up all the good rock), the speed of completions and drilling has still been increasing. So a given spread does more (if it works faster).
ANONYMOUS
I will have charts in the next US update that will clarify why I raised the question regarding Texas production.
Make sure you give Ohio it’s street cred. 😉 😉 And what is going on with MT? Interesting.
Dennis,
I have a cool chart I want to post, but the site is just rejecting the post. Is there a known bug? Fixes?
I believe it has to be under 60kb in size. You can change the file size by using the resize button in microsoft paint.
Kdimitrov,
You have to reduce the size of the chart to less than 55 kB, sometimes saving file as gif or jpg will reduce size. I typically copy to a spreadsheet then adjust pixels to reduce size, usually jpg format works best.
Kdimitrov,
You can email the chart to peakoilbarrel at gee male dot com and I will post.
Looking at the 2024 Statistical Review.
https://www.energyinst.org/__data/assets/pdf_file/0006/1542714/EI_Stats_Review_2024.pdf
Bearing in mind that oil consumption grew and total liquids consumption grew by over 2 million barrels per day. Coal consumption grew by over 200 million tonnes and gas consumption grew.
Renewable energy grew by 5 billion Gw hours yet failed to reduce any of the above.
How many additional wind turbines would need to be built each year to start to reduce the amount of fossil fuels.
Let’s assume that hydro continues increasing at current rate for a few years until governments realise that the land flooded is too precious. We can assume that solar increases at the rates it has been.
If oil production peaks and starts falling by 1mb/d some people have calculated that 15 thousand 4Mw wind turbines would be required just to make up that shortfall.
As for electricity consumption
https://ourworldindata.org/grapher/per-capita-electricity-generation?tab=chart&country=USA~IND~CHN~AUS~OWID_WRL
Obviously electricity consumption would have to increase substantially in order to reduce coal and gas consumption also.
Nonfossil energy, whatever the source, will offset fossil fuel combustion only if civilization decides to use less energy. Or if fossil fuel become too expensive in relation to other energy.
And of course combustion will decline simply due to depletion…coming to your neighborhood soon.
Peak Global Combustion in just about 10 years.
Hickory
30 years too late
https://www.unep.org/resources/emissions-gap-report-2023
Tim,
Focus on crude plus condensate for liquids consumption, a good portion of NGL goes to the petrochemical industry to make plastic and other polymers (polyester etc) which are not necessarily a part of energy consumption, but become material products. There may be some energy emissions in these processes, but some of the carbon is bound up in the material output. the major proportion of energy from liquids fuel is in the crude plus condensate portion which gets refines into light and middle distillates and bunker/residual fuel. This accounts for about 88% of crude plus condensate with the rest as byproducts used in the refinery (petroleum coke and still gas) or other byproducts such as roal oil, asphalt, wax, lubricants and other products.
Chart for World consumption of light middle distillates plus fuel oil (aka bunker fuel).
From 2018 to 2023 the average annual increase was about 51 kb/d for the World. See Oil-Regional Consumption tab of Stat Rev of World Energy spreadsheet.
https://www.energyinst.org/__data/assets/excel_doc/0020/1540550/EI-Stats-Review-All-Data.xlsx
Over time as more BEVs and plugin hybrids replace ICEVs liquids use will peak and then decline.
Dennis
I really am not sure what point you are trying to make.
I was highlighting the massive increase in fossil fuel consumption despite a record growth in renewable energy.
My other point being oil consumption is still growing despite over 10 million electric vehicles sold last year. When Peak Oil occurs there will be even more pressure on electricity production. Something like 15 thousand additional wind turbines would need to be built each year just to power the growing electric car fleet.
You are not correct to say most Natural Gas Liquids go into chemicals.
https://en.wikipedia.org/wiki/Liquefied_petroleum_gas
https://documents1.worldbank.org/curated/en/707321494347176314/pdf/114846-REVISED-LW74-LJ-fin-logo-OKR.pdf
2.4 billion people rely on solid fuels for cooking and heating, the poisonous smoke kills many every year. The deforestation to produce the wood fuels and charcoal adding to droughts and soil erosion.
https://theconversation.com/why-indias-urban-poor-struggle-to-transition-to-clean-cooking-despite-grave-health-impacts-153266
So there has been a major drive in these countries to get everyone off solid fuels and to use LPG.
https://www.climatechangenews.com/2024/05/15/paris-summit-unlocks-cash-for-clean-cooking-in-africa-side-stepping-concerns-over-gas/
The demand is insatiable with over 2 billion potential customers and a population growing in these countries by 60 million each year.
This solution is the cheapest and even lpg is unaffordable for many. To even talk about solar power in countries where the average income is $3,000 per year shows an extreme level of ignorance.
Tim,
In the US ethane was about 61% of US NGL consumption in 2023, I found data for this ratio for the World ethane is only about 26% of World ethane and LPG output so you are correct that LPG is a significant portion (74%) of World ethane and LPG output (roughly 11 Mb/d), pretty much all of ethane output is used in the petrochemical industry (output from ethane inputs is converted to plastic, synthetic cloth, synthetic rubber and other such products). In 2023 World consumption of Ethane and LPG (butane and propane) was 14.7 Mb/d. Yes LPG is used for cooking and heating and is a substitute for natural gas in rural areas with no natural gas distribution network. Note that the total for the World, if roughly 74% of the ethane plus LPG is LPG total would be about 11 Mb/d for the World in 2023. Since 2018 World LPG and ethane consumption increased by 1000 kb/d or an average rate of 200 kb/d, using a 74% estimate for LPG, this would be about an 148 kb/d annual rate of increase for World LPG consumption from 2018 to 2023.
The main point is that for liquid transport fuels (LPG is a tiny part of transport fuel consumption in the World) growth has not been very large from 2018 to 2023.
Lets say in 2028 the plugin light duty vehicle fleet increases to 200 million vehicles in the World (from about 41 million at the end of 2023) and also assume the average vehicle travels 10 thousand miles each year and that average fuel economy is 35 miles per gallon. So 2 trillion miles traveled per year consuming 1.36 billion barrels of gasoline and diesel, if the vehicles had been ICEV rather than plugin hybrids. About 500 TWh of electricity production would be needed to replace this oil consumption as a typical EV uses only about 25% of the energy of an ICEV as the waste heat losses are so much lower in an EV. My expectation is that wind and solar output increase by 4500 TWh from 2023 to 2028, easily providing the needed power for expnasion of the plugin vehicle fleet and reducing oil use by 1.36 Gb (about a 5% reduction in transport fuel use from 2023 level).
It seemed your focus was mostly on oil consumption, from 2018 to 2023 fossil fuel consumption did indeed increase by 16 EJ while non-fossil energy consumption increased by 22 EJ.
Over time this is likely to get better.
For comparison from 2013 to 2018 fossil fuel consumption increased by 27 EJ while non-fossil fuel consumption increased by 17 EJ, it will take time to turn this ship around.
Income will increase in less developed nations and distributed solar is a way to bring electricity for basic lighting to the poor. These can be community projects where people pool their resources.
Consider
https://www.weforum.org/agenda/2022/07/renewables-are-the-key-to-green-secure-affordable-energy/
One interesting stat from the report was that coal exports from Mongolia increased by 116.8 percent last year; surely all this went to China.
Hi Dennis
I never mentioned LPG in transport, I was trying to point out how much LPG is used for heating and cooking and 2 billion people are in desperate need of it. Its consumption will increase as wages increase just as has happened mainly in China and increasingly in India.
Sorry your jumping from Ej to Twh to gallons is impossible to follow.
If your expectations are in the ball park and wind and solar do increase by 4500 Twh by 2028 then that would be enough for all those cars and to reduce coal consumption by a little.
It really all depends on the continuing growth of demand for electricity and oil decline rates.
How much will the 3 billion people who hardly use any be using as they get richer.
Tim…..
Dennis confuses himself with those changes. For instance the claimed 22Ej increase in non fossil fuel energy from 2018-2023 comes in a 6,111TWh.
Total world solar and wind output combined, not just increase, comes in at 4,121Twh.
Nuclear and hydro are both less in 2023 than 2018, so where these bullshit numbers come from is interesting. Besides by changing units all the time instead of using just TWh, when talking about energy on a world wide scale, it’s easier to hide mistakes.
Simple reality, fossil fuels use have increased by over 38,000Twh in the 20 years 2003-2023, TOTAL solar and wind production are 4,121Twh.
Only the long term counts as it can take years to build and supply the equipment in the factories and mines and smelters that need to be up and running to produce all the solar panels, wind turbines, copper wires, inverters, concrete for foundations, new roads etc, etc, etc. This is all built with fossil fuels.
All proponents of renewables don’t want to count any of energy spent in all the background system to enable the building of industrial scale renewables production, yet it is a real energy spend.
Our ‘effort’ to go EVs, renewables etc has come at a cost of 38,000TWh more use of fossil fuels while we have an output of only 4,121Twh from all the solar and wind built.
Fossil fuel use will continue to rise until it can’t, because you are correct about the billions of people wanting a better lifestyle. When fossil fuel production goes into decline, so will new solar and wind production, through a combination of higher input costs building them, less investment dollars available and older equipment ageing and failing, long before the planned ‘life’. Entropy is particularly bad on machines exposed to the elements 100% of the time..
Hideaway,
See EI Statistical review of World Energy 2024.
https://www.energyinst.org/__data/assets/excel_doc/0020/1540550/EI-Stats-Review-All-Data.xlsx
Fossil fuel consumption in 2018 was 488.5 EJ (for all uses, not only electicity generation) and in 2023 it was 504.8 EJ, for non-fossil fuel consumption in 2018 EI reports 93 EJ and in 2023 was 114.8 EJ.
If you want to look at electricity generation only from 2018 to 2023 fossil fuel electricity generation increased by 763 TWh (1.1%/year) and non-fossil fuel electricity generation increased by 2378 TWh (4.4%/year), wind and solar power output combined increased by 2122 TWh from 2018 to 2023(15.5%/year).
Much of the 38412 TWh of fossil fuel energy increase from 2003 to 2023 is simply waste heat (approximately 40%).
The fact is over the more recent period (2013 to 2023) a significant part of the increase in the World’s use of exergy (excludes waste heat) was from non-fossil fuel (about 41% of the total). For comparison, from 2003 to 2013 only about 11.7% of the increase in World Exergy consumption came from non-fossil fuel. This trend of a significantly higher proportion of Exergy consumption from non-fossil fuels is likely to continue as oil use gets replaced with electric power for land transport and as wind and solar power replace coal and natural gas for electricity output.
Dennis, non fossil fuel energy at 114.8Ej is around 31,887TWh of energy, yet solar and wind are a tiny proportion of this 4,121TWh…. Nuclear and hydro have both gone backwards since 2018, now about 7,135TWh, so what’s making up all this non fossil fuel energy, or have you (they) used the abomination of multiplying up non fossil fuels by a factor of 2.5 to account for ‘waste heat’ while they never account for ‘products’ that would need to be made in a fossil fuel free world, nor any allowance for energy storage costs.
If so you taking off waste heat again, is just ridiculous accounting of energy. The substitution method gives a totally false impression of how useful man made electricity machines are, as the numbers used give an irrelevant weighting to the importance of products plus diesel and fuel oil used in heavy equipment and long distance transport.
The numbers are clearly wrong when using a common energy measure like TWh if you are paying attention.
The simple reality is there is no transition, renewables have been added on top of more fossil fuel use in the last 20 years, while only 15%-20% of humans have enjoyed the benefits of modernity.
Rapid decarbonization is just not possible while we use fossil fuels to do the mining and building of renewables, EVs and batteries on an ever increasing scale. Every expansion means MORE fossil fuels are needed to do it. Every new silicon production factory runs on coke for the heat. Every new glass plant uses gas to heat the glass. Every new Aluminium smelter uses 400kg of petcoke per tonne of new aluminium produced. Of course this type of list is endless, but somehow you think using MORE fossil fuels is an answer to using less fossil fuels.
No-one is trying to build, operate and run any of these new mines, processing plants or factories on just electricity and products produced by electricity, because it’s not physically possible!!
Do the calculations for a change to learn for yourself that it’s not possible!!
Like I stated, you have confused yourself with all the changes in accounting for energy, use the accepted one for electricity that you want the world to go to, TWh, as the errors will be quickly apparent.
Hideaway,
No not confused at all, the conversion of electricity to the equivalent fossil fuel input of energy to an electric power plant is standard practice.
Just because 100% of energy use is not currently from non-fossil fuel does not mean that it is impossible. The easiest things that can be converted to electric power will be done first, then we will move on to other things.
Paper on energy use by mining industry and future scenarios.
https://www.sciencedirect.com/science/article/pii/S0959378023001115
Dennis … “Just because 100% of energy use is not currently from non-fossil fuel does not mean that it is impossible”
It is impossible if you want a modern civilization and an environment that humans can survive and grow food in, plus a bit of the natural world still existing..
When reading some of these so called scientific papers and their references, you can find beauties like admittance that mines are becoming more remote on average, but assumptions on energy use that the mines are connected to the grid.
Or other gems like the fuel used in jets to fly workers to remote mines on a FIFO (Fly In Fly Out) takes zero fuel. Apparently getting workers to the mines is not an energy cost, neither is housing those workers or their training, nor the buildings and processing plants nor the trucks and excavators. They are all free of any energy use in their construction and maintenance, the only energy is the electricity used to operate them.
Again an assumption seems to be only counting the ore movements, crushing grinding then processing, yet EVERY mine needs to blast and remove waste rock, taken to a waste dump. According to these types of studies this waste just magics out of the pit, because there is again ZERO energy used when working out the energy intensity numbers.. The waste rock removal is often multiple times the size and weight of the ore.
Again GIGO that sets parameters to come up with nice viable numbers that look good, instead of looking at reality. Hence they were able to come up with an energy use of mining of and I quote …” Such share has increased from around 1.1% in 1970 to around 1.7% in 2015″.
Some other quotes of assumptions made…
“we assumed electricity to be from national grids”
“Only ongoing operations are included. Exploration and development are not taken into account, nor is the infrastructure (facilities, trucks, etc.) as they are assumed to be negligible compared to the operation of the mine. Further, it is assumed, that the whole process chain takes place nearby. Therefore, no transport of intermediate products was included.”
Mining uses so little energy that it is obviously no concern whatsoever if you believe such garbage, which you must, as you directed me to it…
They did get one bit correct, obviously well hidden in the document, not in the headlines…”For minerals affected by mineral depletion, energy intensities are likely to carry on increasing”.
In their conclusion, after leaving out most of the energy used in mining, they state…
“We find that the mining industry is currently responsible for a small, and yet significant, share of global final energy consumption – approximatively 1.7%. However, such a share is likely to increase considerably in the future as a result of a substantial increase in the mining industry’s final energy consumption if current trends continue (i.e. high economic growth alongside a high material-GDP coupling), until reaching a value in the range 4–12% of forecasted global final energy consumption for the socioeconomic scenarios adopted in this study.”
If they had included all energy used in mining, not their boundary assumptions, the initial and final numbers would be multiples of what they concluded.
It’s because of this type of garbage, that people like yourself believe in it, is why the world is in so much trouble, hidden in plain site, because you refuse to do the calculations yourself from information gathered in real world examples..
If you include stupid boundaries that have no relationship to the real world, of course a paper will get the ‘correct answer’, that makes materials an non issue. It’s no different to all the EROEI type studies on renewables you point to.
At least they did acknowledge this, which is why we always need to do mining ….
” Indeed, some metals are consumed in multiple dispersive uses (Vidal et al., 2021), for which recycling is either altogether impossible, or is currently not achievable, and are hence “lost by design” (Ciacci et al., 2015).13″
Tim,
Perhaps this is easier to follow, 200 million vehicles driving 10,000 miles, thats 2E8 times 1E4=2E12 which is 2 trillion miles. If the average fuel efficiency is 35 MPG then we have 2E12/35=5.7E10 gallons of fuel used, divide by 42 to get barrels which is 1.36 billion barrels, divide by 365 to get 3.7 Mb/d of fuel used by 200 million ICEV.
Now switch to BEV which gets 4 miles per kWh (Tesla Model 3 over 78k miles average), so for 2 trillion miles (200 million BEV@10k/year each) that is 500 billion kWh=2000 billion miles/4 kWh per mile=500 TWh. The current light duty fleet is about 1400 million (about 1350 million are not plugin vehicles). So for entire fleet would be 7 times 200 million so 3500 TWh of electricity would be needed for entire fleet (we don’t reach that point until 2048 or so). By 2035 I expect about 26000 TWh of electricity output from wind and solar with another 8000 TWh from other non-fossil fuel for a total of 34000 TWh (about 85% of all electric power output). I assume electric power output grows at the rate of the past 5 years (2.36% per year).
Note also that if self driving vehicles allow future robotaxis the transition happens much faster as each EV might travel 50k per year rather than 10k per year as I have assumed so only one fifth of the vehicles would be needed so 280 million vehicles to replace 1400 million and by 2030 the entire ICEV light duty fleet could be replaced eliminating roughly 25 Mb/d of gasoline demand. As far as coal consumption for electricity that is correct that coal output would not be reduced much by 2028 (only about 970 TWh of coal power plant reduction by that time). By 2035 all coal power output could be replaced by non-fossil fuel output and by 2037 all fossil fuel electric power output could be eliminated.
Dennis
Theoretically your numbers add up.
In practice because solar produces nothing for up to 14 hours per day and wind can produce as little as 5% of installed capacity for days very large hurdles exist.
Germany installed capacity is 250% its peak consumption and renewables is half of that. That represents huge costs in terms of build costs and maintenance.
A Tesla home power is one thing. I simply can’t see any country like Germany or India having batteries to power entire cities it is impossible.
Tim,
When solar and wind capacity are widely dispersed and highly interconnected on a continent there are very few periods when backup is needed. Excess capacity always exists in an electricity grid, for fossil fuel generation in the US about 2.5 times capacity over average net generation exists. Typically 3 to 5 times average load is what is needed for wind and solar capacity, backup can be synthetc natural gas or hydrogen burned in backup power plants, pumped hydro or hydro, nuclear power, or batteries, vehicle to grid is also possible as is demand pricing to reduce demand when there is a shortage.
See https://www.rethinkx.com/energy/in-depth/super-power
Dennis
What is that gimmick.
I am talking about reality today. You constantly talk about some cornucopian future that does not exist. Large scale hydrogen does not exist and experts predict it will not for another 20 years. Synthetic gas does not exist.
Europe is interconnected and has large amounts of hydro and nuclear power but half the electricity comes from burning coal and gas. As you can see several days where wind and solar are producing 10% their installed capacity. What do you do once all the pumped storage and batteries are used up in the first night and solar is producing 10% of demand.
https://www.energy-charts.info/charts/power/chart.htm?c=DE&week=10
When it’s night time in Germany it is night time in every other European country. High pressure systems like this one happen many times in a year.
https://www.weatherandradar.co.uk/weather-news/elongated-summer-omega-weather-pattern-grips-europe–372e707a-9d98-4b9f-a69d-179663caae03
The result are days of little wind and obviously no solar at night, during winter a high pressure system is even worse.
Tim,
Yes currently there is very little hydrogen and synthetic natural gas produced using non-fossil energy, this is something that could be done using excess power produced when more wind and solar power are produced than can be utilized.
We do things today that were not done in the past, air and space travel, video conferencing, communication over the internet such as in this forum are but a few examples. An assumption that there will be no further technological progress in the future seems a poor one.
Found this webpage on Europe and wind
https://energypost.eu/climate-change-wind-droughts-and-the-implications-for-wind-energy/
Our ability to model future changes is likely to improve with more research. Perhaps solar with battery backup and pumped hydro, hydro, nuclear and natural gas when absolutely necessary (perhaps with CCS) with some wind (both land and offshore) would work well. It will be 10 to 15 years before the world approaches 100% non-fossil fuel we will learn by doing.
The future does not exist, that is true by definition, so I cannot talk about a future that exists, I use past trends to guess at what might exist in the future. You can assume the future will be just like the past if you like, or create any future you think is plausible. Nobody knows.
The relevant chart is for all of Europe, not a single nation
https://www.energy-charts.info/charts/power/chart.htm?c=ALL&week=10&source=total&l=en
Dennis
In your first paragraph in this last statement you did what you seem to always do, absolutely no mention of the ultimate cost of the energy to the consumer. I dare say that it matters allot. Most states in the US by their laws have to have a balanced budget so the millions handed out for wind and solar power must be sourced from higher taxes or some service to its citizens can’t be performed. Either way nothing is free.
Ervin,
This will be cheaper than continuing to use fossil fuel, the subsidies allow the transition to occur more rapidly and reduce the amount of wasted investment in fossil fuel electrical generation which will become stranded assets as costs for wind, solar, and batteries continues to fall.
You can imagine it is more expensive, but in the US Texas and Iowa, with very high amounts of their net generation from wind power have among the lowest electricity prices of any state.
Dennis
I never said the future would be the same as the past. I just don’t have your utterly unrealistic view of how humans will get out of this dreadful mess.
The first coal fired power station was built in 1882
https://en.wikipedia.org/wiki/Pearl_Street_Station
China and India this year are currently building over 100. So much for rapid progress.
Dennis, I constantly ask you to provide some numbers to show how any of this is possible on a world wide scale, yet you refuse to try and work it out, using existing known methods and efficiencies.
Is it because without using magical future cheaper costs and efficiencies for all of it, it’s clearly not possible??
If it’s only for the 0.1% of the super rich it’s possible to do the calculations showing it’s possible. However in reality the 99.9% will not be standing for the rich living well while everyone else is in abject poverty. Plus the minor detail that the complexity of it all only applies if it’s across humanity, as we need huge numbers for complexity to work. Then working it out for huge numbers clearly wont work as we don’t have the fossil fuels to do all the mining, processing, manufacturing and transport.
Dennis ….. “It will be 10 to 15 years before the world approaches 100% non-fossil fuel”
The world will not be 100% non fossil fuel energy in that time period, unless we’ve had total collapse and can’t get access to any of the remainder. Modern civilization runs of fossil fuels for energy and products, we get BOTH from every barrel of oil and cubic metre of gas, plus lots of both from coal.
The entire renewable industry runs on fossil fuels, with zero attempt to get off them.
Even IEA forecasts have us using vast quantities of fossil fuels in 10-15 years time.
It’s trying to go to totally unaffordable and totally non sensical future, that guarantees we have a fast collapse of civilization when we hit real decline in oil production at an accelerating rate year after year, and nothing can keep up with the feedback loops that develop from the massive contraction in available energy.
Hideaway,
Using current costs is a mistake to predict what is possible in the future, just look at recent history for solar and battery costs. Just because something is not a reality today does not mean that it cannot become reality tomorrow.
Many technological disruptions have occurred in the past and many are occurring today, these can have profound effects which you seem to dismiss.
Dennis, I did look at recent history of solar and battery costs, with both going up in 2021-2022 when oil prices rose as noted by the IEA. This means we have reached the savings from economies of scale and input costs are tending to dictate prices.
There are solar panels, and there are solar panels, the cheap junk will only give you trouble if purchased, while the quality brands are not becoming cheaper, I know because I’ve been looking for bargains on quality panels. They are no cheaper than last year. I’m hoping the new tariffs imposed by the US might make quality a bit cheaper here, but so far no luck.
What you read and refer to in reports are often very different to reality on the ground. The largest solar farm in Australia cost $A1.3B for 720MW and is still under construction. That’s a ‘built’ price well in excess of the often quoted ‘cheapness’ per watt of solar.
Dennis,
I am sorry if you feel that I am ganging up with Hideaway, Tim, and Ervin but your arguments simply do not stand scrutiny.You keep pointing out to falling costs of electricity and EV sales taking off, but neither are true now and probably never will be in the future. The falling costs curve will be an asymptote, much like a well depletion curve. How low can PV and Wind costs fall. Installation costs are set to go one way only -UP.
Time and again you repeat the same old story of of moving “surplus” power from across great distances, such as Across the US, and inter EU. Have you ever considered what is possible. The UK has many inter-connectors with Ireland, France, Belgium, Netherlands , Norway. All are about 1GW capacity. To make up for a dull, windless, winter’s day the EU would need would over 30 GW of connectors. Not withstanding all of the countries mentioned would have a similar issue. That means a huge number of inter-connectors connecting to where? The east , the south? All area of instability, and the cost unimaginable. The best bit is any such system would spend much of its time under utilized and will be burning money. Guess who will pay- you and I.
The you roll out the idea of hydrogen and synthetic gas. You need to get a grip of the real world that I live in, not your academic world of fantasy. Electrolysis to produce hydrogen remain a pipe dream. 52kWh to produce 38 kWh of hydrogen at HHV. That is before compression ans storage; the later being a major challenge and eye watering cost. No one to data has tried storing hydrogen in a salt dome. Then you propose burning the hydrogen in a CCGT. Doable but dumb.Then there is the synthetic gas . I like that . Would you care to enlighten me on where this process has been used. There has been a lot of talk but no-one has built a scaled up plant. The carbon source will of course be DAC of carbon dioxide. good luck with that.If carbon dioxide climbed to 800 ppm it still would not work but the grass will grow quicker.
So who is going to build your interconnected grid and all these back-ups that will be under utilized. How will it be funded? What about the electrical engineers – there will be a huge demand. What about all the resources. Just did up more low grade metals and maybe build a large number of ACN plants to make the carbon fibre you are so fond of.
I really applaud your optimism but sitting in a University is a long way from reality.
Carnot,
There are many things that have been done that an engineer 50 years ago would say are not feasible, this fact reflects the lack of imagination of some engineers.
Is this reality (peak conventional 5 years ago)?
Kengeo,
Here is World C plus C minus LTO and extra heavy oil (oil sands from Canada and Venezuela) from 2010 to 2023 in millions of barrels per day. There is no reason why a quadratic function should fit this data.
71.60
71.66
72.24
71.26
71.81
73.23
73.59
72.97
72.89
70.71
65.48
66.19
69.03
69.17
It fits quite well, actually:
Looking at 2016 to 2023:
R2s range from 0.9877 for 2nd order Polynomial to 0.9989 for 5th order Polynomial after smoothing for covid.
If not smoothed, then 0.68 for 2nd order, 0.825 for 3rd, 0.86 for 4th, and 0.98 for 5th…
And here’s why:
Complexity of Trends: Multiple influencing factors (technological, geopolitical, economic) create complex, non-linear trends.
Capturing Curvature: Non-linear decline patterns and inflection points require the flexibility of higher-order polynomials.
Better Fit to Historical Data: Improved accuracy and higher R² values indicate that these models explain more of the variance in historical data.
Modeling Real-World Phenomena: Reflects the dynamics of resource depletion and shifts due to technological and economic changes.
Flexibility: Adapts to data variability and noise, smoothing out short-term fluctuations while capturing overall trends.
Dropping 2.5% annually.
R^2 (Cubic) for reserve decline is 0.999
R^2 (Cubic) for production decline is 0.939
It’s extremely likely that conventional peak oil production occurred in 2019.
Now, if we look again at the top 27 oil producing countries, subtract the amount of oil they consume, then we see that current (excluding tight oil) oil exports from this group are at 1980’s levels…
Peak exports from the top 27 were in 1998…
An updated US April Oil Production report has been posted.
https://peakoilbarrel.com/us-april-oil-production-rose-again/
A new Open Thread Non-Petroleum has been posted.
https://peakoilbarrel.com/open-thread-non-petroleum-july-4-2024/