The EIA STEO was published recently the estimate below is based on data from that report and statistics from the EIA International Energy Statistics. The EIA expects the 2018 peak for annual average World C+C output will be surpassed in 2025.
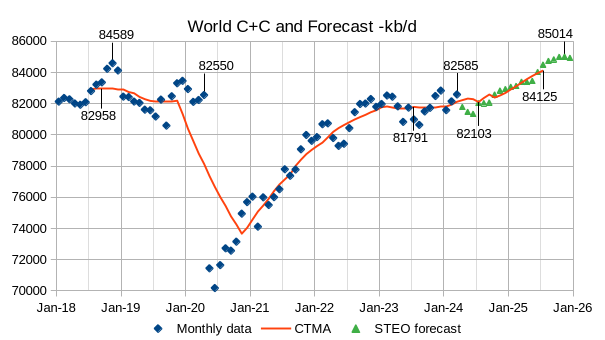
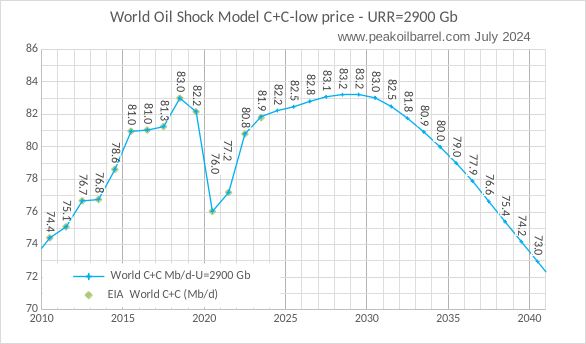
My shock model estimate for average World C + C in 2025 is 82.5 Mb/d with a new World peak 2028 or 2029 at 83.2 Mb/d, the EIA STEO expects World average C + C output will reach 84.1 Mb/d in 2025, which seems optimistic in my view.
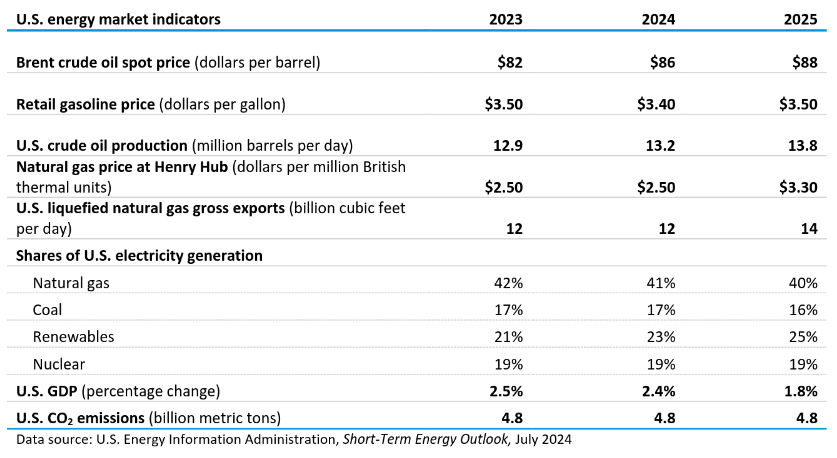
The EIA has revised the 2024 oil price forecast from $84/b last month to $86/b this month and the 2025 oil price forecast from $85/b last month to $88/b for the July report. The Natural gas price forecast for 2025 was also revised from $3.20/MCF last month to $3.30/MCF for the current report.
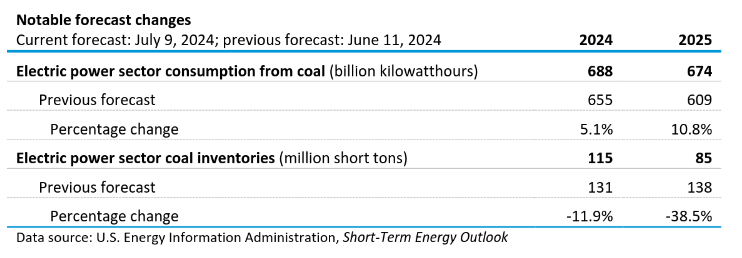
Higher natural gas prices lead to more electric power output from coal power plants in this month’s forecast.
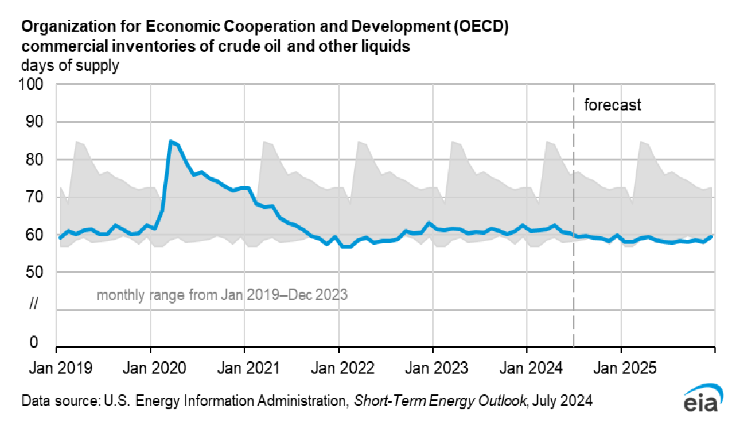
OECD commercial petroleum stocks are forecast to be near the bottom of the 5 year average in 2024 and 2025.
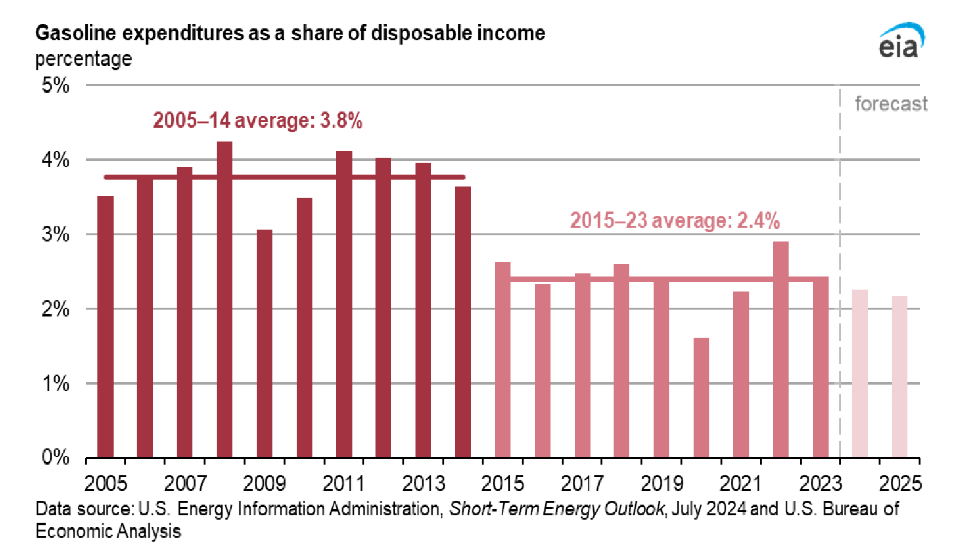
US gasoline expenditures as a percentage of GDP are expected to decline in 2024 and 2025 to slightly below the 2015 to 2023 average.
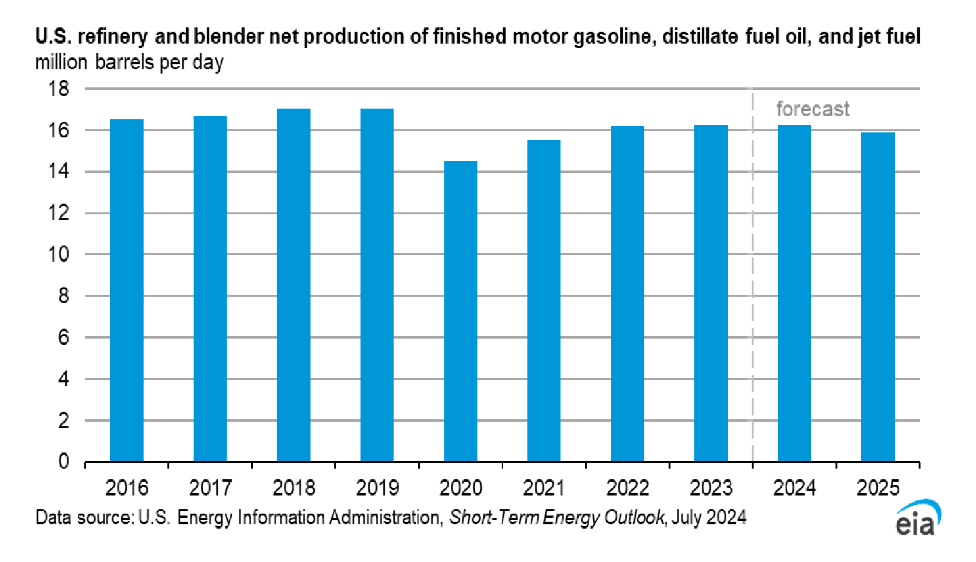
US production of the three main transport fuels is expected to be flat in 2024 and down slightly in 2025.
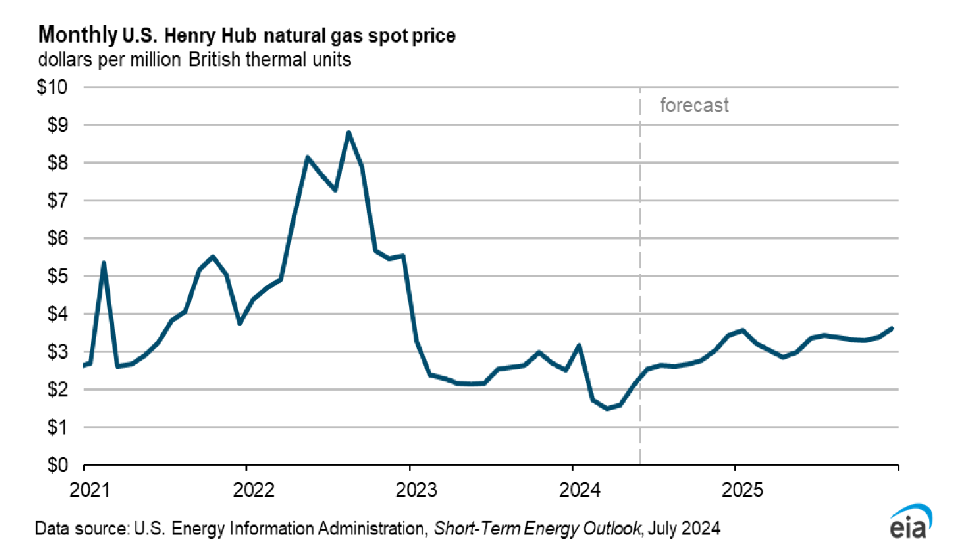
Natural gas prices are expected to rise in 2024 and 2025.

Comparing the second half of 2023 with the second half of 2024, natural gas power output is expected to decrease by 2% while coal power output increases by 3%. For wind 2H2024 is 6% higher than 2H2023 and for solar the increase is expected to be 42%.
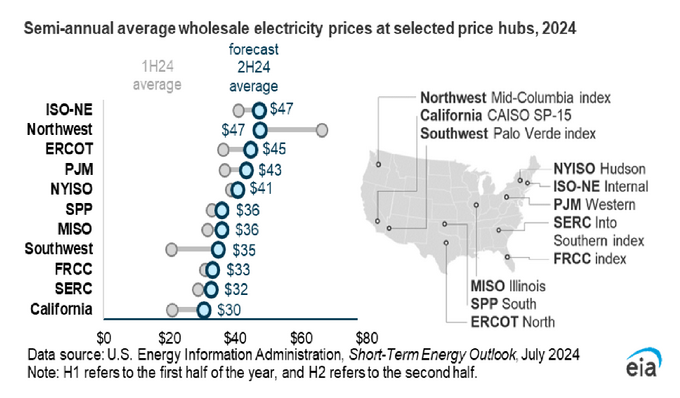
Note the low prices in California with highest prices in New England and the Northwest, also a bit surprising that Texas (ERCOT) prices are third highest for 2H24.
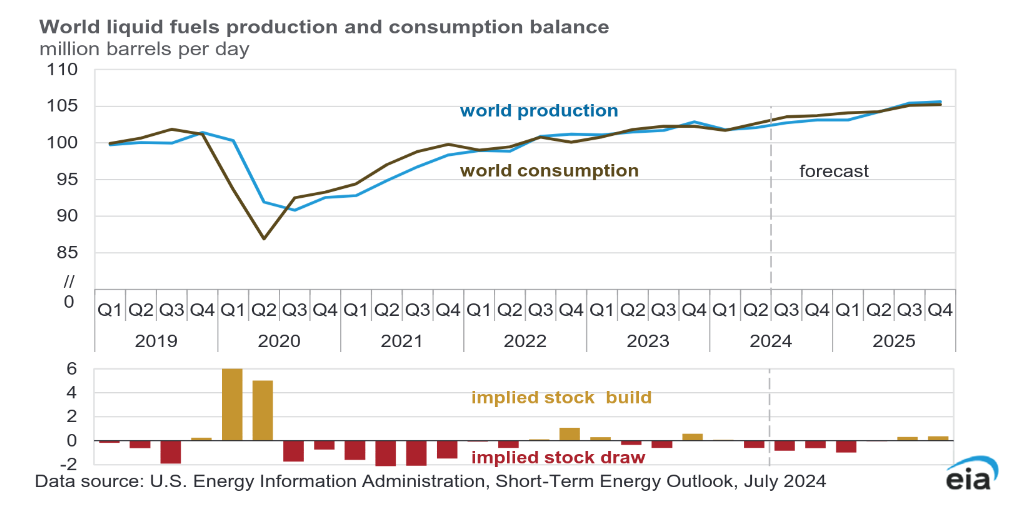
The EIA expects a World stock draw in 2024 and early 2025 and a small stock build in 2H25.
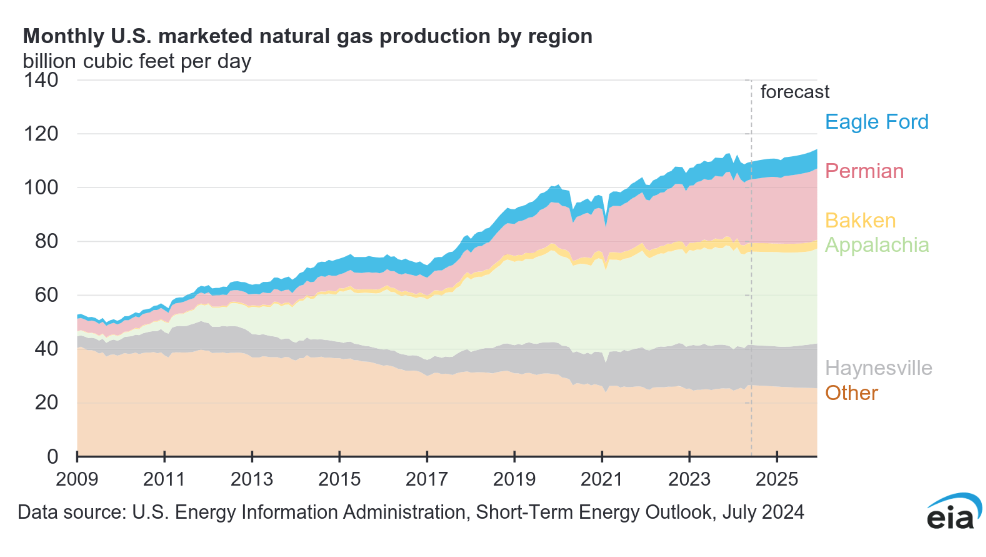
The EIA forecasts natural gas output to return to near the 2023 peak in 2025 with much of the increase coming from the Permian basin.
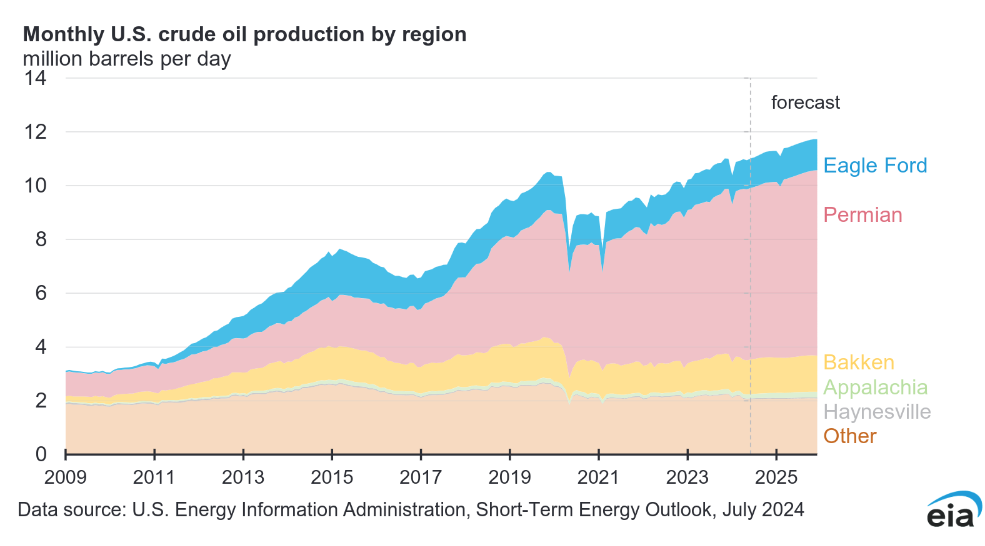
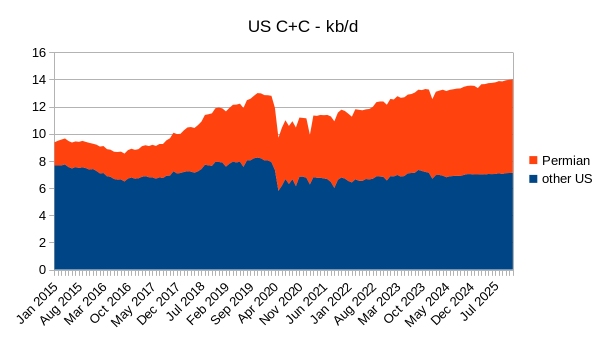
Most of the increase in US C+C output has come from the Permian region since 2021, the forecast from the STEO starts in May 2024.
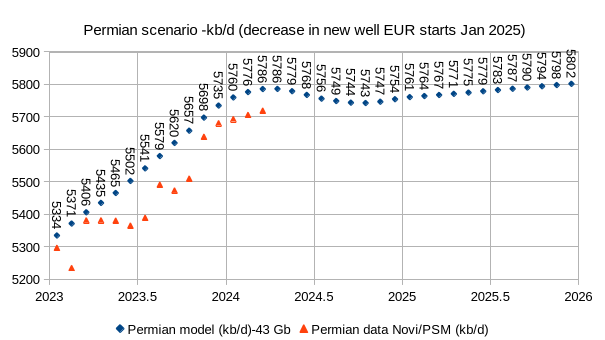
The Permian model above uses horizontal rig count moved 8 months forward (accounting for delay between spud and first flow) and assumes completions are equal to wells drilled (no change in DUC inventory level), it is also assumed that about 1.4 wells per rig are drilled each month. The horizontal rig count is assumed to remain at the current level for the next 10 months for this scenario and new well EUR is assumed to start decreasing in January 2025.
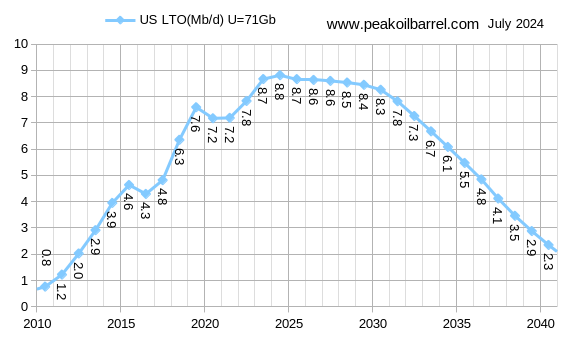
The scenario above makes similar assumptions in other tight oil basins as were made for the Permian scenario. STEO data for wells drilled per rig was used and future horizontal oil rig levels were assumed to remain at current levels until December 2029, after that it is assumed that the fig count decreases. This scenario is used in the Oil Shock Model presented near the top of the post.
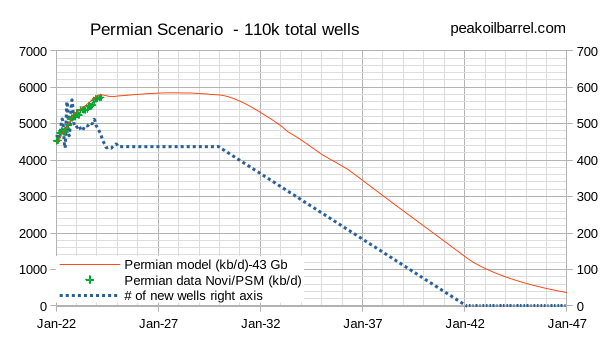
A longer term look at the Permian basin tight oil scenario with 110 thousand total wells drilled (about 49 thousand tight oil wells have been drilled to date in the Permian Basin). The URR for this scenario is about 43 Gb (similar to the USGS F95 TRR estimate for the Permian Basin).
111 responses to “Short Term Energy Outlook, July 2024”
Thanks Dennis. Are the semi-annual average electricity wholesale prices in $/MWh? So we can divide by 10 to get the price in c/kWh (I’m assuming retail electricity customers in the US are billed using c/kWh like we are in Australia?). In which case, highest average price is 4.7 c/kWh.
I know the different units for wholesale prices and retail prices are different because of the different scale between a wholesaler and a retail customer, but I sometimes wonder if the industry doesn’t mind making it harder for the average person to see the difference between wholesale and retail.
Phil S,
Yes the units are $/MWh, so divide by 10 to convert to cents per kWh. Residential rates are higher, but the ratio of residential to wholesale rates varies from region to region.
At link below are rates for all sectors and residential for various regions of US, the average residential rate was 16.7 cents per kWh with a range from 13 to 35 cents per kWh in different regions in March 2024.
https://www.eia.gov/electricity/data/browser/#/topic/7?agg=0,1&geo=vvg&endsec=o&freq=M&start=200101&end=202403&ctype=linechart<ype=pin&rtype=s&pin=&rse=0&maptype=0
Those wholesale electricity prices don’t jive at all with average end user rates (industrial, residential, commercial),
which are very well detailed in the following chart showing the state/sector breakdowns in the US.
https://www.eia.gov/electricity/monthly/epm_table_grapher.php?t=epmt_5_6_a
The US average user price blended (all consumption sectors) for May 2024 for example is 12.6 cents/kWh
I don’t know what use is the wholesale hub price that the chart in the posting relates to.
Hickory,
The Wholesale price is the price that electricity suppliers receive for their output.
See https://www.eia.gov/outlooks/steo/data.php
table 7a at page above gives this data.
This is different from the price for ultimate consumers which includes transmission and distribution costs.
Those numbers are in table 7c at page linked above.
Ah, thanks Dennis.
Wholesale utility pricing also includes a whole host of very long contract items like hydro plants, nuclear plants, grid infrastructure, labor contracts, etc.
Thank you Dennis.
I had recently asked for your thoughts on expected EV adoption impacts on demand reduction. I’ve been looking at other forecasts as well and thought it might be interesting to see how these start to layer on top of production capacity forecasts. For what it’s worth, let’s look at the IEA 2024 Global EV Outlook. They estimate 6 Mb/d in avoided demand in 2030 and 10 Mb/d in avoided demand in 2035. If I’ve got the image posting correct, you can see what that might look like if we just directly added that much production directly on top of your forecast. A flat 89 Mb/d from 2030 to 2035.
I’m sure the majority on this site are familiar with all of the challenges with electricity production ramp up, grid capacity, EV materials, etc. However, the trend in recent years going from 4% global EV sales in 2020 to 14% in 2023, and recent plummeting in battery prices does suggest the potential is there in manufacture and sales of the light duty fleet itself.
Hope is not a plan. I get it. However, it’s hard not to look at this and hope that there is the potential to avoid some of the more significant possible near term disruptions from a peak in oil production.
THill,
This is my expectation for future supply (no EV transition) and demand with a transition of both light duty and heavy duty ICEV to plugin land transport. Heavy duty plugin transition is assumed to lag the light duty vehicle transition by 10 years in this scenario. By 2031 demand for C plus C falls below supply in this scenario (the supply scenario matches the Oil shick scenario presented in the post. Vertical axis scale is millions of barrels of C plus C per day.
Note also that I expect supply will adjust downward to the level of demand from the supply scenario presented due to falling oil prices and lack of investment in new oil wells. Tight oil well development may decrease much more quickly than in my supply forecast if oil prices fall and many Arctic and deepwater offshore developments may no longer be profitable and may be shelved after 2032.
Thanks Dennis, much appreciated.
Your forecast for demand settles on a floor around 25 Mb/d. I understand the general limitations of models and am not asking about the magnitude of this floor. However, I am curious about the factors in your model which create such a floor. Are there some meaningful drivers of this or is that just too far out to even talk about?
THill,
Drop in demand is mainly land transport demand for oil. I have assumed other crude oil demand for air transport and water transport remain flat at the 2025 level in this scenario. It is possible these other sources of demand might be replaced with other sources of energy. Also I have assumed autonomous vehicles never become a reality, if this is incorrect the demand for oil from land transport could decrease far more quickly than my model predicts.
Also forecasts beyond 2035 are certain to be inaccurate so a better chart would stop in 2040.
One more try with the image(?)
One thing that has become apparent is that global mileage driven is unlikely to be limited by gasoline supply over the next ten years, barring geopolitical disruption of oil production/trade/refining.
The global EV manufacturing sector is now mature and diverse enough to fill the real or perceived downsides of ICE light transport that develops, whether due to depletion pricing or actual liquids shortage.
Its damn crowded out there in much of the worlds skies and on the roads, and hot.
Hey Hickory. I’m coming around to thinking that the oil supply and EV manufacturing (barring your caveats) won’t be on the short term of critical path to maintaining the current paradigm of personal car mobility.
I’m less clear that electricity production and transmission won’t impose larger constraints on demand depending on where you are in the world. Still need to dig into the bigger picture in these areas.
I’ll offer a few anecdotal stories that may have some interest.
THE local dairy farm (NE US) has grown from 0 to 10,000 head milked from 1992 to now. While the scale up wasn’t linear, it also wasn’t overnight. However, my understanding is that this operation runs significant diesel generation support 24/7 because they cannot economically get enough grid transmission.
Second is a recent discussion with the head of a statewide contractors association representing both vertical and horizontal sides of the business. Materials demand for concrete remains strong enough that industry is continuing to struggle in some areas with scheduling adequate deliveries from regular producers. Rep pointed in particular to new transmission line buildout for renewables as localized cause. Last piece is related with a specific project example. Planned 300 plus MW wind development will build local batch plant to supply 600 CY placements for each tower. Aggregate supply anticipated as adequate, but ready mix not.
In Germany dairy (and pig) farms generate electricity with the own gas they get from manure. You see the big round gas collection domes all over the satellite images.
Also farmers are heavy users of solar, thanks to their large slanted roofs.
https://www.google.com/maps/@49.8689301,10.0547059,619m/data=!3m1!1e3?entry=ttu
I wonder about the annual miles driven in the US as the price of vehicles has gone up faster than inflation and decades of undertaxed gasoline begs for readjustment.
“Data centers could consume 9% of the United States’ electricity generation by 2030 — double the amount consumed today, according to a study released Wednesday by the Electric Power Research Institute.”
https://www.utilitydive.com/news/artificial-intelligence-doubles-data-center-demand-2030-EPRI/717467/
Watch out…these estimates are growing every time you turnaround. This sector is throwing lots of money at the attempt to ramp up the nuclear power industry, which has a very long ramp up time.
Something is going to break soon. This almost exponential increase in stupid AI/crypto shit gobbling compute and therefore electricity, is going to either lead to a mass move to nuclear (lol) or people having usage curtailed to help capital.
Trump has mentioned Bitcoin and the US being a leader in it, whatever that means. So, for that alone, fuck that guy. But I don’t see Kamala telling Big Tech to either fund or shut up about trying to raise their machine gods on what should be excess capacity to deal with moving off gasoline and other FFs for transport and heat etc.
I’m a big fan of nuclear. Pickering in Ontario has 4x540Mw reactors, for a total of about 2Gw.
I now read that China is installing 5Gw of solar every week.
https://www.abc.net.au/news/science/2024-07-16/chinas-renewable-energy-boom-breaks-records/104086640#:~:text=A%20report%20by%20Sydney-based%20think%20tank%20Climate%20Energy,of%20wind%20and%20solar%20generation%20capacity%20every%20fortnight.
I think nuclear is being left behind. If it does revive, it will be because China is also pushing that.
Silicon Valley is a big fan of nuclear too, including fusion. But realistically, it’s hard to see the industry doing anything but shrinking between now and 2050. It’s running almost entirely on 1970s infrastructure now, and investment is very low.
In the US nuclear electricity production could pick up a little by about 2040, if a real hard push started soon which seems unlikely. Its very expensive to build…hard to find creditors and insurers and laborer’s. It also probably bears repeating every day…the US does not have high level radioactive waste storage. Its only been on the drawing board 79 years.
If you really want to know whats going on with the nuclear industry…have at it-
World Nuclear Industry Status Report- 2023
https://www.worldnuclearreport.org/IMG/pdf/wnisr2023-v5.pdf
Geothermal might give it a run for the money…literally the money, and labor.
But if there’s motivation…..
France installed 56 reactors over the 15 year period from 1974-1989.
From the global report-
“Over the two decades 2003–2022, there were 99 startups and 105 closures. Of these, 49 startups were in China which did not close any reactors. As a result, outside China, there has been a drastic net decline by 55 units over the same period, and net capacity declined by over 24 GW.”
And the global fleet is aging-
“The average age (from grid connection) of operating nuclear power plants has been
increasing since 1984 and stands at 31.4 years as of mid-2023, up from 31 years in mid-2022.”
Motivation thus far is not up to the task-
“..overall, an additional 88 new reactors (66.5 GW)—almost one unit or 0.7 GW per month—would have to start up or restart to replace closures. This would
necessitate almost doubling the annual startup rate of the past decade from six to eleven over the remaining period to 2030 just to maintain the current number of reactors in the world. Considering the long lead times, this appears to be a highly unrealistic scenario.”
Governor Tim Walz
@GovTimWalz
They’re banning books from their schools. We’re banishing hunger from ours.
There was a discussion in a previous thread of US Horizontal rig count being determined by oil price. I looked at US horizontal rigs(dependent variable) vs oil futures price (contact4, 4 months in the future), natural gas futures price (contract 4), and DUC inventory per completion as independent variables. OLS regression was used and the data was examined for structural breaks over the Jan 2014 to April 2024 period. Two breaks were found, the first in June 2019 and the second in February 2021. Regressions were done on these three periods, with variables that were not significant at the 95% confidence level or higher being dropped and a new regression done on statistically significant variables only to keep it simple. The model vs data is shown for final model with correlation coefficient at 0.93.
DUCs inventory per completion is a significant variable in every period, oil futures price also significant in the earliest period and natural gas futures price in second period, for the last period only DUC inventory per completion is significant.
Dennis
Why didn’t you do a separate analysis for hz oil rigs vs price of oil?
Ovi,
I did do an analysis for rigs vs price of oil, but the question was whether oil prices or DUCs per completions were more significant, the best way to approach this is with both variables included in the regression.
R^2 for oil futures price v horizontal rigs is about 20% and for DUCs per completion R^2 is 37%, for multivariate regression the R^2 is 39% when structural breaks are not considered.
It was in response to a comment by Nony (who posts as Anonymous) in previous thread where he cited an analysis that showed that oil price correlates well with US horizontal rig count from 2015 to 2020, but not in the first half of 2021. I asserted that the large increase and then decrease in DUC inventory per completion was a more likely explanation than his assertion that a change in US Government policy stance was the likely explanation. So I looked at the data to give some basis for my assertion and found that there is ample evidence that DUCs per completion have greater statistical significance than the oil futures price (which is likely a better indicator than current prices for decisions on rigs which anly affect output 7 or 8 months in the future. The contract 4 futures price (futures price for four months from the current date) is available from the EIA, so I used that, I also included the natural gas price as this would affect natural gas rigs and could affect oil rigs in tight oil basins that produce a lot of natural gas like the Delaware basin.
Here is what the model looks like for futures oil price vs horizontal rigs
Three models
Model 1 01/14/14 06/15/19
Coefficients:
Estimate Std. Error t value Pr(>|t|)
(Intercept) 1319.711 144.402 9.139 3.72e-13 ***
DUCcomp -113.956 11.742 -9.705 3.97e-14 ***
oilprice 2.762 1.366 2.022 0.0474 *
—
Signif. codes: 0 ‘***’ 0.001 ‘**’ 0.01 ‘*’ 0.05 ‘.’ 0.1 ‘ ’ 1
Residual standard error: 115.5 on 63 degrees of freedom
Multiple R-squared: 0.8475, Adjusted R-squared: 0.8427
Model 2 07/15/19 02/14/21
Coefficients:
Estimate Std. Error t value Pr(>|t|)
(Intercept) 1546.37 172.47 8.966 7.48e-08 ***
DUCcomp -20.89 3.11 -6.717 3.62e-06 ***
gasprice -298.42 63.35 -4.711 0.000202 ***
—
Signif. codes: 0 ‘***’ 0.001 ‘**’ 0.01 ‘*’ 0.05 ‘.’ 0.1 ‘ ’ 1
Residual standard error: 117.9 on 17 degrees of freedom
Multiple R-squared: 0.7824, Adjusted R-squared: 0.7568
F-statistic: 30.57 on 2 and 17 DF, p-value: 2.343e-06
Model 3 03/16/21 04/15/24
Coefficients:
Estimate Std. Error t value Pr(>|t|)
(Intercept) 1066.503 61.528 17.334 < 2e-16 ***
DUCcomp -78.790 9.833 -8.013 1.62e-09 ***
—
Signif. codes: 0 ‘***’ 0.001 ‘**’ 0.01 ‘*’ 0.05 ‘.’ 0.1 ‘ ’ 1
Residual standard error: 60.88 on 36 degrees of freedom
Multiple R-squared: 0.6408, Adjusted R-squared: 0.6308
F-statistic: 64.21 on 1 and 36 DF, p-value: 1.615e-09
R was used to evaluate structural breaks and it was determined that there were statistically significant structural breaks in the data between Models 1 and 2 and between Models 2 and 3. Regressions were run for each of the three periods using 3 independent variables and independent variables not significant at more than the 5% level were dropped and a new regression was run using only statistically significant independent variables.
Dennis
I think you misread my question. I was looking for correlation with oil rigs and oil price, specifically WTI, not Brent. Leave out the NG rigs. Not quite sure why NG rigs were included.
Also as I have mentioned in my last few posts, having new drilled wells and DUCs almost equal has a better chance of getting correlation with production and possibly WTI.
Ovi,
Sorry, I didn’t understand.
I was using all horizontal rigs because that was the chart being discussed that Nony posted, it is horizontal rigs vs oil price.
Here is WTI vs horizontal rigs
Dennis
What I was asking was a chart similar to the one 2 or 3 above. Just include OIL hx rigs and leave out the NG rigs.
Sorry for the lack of clarity.
Ovi,
Yes have that chart at link below
https://peakoilbarrel.com/short-term-energy-outlook-july-2024/#comment-778997
Ovi,
I am considering how DUC inventory per completion rate affects rig count. I agree if this number doesn’t change (as would be the case for steady DUC inventory and completion rate) then rigs wouldn’t be affected, but often this changes over time and rigs increase or decrease in response. Also note we don’t have a lot of data from periods where DUCs have remained steady.
A different chart (still all horizontal rigs).
Here may be chart you were looking for, probably a structural break in 2020, though I haven’t run the analysis.
Dennis
Thanks
Good correlation up to Jan 20. After jan 20 trend similar but a bigger gap between rigs and WTI. After Jan 20 the philosophy changed, return cash to investors so less cash for drilling.
This chart gives an indication of a possble structural break around May 2020. (Yellow marks are data up to May 2020, and green markers after that date.)
Note that the scenarios in the post for tight oil assume DUC inventory does not change after March 2024 and rig count moved 8 months forward is used to estimate completion rate where wells drilled is equal to completion rate(or first flow) 8 months after the well spud.
Dennis
The structural break was return cash to investors.
Ovi,
Probably correct.
Model with WTI vs HOR with structural break in May 2020 (separate OLS fit before and after that date.) The oil price is statistically more important than DUCs per completion (based on the p values of coefficients), including natural gas horizontal rigs may have confounded my previous analysis. R^2 for model vs data about 72%, including DUCs per completion increases this slightly to 76%, not worth the extra effort imo.
Also looked at contract 4 futures price vs horizontal oil rigs and analysis remains about the same as using WTI oil price.
Interesting piece on lack of regulation on oil and gas companies in Pennsylvannia.
https://grist.org/regulation/roadspreading-pennsylvania-fracking-waste/?utm_source=pocket-newtab-en-us
Another example of don’t believe everything you read. DEP (state oversight agency) has been to the alleged dumping site dozens of times, tested over and over, and found nothing. The complaining party has a long history of crying foul at refineries and producers. Yet…magically…she is the only person to have observed the alleged dumping.
I haul a lot of brine in my business. It’s big noisy truck. You’d think that someone more than just her would see the dumping going on.
But the press loves a “good” story. And anything anti-oil is good.
PAOIL,
Do you spread this stuff in front of your house? Some are concerned for health and safety.
Another piece
https://www.wesa.fm/environment-energy/2024-06-15/pennsylvania-spreading-conventional-oil-gas-wastewater-roads-david-hess
Thank you, Dennis. According to your chart, I do not need to worry about a post-peak world in my lifetime. I suppose I should be relieved and grateful, but it gives me pause to consider why I have wasted so much time thinking and reading about it instead of doing something more productive.
MikeB,
As I have often said, predictions about the future are wrong 100% of the time. I noticed a mike b comment from an old Oil Drum post by Stuart Staniford (Jan 2006), not sure if it is you. Link to post below
http://theoildrum.com/story/2006/1/22/04219/1102
Chart from post below
For the readers here:
It sounds like me, even if I don’t remember it. If it is me, it just confirms that I’ve wasted a lot of time thinking about this.
EDIT: I note, with sour irony, Nate Hagens’ response:
there increasingly is quite a bit of action going on behind the scenes.
This was 2006, 18 years ago.
Mike B,
Could be, but note there is much dependent on assumptions. I have assumes a rather slow decrease in completion rate, but we could see something much faster like what occurred in 2020 which leads to a steeper drop in output, the only thing we know for sure is that we know little about future events. It is akin to a discussion of how many angels can dance on the head of a pin.
There has been some installation of wind and solar, development of EVs and batteries, some of which may be helpful, this my not have been what Nate was referring to, his comment was not that clear as to what specifically he was referring to.
I did a quick fit on Data from 1900 to 2023 (EIA data from 1973 to 2023 for C plus C) and data from 1900 to 1972 from link below
https://theshiftdataportal.org/energy#Oil
I used the Stuart Staniford Gaussian method presented in a Jan 2006 post at the Oil drum to forecast future output, but used C plus C data rather than all liquids data (as Staniford did in 2006) and data from 1900 to 2023 was used in the analysis.
The forecast using this method suggests a peak for the model in 2020 at 83 Mb/d, in 2024 the model has output at 82.45 Mb/d and decreasing thereafter. Staniford post at link below
http://theoildrum.com/story/2006/1/22/04219/1102
In my opinion C plus C output is the more important metric because that is what is used to produce most liquid fuel used in transportation by land, sea and air. Much of the NGL is used for cooking, heating and in the petrochemical industry. Refinery gain is mostly from products with less energy per unit volume whicg is why reporting output on a mass basis gives a better idea of energy output.
Also used the Gaussian fit to 1900 to 2004 World C plus C data to compare with the 1900 to 2023 fit I did earlier. There is a very large difference as shown in chart below.
For 1900-2004 model the peak is in 2027 at 98.96 Mb/d and for the model based on 1900-2023 data the peak is 2020 at 83 Mb/d. It seems the potential error for this type of model is quite large as can be seen in this comparison.
https://www.vox.com/climate/363076/climate-change-solution-shell-exxon-mobil-carbon-capture
TX earthquakes:
“More than 200 earthquakes with a magnitude of three or greater shook Texas in 2021 alone, more than double the number recorded from the year before.
Locals have long complained about hydraulic fracturing in the region, with one person saying they were moving to central or southwest Texas to avoid the increasing number of earthquakes.
‘The damage [from fracking] is done, and now we’re just paying that price. And this is what it is,’ one resident told the Texas Tribune in 2022.”
https://www.dailymail.co.uk/sciencetech/article-13684295/Texas-Scurry-County-earthquakes.html
Rgds
Tesla Energy growth is expected to exceed EV’s in next few years.
A single “consumer” Powerwall3 has SIX solar inputs for SIX arrays for up to 20kW of PV. That’s ~80kWh/day
annual avg in some climates. Perhaps 40% of that in Winter days. Most EV’s get ~3 miles/kWh.
EV Pickups ~2 miles/kWh. Few are talking about the gains in solar production with the newer
panels which are > ~22% efficient. This is up from 16% 10 years ago. The Powerwall 3 can passthru
solar power for direct solar to EV charging.
DC,
My model 3 has averaged about 245 Wh per mile (4.1 miles per kWh) over 77k and Model Y about 260 Wh/m (3.85 miles per kWh) over 27k. So the 3 miles per kWh seems conservative. No idea on pickup trucks.
They are 2 miles per KWh (500 Wh/mile), plus or minus 25% if towing or more efficient if not.
Kengeo,
Thanks. I imagine most pickup trucks are not constantly towing. And I misremembered my Model 3 average, it is 249 Wk per mile over 77k miles, or about 4.02 miles per kWh.
Has Global Oil Production Already Peaked? By Kurt Cobb – Jul 29, 2024 Bold Mine
Previous questionable practices by oil producers, such as reserve manipulation and exaggerated reserve numbers, cast doubt on the accuracy of reported oil reserves.
The peaking of world oil production in 2018 and the decline since then underscore the need for a transition to sustainable energy sources.
The news agency Reuters has seen something the rest of us haven’t: Internal Mexican government estimates of that country’s future oil production which paint a gloomy picture of rapid decline after 2030. Is this admission just the tip of the iceberg?
For many years those of us suggesting that a peak in worldwide oil production was in the offing kept pointing to several pieces of intelligence including the following:
Leaks of information about lower-than-publicly-stated oil reserves among major oil producers. In 2005, leaked internal government documents put Kuwait’s oil reserves at 48 billion barrels, just half of the 99 billion publicly claimed at the time.
Unexplained massive one-year jumps in oil reserves of major OPEC producers in the 1980s. This was probably tied to OPEC production quotas that were, in part, based on stated reserves. In 2007 the former executive vice president for exploration and production at Saudi Aramco told an audience that as a result of these unwarranted jumps in reported oil reserves, world reserves had been overestimated by 300 billion barrels.
Strangely unchanging publicly reported reserve numbers. For example, from 1997 through 2021, publicly reported oil reserves for the United Arab Emirates were 97.8 billion barrels each year. Kuwait’s reserves from 2005 to 2021 have been reported as 101.5 billion barrels each year. Of course, for this entire period both countries have been producing large amounts of oil. They may have been finding more oil, but it is hard to believe that the amount they found equaled exactly what they produced year after year. (For the latest reserve data by country, visit this page on the U.S. Energy Information Administration (EIA) website.)
The competitive raising of stated reserves by OPEC members Iraq and Iran in October 2010 just a week apart. Neither upward revision was commensurate with any tangible activity in their respective oil fields. Iraq increased its stated reserves from 115 billion barrels to 143.1 billion barrels. Iran followed by raising its stated reserves from 136.6 billion barrels to 150.3 billion barrels.
Later, the “shale miracle” that is supposed to allow U.S. oil production to lead world production to continued growth hit a significant bump when California shale oil reserve estimates were downgraded by 96 percent overnight and total U.S. shale oil reserves dropped by one half. Then came a series of independent reports based on actual well data histories by earth scientist David Hughes that suggested future production estimates by industry and government regarding U.S. shale deposits were likely wildly overoptimistic.
It is not inconsequential if Mexico’s oil production drops precipitously from 2030 onward. According to the Statistical Review of World Energy (formerly produced by BP), Mexico is the world’s 12th largest producer of oil. But it is the likelihood that Mexico will be joined in the same time frame by many other large producers that should be troubling. The United States (currently number one) and some of OPEC’s members who exaggerated their reserves seem likely candidates.
Here is another troubling and inconvenient fact: World oil production—using the proper definition which the EIA follows of crude oil including lease condensate—peaked in November 2018 at 84.59 million barrels per day (mbpd), meaning it has not reached that level since. The most recent production number available, March 2024, shows world production at 82.59 mbpd.
(Those who are longtime readers already know that the peaking of world oil production does NOT mean that we are running out of oil. It means that the RATE of production is declining. And, since our economy depends on an ever increasing RATE of energy production to underpin its growth, this decline since 2018 is already affecting worldwide economic vitality in the form of high oil prices. Oil continues to be the largest source of world energy—almost 30 percent—and it is critical for transportation where it supplies more than 90 percent of total transportation fuels.)
If we are, in fact, past the all-time peak of world oil production, expect more revelations in the next few years like the one coming out of Mexico last week.
How can Kurt say we NOT running out of oil?
We are burning about a cubic mile of oil each year.
The earth is not making a cubic mile of oil each year.
Only ~43 cubic miles of recoverable oil left.
Of course he is saying we ARE running out of oil. He is saying 2018 was likely the peak year for C+C. I have been saying that for over five years. Six years in November.
Ron
March World oil production was 82,585 kb/d. I have no doubt that OPEC has 2,000 kb/d offline. That 2,000 kb/d essentially gets the world back to November 2018. However I am not clear anymore on which is the more important issue, Peak Oil or Peak Demand.
Consider the price action of WTI over the last few months. It seems to indicate that there is a weakness in the ability of suppliers to command a higher price. Is this due to oversupply or weak demand. To get an idea of where the world stands on this question, we will have to wait till the September OPEC meeting to see if their proposed cut reversals are implemented. If OPEC back off their cuts, there could be a stronger case for the Peak demand theory. So while a case can be made that November 2018 can be exceeded, if weak demand is the new trend, November 2018 will go down as both Peak Oil and Peak Demand
Ovi, I am not so sure OPEC has that much spare capacity. But there is no doubt that we are on the bumpy plateau of peak oil right now. The 2018 peak may be passed but it will only be momentarily. What we are waiting for is the catastrophic collapse that Mexico says they will have after 2030. I expect it a bit sooner than that. The point is infill drilling has enabled countries to keep prodution high while depleting the fields much faster than normal. They are creaming the tops of the reservoirs depleting at a much faster rate than the decline.
Anyway, we shall see.
US better hope that Mexico is able to come up with energy stability. We are extremely dependent on a stable Mexico as a trading partner (huge), labor source, and culture.
Hard to overstate the importance of Mexico as viable and vibrant country, to us.
On bilateral trade, only two others have a higher ranking on global trade between two countries.
Ron,
I agree with Ovi that OPEC likely has a minimum of 2000 kb/d of spare capacity. If there is demand, World output is likely to surpass the previous peak, but I agree that it might not be sustained for very long (perhaps 2 or three years at 83 Mb/d or more).
Ovi,
over the time period plotted, the price of oil was 100% determined by speculation. The peak in 2022 was driven by speculation that the RUS-UKR would halt Russian exports, which didnt happen. After that, there was a serious of short-sell speculative attacks on oil, resulting in price drops, that were based on narratives of Central Banks tightening triggering a recession, followed by corresponding waves of short-covering.
S/D has been mostly in equilibrium
Ron
Attached is the Reuters report. It doesn’t sound as pessimistic as Cobb makes it sound.
“Zama, a shallow-water field on the cusp of being a deep-water field, and Trion, an ultra-deep-water field, would temporarily lift production to almost 2.247 million bpd in 2028 from around 1.8 million bpd now, the middle of three scenarios laid out by the energy ministry showed.
The most optimistic scenario sees output reaching 2.390 million bpd, and the more pessimistic at 2.164 million bpd.
All three scenarios, which factor in some new discoveries, project rapidly declining production from 2030.
That means Mexico would have to start importing crude as early as in the next decade if it wants to run its refineries near capacity, one source at the energy ministry familiar with the projections said. It would also no longer export crude.”
https://www.reuters.com/business/energy/declining-mexican-crude-output-could-shatter-energy-independence-dream-2024-07-25/
Ovi and Dennis, I believe there is more here than meets the eye. I do not think the drop in Russian production is simply because they want to meet their OPEC+ quota. It is mostly a production problem, not a deliberate cut. And the same is true for Saudi Arabia. They are having serious decline problems. A small part of the OPEC decline is due to deliberate cuts. But almost all the OPEC= nations are producing flat out.
Now I could be wrong. If there is a spike in the price of oil, we should see a corresponding spike in OPEC+ production. I am sure we will see a spike, just not nearly as great a spike as one would expect. Not nearly as great because the OPEC+ excess production capacity is not nearly as great as that guessed at by the EIA and the IEA.
Ron,
Note that my estimate of OPEC spare capacity is quite a bit lower than the EIA and IEA estimates. The EIA estimate is about 4200 kb/d of surplus OPEC capacity for March 2024, my estimate is roughly half that at 2000 kb/d. I agree that 8 of 12 OPEC nations may be producing at close to capacity, but I do not think that is true for Saudi Arabia, UAE, Kuwait, and Iraq, those 4 nations as a group will be able to increase their collective output by 2000 kb/d when they believe it is needed. This may not occur unless Brent Oil prices rise to over $90/bo, perhaps we reach that point in 2025 or 2026.
The 914 is out.
https://www.eia.gov/petroleum/production/
US down about 60,000ish.
In terms of big producers, NM and TX both up. ND and FGOM both down.
In terms of interesting little guys, OH continues to outpace LA. And UT is almost nearing going from the 100s to the 200s (thousands), but has not yet done so. MT continues to almost match KS (as it did last month, neither state changed.)
So the middle east might/will explode, Venesuela wobbling, the frac spread is declining but C&C will increase. Colour me a bit sceptical…
And don´t mention the war…
Laplander,
Venezuela and the Middle east have not been stable for many years. A major war could reduce supply and that could happen at any time, when this might occur cannot be predicted in advance. For tight oil I focus on rig data and assume after July 2024 the rig count remains about where it is now (which is certain to be wrong). This shows what the Permian and other US tight oil basins output will be for my scenario.
If you mean the STEO forecast, I am skeptical of that as well especially at the World level, note my shock model is considerably more conservative than the STEO especially for 2025. My 2024 guess in the Shock model may indeed be too high if we see a major Middle East conflict between Israel and Iran.
One thing in the middle east that has certainly changed as a result of Oct 7th-
Iran and Israel now are overtly at war, so far baby steps but definitely walking the walk.
The main thing that keeps Iran from acting to fulfill the religious dream of their leadership, primarily using Hezbollah as their tool, is the island.
The vulnerable island through which over 90% of Iran crude oil exports flow.
Kharg island.
Sitting duck.
Israel will take it down if they themselves feel threatened at the core.
Will be interesting to see if US production achieves its “fall boost” as in years past.
It’s been a struggle so far to get much past the 2019 pre-COVID monthly peak.
Is the USA on a bumpy plateau or will there be a surge later this year to 14 million BOPD?
The last STEO forecasts about 13.55 Mb/d in Dec 2024 and 14 Mb/d in Dec 2025. I think it may be a bit lower than this in Dec 2025, but the guess for Dec 2024 may be about right. Dec 2023 was 13.26 Mb/d so this is only about a 300 kb/d increase in a 12 month period.
Dennis/Ron:
It’s easy to find past peaker predictions of Saudi and Russian oil decline, that proved awry. For example, here (from 2006, by “westexas”):
http://theoildrum.com/story/2006/12/3/23028/8015
“No one, as far as I know, now disputes that KSA’s production is falling. The question is why.
KSA is now at about the same stage of depletion that the prior swing producer, Texas, started declining.”
“In my opinion, Saudi Arabia, like Texas in 1973, is at the start of a long term and irreversible decline in conventional oil production, with a long-term decline rate in the 4% to 5% range, perhaps sharper at first if Ghawar is crashing.”
[Needless to say, if we look at SA production since 2006, it was NOT a 4-5% annual decline.]
[Note the funny remark about Texas’s irreversible decline.]
“Russia: What next?
Mathematically, Khebab has demonstrated that the recent rebound in Russian production was just making up for what was not produced following the collapse of the Soviet Union.
In my opinion, Russia will join Saudi Arabia in showing a long term and irreversible decline in conventional oil production next year.”
[Needless to say, Russia did NOT enter a long term, irreversible decline, starting in 2006 or 2007.]
Also, read the comments on that TOD thread. Several from Darwinian (Ron Patterson) excoriating people for not realizing SA was about to start persistent decline, in 2006.
“No, they will not decline by 8 percent. I expect that they will, in the next 5 years, decline by from 3 to 5 percent. After that it will creep a bit higher.
Ron Patterson”
[Needles to say, we didn’t see 5 years of ~4% annual declines, from 2007-2011, followed by “a bit higher” declines 2011-2023.
Here is the actual record:
https://fred.stlouisfed.org/series/SAUNGDPMOMBD
P.s. And it’s good to make guesses. And OK to be wrong. But you should look at your past guesses and learn from them. Even if just to learn some self skepticism.
In my opinion, Russia will join Saudi Arabia in showing a long term and irreversible decline in conventional oil production next year.”
Obviously, you have not been paying attention. Russias long term and irreversible decline begun this year.
That specific quote was from westexas and was from 2006. So next year was 2007 (or 2008 if you want to stretch it, as it was DEC06 when he said it.)
Nonetheless, you also have a long record of predicting doom for Russia and being wrong. Several years ago, you challenged me to back that up and I came up with a bevy of links. Am I going to have to tediously repeat that?
Nony,
It is also easy to find past predictions of increasing production that have been too optimistic.
What does this tell us? That it is difficult to predict the future.
I have asked you for your predictions of the future and have never gotten a response.
You do a good job of predicting the past though.
I am always skeptical of any scenarios of the future, mine and all others.
Here is a scenario I produced about 12 years ago, with a high scenario that proved too optimistic in 2020 (with World C plus C average annual output at about 85 Mb/d). A URR estimate that did not account for unconventional resources was an error on my part which was later addressed.
Link to post below
https://oilpeakclimate.blogspot.com/2012/07/an-early-scenario-for-world-crude-oil.html
1. The predictions from Ron (and peak oilers generally), are in one direction. These are amateur analysts, but they are not off high and low. Instead they routinely go in one direction. I am NOT cherry picking. If I do a past search of Ron Patterson (and Darwinian) on Russia peak or Saudi Arabia peak, I will not randomly get a too high prediction and then a too low one.
2. It’s OK to make guesses. It’s actually GOOD to make guesses. But you have to face them and learn from them. And peak oilers (generally) do not. They run to the next negative prediction. Not making efforts to learn from the last ones. I don’t even need a walk of shame. Just an after action report to LEARN.
For example George Kaplan was extremely negative and scoffingly dismissed EIA predictions for GOM growth a few years ago (EIA said the GOM was headed to 2000 and he said it was the opposite going to 1500 and not just a difference, but that he couldn’t come up with any explanation for their views. What happened? GOM hit 2000. And Kaplan was not to be heard from for a couple years after! And that guy has very intricate field by field knowledge. However, he’s not thinking critically about his method. Despite knowing all these intricate details, his method failed to predict correctly. He should want to learn from that and adjust. Yet, we never got an after action report…or a notification of a changed method.
3. You are not as bad as the typical commenter, poster here. But you’re the crazy optimist remember. So atypical. And even given that, you’ve had a generally off pessimistic record. It’s intriguing to me that your Bayesian prior is that SA has less capacity than EIA thinks it does. What makes you so convinced you’re smarter than them? And why is your guess in the LESS direction?
4. I’m not setting myself up as a predictor. I don’t have to have some special insight of my own to observe others and their traits. All that said, my Bayesian prior for price is the futures curve. And my Bayesian prior for production is the EIA and I don’t make any predictions with “high certainty”. I acknowledge the high uncertainty instead.
5. You are all over the map with your predictions, Dennis. Sometimes when someone criticizes you, you’ll even make an alternate prediction (“well here, let me draw some spaghetti with different assumptions”.) How do I even know what your real guess is, then? All that said, you’re still not as bad as the typical peaker.
6. I actually did make a ND annual prediction a while ago. In response to your hectoring. (Again, I don’t seek to set myself up as a savant, but I went ahead and gave one and even a little of my thinking. It’s not some super model, but I explained how I arrived at it.) Maybe you just didn’t notice it.
My spare capacity estimate is based on past production for the 4 OPEC nations that are restricting output (many of the other nations either are not producing at their quota levels or are not subject to quotas and are likely producing all they can. Those 4 nations are KSA, UAE, Iraq and Kuwait. There recent 12 month average peak in output is about 2000 kb/d more than current output, that is the basis for my capacity estimate. I distinguish between “claimed” capacity and actually demonstrated 12 month average output. Potentially capacity will increase in the future, I will believe it when it has been demonstrated. To take the very simple example of Saudi Arabia, they have claimed capacity of 12.5 Mb/d for about a decade, but they have never produced more than 10.5 Mb/d in any 12 month period. Much of the phantom spare capacity is explained by this.
I also acknowledge uncertainty and sometimes present this with several alternative scenarios based on different assumptions. In doing so some accuse me of presenting spaghetti charts, though personally I think a visual presentation is useful.
I would also note that the EIA’s IEO forecasts have changed markedly over the years as they adjust their expectations based on new information. Sometimes their forecasts have been pessimistic and other times more optimistic, much like my own changing forecasts. The information available is used to make my best guess. And as I always say any guess about the future (by me or anyone) is certain to be wrong.
All right, good for you. Have a cookie.
Again, this does not address what I was citing which were predictions from other people. But great attempt to muddy the water!
Nony,
My comment was a response to your word salad. I am not going to respond to every point you make. Other people can defend their predictions if they choose to do so. Any expectation that predictions will be accurate is just silly.
See point 3 in your comment.
You said:
It’s intriguing to me that your Bayesian prior is that SA has less capacity than EIA thinks it does. What makes you so convinced you’re smarter than them? And why is your guess in the LESS direction?
Part of my comment was a response to your question quoted above.
I was also responding to point 5 in your comment where your claim that my predictions have changed over the past 12 years is accurate.
I adjust to historical data and this changes my expectations of the future. The figure below considers EIA’s International Energy Outlook forecast for World C plus C in 2021 and 2023.
Forecasts change over time, this is a given.
Also I could put up all the past EIA predictions, but you would complain about spaghetti, I love pasta personally.
Nony,
Here is a comparison of EIA’s reference scenarios for World C plus C output from the 2014, 2016, 2017, 2019, 2021, and 2023 editions of the International Energy Outlook.
Some of the changes in my estimates have been in response to changing EIA estimates over the past 10 years. It is not only my estimates that are all over the place, historical production influences estimates of future output and at different points in time historical information available is different.
The 2014 and 2016 IEO reference scenarios are nearly the same from 2020 to 2040 so it is hard to see the 2014 scenario as it is hidden beneath the 2016 scenario over those 20 years. If you enlarge the chart it may be clearer, especially from 2030 to 2035.
Click on chart for larger view.
Dennis,
Thank you for your post with the graph of past IEA production forecasts. I’ve seen this before, but it is a good reminder.
I know you take quite a few hits for forecast/model errors, but I am glad you keep sending them along. Much appreciated. Anyone that has worked with complex models of one sort or another knows that, as you point out, they will always be wrong to a greater to lesser degree. That doesn’t mean that their parameters and outcomes cannot inform judgment.
The contrast between your oil shock model and some of these IEA models is a good example of this. Your most fundamental model assumption is that of a finite stock. On any reasonable time scale this simply must be true. I don’t know exactly what goes into the IEA model(s), but their results suggest a lack of a similar assumption, a resource base dramatically larger than you assume or some other magic.
Keep the post and plots coming.
Thx T Hill,
I will continue to update my scenarios and every one will be incorrect. Statistics suggest that the chances of producing a correct scenario are small about one divided by infinity.
What oil importing nations will be doing more of as time goes on, either by legislation or just by the force of the market-
“In an unprecedented move some months ago, Ethiopia became effectively the first country in the world to ban the import of internal combustion engine vehicles. That ban was not some futuristic target for 2030 or 2035. It was an immediate ban on the import of ICE cars.
Ethiopia’s motivation? A high fossil fuel import bill of over US$5 billion a year, taking a huge chunk of the country’s scarce foreign currency resources. Energy security and self-sufficiency was another major driver. Ethiopia recently commissioned the first units from the 5,150 MW Grand Ethiopian Renaissance Dam (GERD). The GERD will add another ~15,500 GWhs of clean electricity to the country’s energy mix. This means Ethiopia now has some exceptionally good locally generated renewable energy that can be used to substitute a significant portion of that huge import bill.”
At this point, they have a lot of work to do on the electricity distribution system of the rugged country.
They are the 10th biggest country in the world and are on track to be the 7th biggest in 26 years (2050).
Banning ICE vehicles now may be a little rash, but Ethiopia is very well situated for generating solar and hydroelectricity.
They made the policy because the national spending on oil imports is bleeding them bad.
Simply on an economic basis.
There’s a free (if you register) webinar on the Grayson Mills Devon deal in the Bakken, coming up soon.
https://novilabs.zoom.us/webinar/register/5317224333363/WN_u40vQSZaT_m-e1dKod7j0Q#/registration
I watched their last webinar on the Utica M&A deal and it was great. Totally gave me Utica 101. Different strata and the like. Very geology and production and reserves focused. Kind of the stuff you all are more interested in (rather than financial aspects of the deal).
For this one, obviously most people don’t need Bakken 101 like they need Utica 101. But I still expect it to be reserves focused and maybe “what is going on lately in the Bakken”.
FYI, this is the company that Enno works at. Still impressed how he went from amateur analysis to professional work. Much respect. Place is sort of a Drilling Info or IHS or Rystad competitor, although on the smaller side. Smart guys. Hope they make some bank. And having Enno probably helps!
(No anti or pro peaker message intended in this post. Just an FYI.)
Further consideration of the EIA’s International Energy Outlook reference scenarios for World C plus C production.
In the chart below I consider the 5 International Energy Outlook Editions produced from 2016 to 2023 (2016, 2017. 2019, 2021, and 2023). I take the average of those 5 scenarios for every year except 2020 and 2021, for 2020 and 2021 I drop the estimates from the 2021 and 2023 reference scenarios and the “average” is of the 2016, 2017, and 2019 scenarios for those two years. The “modified” average of the 5 scenarios is fairly close to the 2017 IEO reference scenario, the 2023 scenario (lowest) and 2016 scenario (highest) are included for comparison as a range of possible scenarios. My most recent guess using an Oil Shock Model with a URR of about 2900 Gb is included for comparison. Note that my Oil shock Model has a higher output estimate than the most recent IEO Reference scenario (2023) from 2025 to 2032.
How do you think they come up with the rising output projections in the 2030’s?
Hickory,
I think it is mainly based on GDP and assumed growth in consumption. It is interesting to consider the decrease in the World Oil intensity per unit of real GDP. This has decreased linearly from 1985 to 2023 (oil production in b/d per million 2015$ of GDP). If we assume World real GDP (market exchange rates) increases at 2.5% per year from 2024 to 2040 and the linear trend established from 1985 to 2023 continues over the 2024 to 2040 period we get the model below. The EIA data for World C plus C output from 1985 to 2023 is also shown. The result is very different from the EIA model which for IEO 2023 assumes C plus C output grows at 0.5% per year (earlier IEOs assumed about a 1% per year increase.)
Pretty shocking that they would put out a projection based on presumed demand, that ignores the finite nature of the resource supply.
Not shocking at all. They now believe that peak oil is a failed concept. It is just not going to happen, or at least that is their current paradigm. So, production will simply be what is demanded in the marketplace.
Hickory,
I think they assume prices will rise to a level that makes more of the resource profitable to produce, the USGS estimates roughly 4000 Gb of TRR, I doubt there will be that much demand, but I have been wrong before and may be so now.
Hey Dennis,
How much of the 2900 GB in the URR have we already burned?
Dobbs,
At the end of 2023 about 1503 Gb of crude plus condensate have been produced on planet Earth.
WTI closed beneath the 200-week moving average. This may be a signal of an oil bear market. Confirmation is needed next week. All this is barring any geopolitical strife.
The recession all the talking heads said was canceled is here. Think about this though. US goes into recession with the government spending or adding $1 trillion to the deficit every 90 to 100 days.
This won’t be a garden variety recession. WTI $25
Eventually you may be right, 2035 plus or minus 5 years imo.
So a barn burning recession can’t take oil prices down to $25?
You do realize interest rate cuts don’t translate into loans into the economy during a recession right?
It translates into commercial banks buying government bonds instead of making loans into the economy.
So unless the government goes big on spending the amount of dollars chasing good and services in the economy contracts and just keeps contracting until the banks feel comfortable lending again.
Not only that but you have put money in Joe six packs hands. Otherwise the money doesn’t circulate. And the economy will just continue contracting.
Government is already spending trillions and it’s not enough to keep pulling the economy forward.
We don’t have to wait until 2030 or 2035 for SHTF. It’s happening now and it’s happening globally.
Primary banks in the US are hoarding US treasuries like never before. Safety and liquidity is in high demand.
HHH,
I think there is a way to go to confirm that we have a 2008 type situation, too early to make that call actually. This could be a correction and the stock market could continue making record highs two weeks from now.
We’ll see. But the rallying Yen, Swiss franc and gold might be a sign either the market is anticipating a war or flying to safety. If the stockmarket keeps falling, margin calls will force participants to sell their gold for liquidity.
It is all speculation, to be honest i have no idea what will happen.
Stock markets can crash upward just as easily as they can crash downward. I can make the argument that you should buy stocks because things get really bad. Because of what government responses will be.
Stocks could crash upwards while unemployment goes through the roof and private debts are defaulted in mass.
Understand that the rest of the world outside the USA is in worse shape than the USA. US asset will be more attractive than European or Chinese or Japanese assets. Money will continue leaving the rest of the world for safety.
I don’t think the Japanese are going to sell all their foreign assets like some suggest they will. They need yield that they just can’t get at home.
What is being suggested is with the BOJ taper its bond purchases other entities will be required to buy more bonds.
In the real world that means rising yields. They won’t get far with this course of action.
Yields in Japan can’t go to 1% without bankrupting their government. Literally the interest expense would exceed their taxes receipts at 1%
Fundamentals call for a much weaker Yen.
HHH,
Stock markets can crash upward just as easily as they can crash downward. I can make the argument that you should buy stocks because things get really bad.
Very true. But in the current climate we can start arguing that bad news = bad news for the stock market. Weak jobs report on friday showed this.
I think japan is in a tight spot. They import the lions share of their energy so a weak yen will increase the price of this energy. And if they raise rates, as you suggest there is a serious risk of the government going bankrupt.
Regarding deficits, U.S will have to face a similar crisis to Japan at some point.
HHH,
Yes a Great Depression could indeed cause oil prices to fall to $25/bo or less. For you this is always going to happen tomorrow. Eventually if you are wrong for a long enough time you will be correct. I just wouldn’t base my financial future on your predicitions. Hopefully for others they will do the same.
200 week or 200 day
200 week. It has been a support for oil prices for a while now. Now its closed below it, needs a confirmation at the end of next weeks close, but it doesn’t bode well for oil prices. We’ll see. Geopolitical drama could always make it bounce back and close above it.
For the past week the price was negotiating the 200-day, and ended up closing well below it by the end of the week. All signs of an oil bear market.
Even the 50-monthly support is been negotiated. I am just speculating here but that is what it looks like to me.
The Rig Report for the Week Ending August 2
– US Hz oil rigs were unchanged at 432 and are down 27 rigs from April 19. They are at the lowest count since January 2022 when the count was 434 and rising after the Xmas break.
– The Texas rig count was unchanged at 234 rigs and is down 92 from January 2023.
– Texas Permian was down 1 to 187 while the New Mexico Permian added 1 to 102.
– In New Mexico, Lea held steady at 50 rigs while Eddy added 1 to 51.
– In Texas, Midland and Martin counties were unchanged at 18 and 31 respectively,
– Eagle Ford was unchanged at 44.
– NG Hz rigs dropped 3 to 86. (Not shown).
Frac Spread Report for the Week Ending August 2
The frac spread count rose by 6 to 243 and is down by 14 from one year ago. It is also down by 29 spreads since March 8. With the rig count falling, are frac spreads rising because extra DUCs are being completed?
Global spare capacity will exceed 8 million barrels by 2030.
https://www.iea.org/reports/oil-2024/executive-summary
From that link-
“A ramping up of world oil production capacity, led by the United States and other producers in the Americas, is expected to outstrip demand growth over the 2023‑2030 forecast period and inflate the world’s spare capacity cushion to levels that are unprecedented, barring the Covid-19 period. Total supply capacity rises by 6 mb/d to nearly 113.8 mb/d by 2030, a staggering 8 mb/d above projected global demand of 105.4 mb/d.”
It is truly amazing that there is such little certainty about something so profoundly fundamental.
OPEC oil output rises in July on Saudi rebound, survey finds
The Organization of the Petroleum Exporting Countries pumped 26.70 million barrels per day (bpd) last month, up 100,000 bpd from June, according to the survey based on shipping data and information from industry sources.
Saudi Arabia provided the largest supply boost last month of 70,000 bpd, the survey found, as exports rebounded from June when they were lower than expected. Production reached 9 million bpd in July, close to the kingdom’s target.
Nigeria had the biggest decline of 30,000 bpd, with exports lower month on month, the survey found.
Small increases came from Libya and Iran, two of the members not required to cut output, and from Iraq. Iranian output reached 3.22 million bpd, the survey found, the highest since 2018 according to Reuters surveys.
https://www.reuters.com/business/energy/opec-oil-output-rises-july-saudi-rebound-survey-finds-2024-08-02/#:~:text=Saudi Arabia provided the largest,close to the kingdom’s target.
Anonymous,
G.Kaplan is not here right now to defend his point of view (apparently). I can be a back up if needed.
The main point is that technology has moved the goal post when it comes to oil/gas extraction globally. Otherwise a lot of what he said has mertis. He asked about Equinor and their investments in Brazil to me a few months ago on this blog, and I asked around and as of now the paradigm is that they do what is profitable. A complete growth/profitability view, and let’s see what goverments do first.
Updated US May Oil Production has been posted.
https://peakoilbarrel.com/us-may-oil-production-lower-than-september/
A new Open Thread Non-Petroleum has been posted.
https://peakoilbarrel.com/open-thread-non-petroleum-august-4-2024/