The EIA Short Term Energy Outlook (STEO) was published recently, the estimate for World C+C output from October 2024 to December 2026 in the chart below is based on crude oil estimates in the STEO for World minus US C+C output and the trend in the ratio of the STEO crude estimates and C+C estimates from the EIA’s International Energy Statistics for World minus US C+C output from Jan 2018 to September 2024. For the next 5 charts the horizontal and vertical scales are the same, with 9 years on the horizontal axis and 16000 kb/d from the lowest to highest values on the vertical axis. The thin line represents monthly data or forecasts after September 2024 and the markers with labels show the average annual output for each year.
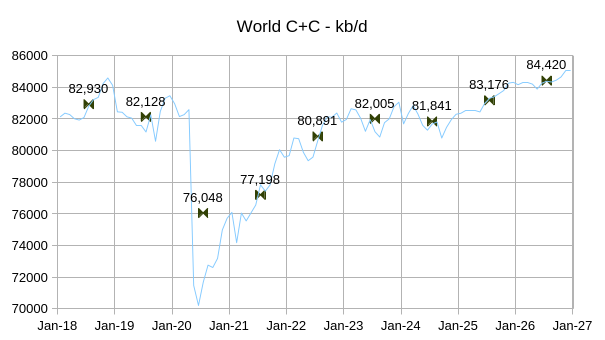
Last month’s estimate for average annual output in 2025 was 83467 kb/d using a similar methodology, so the STEO forecast has been revised lower for 2025, this STEO is the first to forecast through December 2026.
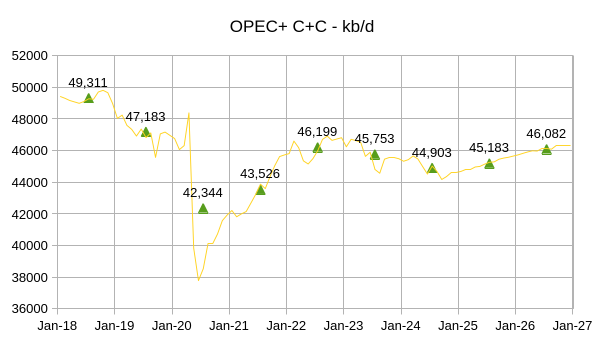
OPEC plus annual average output is expected to rise by about 1179 kb/d from 2024 to 2026, based on the STEO forecast which is an annual rate of increase of about 590 kb/d.
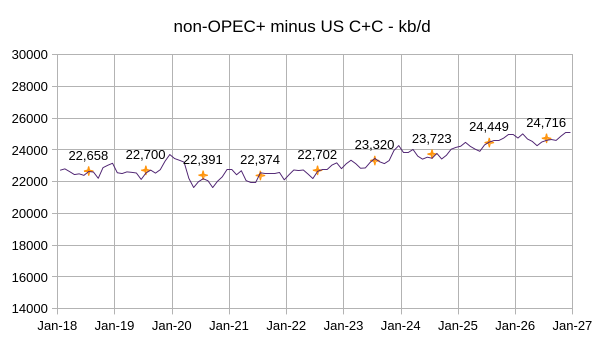
Non-OPEC plus nations minus US C+C output is expected to increase from 23723 kb/d in 2024 to 24716 kb/d in 2026, an annual rate of increase of about 496 kb/d, slightly less than the longer term annual trend from 2022 to 2026 of 517 kb/d.
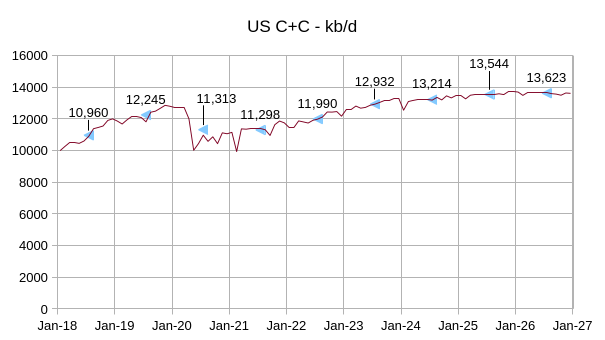
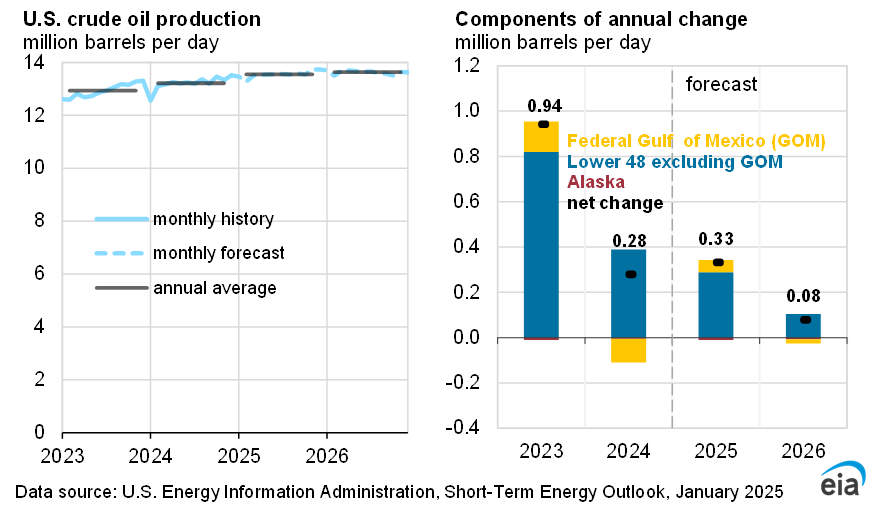
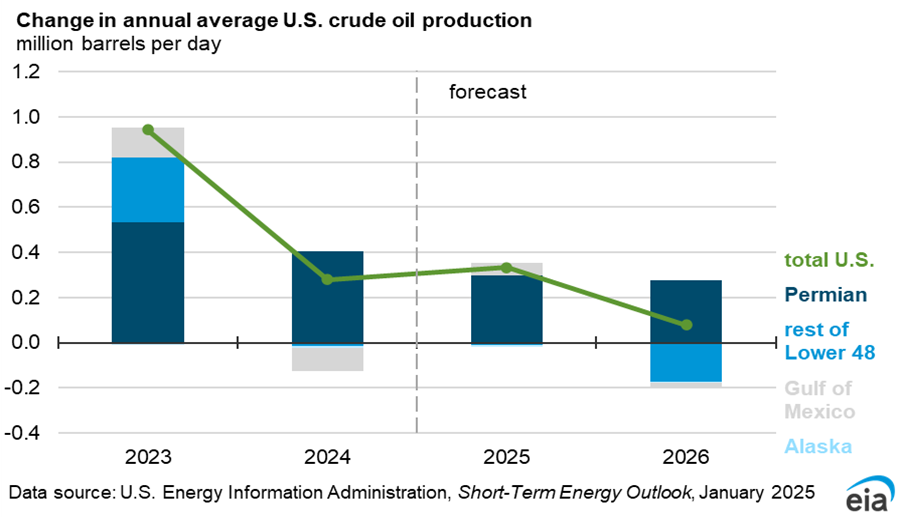
US C+C annual average output is forecast to increase by 330 kb/d in 2025 and by only 79 kb/d in 2026, peak monthly output for this forecast is in November and December 2025 at 13730 kb/d. The reason for this expected decline from Dec 2025 to Dec 2026 will be explained later in the post.
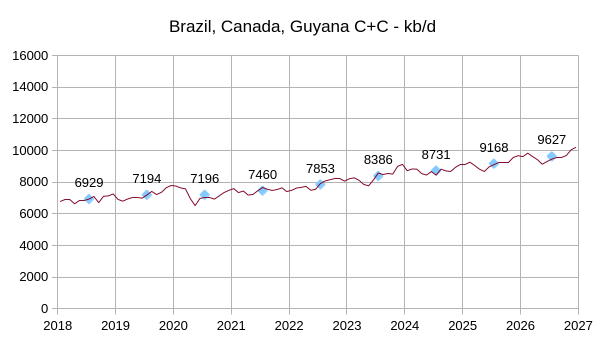
In last week’s post Ovi made the interesting observation that much of the recent increase from non-OPEC+ nations could be attributed to just a few nations. In the chart above I leave out the US and focus on only Brazil, Canada, and Guyana. I use the all liquids forecast from the STEO and the trend in the ratio of C+C from the EIA International Statistics to the all liquids STEO estimates over the October 2018 to September 2024 period to make the estimate of C+C output from October 2024 to December 2026. The average annual output increases by 896 kb/d from 2024 to 2026, about 448 kb/d per year which is similar to the longer term average annual increase of 442 kb/d from Jan 2022 to December 2026. As the non-OPEC+ minus US C+C rate of annual increase was about 517 kb/d over the 2022 to 2026 period, these three nations comprise about 85% of the C+C increase for non-OPEC+ minus US.
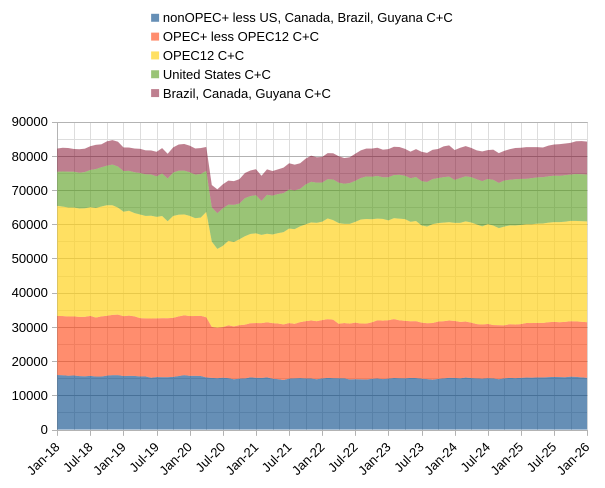
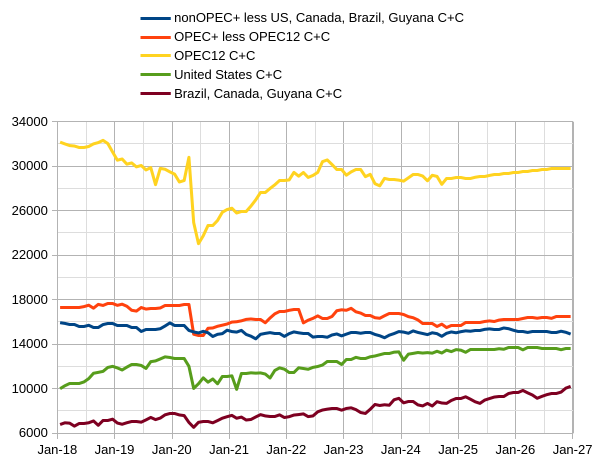
The two charts above have units of kb/d on the vertical axis and offer two different views of these groupings of nations. Most of the increase in output over the Oct 2024 to Dec 2026 period comes from OPEC+ and Brazil, Canada, and Guyana with a small contribution from the US from October 2024 to October 2025.
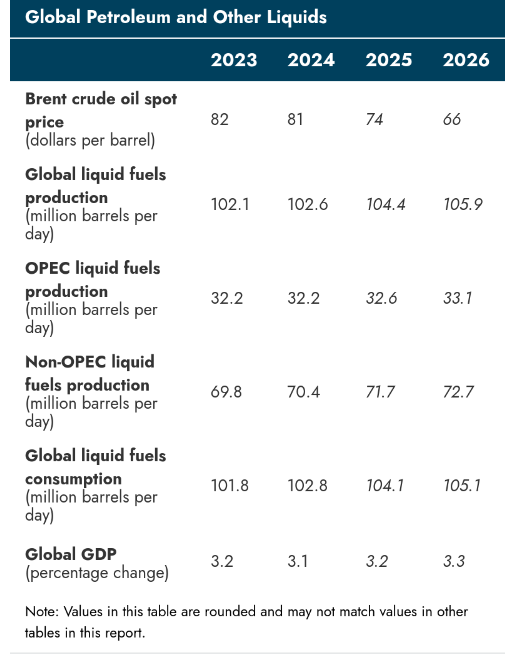
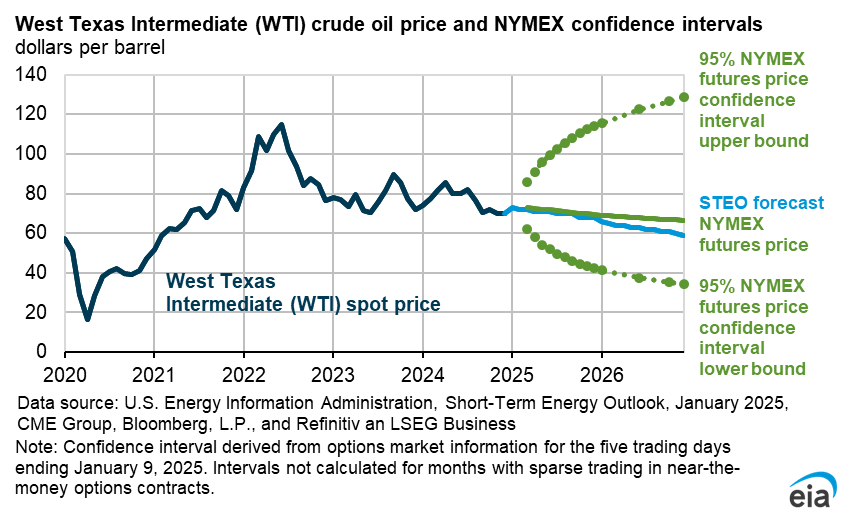
Note the big drop in oil prices forecast for 2026, this is the reason the EIA expects US C+C output will fall in 2026, the low oil prices are expected to lead to fewer new wells completed in tight oil plays and slower overall growth in tight oil which is barely high enough to offset falling output elsewhere in the US. US annual average output rises marginally (80 kb/d) from 2025 to 2026.
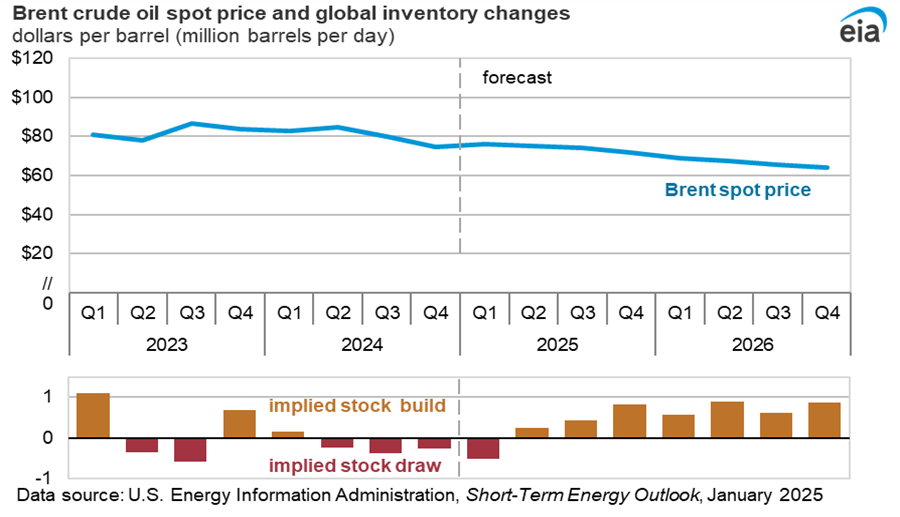
Brent oil prices are expected to fall after 2025Q1.
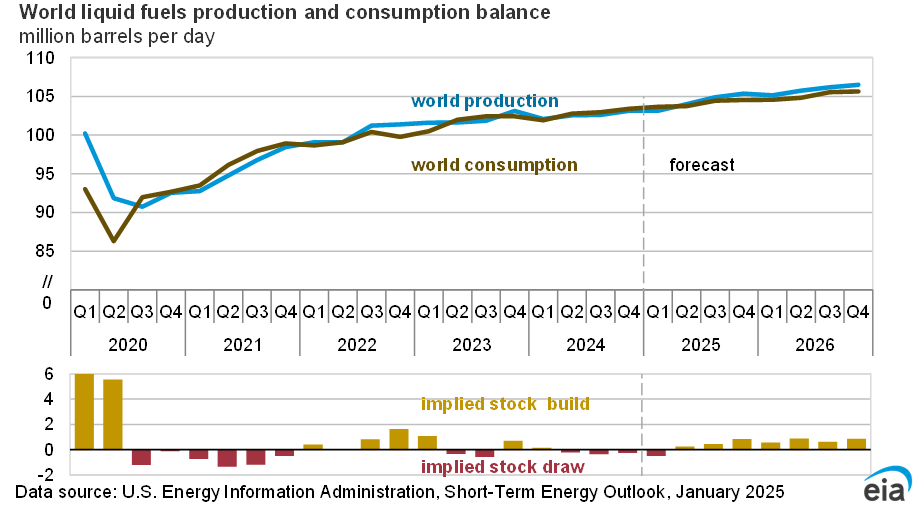
Stocks are expected to build in 2025 and 2026 leading to a drop in oil prices.
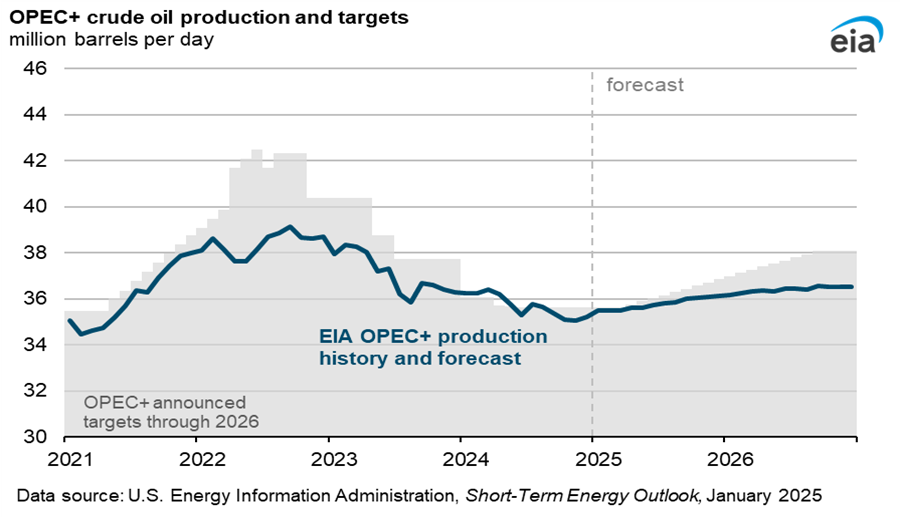
OPEC+ crude oil production rises less than the OPEC+ announced targets in the EIA’s forecast. Note that this chart only includes OPEC+ members subject to quotas and excludes Mexico, Iran, Libya, and Venezuela. OPEC+ output increases by about 1.25 Mb/d from Nov 2024 to Dec 2026 in the EIA forecast.
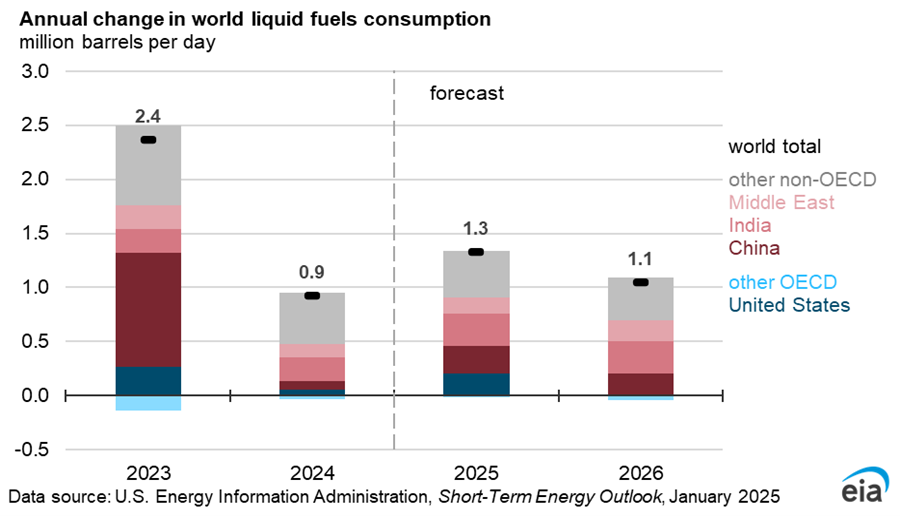
Annual average consumption of liquid fuel increases by 1.3 Mb/d in 2025 and by 1.1 Mb/d in 2026 in the EIA forecast. This smaller increase is mostly due to lower growth of OECD demand in 2026 compared to 2025.
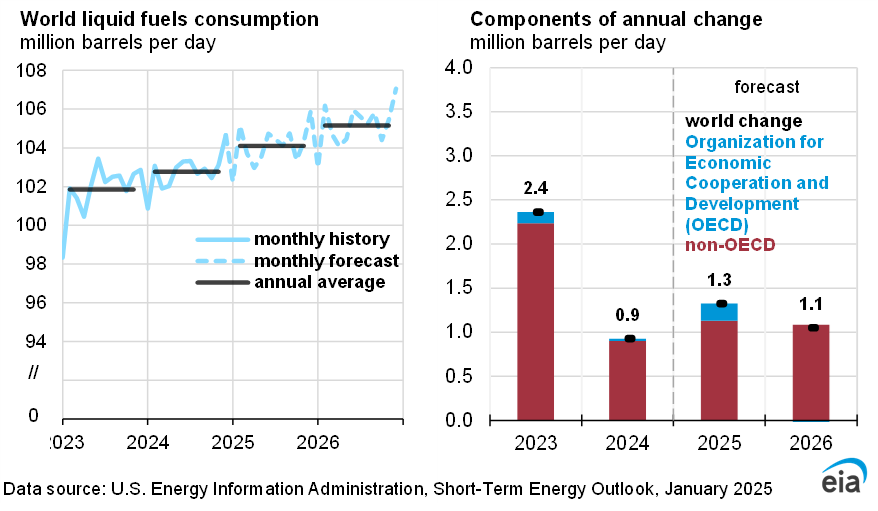
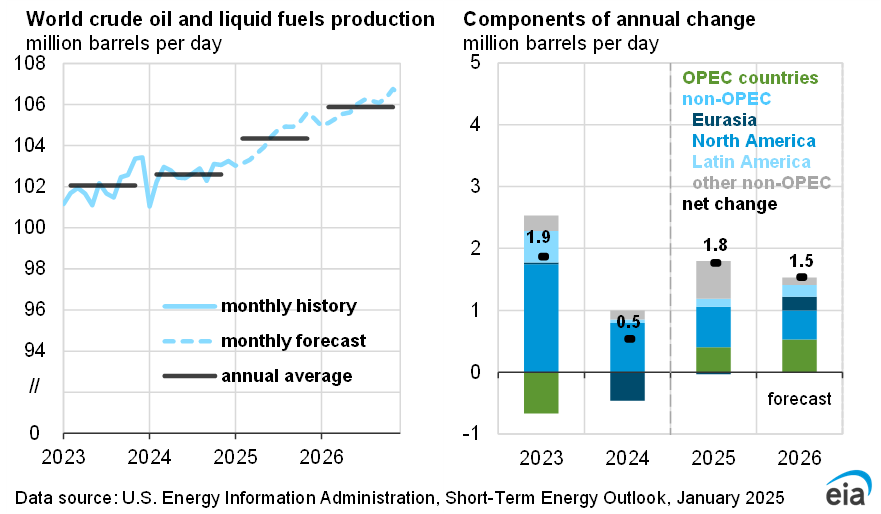
World liquids output growth is expected to be robust in 2025 and 2026.
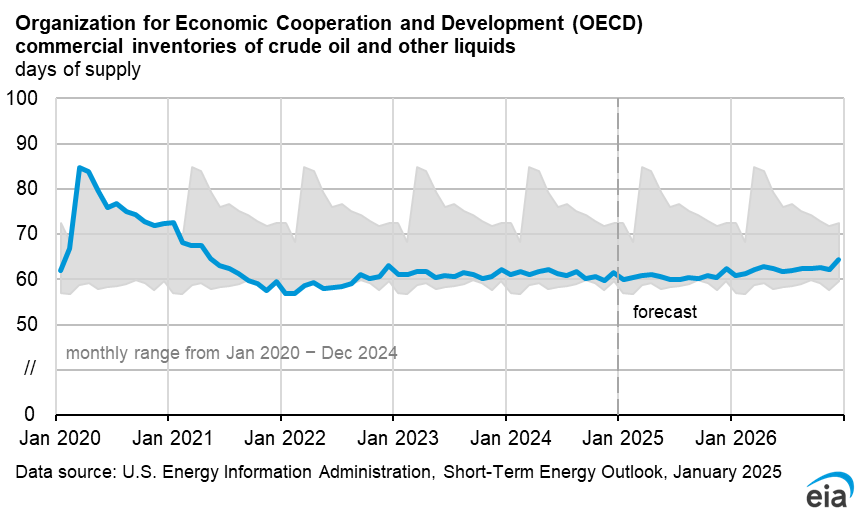
OECD petroleum stocks remain near the bottom of the 2020-2024 average.
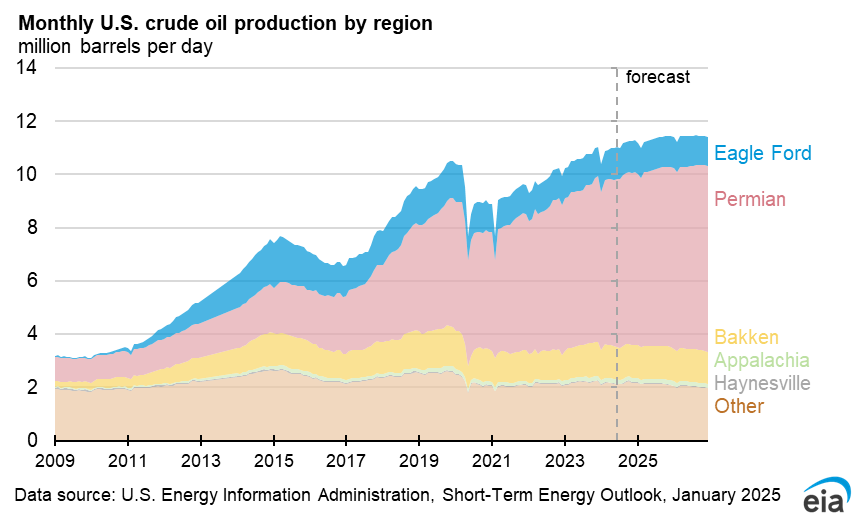
The Other regions of the US (not shale gas or tight oil plays) L48 onshore fall after October 2024, with the only region growing being the Permian Basin, but growth is barely enough to stem overall decline in 2026, US average annual C+C output grows by only 80 kb/d in 2026.
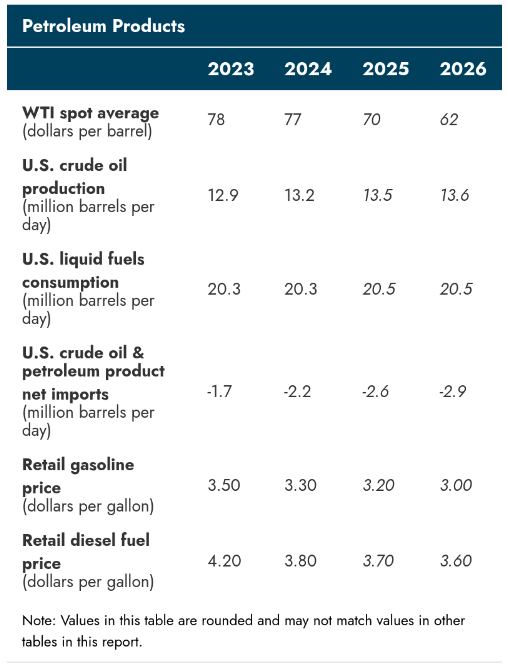
The chart above shows what is expected for US crude and product prices from 2023 to 2026.
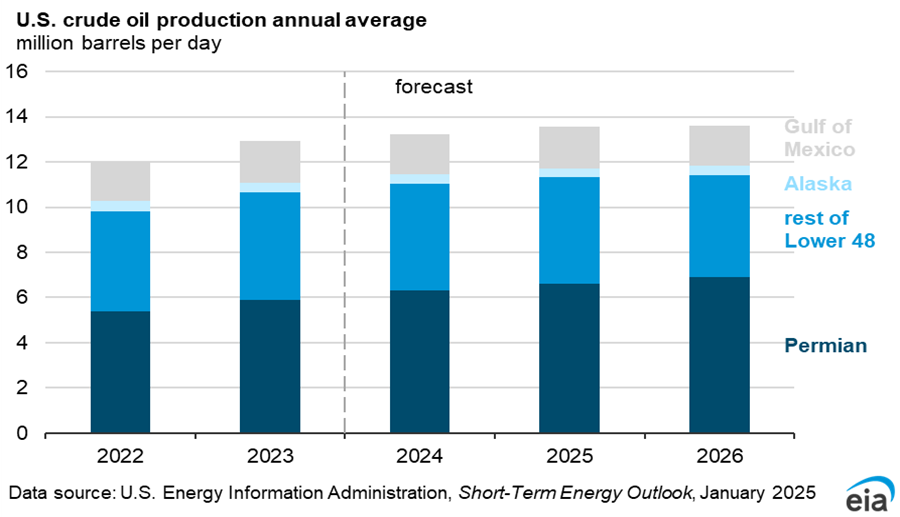
The Permian continues to grow in 2026 slowly, but the rest of the US falls by a similar amount leading to overall flat annual average output (an increase of only 80 kb/d in 2026).
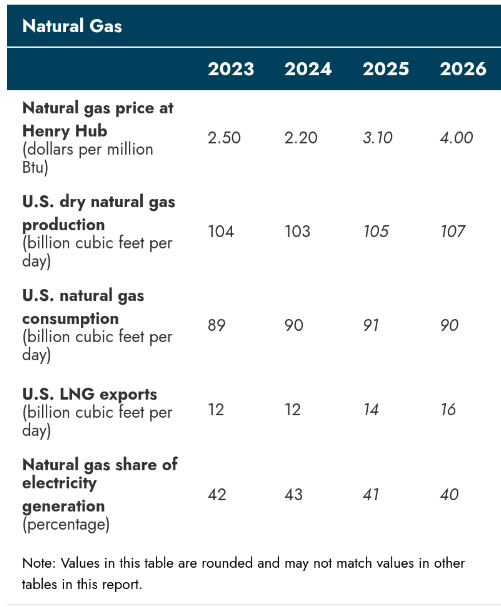
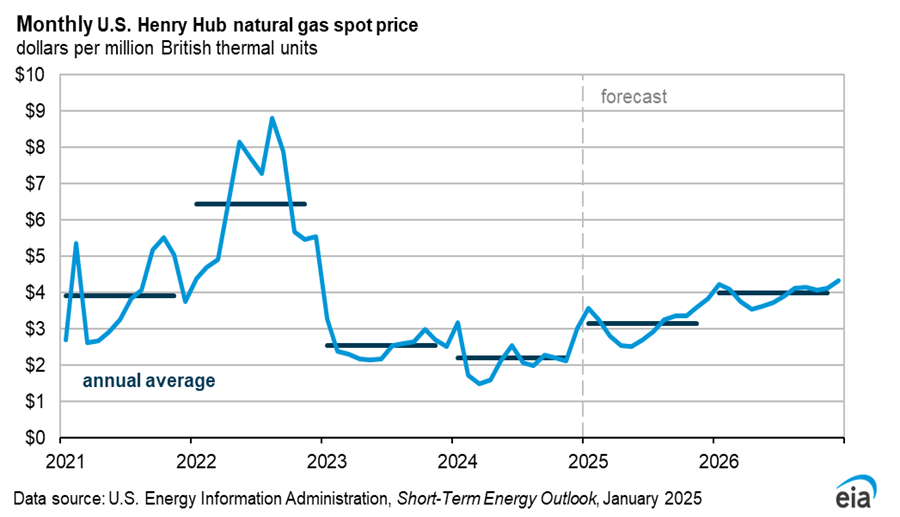
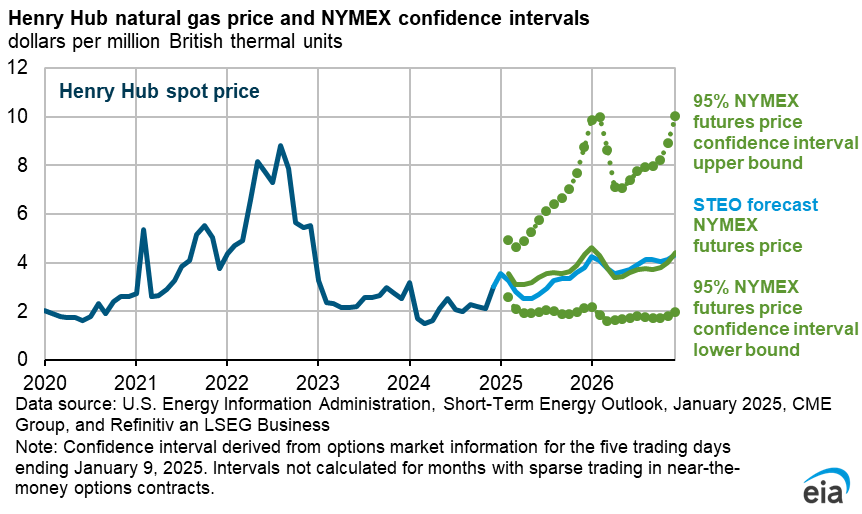
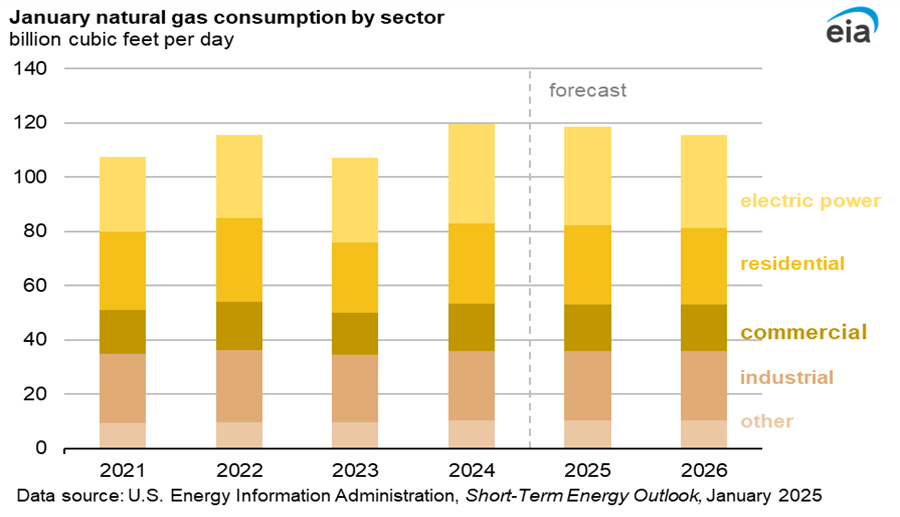
Natural gas prices are expected to rise to $3.10/ million BTU in 2025 and to $4/ million BTU in 2026. Higher prices lead to less natural gas used for power generation in 2026 and some decline in natural gas consumption. Exports of LNG are supported by ample supply with exports increasing from 12 BCF/d in 2024 to 16 BCF/d in 2026.
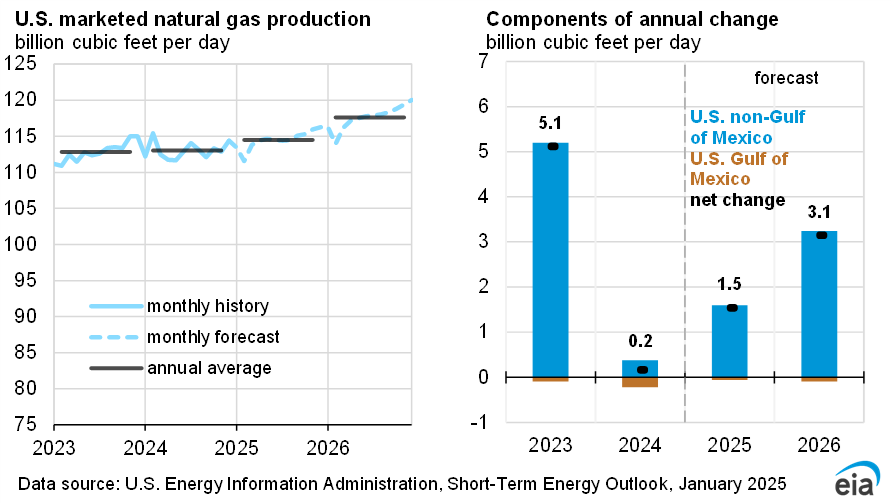
Growth in natural gas is forecast to be 1.5 BCF/d in 2025 and 3.1 BCF/d in 2026.
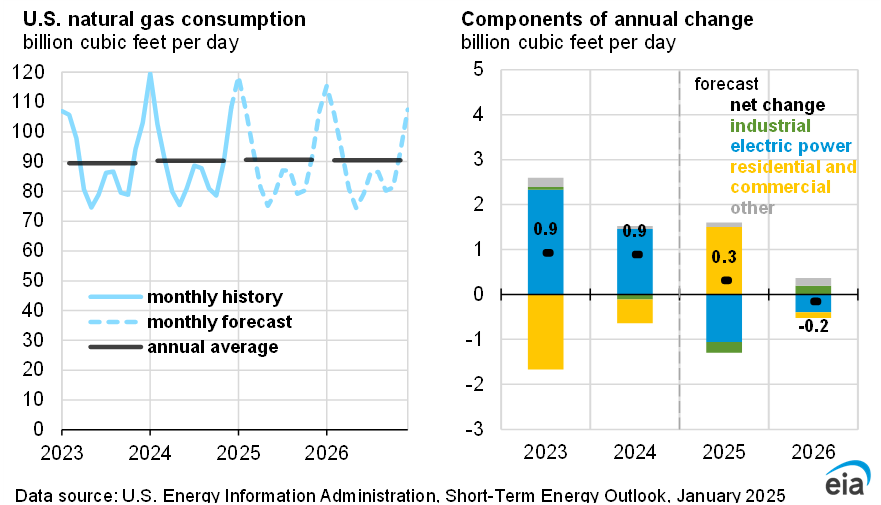
Consumption of natural gas is nearly flat in 2025 and falls in 2026 due to rising prices.
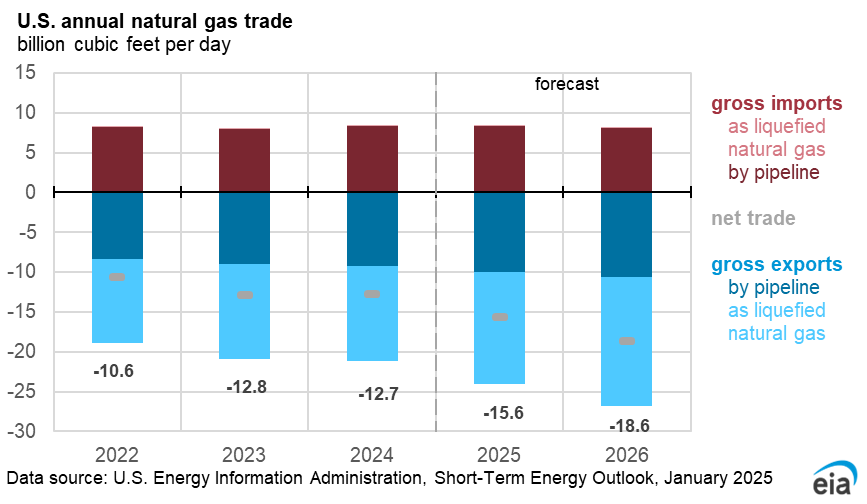
Total natural gas net exports (pipeline and LNG) rise from 12.7 BCF/d in 2024 to 18.6 BCF/d in 2026 a roughly 50% increase over 2 years.
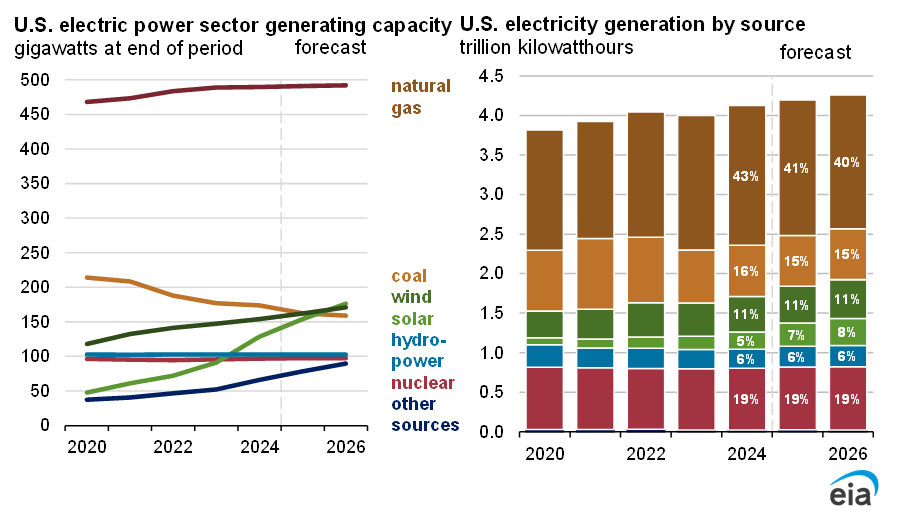
I focus on the right side of the chart above because capacity of wind and solar are not really comparable to coal, natural gas, or nuclear due to their intermittency. The electricity generation on the right panel is more of an apples to apples comparison.
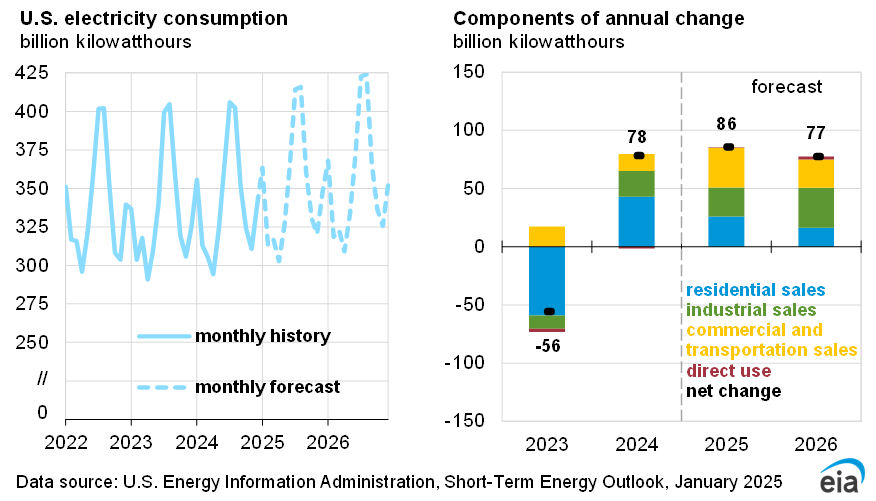
Consumption of electricity is expected to increase in 2025 and 2026.
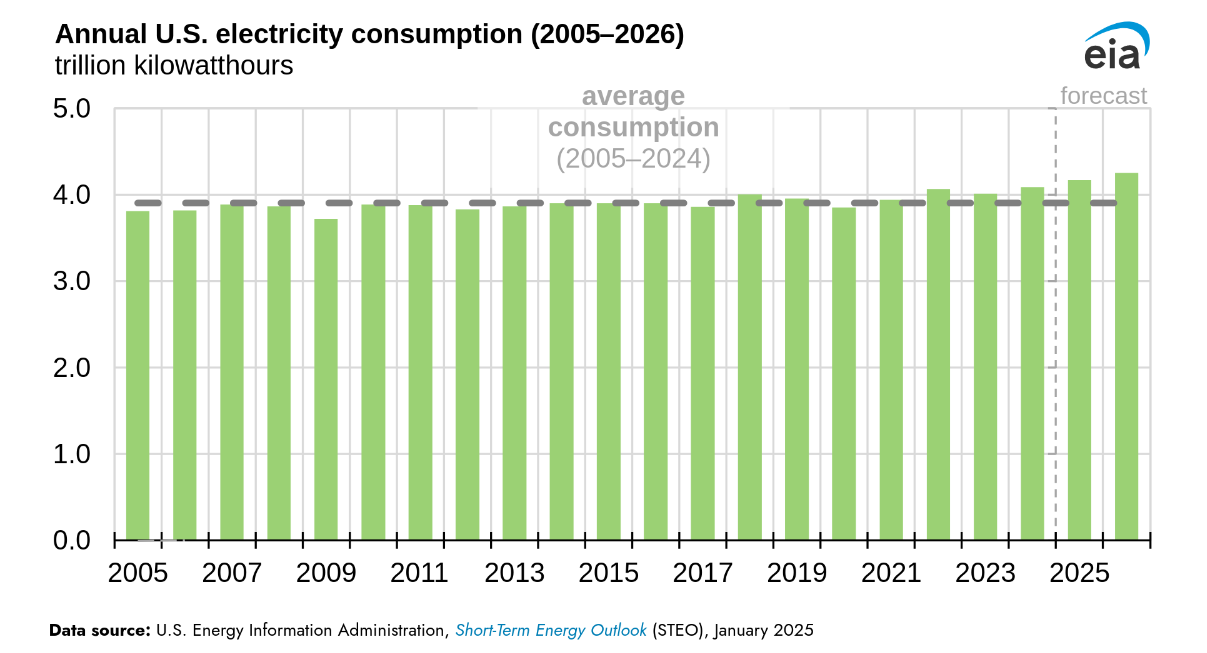
US electricity consumption has been relatively flat from 2005 to 2019 so the recent trend of increasing electricity consumption is something new.
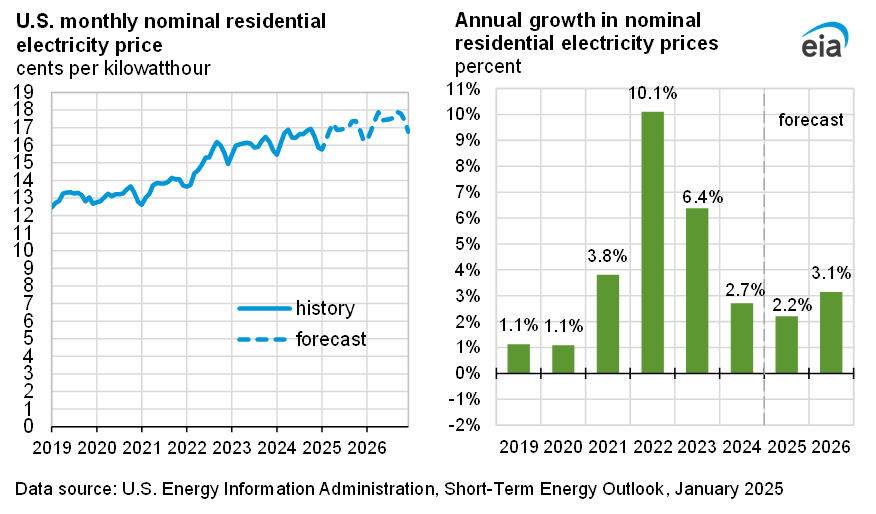
Residential electricity prices are expected to rise faster in 2026 due to higher natural gas prices. It is surprising that 2024 residential electricity prices rose so much with natural gas prices being quite low in 2024.
If you look at a long term chart of Russian oil exports. They are exporting roughly the same amount of oil as they did in 1984.
If you do the same thing for Saudi Arabia you see they are exporting roughly 1/2mb more today than they did in 1990.
So basically no growth in exports between 2 of the 3 big producers in the last 35-40 years. Even if the Saudi’s could produce more if it doesn’t equal more exports it doesn’t mean they can drive prices lower.
And currently the Saudi’s are exporting at fairly close to the highest level of exports they have ever exported since 1990. So their deep production cuts didn’t translate into less exports.
And some of those Saudi oil exports are imported oil from Russia. So there is some double accounting going on.
US net imports of crude have dropped by about 8000 kbpd since 2006 so much less World demand for crude oil exports.
HHH,
Saudi is exactly what you say, but Russia today is not comparable to USSR, and the exports have grown as domestic consumption has dropped quite a bit after 1990 and now more after the Russian conflict.
year. exports Mb/d for all liquids
1980.00 4976.00
1981.00 5031.49
1982.00 5136.36
1983.00 5289.45
1984.00 5202.00
1985.00 5919.00
1986.00 6241.00
1987.00 6365.00
1988.00 6372.00
1989.00 5959.00
1990.00 5300.00
1991.00 4346.95
1992.00 3279.08
1993.00 3190.64
1994.00 2885.02
1995.00 3177.98
1996.00 3438.02
1997.00 3540.88
1998.00 3620.19
1999.00 3551.20
2000.00 4042.99
2001.00 4478.31
2002.00 5211.45
2003.00 5949.45
2004.00 6714.34
2005.00 6952.12
2006.00 7056.21
2007.00 7271.08
2008.00 7093.72
2009.00 7367.16
2010.00 7499.69
2011.00 7438.96
2012.00 7471.94
2013.00 7588.82
2014.00 7562.21
2015.00 7810.07
2016.00 8013.19
2017.00 8037.59
2018.00 8199.52
2019.00 8250.08
2020.00 7357.35
2021.00 7469.47
2022.00 8662.36
2023.00 8447.46
The forecasts seem too optimistic, if we look at the dynamics of the first two graphs, everything indicates declines in 2025.
Perhaps 2026 there will be decline,but note that the OPEC Big 4 have about 2000 kbpd of spare capacity so I think decline is more likely to start in 2027 or 2028 unless demand growth ceases due to a severe recession due to trade wars and general chaos caused by Trump.
The recession is already here in Europe.
Trump is not to blame!
SC,
The recession is likely to get worse, blame whoever you wish.
No one is to blame.
This is the expected result of the impossibility of producing more energy (and wealth), while the debt continues to rise.
These are the limits of the global economic system that have been tested since 2020.
Trump has no influence on these fundamentals.
The fundamentals show that the economic system is in deep crisis.
Sceptic,
Some policies are better than others to deal with the world as it exists. The policy doesn’t matter and no one is to blame meme is a cop out in my view.
Dennis,
When you realize you’re caught in a bind, the good policy is to leave it and go back. Your answer gives the idea that with a “smart” policy, it would be possible to manage the oil exit without major damage. It could be the same kind of magical thinking as “Trump will fix it”.
In my view, there will be no good policy, until we realize that there is no solution by thinking in the same way. This attitude could even delay the awareness of our current situation. And I do not perceive that your last comment promotes this awareness, which is very surprising for me, with your level of knowledge of the issues.
Regular politicians say that the oil wall could be avoided from the right or from the left. Trump embodies the illusion of jumping above the wall with a good kick in the butt.
I say: wait a little, that wall seems really too high and big – we must go back.
Nothing more.
Sceptic,
I do not think that things don’t need to change, that is what good policy is about, seeing things as they are and adjusting course to best address the problems at hand. There are no magic bullets, the road ahead will be difficult, but there are some policies that will reduce the difficulty and others that will make things more difficult in the future.
In the US we have chosen a president with the worst possible policy agenda so things will be more difficult in the future. Pretending that it doesn’t make any difference is a mistake in my view. Policy matters, it is just that simple.
Dennis,
Mathematics teaches that when we reach the top of the curve, it reverses, sometimes very quickly. Because the whole dynamic changes in a short time.
In this case, small adjustments are no better idea than magical thinking.
These are two forms of denial – a form of rational denial (expecting linearity, a plateau, adjustments), and an irrational form (infantile revolt).
Take a step back, look at your precious graphs (real data, not forecasts), for which I sincerely thank you.
Sceptic,
My scenarios are based on mathematics, physics and economics. Things do not play out as you imagine. There are forms of energy besides fossil fuel and human population will also peak and decline based on demographics.
Good policy can increase the use of non-fossil energy and speed up the demographic transition in my opinion.
Dennis,
What do you mean by:
“Good policy can … speed up the demographic transition in my opinion.” ?
Sceptic mainly policies that allow greater access for women and girls to education and more equal rights for women.
See
https://www.pnas.org/doi/10.1073/pnas.1820362116
Dennis,
I am strongly in favour of education but do not consider the decline of the population as a real solution for humanity.
Because as soon as oil decreases (and it is now), it will be necessary to repopulate the countryside to produce food with less energy.
Depopulation is only a solution for the fears a few billionaires.
They don’t want to change their lifestyle and they are afraid for their privileges.
These are the people of the past.
This is no better than Trump in my view.
Sceptic,
Fewer people will put less pressure on the environment, other policy changes would be a more circular economy with cradle to grave manufacturing (where the companies that produce a good would be responsible for end of life disposal and this would encourage the manufacture of goods with easier recycling in mind at end of product life as well as designing goods to last and to be easily repaired.
Also better urban design with walkable neighborhoods with restaurants and shopping near residences to reduce energy use, better designed buildings that would require less energy for space heating and cooling and for heating water.
Dennis,
Don’t you think Trump will run the economy hot were it is likely to be more inflationary than deflationary ?
Iron Mike,
I think that is what he will try for, but the basic policies he has laid out will tend to result in trade wars and high tariffs and other trade barriers will tend to lead to an inefficient allocation of economic resources at the World level and generally lower economic growth. So ultimately the policies may lead to low economic growth and high inflation.
Dennis, thanks again to you and Ovi for the great data and analysis.
My sense of Trump is that he is more of a heavy saber rattler than a self-destructive leader. While arrogant, chaotic and random in every sense of those words, he will likely defend the economy to promote his legacy… meaning he will negotiate hard with the goal to ultimately promote rather than destroy economic growth.
He will dance that line very thin though… It will be a wild four years!
Gungalonga,
If he follows through with his promises it will result in chaos and destroy the economy. He is mercurial
and changes course like the wind. Uncertainty tends not to promote economic growth and there will be lots of uncertainty.
Over the last few decades companies have ruthlessly sought higher profits by moving their factories to places like China where work conditions are appalling and wages very low.
Great for global trade if you are brain washed economist who thinks little of human dignity.
Tariffs will punish those greedy business owners and force them to bring jobs back to the U S.
Trump will be great for America. I bet America will have a higher GDP growth in next 4 years than the last 4.
Well, a few thoughts:
Manufacturing expansion in China over the last several decades has created the greatest decrease in poverty in world history. Chinese lives aren’t completely worthless, are they?
Tariffs will punish those greedy US consumers, who tried to find the cheapest goods. Manufacturers may shift to Vietnam, Mexico, etc, but it’s very unlikely that jobs will return to the US.
Manufacturing in the US has done pretty well: BLS says it’s grown 50% in the last 30 years, IIRC. It’s manufacturing JOBS that have declined sharply, driven by automation.
As for GDP:
Trumps first term averaged 1.4% annual GDP growth.
1.4% per year – well below average (Biden averaged 3.2%).
To think that a president has any control or influence over GDP is utter nonsense…only partisan idiots think like that…come on, be smarter than the media/pundits…
Loadsofoil,
The tariffs on Chinese goods have remained in place under Biden, the tariffs on our neighbors in Canada and Mexico will hurt the US economy, farmers and many other businesses in the US use immigrant workers many of whom are not here legally. This will also hurt the US economy. We will see what happens, often Trump does not follow through on his promises, if he does you will probably be wrong.
Kengeo,
Presidents can influence government policy, compare the policies of Herbert Hoover and FDR. No president has complete control of GDP, but the policies enacted by Congress and signed by the President make a difference and only a fool thinks otherwise.
Dennis – Please point out the differences and how/why Trump/Biden influenced GDP?
loadsofoil,
An analysis of what Trump’s tariff policies will do
https://www.npr.org/2025/01/19/g-s1-43062/trump-tariffs-revenue?utm_source=firefox-newtab-en-us
excerpt:
Kimberly Clausing co-wrote that analysis and also worked in the Biden Treasury Department. She emphasized the tariff hikes would hurt lower-income Americans the most through higher prices — while at the same time, helping higher-income people receiving Trump’s proposed tax cuts.
“I think a cynical reading of what the Trump administration is suggesting is a bunch of regressive tax cuts that help those at the top of the distribution, that are paid for with the regressive consumption tax that’s going to hit the poor the hardest,” she said.
Trump wants tariffs on EU because he foresees EU will collaborate with China on EV.
BYD has a deal with VW now to buy factory in EU and produce EV to export to US.
VW, BWM are discussing using Huawei auto drive system
Sceptic,
Consider first chart of post and notice that World output of C plus C was 82930 kb/d in 2018 and is forecast to reach 83176 kb/d in 2025 an increase of 246 kb/d over a seven year period or an annual increase (endpoint estimate) of about 35 kb/d over that 7 year period. Compare to this to the long term trend from 1983 to 2018 (OLS estimate) with an annual increase of about 840 kb/d. The forecast for 2025 is reasonable and if you look at the first 4 charts of the post the increases in the 2nd through 4th charts coincide with the World total, all of the increases seem reasonable at an oil price of $80/b in 2024 $. I would agree demand seems to not be growing as fast as the EIA is forecasting so low prices and lack of demand may lead to lower output than the EIA forecast in the January STEO.
So you may be correct if my demand forecast for crude oil is correct.
Thanks for including the electricity sector info. It will be of high interest to see how the domestic nat gas pricing goes over the rest of the decade….on an uptrend now it looks like, right along with exports.
The nuclear power contribution to national electricity output is at 6%, and will remain so for a long time despite enthusiasm and talk.
England’s recent experience on this will likely not be very different for us. We can look at Vogtle in Carolina to see the same difficulties-
“Hinkley Point C in Somerset, in the Southwest of England, is the first commercial nuclear power station to be constructed in the U.K. since the mid-1990s. The project started over a decade ago and, in that time, costs have risen over and over again, sending it over budget and causing delays. The project, being led by Électricité de France (EDF), is now expected to take several more years to complete. Around 11,000 workers are employed by EDF to get Hinkley up and running, and while operations were set to commence in 2027, EDF said in 2022, it now looks like 2030 or 2031 could be a more likely start date. This additional delay is expected to increase the cost of the plant by billions.”
You don’t want to know how much the cost overruns are panning out to be, especially if you are a resident of England.
Can we do it cheaper, or in a more timely manner? I don’t count on it.
I agree. A minor change: nuclear stable at 19%.
Hickory,
It is hydro at 6%, nuclear is about 19%, all non-fossil fuel electricity generation in US about 41% in 2024 and forecast to increase to 44% in 2026.
Yes, I must have been hold the data sheet sideways.
The percent of US primary energy production by source has nuclear at 9%. It will be very hard to budge upward, unless fossil fuels fall off significantly with a smaller overall energy pie. significantly higher nuclear production is going to take a big effort, and lots of bitcoin.
Hickory,
Those percentages in the chart in the post are not primary energy, it is the percent of electricity generation, electricity is only one part of energy output, a lot of primary energy is used for transportation, industrial output, and heating of indoor spaces and water.
I agree nuclear output is likely to fall in the future (or remain the same, solar and wind may continue to grow (though perhaps less so with the current administration).
Denis, for me these are pies in the sky. Not that an increase in 2025 and 2026 would not be possible – but real world events will probably interfere and diminish production (on the other hand, they won’t increase it, at least not referring to hurricanes, civil wars, embargoes, stock market crashes, strikes and so on). So my best guess is: The undulating plateau will continue, till there is a real dealbreaker: Peak oil, peak demand or a new pandemic. I would bet on peak oil though.
Anyway my best regards to everybody here, thank you very much for your work. Though recently I am posting close to nothing, I keep on reading this great site!
Westtexasfanclub,
The forecast for 2025 may be a bit high given the low oil prices that are forecast.
I don’t think demand and oil prices will support that much production. If demand is high and prices are a bit higher than 2024, then the forecast for 2025 could happen, also 2026 forecast could be possible with enough demand and oil at $80 per barrel for Brent in 2024 $.
What about the President speach.. ” drill, baby drill…”, SPR will be filled to the limit… Will it be possible?
Freddy,
Oil can be imported to fill SPR. The drill baby drill stuff along with the promised low oil prices is just nonsense, standard fare for Trump.
Dennis/Freddy
Where does the money come from buy the oil? I guess they will have to increase the national debt.
I know this will make Republicans faint and Libertarians go mad and tear their hair, but…you could raise taxes to fund oil purchases.
Ovi,
Maybe tariffs? Trump says lots of stuff, difficult to know which lies should be ignored when mostly it is a stream of false nonsense being spewed.
Dennis
That would do it. Tariffs on Cdn Oil would be a tax on Americans that would be paid to the Treasury. Trump has set up a new IRS, ERS, External Revenue Service to collect tariffs.
Ovi,
The tariffs on Canada are a very bad idea in my view, but I don’t run things and did my best to get Harris elected, but failed.
Dennis
Unfortunately I could only cheer. A US friend who lives in Canada also tried to help. Didn’t work.
Here is an interesting approximate fact. Approximate because I don’t have the exact numbers but very close. T won by close to 235 k votes in Wisconsin, Pennsylvania and Michigan. If half of those votes were for H she would have won. Something like 50 k in PA, 40k in MI and 30 k in WI, 120k all told would have done it. This was no landslide. From what I am reading it was the last 40 days spent by Musk in PA, MI and WI that made the difference.
I heard the head of the DNC a few nights back and he said that there were a large number of votes with just the president filled in. No votes for House, Senate or State election. To me that said Musk’s influence.
Ovi,
Trump seems to have been bought by Musk, though he can easily tell EM to FO and may well do so. Musk is an ass.
Dennis
T usually fires people without consequences. However in EM’s case he might be thinking/aware of the phrase: “Keep your friends close and your enemies closer.
Ovi,
Now that Trump has been elected he no longer needs Musk, when he becomes inconvenient to deal with Trump will no longer answer the phone. In short the relationship will continue only as long as Trump believes it is helping him. For Trump loyalty is not a two way street.
Mr. T once mentioned he would use ‘energy’ to reduce debt. I thought, ‘huh’? 🤔
But yes, in the scenario you suggest the input cost of blending heavy Canadian into light American shale liquids falls.
The profitability of US oil exports rises. The excess profit over previously expected scraped off the input & can be applied to govt expenses. That reduces appropriations for govt services. Makes no difference to the US refiner, I suppose. The input price remains the same as before.
The focus of Trump is populism. A sneering in contempt at the Swamp to be drained.
This fundamental mindset is never grasped by the media, who are Swamp filth themselves. They examine this issue and that issue and measure it by potential for stability and an unrocked boat. That’s not what is going on. Upheaval is not feared or avoided by Trump. It is not chaos. It is purposeful. The Swamp will be attacked. Relentlessly.
As for oil, there will be areas currently forbidden that will cease to be forbidden. This will generate excitement. But not much oil. Geology doesn’t care about politics. I suspect we will at long last finally get enough exploration in ANWR to declare it empty. It will cost Murkowski her seat.
In an overall perspective, people don’t understand Trump because they don’t want to. It is all about the Swamp. Vance was picked because he has a grand total of 2 years in politics. At any level. It takes about 6 to become Swamp filth. Trump didn’t want Swamp filth.
Trump doesn’t care about legacy. He took a bullet and did not quit. Watch him spend most of his attention on foreign policy because $37T in debt precludes all agendas. LNG will be a focus. Anything that does not require budget.
Watcher,
So in two years Trump will be swamp filth, or if you consider that he really never left politics after first term he is already swamp filth. Yes we can export a lot of LNG and natural gas prices in the US will rise along with the price of electricity.
Just did the numbers. There is about 8 billion cubic meters/year of nat gas surplus from the US beyond current export customers. Mexico gets a surprising 90+ billion cubic meters/yr from the US. Japan and S. Korea add to 20ish. Handful of other western hemisphere countries get some US natgas.
The EU needs 100s of billions of cubic meters. Their consumption did not maintain from other sources. It has crashed. And this winter is much colder than last year. Qatar is refusing to supply unless they agree to multi year contracts — which their green folks will not allow.
So the push to get LNG to the EU will be largely cosmetic. Trump will achieve some loud contracts, but the math will not solve any EU problems. The eastern countries near Russia are going to have to resume Russian imports.
And the Swamp infection generally requires holding office. Trump will be 80 in two years. He’s an extraordinary golfer for his age and this has positive impact on his fitness, but it’s conceivable he will put all policies in place and resign before the Swamp effect.
His skill level: https://youtu.be/6Rb9b8rYhII?t=1220
Watcher,
Natural gas prices in the US will become tied to the international LNG trade as more and more natural gas from the US is exported. The EIA expects natural gas will average $4/ MCF in 2026, often their forecasts are wrong (as is true of most every forecast). Who cares how Trump golfs?
Dennis, you New England folks need not be too concerned with US natgas prices being much influenced by LNG exports … especially during wintertime cold snaps (like right now).
There simply is not enough natty available to generate electricity to keep your lights on.
That’s why you all burned OIL (!!) for over 5,500 Megawatts this morning. (Equivalent of 5 large 1,000 Megawatt plants).
Tomorrow is on track to be about the same.
Outside of Saudi Arabia and some islands, I am unaware of anyplace that needs to burn oil in this day and age for scale electricity generation.
Your local (Algonquin Citygate) natgas pricing hit almost $35/mmbtu today.
Future high monthly bills will reflect these factors.
Coffeeguyzz,
New England installed natural gas pipelines to bring natural gas from Canada’s Atlantic Provinces, but it didn’t last (supply dwindled). There is no route to New England for a pipeline that doesn’t pass through New York and it has been difficult to put in such a pipeline. The Jones act could be repealed and more LNG import facilities could be installed in New England. As far as I know there haven’t been power outages due to lack of natural gas, typically the problem is high wind and downed power lines especially in Northern New England.
Yes natural gas and electricity are very expensive in New England, again in the northern part of the region population is sparse leading to higher maintenance costs due to more miles of lines per customer.
This might be an example of late stage capitalism…
Over the past few days during the cold snap there was an LNG terminal that was liquefying 700mmscfd but needing to support pipeline pressures at the same time they were vaporizing 600mmscfd. This solution uses about 220MW of power…..to effectively do absolutely nothing. Effectively running in a circle but burning huge amounts of fuel gas to do so. Incredible.
That 8 billion cubes/pa is a thin buffer. Nat gas is needed for industry and home warming as well as electricity. With alleged re-industrialisation demand will go up
US has an important gas resource yet to be exploited – it’s export destinations!
As US gas is eventually taken off the global market, more Qatari & Iranian is due on (Pars expansions). But the global south is increasing use…not sure how it balances out, but nat gas internationally could bin out to cheaper pipeline and volatile spot ship cargoes ( outside locked in long term contracts).
Bottom line, reduced US income from LNG, & ultimately export LNG terminals will be reconfigured to import.
Nick G
You are a master of cherry picking facts to make your brutal Chinese government look good.
The Chinese government know in order to be powerful and get what they want they need a strong workforce. With this power they now control much of the oil production in the world. Search China Oil investments. Billions invested in Iran which murders demonstrators, corrupt Iraq, Nigeria, Venezuela, Russia.
China uses its power to take half the fish in the world leaving poor fishermen in poor countries starving, so much for your lies!
The poor in th U.S. have been getting poorer with millions of manufacturing jobs lost .
https://www.brookings.edu/articles/the-cost-of-being-poor-is-rising-and-its-worse-for-poor-families-of-color/
When people had jobs they bought the things made in the country.
https://www.bakerinstitute.org/research/how-chinas-water-challenges-could-lead-global-food-and-supply-chain-crisis
Where will China get its water from I wonder?
It’s funny how often arguments go off in directions that are entirely unrelated to the original question. I suppose I started the China thing: I’m often puzzled by people’s willingness to ignore the welfare of people in other countries. But, this really isn’t about China.
Was the primary cause of the increase in US poverty offshoring of jobs?
No. The primary problem is wage and tax levels. Reagan started the attack on working people and Trump doubled down.
Will tariffs help US low income folks?
No. Tariffs are regressive sales taxes, which help high income people and hurt low income.
Will Trump’s proposed policies help US low income (or middle income) folks?
No.
Will they raise economic growth?
No. Tariffs are guaranteed to lower trade and GDP.
What would help US manufacturers and farm exporters? A weaker dollar would help. Lower deficits and fewer tax cuts for the wealthy would help weaken the dollar.
Chinese Nick (mss)
We all know how brutal your government is and will stop at nothing to remain in power.
https://freedomhouse.org/report/2017/battle-china-spirit-falun-gong-religious-freedom
You stole tens of millions of jobs by using free water and very cheap coal to undercut other countries, destroying their jobs and prosperity. Now you are faced with a problem that has no solution. Cutting water consumption by increasing its cost will cripple your already faltering economy. Sending rice and grain prices much higher leading to riots. Without enough water China can’t manufacture what it needs to and the economy will start to fall apart.
https://www.bakerinstitute.org/research/how-chinas-water-challenges-could-lead-global-food-and-supply-chain-crisis#_edn6
The United States and Europe need to manufacture everything they can before China collapses due to their stupid over exploitation of water, soil and coal.
The water issue is serious and it’s one of the reasons, together with smog filled cities that China turned to renewable energy a dozen years ago or so, to save the reputationof the Chinese Communist Party from ruin. But it has been far more successful than they imagined, or their targets. When you look at the money and time spent on the Hinkley nuclear facility mentioned earlier in the chat, and see how, within 3 years or so, China can equal the expected output from it with far less expenditure with solar panels across its deserts and harvest free sunlight, it shows how ridiculous nuclear energy is, but also how the (undemocratic) command economy (State capitalism in effect) is far more efficient than free market capitalism. But that by the by. It is certainly urgent for China to use all its resourcefulness to solve the long term loss from global warming of its water sources in the himalayas and to move to duplicate is hydroelectric resources with solar and wind. Of course, the US is in the same boat, with a whole town running out of water a few years ago, and major restrictions are coming, together with the loss of hydro power there too. BTW, some bright spark realised that if one moves the desalination plants that require very high pressures to remove the salt from sea water, to the bottom of the sea, the pressure comes free!!! It’s being investigated, and won’t be easy, but would be a massive step forward. Meantime, look to Brisbane’s experience of water shortage of a few years ago and what they legislated to resolve it — that’s coming our way eventually. Hmmm… didn’t mean to ramble on… great post Dennis, must have taken days to put together, and as someone posted above, really, outputs been flat for some time and we’re watching peak oil right now.
Is it Freezing in Texas
Bourbon St. First ever Blizzard warnings.
What is happening in Texas? Are wells being shut in?
Global warming is on the way.
An inflection pt?
This caught my eye a few yrs ago so I put it here.
Heartbeat of the Sun from Principal Component Analysis and prediction of solar activity on a millenium timescale.
https://www.nature.com/articles/srep15689
I know it’s silly but if they’re right there’s going to be a massive energy (oil ?) ramp up effort. Will the majors pull another rabbit out of the hat? Or does the effort accelerate depletion?
Pretty conclusively falsified by subsequent data. Their prediction for “solar activity” for cycle 25 was a clean miss. Not even close.
Those dang plasmas! I said silly and I remember seeing how most experts discounted solar cycles. It doesn’t seem they’ve changed their view but I’d like to see their explanation for the overshoot. It’s still an interesting model . And NASA and NOAA models now show a collapse of sunspots in the 2030s.
I’m more amused by the dismissal of opposing views and “the science is settled” (the very opposite of the definition of science)
Yes, it is on the way. The southward propagation of the polar vortex is completely abnormal and is due to weaker westerly winds and less flow on the polar jet stream which meanders more than before.
From Art Berman,
https://www.artberman.com/blog/lazy-thinking-how-memes-get-oil-all-wrong/
I really don’t think peak oil analysts were thinking in memes. Devoid of stats, this Bertman article comes across as somewhat superficial. He seems to have swallowed a lot of wishful thinking. Shale oil was far more successful than expected, and took off in the USA as prices went through the roof — and has never found the infrastructure to take off elsewhere — but exclude it, as shown in this post, growth has almost stopped.
Anyway, the next four years will be the definitive test.
If demand falls in China, and prices fall, drilling might well fall and 2025 or 26 will be the definitive production peak.
SEPPO,
With Art suggesting 1.8 trillion barrels of conventional and 4 trillion of misc unconventional, I am surprised he didn’t include the supposed 100 trillion barrels of Abiotic Oil reserves deep in the Earth’s mantle. 🙂
Unfortunately, Art continues to exclude the Falling EROI of Oil and the massive increase in U.S. and Global Debt in his Oil analysis.
Lastly, Art is excellent at speaking out of both sides of his mouth.
steve
SRSROCCO
Something is up with Art a year ago he was talking stealth peak because of diesel shortages . Now no peak.
The unaffordablity we see happening globally is a reflection of a shortage in net energy that is primarily impacting the real economy represented by people who actually do stuff. The do nothing investor class thinks everything is fine as wealth has been accumulating in the top 1% .
If we look at things from the correct perspective it all makes sense. With surplus energy declining money creation cannot go to the bottom 90% because unfortunately they’ll spend it on necessity and some discretionary. This will result in run away price inflation because of the supply shock of too few goods being caused by the economy contracting into the existing surplus energy. Whether the gross liquid volume exceeds the previous peak or not the net surplus supply is shrinking. Since the real economy is slowly dying the false financial economy will have to explode higher in asset inflation like AI and housing until it eventually breaks.
The result is a shortage of bank collateral that is crushing lending and creating a dollar shortage. It’s just a matter of time before someone panics and everyone runs for the exit.
Art is a family man and I wonder if pushing off the present predicament is giving him some comfort.
JT,
Agree 100% with your reply.
There is a reason that Art BLOCKED me on Twitter or X a few years back. While I was providing respectful replies using data, he didn’t see it as a positive thing. Rather, he warned me if I continued, “Disrespecting his sophisticated clients that followed him,” he would BLOCK ME.
Well, that was a challenge I couldn’t ignore… so he BLOCKED ME… LOL.
Because Art is a Geologist, he has to remain relevant. Thus, I’d imagine he has the DEVIL and ANGEL sitting on both of his shoulders whispering in his ear.
His articles now depend upon which one speaks louder… in my opinion.
steve
Money talks
JT,
Central banks are running out of time to get interest rates back to zero. A wall of debt maturity that will have to be refinanced will be hitting over next two years. Some $2 trillion just here in the US.
The banks are technically insolvent as their assets on balance sheet have been repriced due to jump in interest rates. Obviously currently just paper losses, until they become real losses. The banks don’t have the balance sheet capacity to write these loans down. The FED has to somehow justify interest rate cuts to make the banks whole again.
We will get into a situation where FED has to do emergency rate cuts. Or watch the banks go up in smoke.
Maybe at some point the strong dollar provides cover to make these rate cuts.
But currently the cost of living for average people will make it very difficult to shove rate cuts down everyone’s throats.
So I expect the FED will wait until everything is on fire before they take action.
Seppo,
This is lazy thinking by Art where he double counts reserves and is pretty sloppy with his use of resources and reserves.
A much better analysis at link below by Rystad
https://www.rystadenergy.com/news/global-recoverable-oil-barrels-demand-electrification
They put the number at about 1500 Gb for recoverable oil reserves. with recent extraction at about 30 Gb per year that is about 50 years at the current rate, but note that is a dumb way to figure the peak as production rate is not constant. About 1500 Gb of oil has been extracted to date, so if the production curve roughly follows a symmetrical bell shaped curve (this may not be a correct assumption) it suggests we may be near peak oil output today.
Here is my recent oil shock model scenario with URR of about 2800 Gb, note that it is not symmetrical, the peak in 2028 occurs at cumulative C plus C output of 1655 Gb. At the end of 2024 for this scenario cumulative output is 1533 Gb and 50% of URR (1400 Gb) occurred in 2020. The peak in 2028 is only slightly above 2018 output so really we have an undulating plateau at around 81 to 84 Mb/d from 2015 to 2032, with average annual output over that period at about 82 Mb/d.
Here is a look at the plateau from 2015 to 2032, the middle of the plateau is 2023/2024 (years 9 and 10 of an 18 year plateau.)
Dennis,
Prediction looks reasonable to me barring geopolitical turmoil.
On the demand side, China’s & India’s economic slowdown will dampen demand, Which could possibly further extend the plateau.
On the supply side, a lot of it probably depends on U.S shale production decline rate. Some transparency from SA and Russia would be useful but i’ll doubt we’ll get that.
Iron Mike,
I agree, political and/or economic turmoil are not included in my scenario. The scenario has a 0% probability of being correct in my opinion, my best guess is always wrong.
Notice the difference between my scenario and the one in the first chart of the post where the EIA expects World C plus C to reach 84.4 Mb/d in 2026, my scenario has World C plus C output at 83.1 Mb/d in 2026 or about 1.3 Mb/d less than the January STEO forecast. Also my scenario peaks in 2027/2028 at 83.7 Mb/d, some 700 kb/d less than the EIA forecast for 2026.
I doubt there will be enough demand by 2026 for 84.4 Mb/d of World C plus C output, though this much might be produced and the excess will increase petroleum stocks and drive oil prices lower. The producers will respond with lower supply in 2027 in that case.
True, I’m a lay person who really doesn’t know squat, but Art’s article shocks me a bit as he makes a big mistake of confusing peak oil — which concerns flow rates — with “running out,” which is beside the point. He does it several times in the article:
“Shale plays stepped in not because conventional reserves were running out, but because developing them was too slow.”
“Yes, Peak Oil will happen—finite resources eventually run out.”
He also commits the dreaded “reserves fallacy.” Two trillion barrels? So what? What kind of oil is it, where is it, and how fast can it be extracted?
I believe it was Laherrere who used to say, “The issue is not the tank, it’s the tap.”
This itself is “Bad Thinking”!! These are “Bad Memes”!! WTF, Art??
Mike B,
I think it was Chris Skrebowski who based his analysis on the flow rather than the stock.
I think Colin Campbell liked beer analogies and would often say it is the flow through the tap that matters more than the size of the barrel, or something along those lines.
Found this
https://peakoil.net/vii-aspo-conference-barcelona-2008-notes
Scroll to day 2 of ASPO Conference and look for Colin Campbell.
For us, human consumers, just as important as the size of the barrel is the size of the tap.
Peak Child is in the Rearview…looks like it’s a match to peak oil date of ~2019…
https://www.visualcapitalist.com/charted-the-world-has-passed-peak-child/
Thank goodness. The web of Life is crossing its fingers that the trend accelerates.
And the sooner Musk takes himself and his bros to Mars the better.
HICKORY,
For Musk to get to Mars, it would take a great deal of LNG. How much LNG, it’s literally… OFF THE CHARTS.
According to the data, in just one trip to Mars, Musk would have to launch 15 of the larger Starship3, which hasn’t been made yet, to fill up a Space Tanker with LNG that is orbiting the Earth. That doesn’t include the liquid oxygen, which is an even larger amount.
Watching Trump issue his own Trump Coin along with the First Lady, on the same day as the Inauguration, get ready for what legendary Short Trader, Jim Chanos labels as THE GOLDEN AGE OF FRAUD to kick into HIGH GEAR.
TRUMP is now saying that he will push an Emergency Act to allow AI Centers to build Power plants right next door so it doesn’t have to be attached to the OLD GRID. Trump also wants the U.S. to be the Bitcoin-Crypto Capital of the world.
I have done extensive research on Bitcoin and Crypto, and let me tell you, the amount of Fraud and Corruption in the Crypto Market makes Wall Street look tame.
When this Bitcoin-Crypto Market Collapses, it will likely take down the rest of the Market with it.
GRAB YOUR POPCORN… LOL.
steve
The LNG is there – Musk could pretty easily fund the construction of several world-scale LNG trains devoted solely to developing LNG for his rockets. This assumes the business case is there to fund the trips to Mars in the first case which is a different conversation. This sort of ties in with a pet theory of mine…sort of a play on The Great Filter hypothesis…
In my opinion, in order for a species to achieve a truly independent interstellar status they have to go through the nuclear fission/fusion stage for space travel. I do not believe LNG would allow humans to become a space faring civilization on a larger scale. Might be good for local travel in the near solar system but not much beyond that. I also believe that fusion (not fission) is a better solution for long-distance space travel.
If we accept that as a starting point, the only way a civilization can become space faring is to develop fusion. And you can’t go straight from an agrarian or “wood”-based society to fusion. A society isn’t just going to accidentally go from a bronze-age level of development to discovering and developing fusion. Fusion is expensive and fraught with engineering challenges. And this requires an advanced industrialized civilization to support all the economic activity that would be required that would afford it the luxury to fart around playing with fusion for a significant length of time with no immediate return on investment (either in the form of BTUs or $$$).
It’s hard for me to see such a civilization developing unless there were untapped vast quantities of a high density energy source already scattered about the planet and readily available with a high EROEI. The civilization would need those easily tapped resources to develop itself and support the development of advanced fusion technologies. Again, I don’t see a civilization just going from hunter-gatherer type stuff directly to solar panels. Enter fossil fuels.
The problem is that there is only a finite amount of those fossil fuels on any given planet. So effectively the civilization is in a race against time in developing fusion power on a scale to be used in space transit before they use up these resources. Once those energy resources go into decline it becomes more difficult to divert large streams of energy to large-scale science projects when basic needs must be met to support that effort. Enter a society’s economic structure.
It could be that a society developed that immediately prioritized peaceful development of fossil fuels and fusion in the name of space expansion without wasting them on wars or their equivalent to giant SUVs. But it is unclear to me whether such a passive species where individuals all got along for the greater good without any signaling of status would even be aggressive enough in nature to be interested in going to the stars in the first place. Much of our advancement is the result of competition and conflict over resources. They would also have to be able to utilize these resources without polluting their planet to the point that it was no longer supportive of advanced societies.
Some civilizations might be lucky enough to develop on a planet with a stable climate and a stable main-sequence star and just so lucky to have a close-orbit moon with effectively infinite lakes of methane to support solar system level expansion, however I suspect those systems would be very rare indeed.
This is my primary interest in peak-oil and the race to fusion power. We’re in a race against time and resource depletion to see whether we can get off-world.
Very well put, LNGGUY. A straightforward answer to the Fermi paradox. Unless there is a physics that we are not capable of conceptualizing, the vast interstellar distances pose an insuperable barrier. Moreover, as the astrophysicist and writer Fred Hoyle argued long ago, finite energy and mineral resources will limit how long a high tech society can persist without something like a transition to fission or fusion power: “With coal gone, oil gone, high-grade metallic ores gone, no species however competent can make the long climb from primitive conditions to high-level technology. This is a one-shot affair. If we fail, this planetary system fails so far as intelligence is concerned. The same will be true of other planetary systems. On each of them there will be one chance, and one chance only(Sir Fred Hoyle, 1964 Of Men and Galaxies). ”
Not that I seriously thought that this was a novel idea and I was the first to think of it, but I gotta admit I’m a bit bummed that Hoyle got to it first. Just purchased on Amazon.
Reminds me of another idea I had years ago. As a life long sufferer of IBS-D, much of my life has been controlled by the toilet. I had the great idea that instead of a bathroom fan to control smell, how much better would it be to have an integrated fan in the toilet that maintained a slightly negative air pressure in the toilet bowl and then exhausted the smell out of the house vent line in the sewer piping. Then the bathroom would never get smelly. Some years later I was on a business trip in Europe and while reading a magazine I came across an ad for just such a device, they beat me to it. Thus ended my one shot of having Bill Gates money.
LNGGUY,
Your simple, offhanded reply that Musk can just construct several “World Class LNG Trains” to provide the fuel for his Starship Enterprise is incorrect on several points.
First, Musk wants to build a fleet of 1,000 Starships that would be launched 3 times a day. His plans, not mine. I doubt if he will get there.
But, let’s say for KICKS & GIGGLES, he does. Your simple World Class LNG Trains would be severely deficient in providing Musk the LNG he needs.
Why? We get to the next point.
Second… with Musk planning to launch 3,000 Starship3 a day, an engineer did the calculations and figured it would take roughly 1.5 Times the Total USA Natgas Supply, or about 150 billion cubic feet per day.
Lastly, if Musk will consume even a fraction of the amount he plans, he just may have to ask the Federal Reserve and U.S. Treasury to print more Shale Gas Reserves…
Because unlike Meme Coins like the Trump Coin that are UNLIMITED, Natgas Reserves most certainly are.
steve
In my mind there is a significant difference between “musk get to Mars” and launching 3000 starships per day. The latter number is so outrageous as to not really be worth my time discussing.
Can a civilization develop and eventually produce solar panels, given enough time, with a population of around the Dunbar number of 150, for a single village civilization??
The answer is, No, not a chance~!! No matter how much time they spend on the endeavor as in hundreds of thousands of years, and no matter how intelligent they are, the answer is still No.
Civilizations have to grow in size to develop complexity. The civilization has to free up an increasing number of people (or any other species on other planets), from the every day tasks of providing food, looking after the old and young.
Food gathering/agriculture has to develop to a degree that only a limited part of the population is involved in that activity, which takes the complexity of tools and fences, which means ‘other’ activities that provide the materials for tools and fences has to be gathered by others not involved in procuring food.
A village of 150 total, will not provide the extras available to develop higher level tools that takes mining and smelting of metals.
A civilization can only develop as the population grows, the food availability grows and more people are freed to do other activities.
A civilization can only become more complex by freeing up more people to do a wide variety of specialist tasks. This takes greater food resources and material resources in growing quantities to feed the civilization itself.
Civilization is a growing self adapting system, that uses an increasing amount of energy to self sustain the growth in complexity that develops over time. Without the growth in energy use to feed itself, it can’t increase complexity, as more complexity requires more parts of the system to be specialized.
Fred Hoyle and others were correct about being a “one shot affair”, but missed the point that civilization itself was self limiting as it can’t keep growing on a finite planet anywhere near enough to become spacefaring between solar systems.
Every civilization that has ever existed here on Earth has suffered from laws of diminishing returns on the growth from energy and materials perspective, constraining the resources that go to develop further complexity and in the past have eventually collapsed back to simpler lifestyles.
Our modern, massive, fossil fuel driven, highly complex, civilization will be no different for exactly the same reasons every other prior civilization has collapsed, only much faster as we have so much more complexity.
Even a falling population guarantees a collapse of our complexity as there are just not enough people to do all the specialized tasks required of high growing complexity. All the mining of everything is highly complex these days, due to the low and falling grades of materials and energy.
Low complexity of past eras will not supply the energy and materials of current maintenance of our civilization, because the low grades and remoteness, require high complexity for us to use them. The complexity of our system collapses with just population decline because of complex feedback loops of every aspect of modernity in a chaotic way, just like energy and material declines will have exactly the same outcome..
The answer to the riddle of the Fermi Paradox is very simple, every other civilization in the cosmos has exactly the same physical constraints as we do on Earth. Every civilization that ever develops collapses, when they reach their resource/climate/pollution limits and can no longer maintain the high level of complexity. Any communication via radio waves is a very short lived phenomenon for every complex civilization that has ever existed.
I’ve often considered that the universe is nothing more than a science experiment for some higher dimensional intelligent entity that resides “above” our universe in its version of a 400-level quantum physics class charged with the assignment of creating a lasting self-aware ecosystem starting only with pure energy in its petri dish. It’s very uncomfortable to sit in the realization that we may be nothing more than the latest in a long line of self-assembling quantum particles to achieve this criteria of the experiment only to flame out by not being able to make that next step to escape to the stars, destined to fade away into obscurity on this small ball of rock.
LNGGUY, possibly the hardest aspect of the universe to accept is that there is no meaning to life and all life does is increase entropy wherever it exists.
Even if we assume humans can get to the stars throughout our galaxy, then what? We would still use up all the resources of the galaxy over time. Even assuming we could go intergalactic over the next 10 million years, and occupy the entire universe, then what? The entire universe will likely be energy dead in a few trillion years, then what?
The fact that no-one from other planets have been able to come and grab our resources for their benefit, nor are we able to detect any other civilizations using basic radio waves we use for communication, is a fair clue that ‘going to the stars’ has not happened to any other species for more than a short timespan at best, with them most likely collapsing their civilizations in a fairly short period of time.
A civilization, complex or not, is on a losing path when its foundation is built on a depleting basic resource.
It does make sense for the civilization, and each of its individual constituents, to enact measures to extend the ‘lifespan’ of the depleting base resource.
As best it/they can.
This is not hard to understand.
Is it still a losing battle?
I think so. And if you agree then its your choice whether you just lay down,
or work hard to adjust to the realities.
LNGGUY,
I thought i might chime in here for another perspective. Atomic physics shows us that 99.999%+ atoms are essentially “empty space”. Only in neutron degeneracy pressures within neutron stars do these distances reach <= 1% empty space. One can assume when this "empty space" reaches ~ 0% black holes form which is one of the limits to our knowledge. Another being Heisenberg's uncertainty principle but i will not go into it here.
Obviously our everyday experiences with the physical world doesn't show that fact.
In a way everything we observe including the universe is a representation via our sensory organs and the brain. Materialism is very likely an illusion of consciousness. In my opinion.
Furthermore in some quantum mechanics interpretations we could posit that even space and time is an illusion or an emergent property of consciousness. Quantum entanglement experiments aka Einsteins and Podolsky's spooky action at a distance hints at this being the case. You can watch a fascinating documentary on this topic here if you are interested:
https://videos.cern.ch/record/1064498
Also Kantian philosophy talks about this long before the age of quantum mechanics. Also Vedic philosophy discusses this at length some 3500 years ago.
Hideaway
Here’s a case in point
I have a cousin who live taps water mains in the Maryland DC area. They have some mains that are concrete lined with a steel casing with an additional tensioning wire then concrete casing. To tap that line is a work of art. Special fittings grouting and procedures. There is no one at the water company that knows how they’ve all retired or expired. He’s the only one in the region and he’s about to retire.
The water company’s have turned to hiring engineers from India who have no experience because management has no experience. They don’t even know ductile pipes aren’t round.
Entropy is nothing more or less than the loss of information.
“Trump also wants the U.S. to be the Bitcoin-Crypto Capital of the world””and let me tell you, the amount of Fraud and Corruption in the Crypto Market makes Wall Street look tame.
When this Bitcoin-Crypto Market Collapses, it will likely take down the rest of the Market with it.”
The strength of the dollar is part of what makes America a superpower and supports America’s consumption which it can’t produce internally. Trump the leader of the United States should be focused on keeping the dollar a strong world currency, not permoting a valueless corrupt currency used by the black market.
Who would have guessed when you elect a rapist felon, insurrectionist and top secret thief.
“GRAB YOUR POPCORN… LOL” watching the collapse of the United States over the next 4 years.
Then you will get your wet dream $25 oil and collapse of consumption.
X will build 1K starships, and launch 3 times every days, or 1 million times a year, and each shot will consume 1.2K ton of LNG, that’s ~ over 1.2billion tons of LNG or more than US gas production annual.
Well no, SpaceX won’t do that many launches. But they could pretty easily build a 10Mtpa LNG facility which using your numbers could supply over 8000 launches per year. Plenty viable to get to Mars in some capacity ignoring all the other engineering problems involved in such an endeavor.
But what about the poor Germans et al freezing in the dark since no LNG was delivered to them? (since it was WAY too expensive/unavailable)
Seeing the frac spread drop further, as posted by OVI below, will not help them, at least not in the short timeframe.
But getting more Starlink satellites up for dubious reasons is important too, or not…
Anyway, to some peoples horror, I´m still impressed by Elons achievments to get things, like the Roadster but also a lot more, up and down from there.
(Perhaps not the Roadster in the near term though…)
Laplander,
I am less and less impressed with Musk each day.
https://bsky.app/profile/bradmunchen.bsky.social
“Tesla sales in Europe should crater this year. They’re already down by 65% YoY in Norway, Spain, & the Netherlands.
But this is incredible: a long-time Tesla fanboy & influencer reports just how bad Musk’s reputation has become in Germany.
Tesla’s factory in Grünheide is worth $4.2 billion.”
new Model Y booked 100K units in 10 days in China
Laplander, hard to feel much sympathy for the Germans. They had a reliable and cheap source of NG but hitched their wagon to the US shooting star and are now dealing with the consequences of that. Maybe it was worth it to them, I’m not one to tell the Germans how to run their county. But there are consequences to their decisions.
“But there are consequences to their decisions.”
The consequence of using a finite & non-renewable energy source is resource exhaustion.
I think the Germans were on a pretty solid non-fosil route, but got caught in another cluster…
Trump is calling for the Saudi’s and the rest of OPEC to produce more oil to get prices down. And for lower interest rates, not just here but lower interest rates on a global scale.
Fact is the economy sucks and has sucked for awhile now. If you want the economy to boom lower oil prices and interest rates are the way. And if you were to be successful at it you’d create the environment for a weaker dollar.
If for any reason OPEC can’t or won’t help get oil prices lower. I feel Trump will bring back the oil exports ban. And remove 4.8 mbpd of exports from the market.
Any resolution in Ukraine would lead to lower oil prices as well.
I absolutely love this rampant speculation that spacex will send a bunch of crap to Mars…it’s so far fetched. We can’t even solve the simplest of problems here on earth, yet we are going to mars???
Exactly. Mars has no atmosphere, and we’ll fix that, while actively destroying our own? It’a like a doomed and ill-fated second marriage.
Trump already hammering on OPEC to lower oil prices.
I’d laugh at the producers who almost unanimously support Trump, if I weren’t one myself.
Trump’s first Presidency wasn’t a great time for our company. Hope the second time around is better. Not convinced it will be.
Ovi.
Don’t know where you get your rig count and frac spread data, but I see the American Oil & Gas Reporter has that on its website now and it’s easy to navigate.
SS
Thanks for the info
That is the source for the Frac data. The rig data comes from the Baker Hughes data base. The AO&GR reports the total number of Rigs. Dennis and I focus on Horizontal rigs so when you compare the numbers I will post shortly there will be a difference.
For instance there are vertical rigs that just drill the first vertical part of the 15,000 horizontal laterals.
Also I need county data which I don’t think is available there. Note also that state and basin info is also included in the following report
The Rig Report for the Week Ending January 24
– US Hz oil rigs were down 7 to 429. A similar large drop of 7 occurred in November 2023. Could this drop be related to the freezing weather that has hit Texas and New Mexico over the past week? The count is also down 30 rigs from April 19 and are up 2 relative to their recent lowest count of 427 on July 24th. The rig count has remained in a very tight range between 427 and 442 since July.
– The New Mexico Permian rigs were down 2 to 92 while the Texas rigs were down 5 to 188
– In New Mexico, Lea added 2 to 48 while Eddy dropped 4 to 44
– In Texas, Midland was unchanged at 26 while Martin dropped 1 rig to 26
– Eagle Ford added 1 to 40
– NG Hz rigs dropped 2 to 79.
Frac Spread Report for the Week Ending January 24
Spreads keep on dropping
The frac spread count dropped by 5 to 183. It is also down 59 from one year ago and down by 58 spreads since October 11. Will this long Frac Spread drop starting in November result in lower US production for December and January.
We are now 6 weeks away from March 8, 2025 and are down 89 frac spreads. It will be interesting to see the frac speed count for March 7, for comparison.
In my view there has to be, in the long run at least, some kind of “balance” between rigs and fracs, might have been around 1 to 1 or so at some time if I remember correctly but now it seems like 2:1, but ducs also have an influence of course. But the question is, whats the leading edge here?
Edit: In the long term I mean, things like weather and such always have an influence.
Seems likely the very cold weather in Texas and New Mexico may be affecting rig counts and frack spread counts.
although frac and drilling rig efficiencies have been improving, the speed of efficiency improvement has slowed down in the past 2 years. If the fast decline shows as large as 20%, excluding weather conditions, it could be a reflection of the economics.
The larger fracs improve the IP, but the fast decline kick in couple years later. Operators like/tend to think economics getting better with larger frac and only realize 2~3 years later it is not the case.
Hello,
Have you guys looked at Jean Laherrere latest paper with his “predictions” on US fossil fuel production ?
Quite scary..
https://aspofrance.org/2024/12/02/us-fossil-fuel-production-forecast/
Thanks for linking this.
His U.S oil forecast seems reasonable but i disagree with his U.S NG forecast, as there seems like a lot more potential reserves waiting to be discovered and drilled.
Also with Trump in the box seat for the next 4 years, FF production might increase all round including coal, which will push peak faster. But lets see how it plays out.
Iron Mike,
I agree Laherrere’s forecast for US Natural gas is too low, also see
https://aspofrance.org/2024/12/31/us-natural-gas-production-forecast-update/
this is also quite low. His HL for shale gas uses monthly production divided by cumulative production. For 2024 aP (annual Production) divied by cumulative production of shale gas was about 9.8% (not the 0.8% shown on Laherrere’s chart). A Hubbert Linearization usually will not give a reliable result at this level of depletion
YVES75
It is nice to know that Jean follows POB. In the oil section he shows a plot of the weekly frac chart that appears every Friday on POB. However he then credits Novi for that chart.
@Iron Mike
Yes regarding coal , my understanding is that HL method he uses might not be correct as coal has seen some pressure to limit extraction.
And indeed for NG might also be the case.
@OVI
Jean is 93 (born May 1931), quite amazing that he is still producing this work (and still being quite unique in doing so), but I guess he can make a few mistakes !
Had a few calls and mails exchanges with him some years ago he was telling me it was not as before.
I should hurry and send him some new year greetings!
But if even only his projections on US oil are correct, 2025 might be quite something ..
YVE75
I think he has a good chance of being right about 2025. My next US post is also hinting at a 2025 peak based on detailed county data.
OVI
Thanks for the info, highly interested in your next post then, coming soon ? 🙂
By the way I was wondering, what is the typical “diameter” of the “fracked material” for a LTO (or shale oil) well ?
I mean the oil that is extracted comes from a “fracked cylinder” of approxilately what diameter ?
And what is the thickness of the rock formation layer from which the oil is extracted ?
This in the sense, could it be possible to have the same areas (even the same vertical wells part), redrilled for the horizontal part say 2 or 3 meters above or below the previous horizontal part ?
And really it is quite amazing to look around the Permian, for instance in this area :
https://www.google.com/maps/@31.9770471,-102.5089119,20369m/data=!3m1!1e3?entry=ttu&g_ep=EgoyMDI1MDEyMS4wIKXMDSoASAFQAw==
Which looks something like, figure 12 in below post :
https://blog.gorozen.com/blog/the-depletion-paradox
The extend of the operations is really “impressive” ..
There was also these images done for the Bakken based on real wells data :
https://www.nytimes.com/interactive/2014/11/24/upshot/nd-oil-well-illustration.html
the shale/tight development is uniquely different from conventional oil, which the controlled/stimulated volume of each well is quite limited here, and there are several vertical benches that are not communicating with each other.
the vertical bench spacing or separated depth could be well limited to only 10meters or less, as in the case of Bakken. There are at least 4 benches in Bakkn, the Upper, Middle, Lower Bakken each about <10~20meters, are almost 100% present in the basin, and further below lower Bakken there are the ThreeFolks – 1,2,3 each again ~10meters separated by shale or , but not present in 100% of the basin.
The horizontal dimension of each lateral is much wider, usually over 100meters radius.
@Sheng Wu,
You didn’t understand the question, (or I didn’t expressed it well enough).
I know the horizontal part of LTO wells is quite long (around 1000 meters or even 1 mile from what I understand).
My question was, once the fracking is done, the oil coming into the horizontal pipe comes up to which radius from the pipe ? (after which it stays in the rock formation as the fracking didn’t reach it)
And whether in some part the thickness of the rock formation is enough so that several “horizontal part” could be “stacked”.
YVES75,
Maybe I did not explain as easy as AI chatbots.
The long laterals usually 3~5km long these days produce oil from vertical usually limited to 10meters total, and horizontally usually 150~300meters. So horizontal spacing between 2 adjacent laterals is about 300~600meters; vertical spacing is usually 15~100meters.
The target landing bench is
Art has changed his view a lot since Peak Carbon last year
https://www.artberman.com/blog/lazy-thinking-how-memes-get-oil-all-wrong/
Art is fun to read, but I am wary of accepting even the data that I see him post, much less his conclusions. I have noted at least one substantial and clear error in fact before that would have largely invalidated his argument in a given post. A comment sent to his site asking for clarification was never posted.
I found this remark intriguing:
Shale plays stepped in not because conventional reserves were running out, but because developing them was too slow.
ART data is highly biased manipulated especially the past 5 years.
new posts are up
https://peakoilbarrel.com/opec-update-january-2025/
and
https://peakoilbarrel.com/open-thread-non-petroleum-january-27-2025/