The EIA Short Term Energy Outlook (STEO) was published recently. An estimate for World C+C output from 2018 to 2026, with forecast values for 2025 to 2026 based on the recent STEO in chart below. The estimate for World C+C is based on World C+C minus US C+C from the EIA’s International Energy Statistics and World crude minus US Crude as reported in the April STEO to find World minus US condensate output. The trend for the condensate data from Jan 2020 to December 2024 was used to project condensate from Jan 2025 to December 2026 for World minus US and then the forecast for US C+C was added to the World minus US crude forecast along with the condensate forecast to arrive at World C+C.

World C+C increases by 2040 kb/d from 2024 to 2026 an annual increase of 1020 kb/d. The growth rate looks optimistic especially when the low prices of the STEO forecast are considered. Last month’s estimates were 81701, 82677, and 83843 for 2024, 2025 and 2026 respectively, so the estimates are all higher this month compared to last month. I think the EIA forecast for 2025 and 2026 will be too high, my guess is 82580 kb/d for 2025 and 83040 kb/d for 2026.
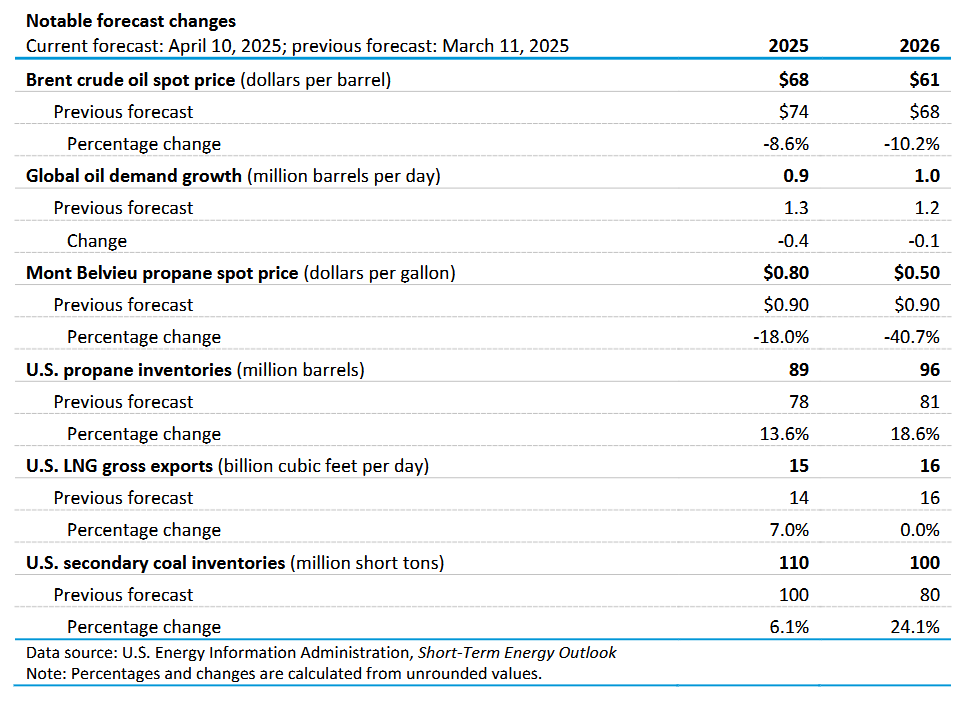
There has been a significant reduction in the forecast for future oil prices in 2025 and 2026 compared to last month a reduction of $6/bo for 2025 and $7/bo for 2027 relative to the March STEO forecast. Also World demand for petroleum liquids has been reduced this month compared to last month.
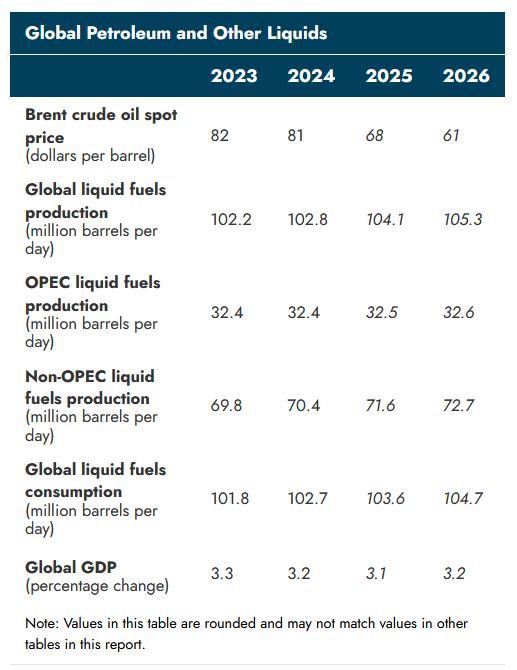
Demand for Global liquid fuels estimates fall in 2024, 2025, and 2026 compared to last month’s STEO, by 2026 World liquid fuels consumption is forecast at 104.7 Mb/d down from 105.3 Mb/d last month, World liquid fuels production is also lower at 105.3 Mb/d compared to 105.8 Mb/d forecast last month.
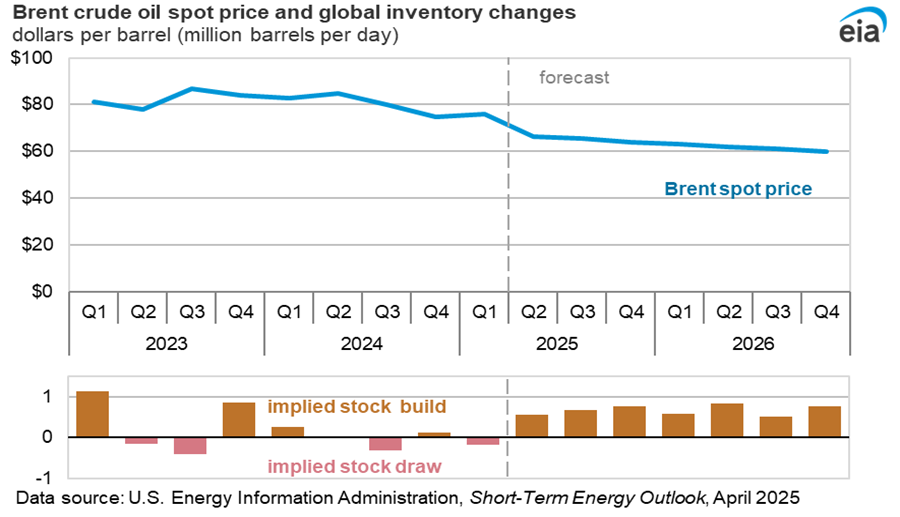
It is not clear why there would be an incentive to build stocks as suggested by the STEO forecast given the very low prices that are forecast in 2025 and 2026. If I were a producer I would hold back on production in hopes of higher prices.
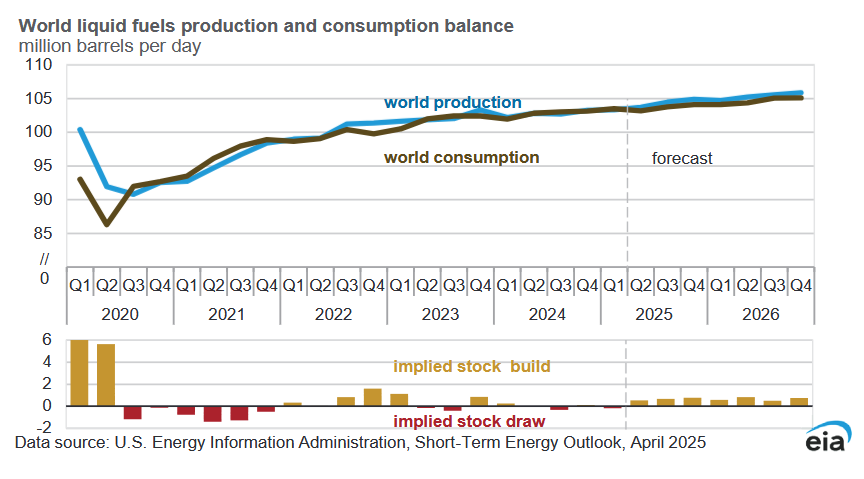
Note that the stock build in 2022 was due to high oil prices, falling prices usually lead to a draw in stocks like we saw in 2020H2 and all of 2021. The forecast for 2025 and 2026 looks wrong in this regard.
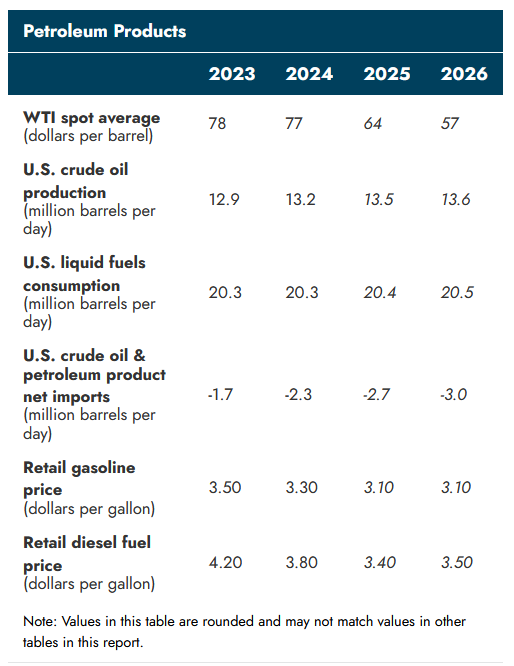
WTI is expected to fall to very low levels in 2026, $57/bo is $8/bo less than last month’s forecast. Growth is very slow in US C+C output in 2026 due to low oil prices, but if the price forecast is right the growth is probably too high, I would expect decline.
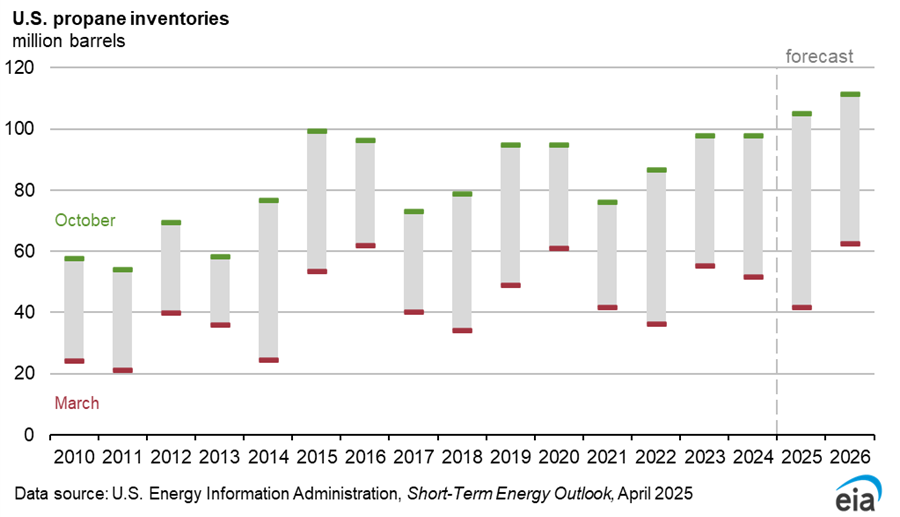
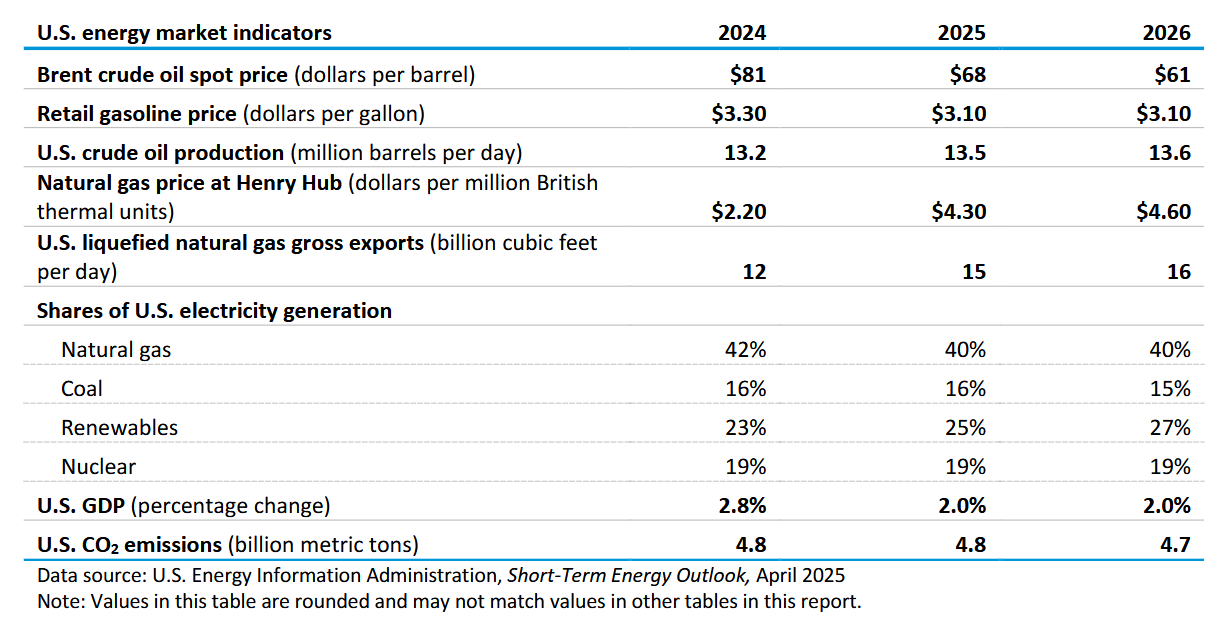
The tariffs imposed by China in retaliation to the Trump tariffs is expected to lead to fewer propane exports to China which will increase inventories and drive down propane prices in 2025 and 2026. Propane prices are expected to fall from 78 cents per gallon in 2024 to 52 cents per gallon in 2026 at current tariff levels.
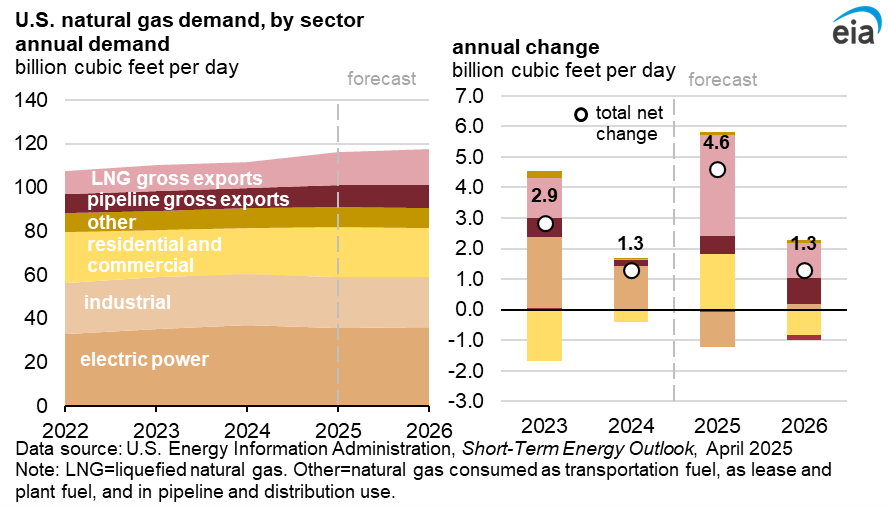
Natural gas demand is expected to grow in 2025 and 2026 with much of the demand coming from LNG exports with new export facilities ramping up more quickly than the STEO anticipated last month. Cooler weather than normal for 2025Q1 leads to higher demand growth from space heating in 2025.
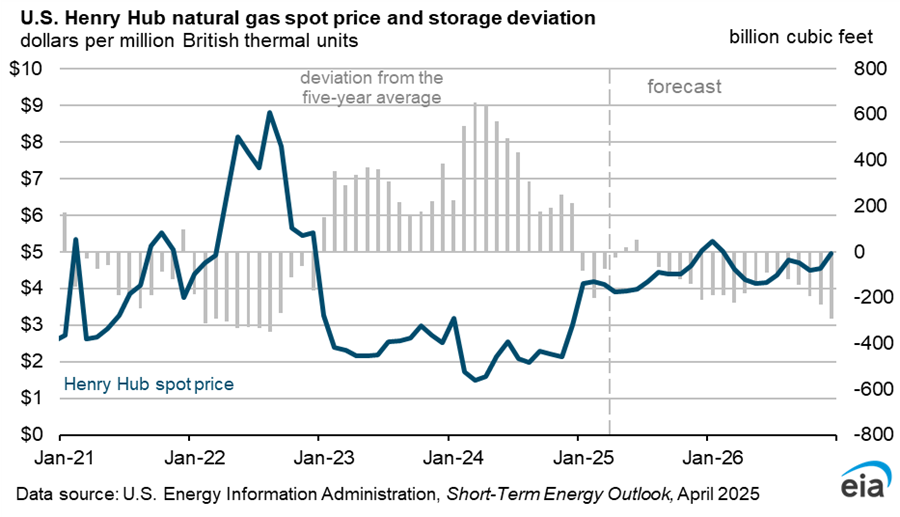
The EIA expects storage levels of natural gas to fall from May 2025 through December 2026 which keeps natural gas prices relatively high over that period.
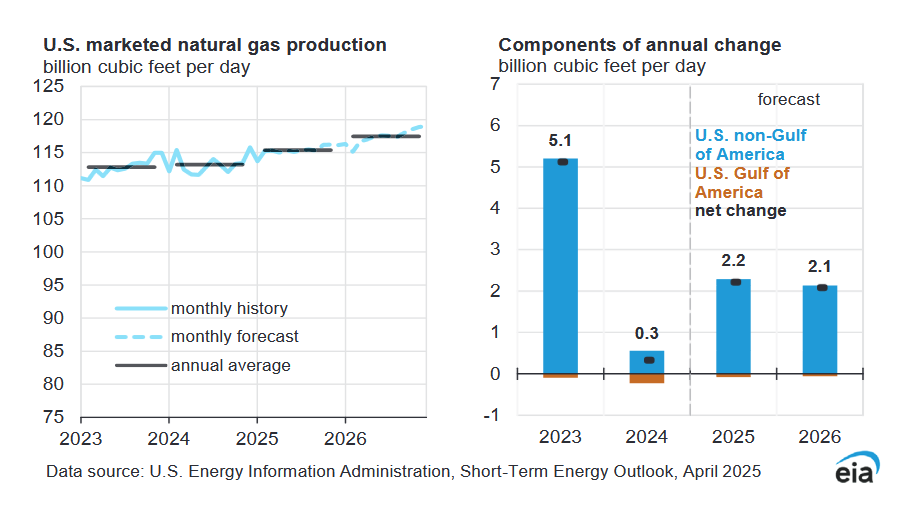
Higher natural gas prices lead to strong growth in output in 2025 and 2026 at 2.2 and 2.1 BCF/d respectively.
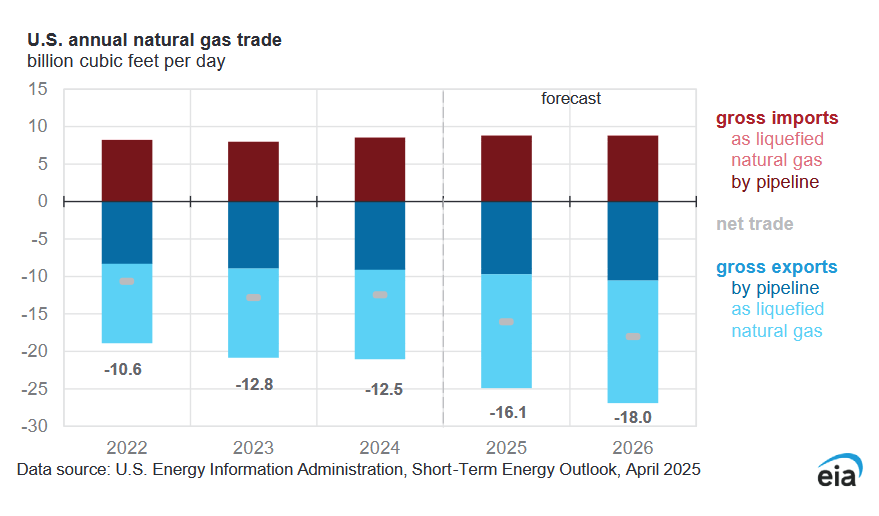
Net exports of natural gas are forecast to increase from 12.5 BCF/d in 2024 to 18 BCF/d in 2026.
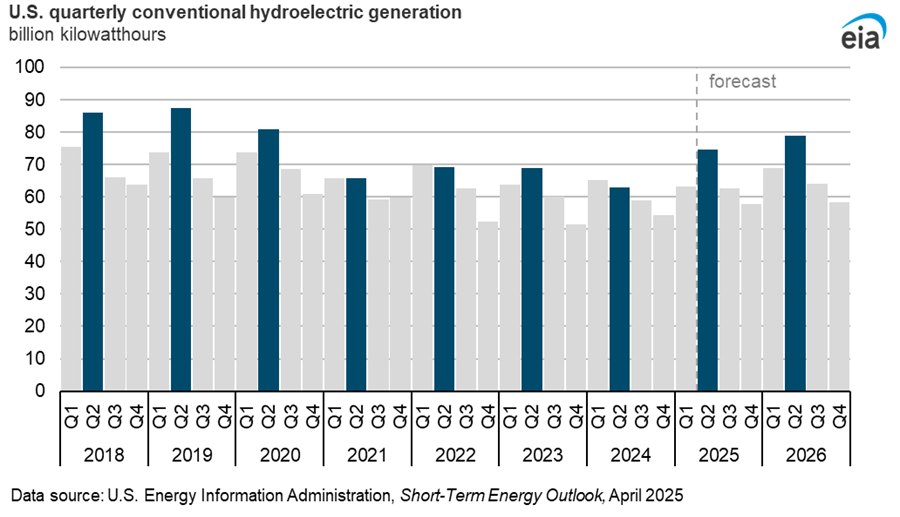
Typically power plants do annual maintanence in the spring and spring snow melt allows hydroelectric facilities to take up the slack during this period. Last spring a drought in the northwest US curtailed hydroelectric power, but this is forecast to rebound to normal levels in 2025 and 2026, obviously there is uncertainty depending on future rainfall and water demand.
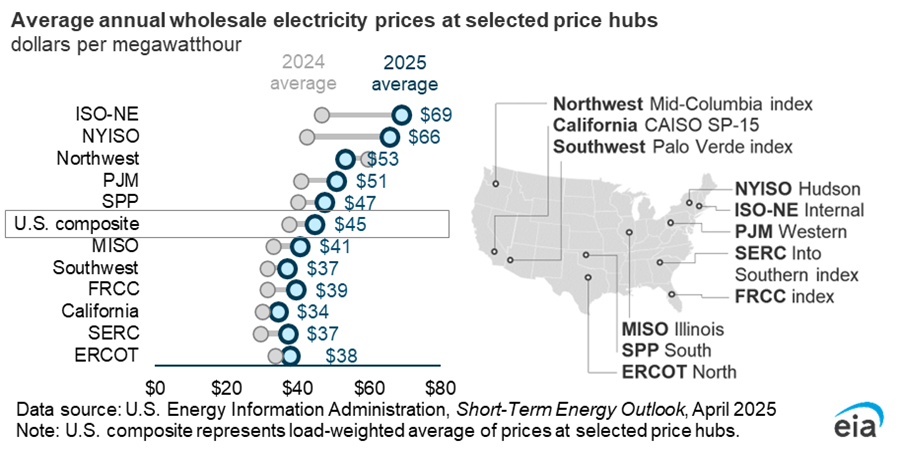
Higher natural gas prices are expected to raise wholesale power prices everywhere except the northwest in 2025 relative to 2024. The northwest had higher power prices than normal last year due to drought and lower hydro output.
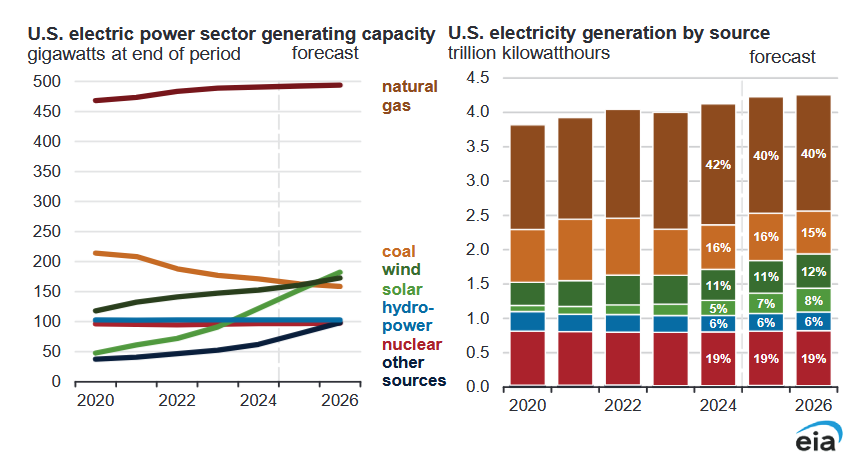
Looking at the right panel of the chart above, wind and solar combined output share of electric power output rises by 2% in 2025 and 2026 compared to previous year. Natural gas power share falls by 2% in 2025 and the coal power share falls by 1% in 2026.
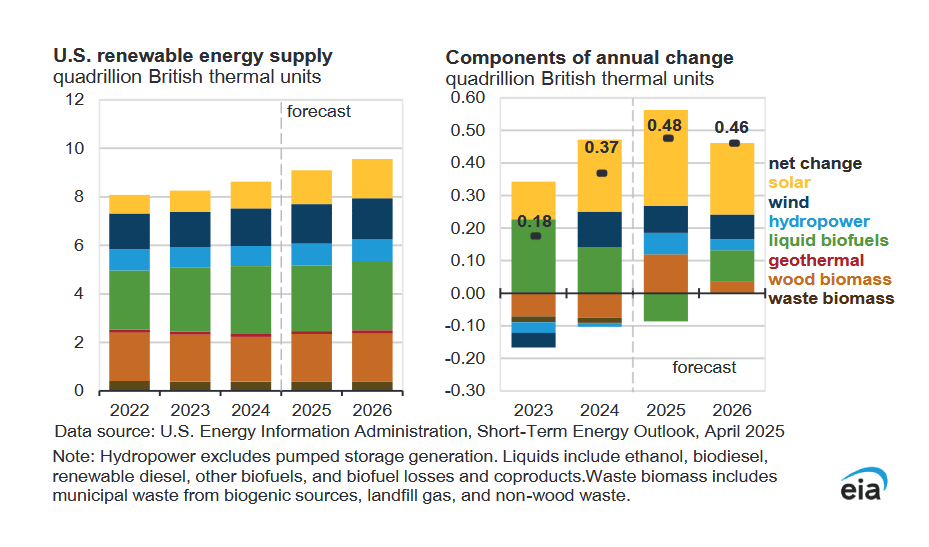
The annual change in renewable power output grows in 2025, but is somewhat lower in 2026, solar output growth is roughly half of the gain in 2025 and 2026. I would expect tariffs will put a dent in this growth along with Trump’s policies which tend to favor fossil fuel over non-fossil fuel (except nuclear power).
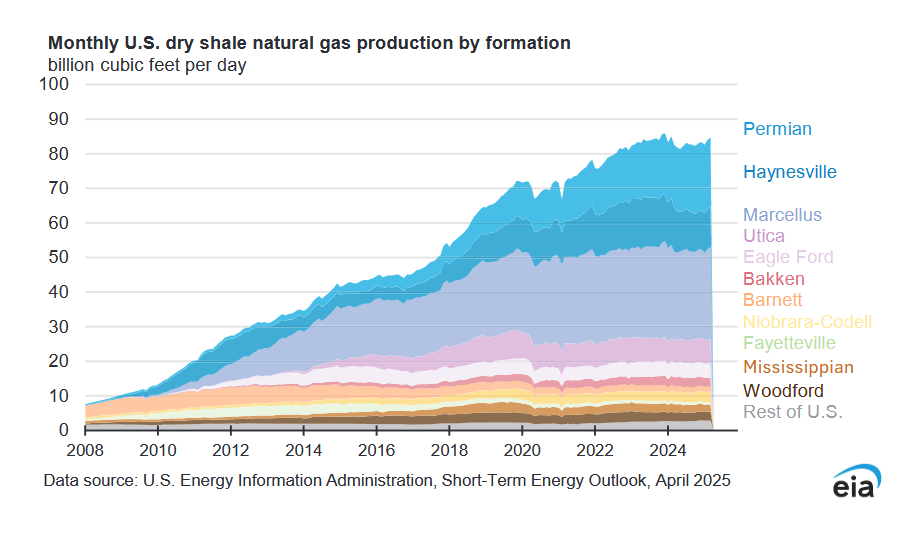
Much of the post pandemic growth in shale gas output has been from Haynesville and Permian.
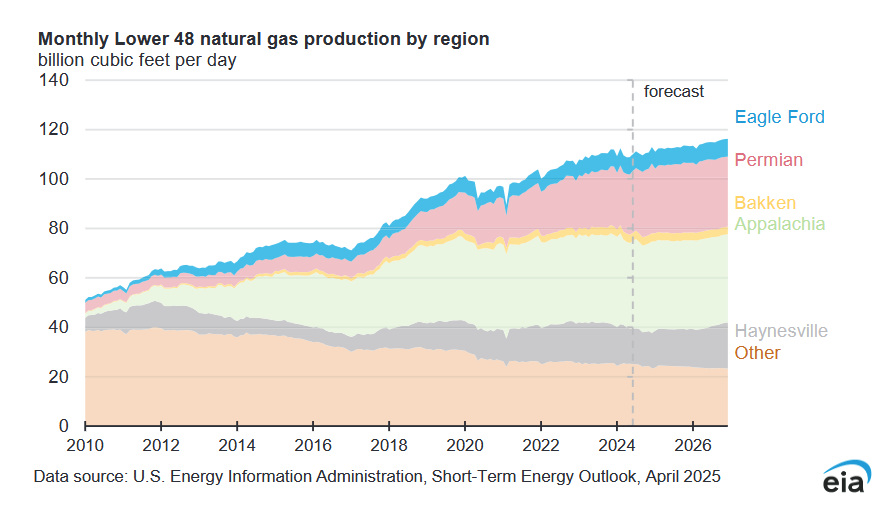
The chart above is marketed natural gas production (previous chart was dry shale gas only, NGL not included) for all of the L48 (Alaska excluded). The areas of the US besides the 5 main shale gas areas (other on the chart at the bottom) have seen falling natural gas output since about 2012.
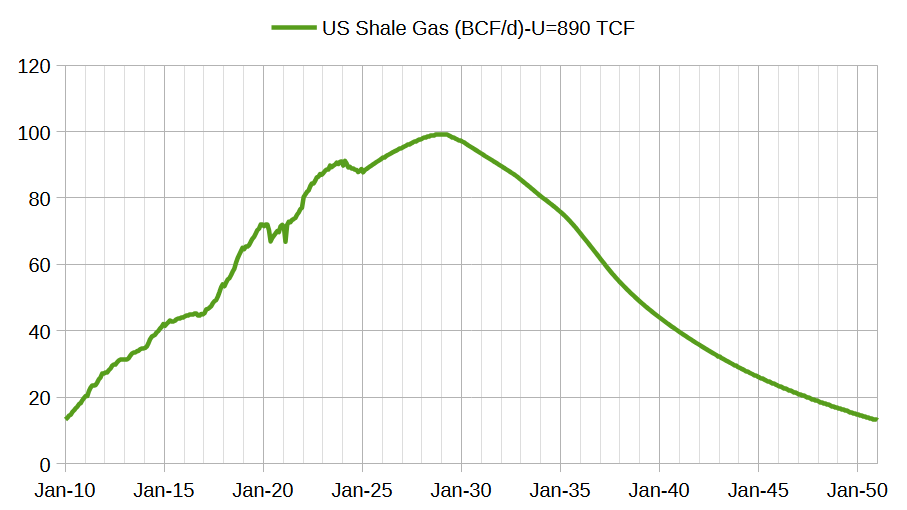
The scenario above is based on models of the Permian and Marcellus along with USGS mean TRR estimates for other shale gas and tight oil plays where I assume about 75% of the TRR mean estimate will be economically recoverable. The estimate may be too optimistic, much depends on future prices and demand for energy. The peak is in early 2029 at about 100 BCF/d. This scenario, if correct, will be a problem for LNG exporters unless US demand for natural gas falls.
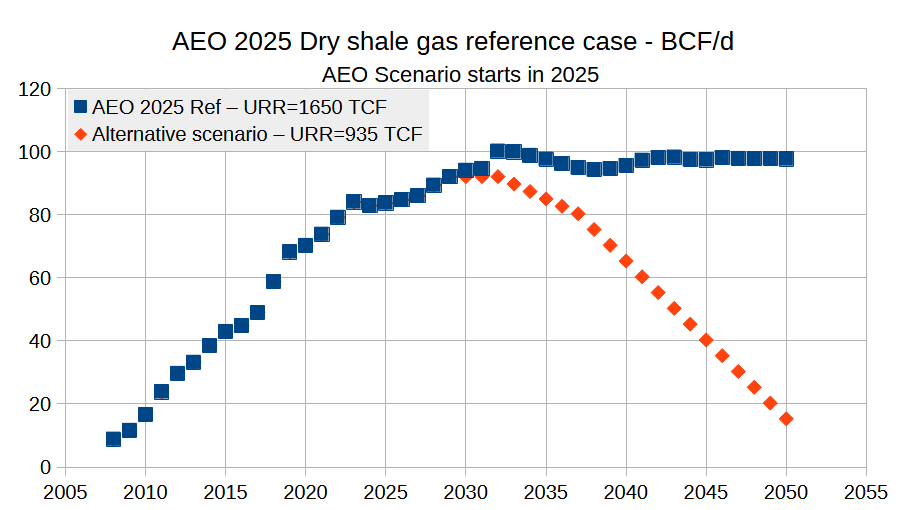
The chart above presents the EIA AEO 2025 reference scenario for dry shale gas from 2025 to 2050 along with the EIA estimate for dry shale gas output from 2008 to 2024. Also presented is an alternative scenario more in line with USGS resource estimates for shale gas. The AEO reference scenario has a URR of about 1650 TCF and the alternative scenario has a URR of 935 TCF, somewhat higher than my previous scenario, but probably within the margin of error (900 TCF +/- 50 TCF). The AEO reference case looks like a wish cast where any demand for natural gas is magically met.
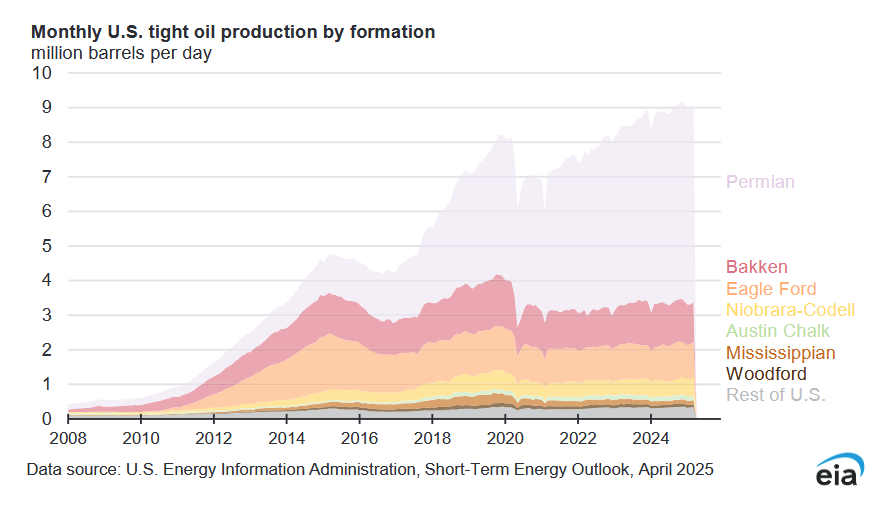
Most of the growth in tight oil output since 2020 has come from the Permian Basin.
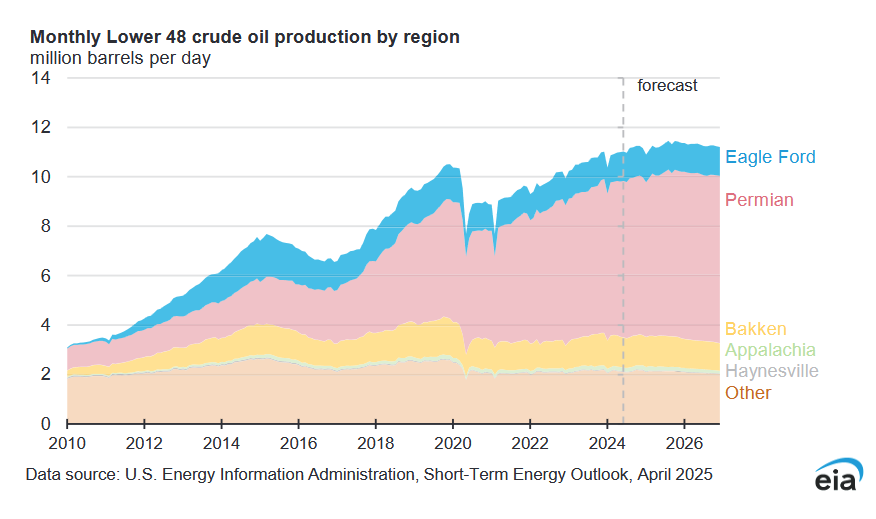
Over the forecast period Permian Basin growth slows to the point that it is no longer able to overcome declining output from the rest of the L48 starting in mid 2025. Part of the reason for decreasing output in this forecast is the very low oil prices expected in 2026 (average WTI spot price of $57/bo).
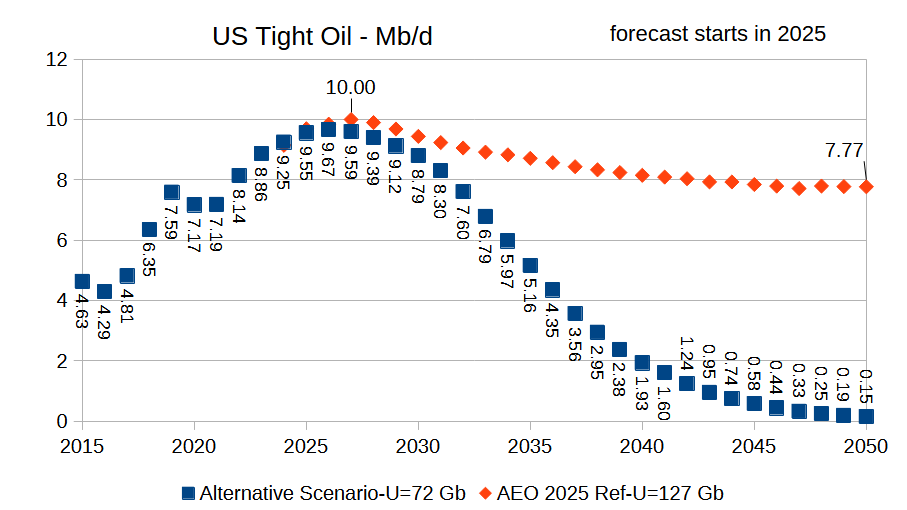
The chart above compares my recent tight oil forecast (starts in 2025) with the EIA’s AEO 2025 tight oil reference scenario from 2024 to 2050. My “alternative” scenario has a URR of 72 Gb and a peak in 2026 of 9.67 Mb/d. The AEO reference scenario has a URR of 127 Gb with a peak in 2027 at 10 Mb/d, again this looks like wishful thinking by the EIA, especially the 2030-2050 period.
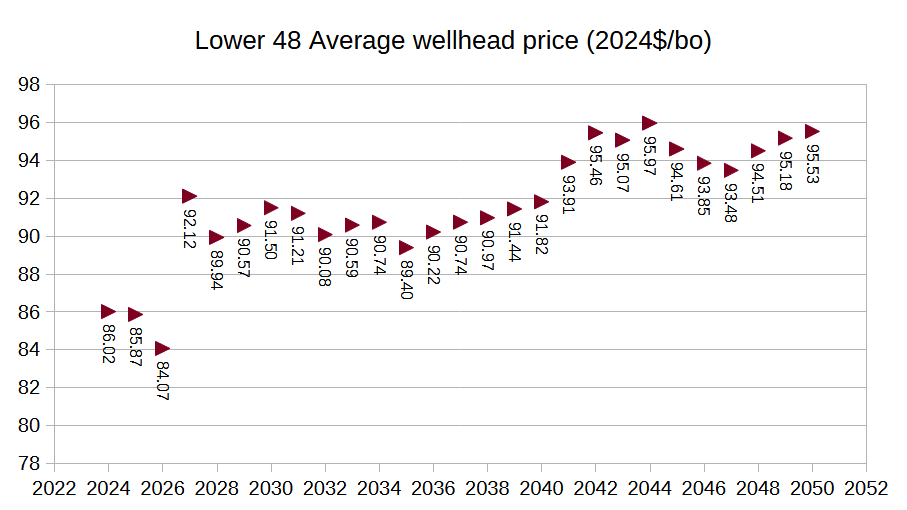
The chart above are the wellhead oil prices assumed for the AEO 2025 reference scenario, again based on today’s oil prices these prices seem far fetched, perhaps these are the prices needed to make their forecast happen, but very creative assumptions would be needed beyond these oil prices.
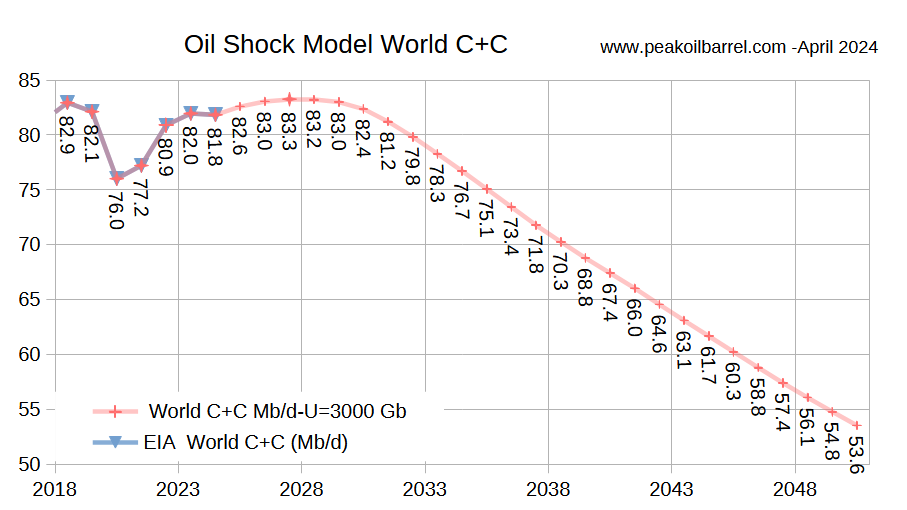
Using the updated tight oil scenario presented previously, this is my updated Oil Shock Model for the World where the extraction rate for conventional oil is assumed to rise gradually from 2025 to 2030 to about the same level as 2019 and remains constant from 2030 to 2040 and then decreases. The average decline rate from 2031 to 2050 is about 2.2% per year, URR is 3000 Gb for this scenario. Peak is in 2027 at 83.3 Mb/d, though there is a plateau from 2026 to 2029 and the peak could occur any of those years. In any case the scenario will be proven wrong in time as the future cannot be predicted.
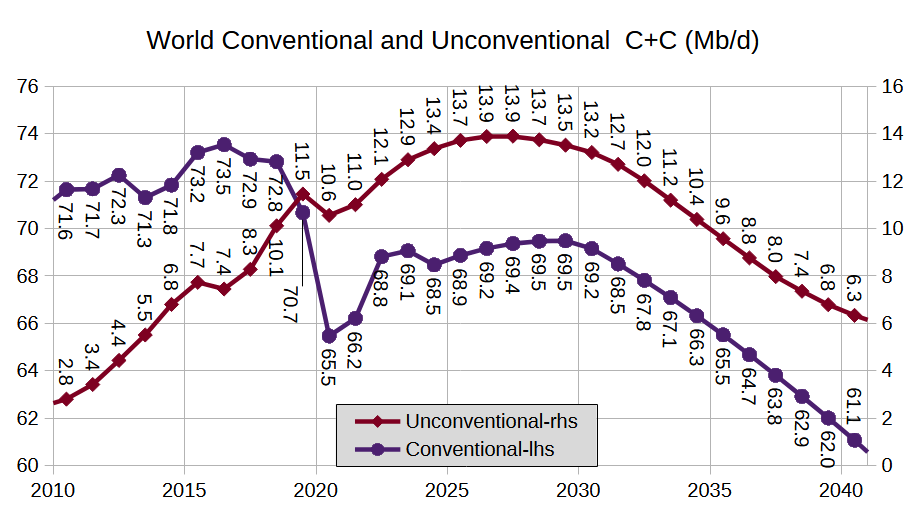
The chart above defines unconventional oil as tight oil plus extra heavy oil with API Gravity of 10 degrees or less (mostly Canadian Oil sands and Venezuelan Orinoco Belt output). Conventional Oil is all C+C that is not unconventional oil as just defined. The URR for unconventional oil in my scenario is 200 Gb and conventional oil has a URR of 2800 Gb.
Thanks for the work Dennis. Great work as usual.
Thanks Schinzy.
Frac Spread Report for the Week Ending April 18
The frac spread count rose by 5 to 200. It is also down 60 from one year ago and down by 15 spreads since March 28.
Dennis
Nice job. As usual you cover a lot of ground in this update.
WRT to the Permian you state: “Part of the reason for decreasing output in this forecast is the very low oil prices expected in 2026 (average WTI spot price of $57/bo).”
While that may be true, I think the monthly county data from Texas and New Mexico are currently showing the same slowing trend in production growth which I think is more related to geology. The next two or three months will confirm whether the Permian is on a plateau or still has a bit of growth left.
Many of us believe the current low price for WTI is not encouraging drilling and completions. We will have to continue to track the rig and frac count to get an idea if WTI at $63/b is really affecting these activities.
Ovi,
Both can be true. We will only know if higher prices have any affect when prices are higher. I agree we will know more in a few months.
Ovi,
Thanks.
In the sentence you quoted, I was referring to the L48 forecast rather than the Permian specifically. On an annual average basis, Permian output is slightly higher in 2026 than 2025, but this is not the case for the L48 because non-Permian decline is larger than the increase in Permian output. Much depends on future prices and if the STEO price forecast is correct, I think Permian and L48 output will be lower than the EIA has forecast. I don’t think their oil price forecast is very good. My expectation is oil price in 2025 averaging about $68/b and maybe $70/b in 2026, I think Permian output will be on a very slow increase at these prices to about 6200 kb/d by late 2026. See comment below for a chart with my most recent guess for Permian tight oil.
Permian tight oil scenario, kbo/d, centered 12 month average (CTMA), October 2026 is the peak for CTMA for this scenario (URR=39 Gb) at 6194 kb/d, December 2024 output was 5986 kb/d (monthly output not 12 month average). The centered 12 month average for July 2026 is 6188 kb/d (July 2024 and July 2025 also shown on chart).
https://www.dailymail.co.uk/sciencetech/article-14625503/Texas-rocked-multiple-earthquakes-24-hours.html
Great work D C!
Texas rocked by multiple earthquakes.
“While West Texas has several fault lines, the earthquakes were likely caused by induced seismicity—earthquakes triggered by human activities, particularly oil and gas operations.
Those operations cause quakes mainly through wastewater injection, increasing underground pressure and lubricating faults, making them more likely to slip.”
Thanks Andre.
The big thing that struck me is how close we are to the end of the plateau, in 5 years it will be clear that we are past peak as World C plus C output starts to decline in earnest at 2.2% per year. Oil prices will go up, but I do not think it will affect the annual decline rate significantly. The world will lose 30 Mb/d of C plus C output over a 20 year period, yikes.
Indeed.
In the US we will need to get on with the replacement our vehicle fleet, even if it means buying much of the components from our big business partner China. We are increasingly behind schedule on this.
Is there a better time, politically or economically, to refill the Strategic petroleum Reserve?
Hopefully it would become a piggy bank that would remain untapped indefinitely, but I suspect there will be imperative to tap into it sometime in the 2030’sor 40’s.
Scope of your report is most impressive Dennis. Thank you.
Thank you Hickory.
So we are actually peaking as we speak or very soon? While there’s clear signs of already decline or soon to decline quite rapidly in areas and countries like Gulf of Mexico, Mexico, Norway, and the world’s largest conventional oil field Ghawar, there’s some growth from Argentina (shale/tight oil), Guyana, still growth in Canada, Iran and Venezuela can grow a lot if there’s a revolution and regime change towards Western-friendly governments with sanctions removal, and OPEC+ is supposed to have some spare capacity, though the exact number is hard to be certain of. I’m from Norway, and I’m pretty sure both our oil and gas production is about to go off a cliff as we haven’t found any new large fields to offset the coming declines in the Troll (gas) and Johan Sverdrup (oil) fields.
“….in areas and countries like Gulf of Mexico”. Er, do you mean the Gulf of America?
Mike,
No he means the Gulf of Mexico, Norway is not bound by Trump’s executive orders, I also continue to call it the Gulf of Mexico.
My lastest Permian tight oil estimate based on current RRC, OCD and EIA data, Novi estimate through Dec 2022 also used (data published in April 2024).