The EIA Short Term Energy Outlook (STEO) was published recently. An estimate for World C+C output from 2018 to 2026, with forecast values for 2025 to 2026 based on the recent STEO in chart below. The estimate for World C+C is based on World C+C minus US C+C from the EIA’s International Energy Statistics and World crude minus US Crude as reported in the April STEO to find World minus US condensate output. The trend for the condensate data from Jan 2020 to December 2024 was used to project condensate from Jan 2025 to December 2026 for World minus US and then the forecast for US C+C was added to the World minus US crude forecast along with the condensate forecast to arrive at World C+C.

World C+C increases by 2040 kb/d from 2024 to 2026 an annual increase of 1020 kb/d. The growth rate looks optimistic especially when the low prices of the STEO forecast are considered. Last month’s estimates were 81701, 82677, and 83843 for 2024, 2025 and 2026 respectively, so the estimates are all higher this month compared to last month. I think the EIA forecast for 2025 and 2026 will be too high, my guess is 82580 kb/d for 2025 and 83040 kb/d for 2026.
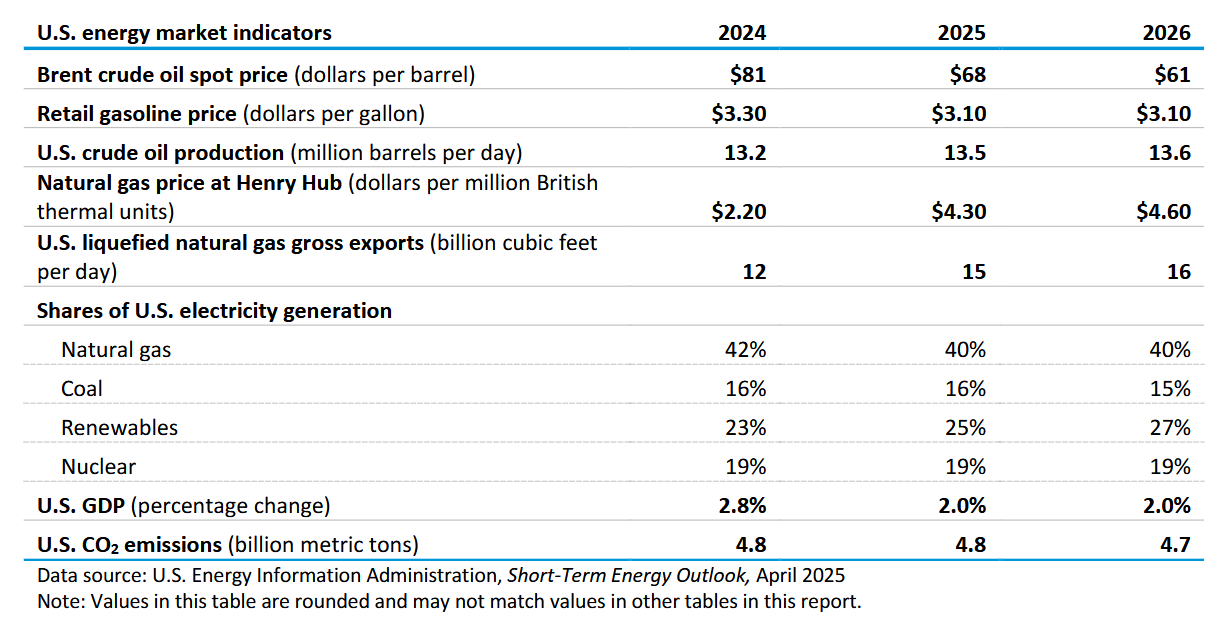
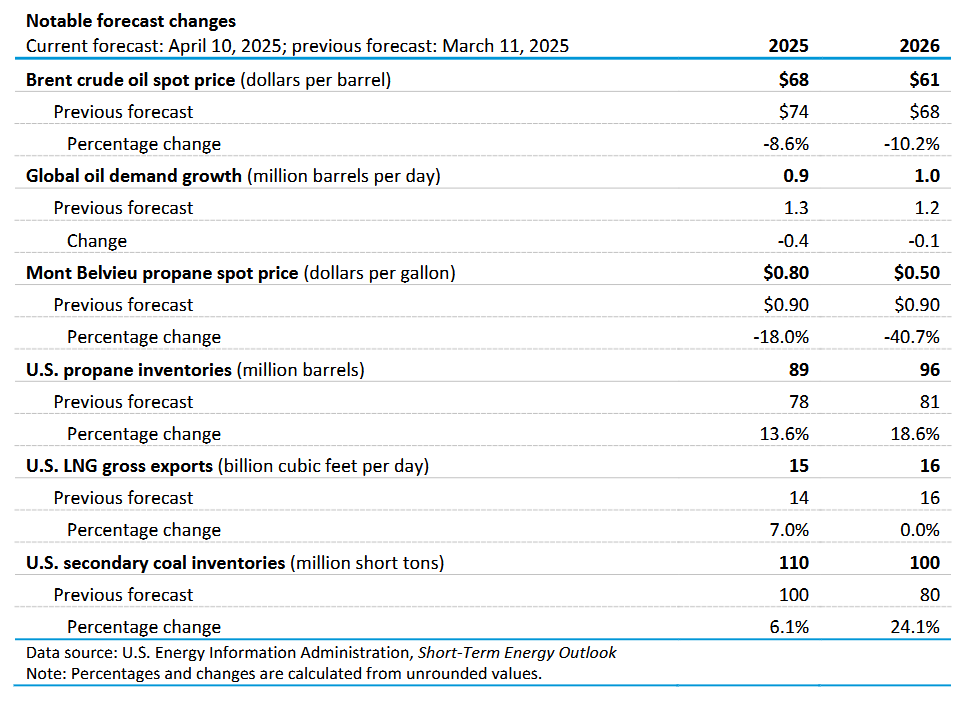
There has been a significant reduction in the forecast for future oil prices in 2025 and 2026 compared to last month a reduction of $6/bo for 2025 and $7/bo for 2027 relative to the March STEO forecast. Also World demand for petroleum liquids has been reduced this month compared to last month.
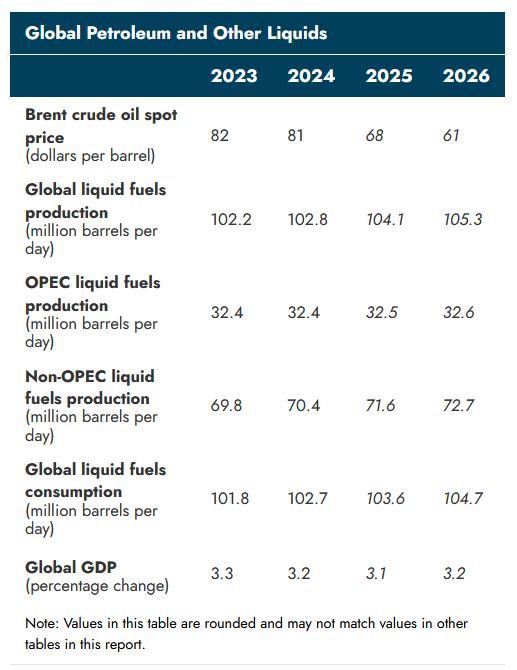
Demand for Global liquid fuels estimates fall in 2024, 2025, and 2026 compared to last month’s STEO, by 2026 World liquid fuels consumption is forecast at 104.7 Mb/d down from 105.3 Mb/d last month, World liquid fuels production is also lower at 105.3 Mb/d compared to 105.8 Mb/d forecast last month.
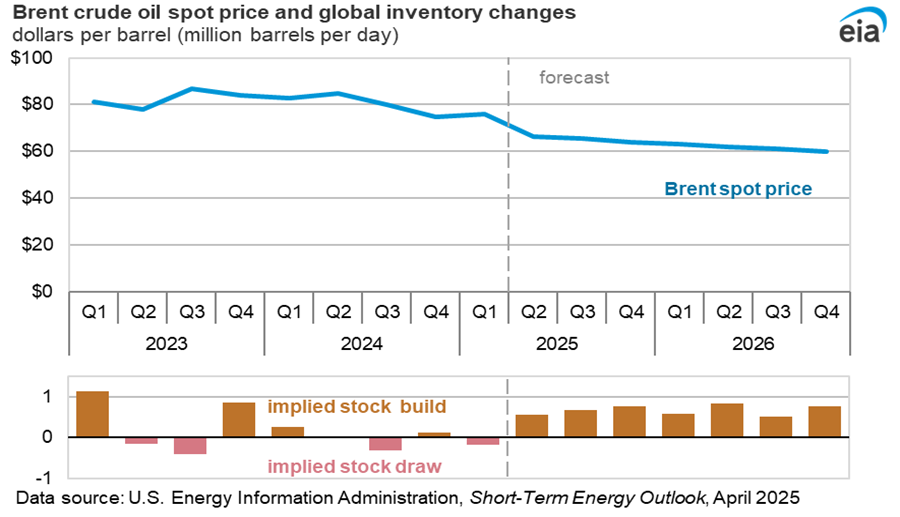
It is not clear why there would be an incentive to build stocks as suggested by the STEO forecast given the very low prices that are forecast in 2025 and 2026. If I were a producer I would hold back on production in hopes of higher prices.
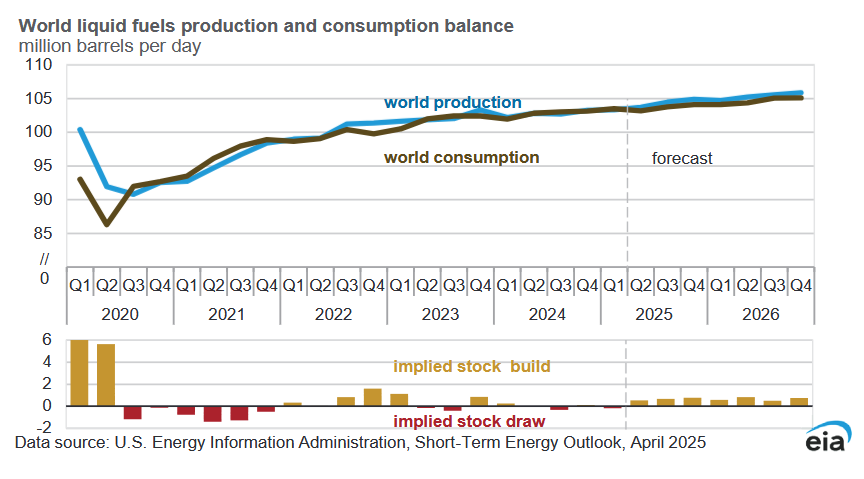
Note that the stock build in 2022 was due to high oil prices, falling prices usually lead to a draw in stocks like we saw in 2020H2 and all of 2021. The forecast for 2025 and 2026 looks wrong in this regard.
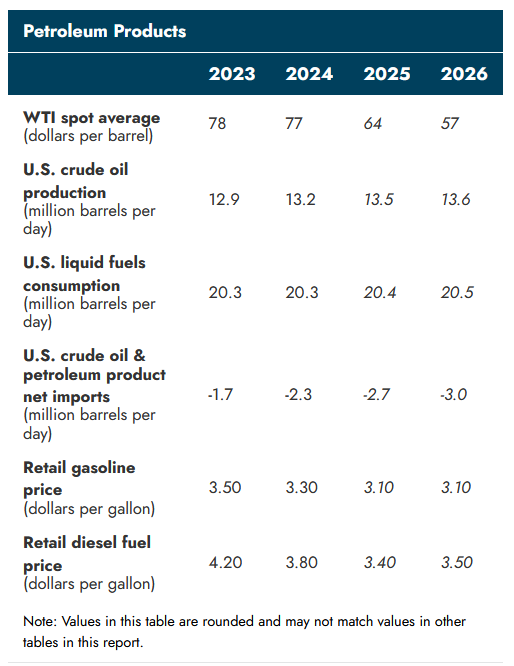
WTI is expected to fall to very low levels in 2026, $57/bo is $8/bo less than last month’s forecast. Growth is very slow in US C+C output in 2026 due to low oil prices, but if the price forecast is right the growth is probably too high, I would expect decline.
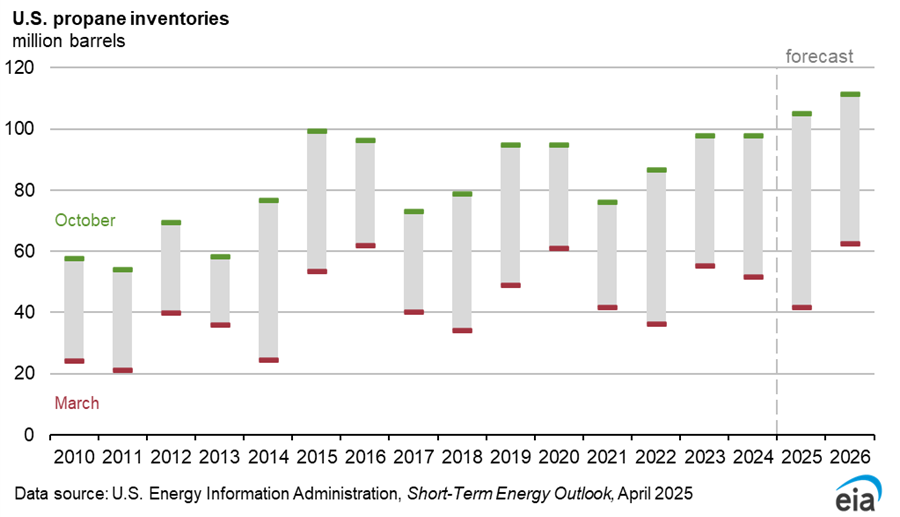
The tariffs imposed by China in retaliation to the Trump tariffs is expected to lead to fewer propane exports to China which will increase inventories and drive down propane prices in 2025 and 2026. Propane prices are expected to fall from 78 cents per gallon in 2024 to 52 cents per gallon in 2026 at current tariff levels.
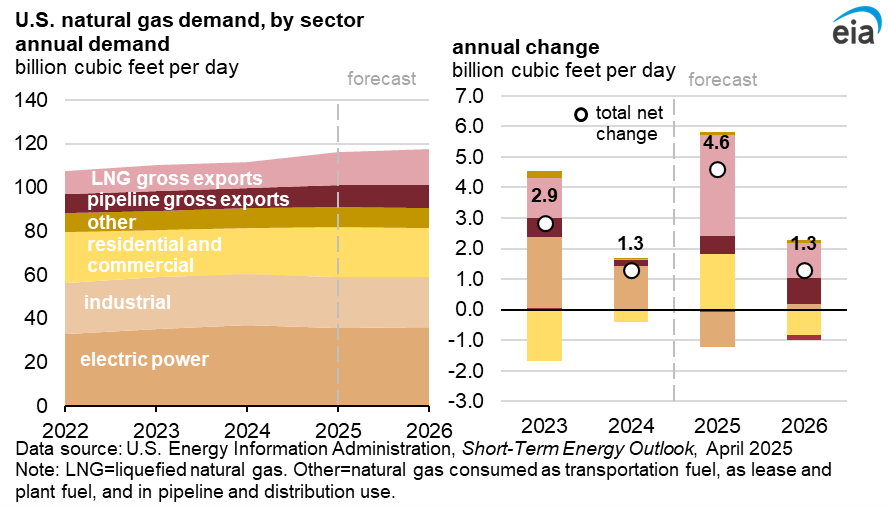
Natural gas demand is expected to grow in 2025 and 2026 with much of the demand coming from LNG exports with new export facilities ramping up more quickly than the STEO anticipated last month. Cooler weather than normal for 2025Q1 leads to higher demand growth from space heating in 2025.
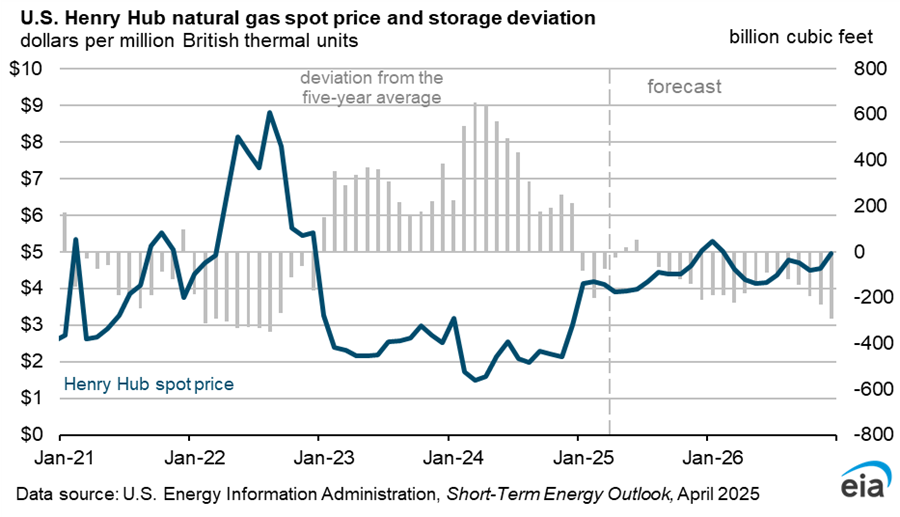
The EIA expects storage levels of natural gas to fall from May 2025 through December 2026 which keeps natural gas prices relatively high over that period.
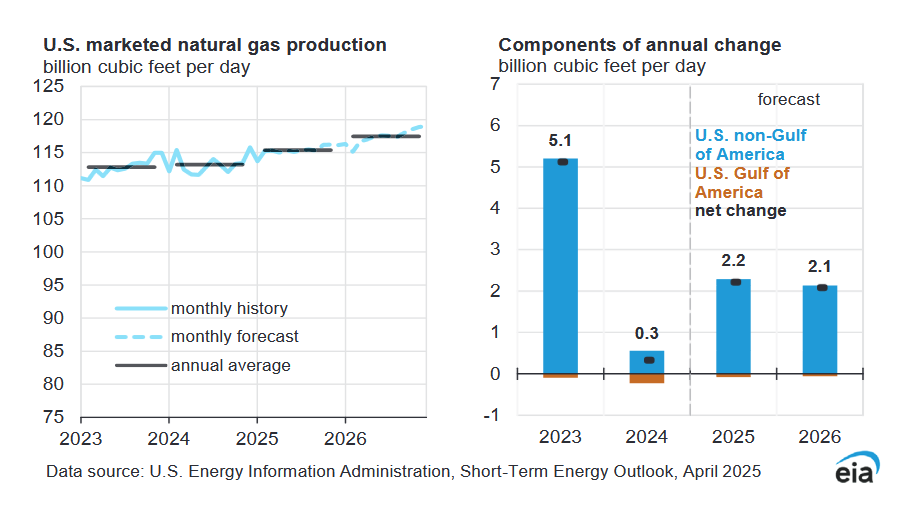
Higher natural gas prices lead to strong growth in output in 2025 and 2026 at 2.2 and 2.1 BCF/d respectively.
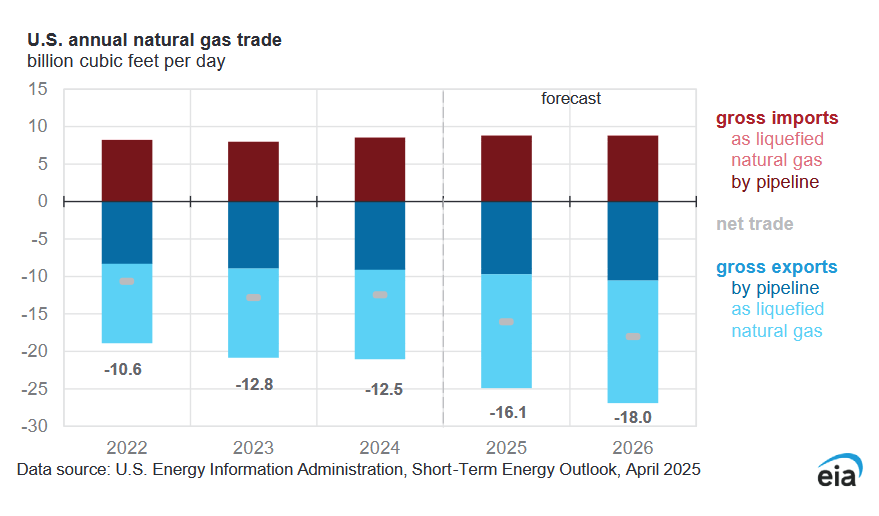
Net exports of natural gas are forecast to increase from 12.5 BCF/d in 2024 to 18 BCF/d in 2026.
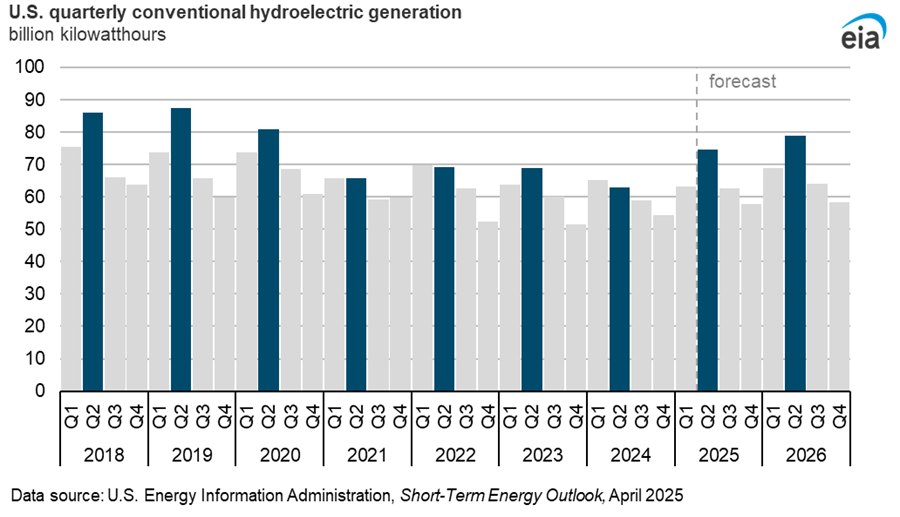
Typically power plants do annual maintanence in the spring and spring snow melt allows hydroelectric facilities to take up the slack during this period. Last spring a drought in the northwest US curtailed hydroelectric power, but this is forecast to rebound to normal levels in 2025 and 2026, obviously there is uncertainty depending on future rainfall and water demand.
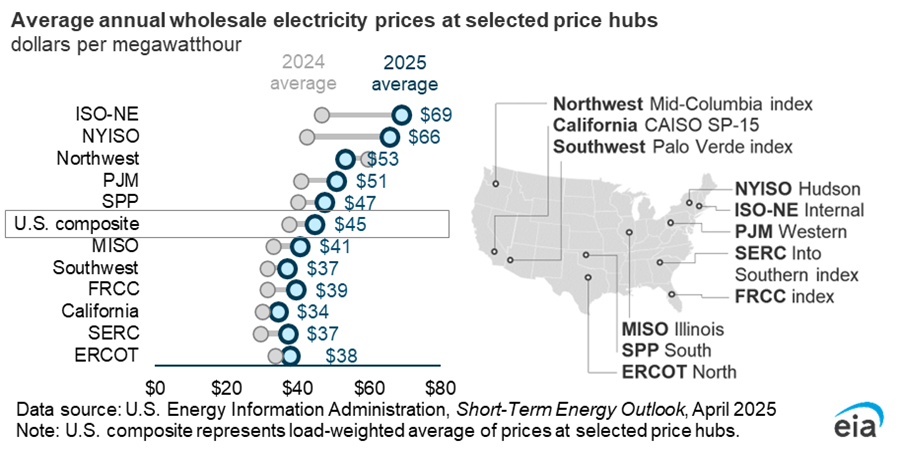
Higher natural gas prices are expected to raise wholesale power prices everywhere except the northwest in 2025 relative to 2024. The northwest had higher power prices than normal last year due to drought and lower hydro output.
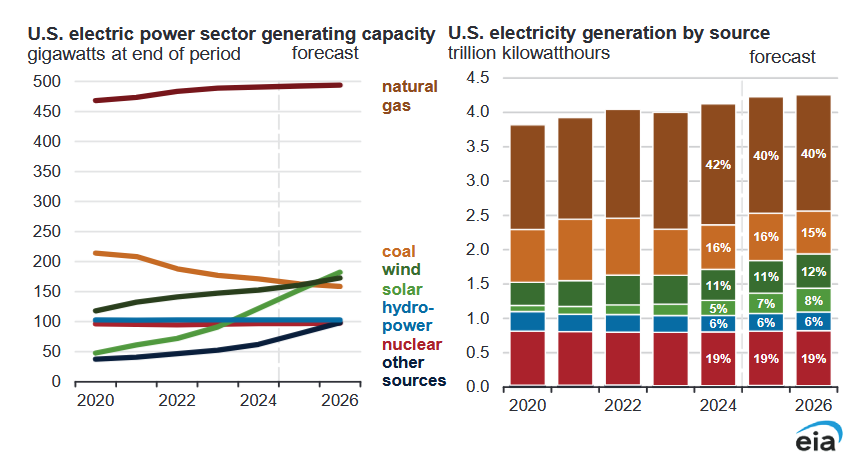
Looking at the right panel of the chart above, wind and solar combined output share of electric power output rises by 2% in 2025 and 2026 compared to previous year. Natural gas power share falls by 2% in 2025 and the coal power share falls by 1% in 2026.
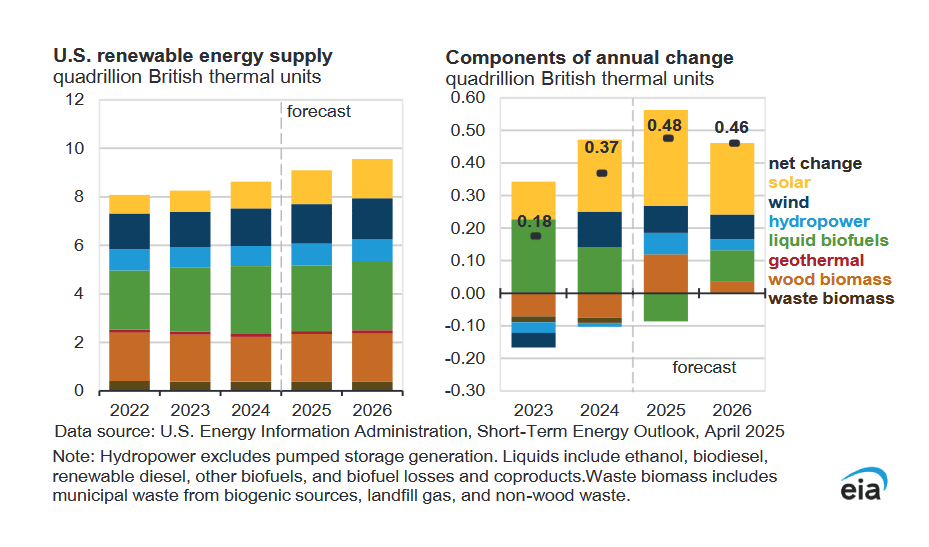
The annual change in renewable power output grows in 2025, but is somewhat lower in 2026, solar output growth is roughly half of the gain in 2025 and 2026. I would expect tariffs will put a dent in this growth along with Trump’s policies which tend to favor fossil fuel over non-fossil fuel (except nuclear power).
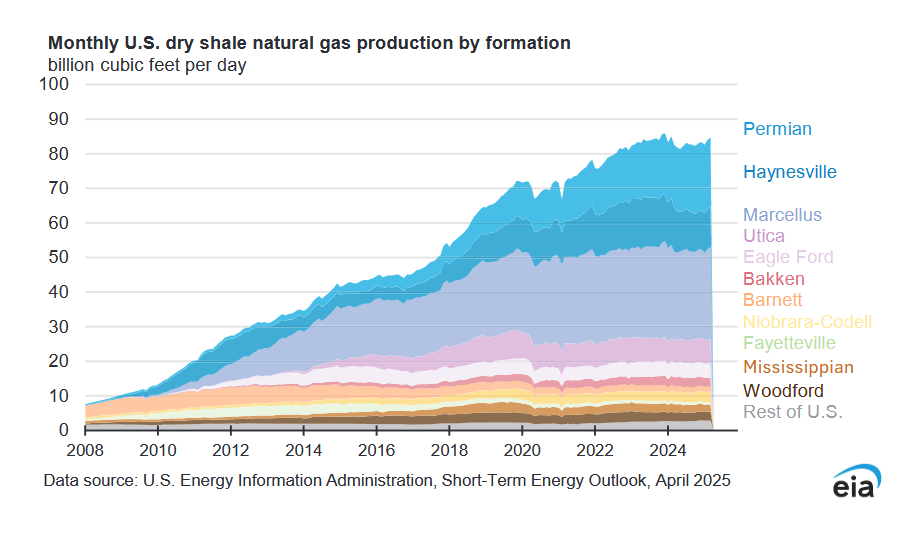
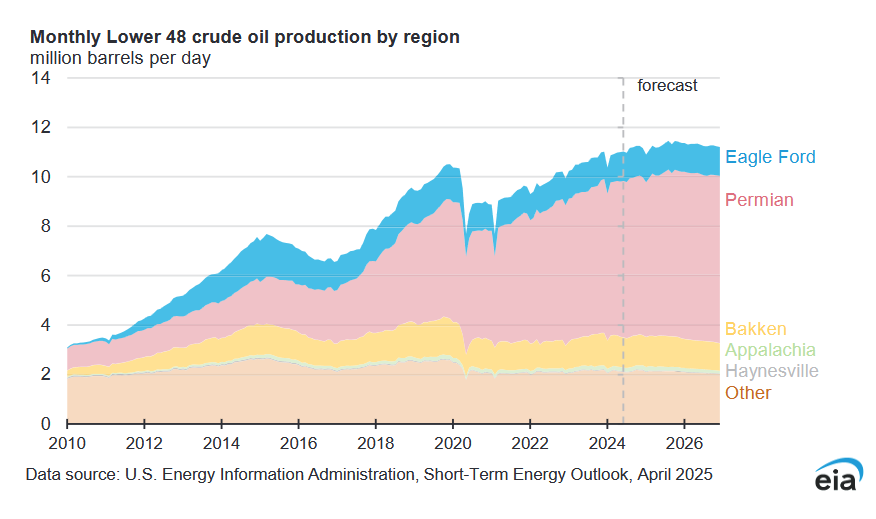
Much of the post pandemic growth in shale gas output has been from Haynesville and Permian.
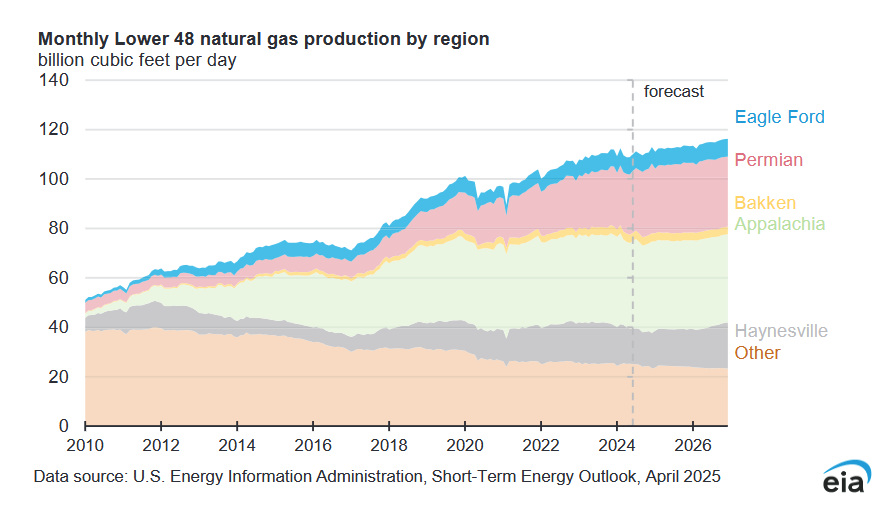
The chart above is marketed natural gas production (previous chart was dry shale gas only, NGL not included) for all of the L48 (Alaska excluded). The areas of the US besides the 5 main shale gas areas (other on the chart at the bottom) have seen falling natural gas output since about 2012.
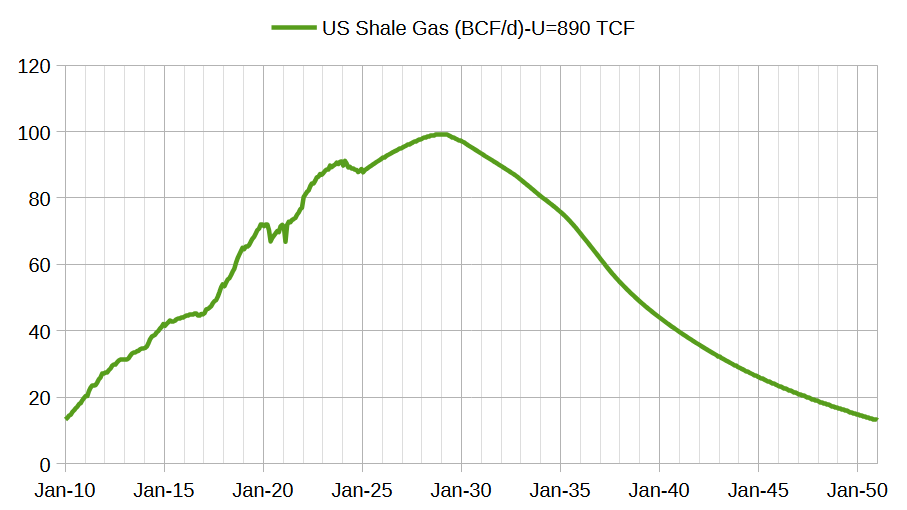
The scenario above is based on models of the Permian and Marcellus along with USGS mean TRR estimates for other shale gas and tight oil plays where I assume about 75% of the TRR mean estimate will be economically recoverable. The estimate may be too optimistic, much depends on future prices and demand for energy. The peak is in early 2029 at about 100 BCF/d. This scenario, if correct, will be a problem for LNG exporters unless US demand for natural gas falls.
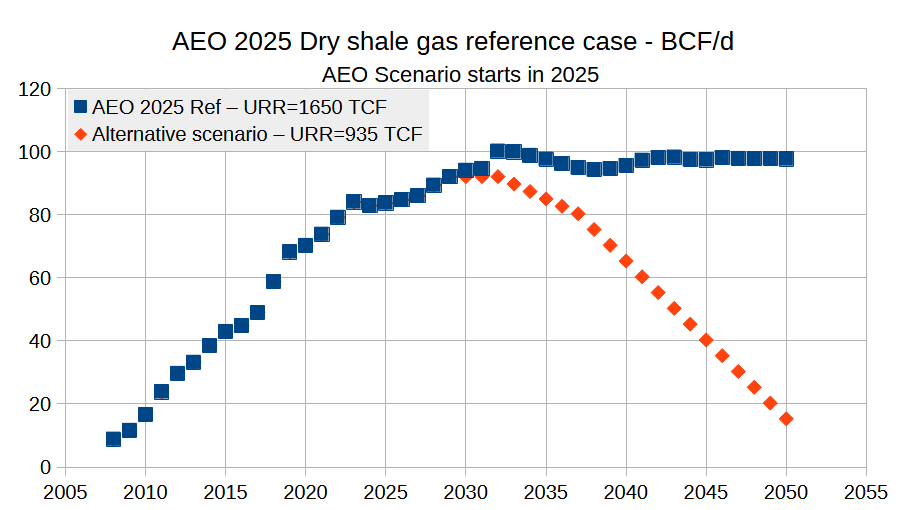
The chart above presents the EIA AEO 2025 reference scenario for dry shale gas from 2025 to 2050 along with the EIA estimate for dry shale gas output from 2008 to 2024. Also presented is an alternative scenario more in line with USGS resource estimates for shale gas. The AEO reference scenario has a URR of about 1650 TCF and the alternative scenario has a URR of 935 TCF, somewhat higher than my previous scenario, but probably within the margin of error (900 TCF +/- 50 TCF). The AEO reference case looks like a wish cast where any demand for natural gas is magically met.
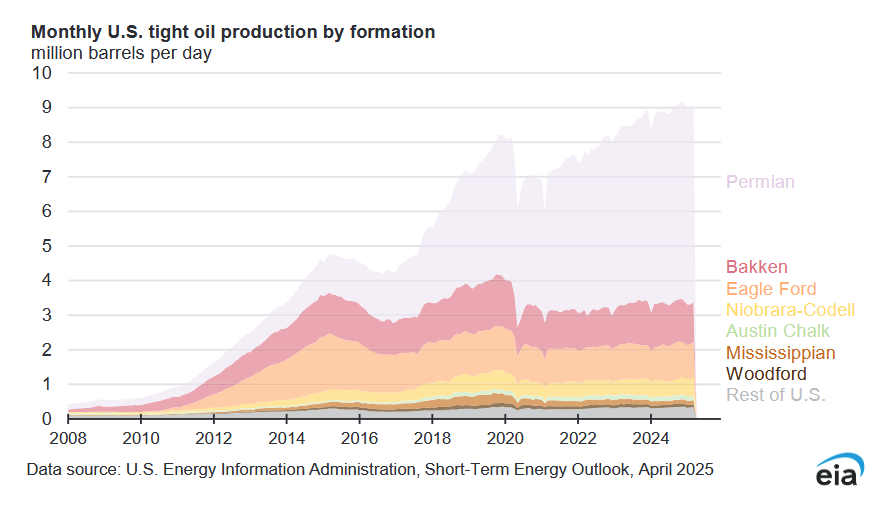
Most of the growth in tight oil output since 2020 has come from the Permian Basin.
Over the forecast period Permian Basin growth slows to the point that it is no longer able to overcome declining output from the rest of the L48 starting in mid 2025. Part of the reason for decreasing output in this forecast is the very low oil prices expected in 2026 (average WTI spot price of $57/bo).
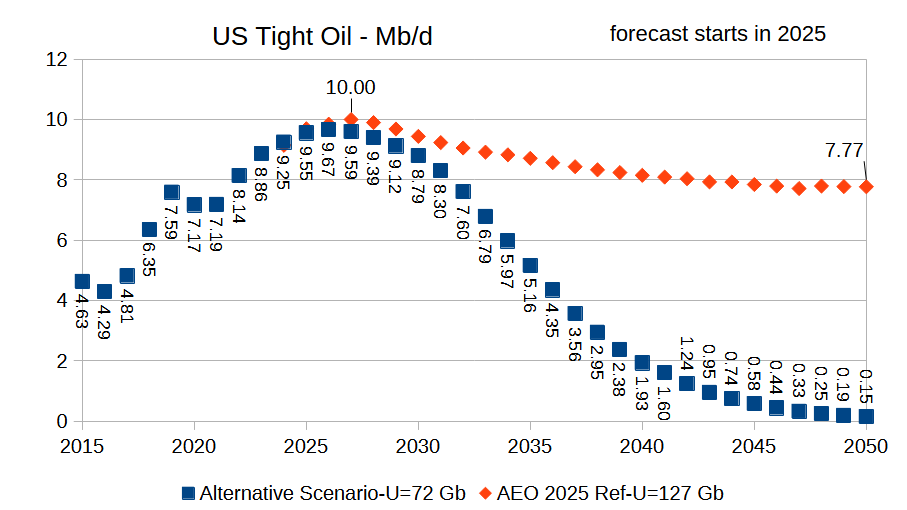
The chart above compares my recent tight oil forecast (starts in 2025) with the EIA’s AEO 2025 tight oil reference scenario from 2024 to 2050. My “alternative” scenario has a URR of 72 Gb and a peak in 2026 of 9.67 Mb/d. The AEO reference scenario has a URR of 127 Gb with a peak in 2027 at 10 Mb/d, again this looks like wishful thinking by the EIA, especially the 2030-2050 period.
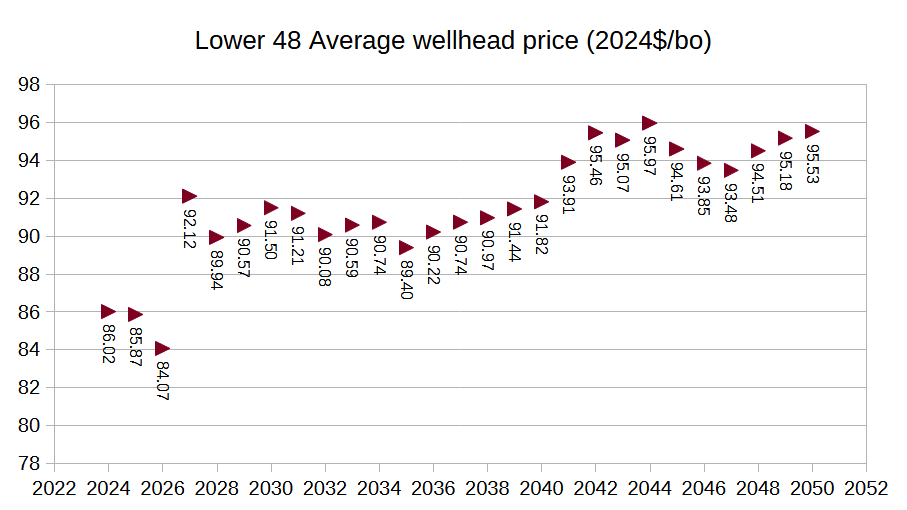
The chart above are the wellhead oil prices assumed for the AEO 2025 reference scenario, again based on today’s oil prices these prices seem far fetched, perhaps these are the prices needed to make their forecast happen, but very creative assumptions would be needed beyond these oil prices.
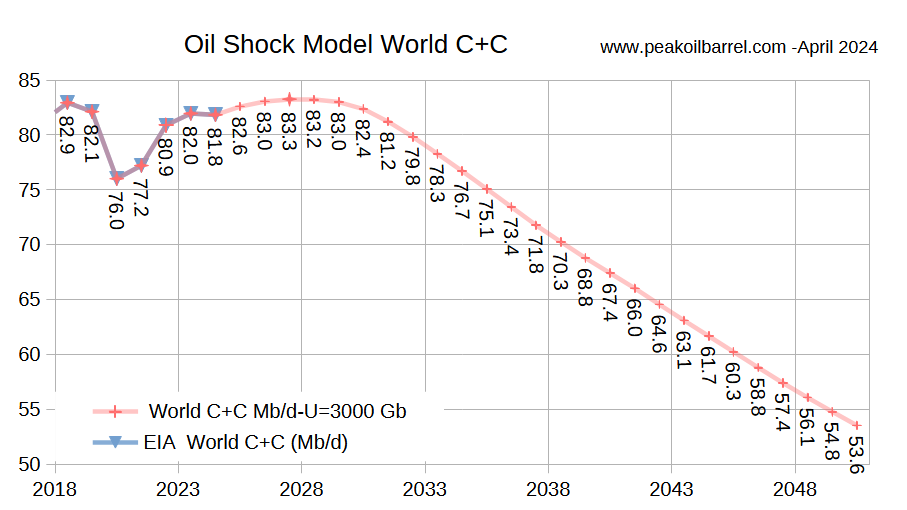
Using the updated tight oil scenario presented previously, this is my updated Oil Shock Model for the World where the extraction rate for conventional oil is assumed to rise gradually from 2025 to 2030 to about the same level as 2019 and remains constant from 2030 to 2040 and then decreases. The average decline rate from 2031 to 2050 is about 2.2% per year, URR is 3000 Gb for this scenario. Peak is in 2027 at 83.3 Mb/d, though there is a plateau from 2026 to 2029 and the peak could occur any of those years. In any case the scenario will be proven wrong in time as the future cannot be predicted.
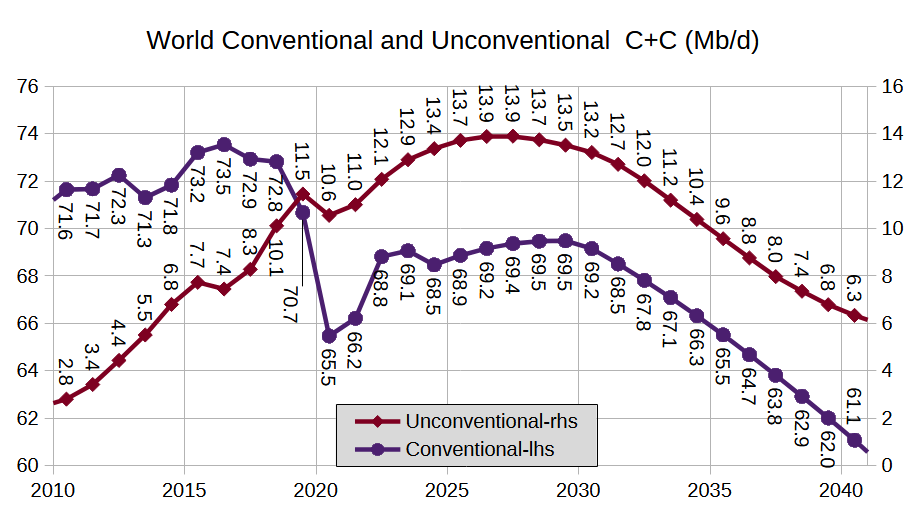
The chart above defines unconventional oil as tight oil plus extra heavy oil with API Gravity of 10 degrees or less (mostly Canadian Oil sands and Venezuelan Orinoco Belt output). Conventional Oil is all C+C that is not unconventional oil as just defined. The URR for unconventional oil in my scenario is 200 Gb and conventional oil has a URR of 2800 Gb.
Thanks for the work Dennis. Great work as usual.
Thanks Schinzy.
Frac Spread Report for the Week Ending April 18
The frac spread count rose by 5 to 200. It is also down 60 from one year ago and down by 15 spreads since March 28.
Dennis
Nice job. As usual you cover a lot of ground in this update.
WRT to the Permian you state: “Part of the reason for decreasing output in this forecast is the very low oil prices expected in 2026 (average WTI spot price of $57/bo).”
While that may be true, I think the monthly county data from Texas and New Mexico are currently showing the same slowing trend in production growth which I think is more related to geology. The next two or three months will confirm whether the Permian is on a plateau or still has a bit of growth left.
Many of us believe the current low price for WTI is not encouraging drilling and completions. We will have to continue to track the rig and frac count to get an idea if WTI at $63/b is really affecting these activities.
Ovi,
Both can be true. We will only know if higher prices have any affect when prices are higher. I agree we will know more in a few months.
Ovi,
Thanks.
In the sentence you quoted, I was referring to the L48 forecast rather than the Permian specifically. On an annual average basis, Permian output is slightly higher in 2026 than 2025, but this is not the case for the L48 because non-Permian decline is larger than the increase in Permian output. Much depends on future prices and if the STEO price forecast is correct, I think Permian and L48 output will be lower than the EIA has forecast. I don’t think their oil price forecast is very good. My expectation is oil price in 2025 averaging about $68/b and maybe $70/b in 2026, I think Permian output will be on a very slow increase at these prices to about 6200 kb/d by late 2026. See comment below for a chart with my most recent guess for Permian tight oil.
Permian tight oil scenario, kbo/d, centered 12 month average (CTMA), October 2026 is the peak for CTMA for this scenario (URR=39 Gb) at 6194 kb/d, December 2024 output was 5986 kb/d (monthly output not 12 month average). The centered 12 month average for July 2026 is 6188 kb/d (July 2024 and July 2025 also shown on chart).
https://www.dailymail.co.uk/sciencetech/article-14625503/Texas-rocked-multiple-earthquakes-24-hours.html
Great work D C!
Texas rocked by multiple earthquakes.
“While West Texas has several fault lines, the earthquakes were likely caused by induced seismicity—earthquakes triggered by human activities, particularly oil and gas operations.
Those operations cause quakes mainly through wastewater injection, increasing underground pressure and lubricating faults, making them more likely to slip.”
Thanks Andre.
The big thing that struck me is how close we are to the end of the plateau, in 5 years it will be clear that we are past peak as World C plus C output starts to decline in earnest at 2.2% per year. Oil prices will go up, but I do not think it will affect the annual decline rate significantly. The world will lose 30 Mb/d of C plus C output over a 20 year period, yikes.
Indeed.
In the US we will need to get on with the replacement our vehicle fleet, even if it means buying much of the components from our big business partner China. We are increasingly behind schedule on this.
Is there a better time, politically or economically, to refill the Strategic petroleum Reserve?
Hopefully it would become a piggy bank that would remain untapped indefinitely, but I suspect there will be imperative to tap into it sometime in the 2030’sor 40’s.
Scope of your report is most impressive Dennis. Thank you.
Thank you Hickory.
So we are actually peaking as we speak or very soon? While there’s clear signs of already decline or soon to decline quite rapidly in areas and countries like Gulf of Mexico, Mexico, Norway, and the world’s largest conventional oil field Ghawar, there’s some growth from Argentina (shale/tight oil), Guyana, still growth in Canada, Iran and Venezuela can grow a lot if there’s a revolution and regime change towards Western-friendly governments with sanctions removal, and OPEC+ is supposed to have some spare capacity, though the exact number is hard to be certain of. I’m from Norway, and I’m pretty sure both our oil and gas production is about to go off a cliff as we haven’t found any new large fields to offset the coming declines in the Troll (gas) and Johan Sverdrup (oil) fields.
“….in areas and countries like Gulf of Mexico”. Er, do you mean the Gulf of America?
Mike,
No he means the Gulf of Mexico, Norway is not bound by Trump’s executive orders, I also continue to call it the Gulf of Mexico.
I was tongue in cheek. You may have heard that over here in the UK, there has been a proposal by the Trump disciples to rename the Irish Sea (between Ireland and Britain) as the Great Britain Sea.
Gulf Of Mexico…
Petroslurp,
OPEC plus spare capacity is about 2500 kb/d as of February 2025, increased output will be offset by decline elsewhere, the countries besides the US that have been increasing output that are not part of OPEC plus are Canada, Guyana, Brazil, and Argentina at an annual rate of increase of about 500 kb/d. Not clear how long that continues at low oil prices that exist at present and not clear how much OPEC plus increases output at low oil prices. US output will be stagnant or declining soon, I expect that World C plus C will be declining in 5 years or less.
There are very few who are aware of this, it will take the world by surprise in 2030 when decline becomes undeniable.
It will be interesting to see how long Brazil can increase production with their so called “pre-salt” fields when the rest of their fields seem to be in decline.
I think a transition to electrification especially in the transport sector of the world economy will be forced soon, but the living standards and eternal economic growth that our capitalistic system is based on will be forced to change because the wealth and prosperity that crude oil has given us is underrated. Oil is incredibly energy dense and so profitable that everyone benefits from it economically, government can tax the profits of oil companies more than any other sector yet it keeps going. Solar, wind, nuclear and batteries will never come close. Inevitably, the world economy will not grow but may even be in perpetual recession. And that’s simply not something human nature will accept without revolutions and wars. A global transition from fossil fuels to mainly nuclear but also some renewables will be very difficult in many ways.
Petroslurp,
Yes oil is very high in Joules per gram. The profitability of oil is reduced as extraction costs increase as we attempt to extract more difficult resources. Taxes and royalties will need to be reduced or oil will no longer be viable as a business, also prices will need to rise to account for higher costs of extraction. Wind, solar, nuclear and batteries will become very competitive with oil as this process plays out.
I agree the transition will not be easy, but unless we find a way to live with far less energy use (there are many inefficiencies that exist in the current system, so some reduction may be possible) we will need to find alternative sources of energy, best to start this process before the decline begins.
Oil is […] so profitable that everyone benefits from it economically, government can tax the profits of oil companies more than any other sector yet it keeps going. Solar, wind, nuclear and batteries will never come close.
This is somewhat true, though not everyone benefits equally from oil. I for one have never driven around in a gold Rolls-Royce.
Be that as it may, it is certainly true that renewables in particular are inherently low profit endeavors. First, the sun and/or wind are much more evenly distributed around the planet than fossil fuel, undermining the profit taking of a haves vs have-nots market. Second, both solar and wind can generate electricity at zero cost at the margin, which forces producers into price wars to win market share in the hopes of recovering initial costs.
Oil is much too expensive to compete in the wider energy market, which is why oil-fired power plants only exist in niche markets. Oil rules when it comes to storing energy in a moving vehicle. But collapsing battery prices are changing that. Sales of light vehicles powered by internal combustion engines are down by nearly a quarter from their 2017 peak, mostly thanks to battery powered vehicles. So the oil business exposure to renewables price wars is growing.
Alimb,
All true. Let’s add some more, to put a finer point on this: Oil is profitable because it has benefited from monopoly pricing, not because it is magically better than other commodities.
Oil is badly distributed geographically, which allows producers to control prices. Oil monopolies started with John D Rockefeller’s Standard Oil Trust, continued with the Texas Railroad Commission, and are still here with with OPEC. The few times when those monopolies have not controlled prices have been very dark times for the oil industry.
People in the oil industry have the illusion that oil is unusually good for prosperity because it has been good for them. The early US, KSA, Russia, Texas, OPEC: they have all benefited from these monopolies. But…it has been very expensive for their customers.
Oil industry employees are paid more on average than people in other industries for the same work (as Shallow Sand has noted), due to these monopoly/oligopoly tactics. On the other hand, manufacturing wages are falling (due to Republican attacks on unions, and international competition), and PV economies of scale will continue to drive down costs for installed PV.
Solar power has low barriers of entry, like much manufacturing. Sunlight is everywhere and PV can be deployed in very small projects (and projects can grow in very small increments as needed). Wind and solar will continue to get cheaper and cheaper.
Oil is not magical. It has been very useful, but its just another commodity, and it’s replacement will be a very large improvement for those people who want more affordable transportation, heating, electricity, etc.
Not Magical??
Take away oil and all of its derivatives and in a month millions of people will be dead. The list of everything that will be lost is very long indeed.
Ervin,
Sure. And if aliens had stolen all of our horses in the year 1900 it would have been a catastrophe. But they were becoming obsolete, just like ICEs now.
Alim
Electric cars cannot compete with like for like diesel or petrol cars, when comes comes to price or range. A new diesel car costing £20,000 will travel 450 miles plus on a full tank. An electric car of that price will travel 200 miles max. This is critical when so often charging points are not working because they are so complex.
Electric cars get massive tax breaks in many countries.
https://www.gov.uk/vehicle-tax-rate-tables
Loadsofoil,
Range is not everything, as oil prices rise the TCO for EVs will be less than an ICEV.
A new diesel car costing £20,000
The average price of a new car in Europe is £44,000. How many are selling for £20k?
An electric car of that price will travel 200 miles max. This is critical…
hm. Let’s see: even assuming this is a reasonable comparison (which is unlikely), you’re arguing that a reduction in range from 450 to 200 will cause civilization to collapse?
Mick G
You are soo immature.
I gave a reason why the majority of people buying a new car buy an ICE.
Also far more £20,000 cars are sold than £200,000 cars. Average is meaningless, but not surprising you don’t know that.
US sales even worse
https://www.autosinnovate.org/resources/insights
LoL,
So, you’re saying you have no information on how many cheap ICEs are sold. While mean and median are indeed different, you also have no information on whether that difference is significant.
In the US there are a few similar low priced cars, but they’re being discontinued due to low sales (e.g., Honda Fit); the cheapest US car (the Nissan Versa) accounted for .3% of US sales.
Can you tell us what make and model you have in mind? It should be easy enough to find out their sales volume.
———————————–
I gave a reason why the majority of people buying a new car buy an ICE.
But EV sales are doing just fine: world sales grew 29% in the first quarter of 2025, and China grew 36%.
https://www.carscoops.com/2025/04/global-electrified-sales-are-up-29-this-year-but-this-includes-phevs/
New things take time to take over, but the transition to EVs is going much faster than many similar transitions in the past. There are still a fair number of landlines in the world, but do you know any young people who have one?
The writing is on the wall: ICEs are functionally obsolete, like horses in 1910.
Loadsofoil,
The median car price in the UK was 42,430 pounds in 2024. The Tesla Model 3 with 323 miles of range costs about 40k.
Tesla price at page below cash price 39990 pounds.
https://www.tesla.com/en_gb/model3/design#overview
Median UK car price in 2024 at page below
https://carfinancetoday.co.uk/blog/car-statistics/
Loadsofoil
450 miles is an edge case. At most, probably 1-2% of trips are that long. Even on the optimistic assumption that you can average 60 MPh, it would be a seven and a half hour trip.
Relying on edge cases to win markets is a classic error of product management. It can work, but don’t bet on it.
Petro
George used to do great in depth analysis of GOM, deep water Brazil and the North sea but I haven’t seen him post for a while.
Mr. Kaplan’s posts at link below
https://peakoilbarrel.com/author/georgekaplan/
Didn’t realise it had been that long. Have you heard from George, Dennis?
No Mr Kaplan does not keep in touch. Last I heard he lost interest in this topic, but I may be remembering incorrectly.
He does great work.
Dennis
The median cost of a car in the U.K. is not £42,000 where do you get that from?
https://www.carmagazine.co.uk/car-news/industry-news/uk-2024-car-sales-analysis-winners-and-losers/
Top selling model Ford Puma is £26,000, second best selling is Kia shortage at £28,000, third is £30,000, forth is £24,000.
Shall I go on?
It is telling that the two best selling electric cars sold half what the two best selling ICE cars did, but also have the longest range. Rich people are buying long range electric cars, the Tesla Y having the nearly range of a ford puma.
The tenth best selling ice costs £20,000 and has a range again of over 400 miles.
The tenth best selling electric car sold a quarter of the ice equivalent, it costs £40,000 and can do a maximum of 220 miles.
People have had such awful experiences going on holiday with an electric car a spending so much time going from broken charger to broken charger.
https://www.theecoexperts.co.uk/news/broken-ev-chargers
Fact is unless you are rich and can buy an expensive electric with a high range electric cars are seriously handicapped.
Nick G shall I help you add up the sales?
Loadsofoil,
I provided a link with median price, do you know how to read?
The site is called carfinancetoday
A quote from the piece at link below
https://www.carmagazine.co.uk/car-news/industry-news/uk-2024-car-sales-analysis-winners-and-losers/
Experts expect new car prices to maintain or grow beyond their 2024 average costs due to factors like the decreasing supply of petrol and diesel cars in favor of EV development. In 2024, the median price for a new car in the UK hit £42,340, representing a significant increase over previous years.
Dennis, you linked the article Loadsofoil linked to but missed this bit….
“While EVs accounted for a 19.6 per cent share in 2024, behind the mandated figure, the Department for Transport (DfT) put out a statement saying it was “confident the whole market has complied” and “no manufacturer will need to pay fines”. This is based on the flexibilities in the scheme that can allow firms to borrow credits from firms with an already high EV share or defer for a year while firms ramp up EV sales, even if they did not hit it in 2024. ”
Mandated, with fines for not reaching ‘targets’. I wonder what a manufacturer would do with such rules?? Perhaps make ICE vehicles artificially more expensive, while making EVs artificially cheaper??
Without a ‘real’ market it’s very difficult to work out ‘real’ demand…
Your quote came from this article..
https://carfinancetoday.co.uk/blog/car-statistics/
But while including just the quote that suited your argument, you decided not to include the following relevant quotes from the same article….
“Automakers are having trouble meeting mandate targets due to limited private demand, high EV costs, and charging infrastructure constraints.”
“In 2024, only one in 10 drivers opted for an EV, with over 60% sticking with petrol. One significant factor limiting private demand is the higher average upfront cost of electric driving. In August, the median price of a new EV was £54,324.61, significantly higher than its gas or diesel counterparts.”
Having mandates for one type of more expensive vehicle just increases inequality in the population.
Dennis
The person writing that article obviously does not know the difference between average and median. He interchanges to using the term average to median.
I linked real car sales statistics. It does take a bit of time to work through the data.
You just linked to my article. If you bothered to click on the link within the article you quoted it says AVERAGE.
https://www.autoexpress.co.uk/opinion/363624/average-new-car-price-ps40k-simply-too-high-most-people
Anyway electric car sales are heavily subsidised by charging ice vehicles thousands in tax. Even so ice electric car sales are not what the government wanted.
In the U.S. sales are terrible.
Hideaway,
I was searching for median car price in UK, that’s it. The linked article has the median price in 2024.
UK can decide it’s policy and voters can elect who they think is best in UK. Seems a good idea to move to EVs in my view. UK could also increase taxes on petrol and diesel rather than use mandates, probably a better policy.
Here’s a comment about median vs average that seems to be an educated opinion:
“#Throwaway account. I work in the biz, you may have stumbled across an article at some point that included a price number I gave to a journalist or PR person. Even when I provide the median, it gets reported as the average because they’re basically the same thing and the average reader doesn’t know what a median is. As most y’all analysts know, once you release a number into the wild it’s out of your control what the non-analysts do with it.
That issue aside, the average and median vehicle prices trend in parallel with each other. Historically, the average is typically $3k-$3.3k more than the median. In 2021, the average has been trending another $300-$400 higher than median.”
https://www.reddit.com/r/datasets/comments/oa8ph2/median_new_car_price_average_new_car_price_has/
My lastest Permian tight oil estimate based on current RRC, OCD and EIA data, Novi estimate through Dec 2022 also used (data published in April 2024). Notice the stairstep pattern in this chart, periods of flat output followed by increasing output, I expect this to end in 2026 and the Permian basin will be heading down the stairs.
Would be interesting to see a graph with the past and future for world liquids per capita. A graph who also accounts for the EROI rate.
The chart uses the UN median probabilistic projection from link below
https://population.un.org/wpp/downloads?folder=Probabilistic Projections&group=Population
Oil output is based on my Shock model. I don’t have EROI data, I will leave that to others. Also note that World liquids is less useful in my view than World C plus C, NGL is a useful chemical input, but less important for transportation than crude plus condensate.
Also NGL has less energy per barrel, best when looking at liquids to do it by mass.
Well, how does that compare to projected consumption?
Nick,
Difficult to project consumption, but my guess is that production and consumption will balance fairly closely if markets determine prices. So in short, not much difference between demand and supply. My concern is proper policy to allow the world to adjust to falling supply of oil, this is not a given and poor policy will make the adjustment difficult.
Thanks for that projection Dennis.
When the decline in C/C per person gets going around 2030 there is no way that the distribution of what is left remains familiar. Today we have market driven distribution, with an overlay of geopolitical restrictions that are primarily conceived and enforced by the US.
Once this decline gets real we will have much greater disruption in the ‘free trade’ distribution of whats available for sale on the international market, and also the beginning of serious distribution restrictions within countries.
Might be illuminating to read up on how various countries coped with oil shortage during WW2. When a country needs to institute petrol rationing, then food rationing will not be far behind.
The way the US is kicking dirt in the face of all other countries seems extremely shortsighted, to put it mildly.
Yeah, it will happen in some places. There’s no better way to turn a medium problem into a major crisis then to institute price controls and rationing.
When there is real shortage of something like petrol or wheat someone such as yourself will be grateful for a small government ration portion, or else you’d have access to none.
No joke.
Hickory,
If there are shortages and governments allow prices to rise so that goods are allocated efficiently, then this leads to people making appropriate choices substituting EVs and heat pumps for petrol diesel and natural gas. In the first oil crisis in 1973 and 1974 in the US the government chose rationing and price controls and it was a disaster, in the second crisis in 1979-1981 the government did not make the same mistake and things went much better. Prices were high, but no long gas lines and shortages as I recall. There was a significant drop in World output from 59.6 Mb/d in 1980 to 53.5 Mb/d in 1982, about a 10% drop in 2 years. High prices like what the US experienced from 2011 to 2014 (average WTI price was $129/bo in 2024$ over those 4 years) is likely to lead to a lot of EV and plugin hybrid sales.
Those who are smart will start looking at their options soon rather than waiting until 2030.
“Those who are smart will start looking at their options soon rather than waiting until 2030.”
Certainly. And our country is performing poorly in this regard.
The scenario I was pointing to was for the time or place when regions experience abrupt, deep and/or prolonged shortage of things like food or fuel. Some places in the in world are already like that mostly due to severe poverty or failed state status. I am saying that many more places are prone to becoming disrupted zones once oil per capita starts to drop briskly. Rationing is a last resort of a functioning government. If that doesn’t work the region becomes failed, and it is the warlords who will decide who are the winners and losers…who gets fuel or food.
Just saying that tighter supplies for basic elements of economic function is a setup for breakdown of the relatively smooth functioning markets we have become accustomed to and take for granted.
Hickory,
I agree it will not be smooth sailing, but it’s possible it will bring about some needed change.
Hickory,
If people don’t interfere with price incentives, there won’t be a crisis that requires rationing. As prices rise people use less and supply increases (or declines more slowly). There are plenty of alternatives for people to move to.
OTOH, if governments keep oil prices artificially low, as many do, then they will face a bad situation: the cost of subsidizing those prices will become unaffordable, eventually the governments will try to abruptly allow prices to rise to market levels, consumers will revolt, and it will be very bad.
Governments need to gradually decontrol prices while providing subsidized rations for a relatively small, low income segment of the population that actually needs help (higher income people use most of the fuel, especially in low income countries).
——–
Here’s further discussion:
Places like Egypt and Haiti also had fuel price riots because, well….everyone there hates their government, and for good reason: reason: the level of inequality between rich and poor is high, and the poor are blocked by bad education, medieval business licensing and non-existent property ownership. But they also handled the price increases really, really badly. For instance, in Ecuador previous governments controlled general prices, which leads to all sorts of perverse results, including shortages.
These governments abruptly removed fuel price controls, without any PR, public preparation, or substitutes for low income folks. In particular, they didn’t substitute some kind of subsidy for the working poor. Ration cards would have been far cheaper and far fairer. Cheap fuel is a terrible way to help the working poor. It’s very expensive and inefficient because most of the subsidy goes to the middle class and wealthy.
Both India and China have raised fuel costs sharply in the last few years (by lifting price controls and reducing subsidies), and they’ve done pretty well.
And, of course, Europe has had high fuel costs for passenger vehicles basically forever.
Hickory,
Part of the problem in the US is just poor policy, higher taxes on liquid fuel, similar to rates in Europe would likely change behavior. I agree the US is being very stupid in this regard. Canada does a bit better at about 63 cents (US $) per gallon in fuel taxes, in the US that average rate is about 51 cents per gallon (US$). The minimum tax on petrol in European Union is $1.47 per gallon with some nations taxing petrol at twice this rate, Netherlands is highest at $3.23 per gallon, with UK at $2.37/gallon.
This smarter policy leads to a quicker transition to EVs.
An alternative scenario using a population projection by Wolfgang Lutz, peak in 2045 at about 8.53 B, rather than 10 billion in 2080 as in the UN projection.
The per capita C plus C declines at about 2.12% per year on average from 2035 to 2100 for this scenario.
That chart of World C C per person is probably the most important that anyone has put up.
The repercussions of this from a thousand foot view might not register with you as severely particularly problematic as viewed from your current [temporary] position of comfort.
And if you live in places like Russia or Canada (high output per capita) the prospects on oil supply don’t look too bad for the next couple decades.
But when you consider dozens of other countries and get a little granular about it this is a code red scenario, especially when you consider the tremendous reliability of the the food system on oil input. Countries you may have heard of like Spain, South Korea, Germany, Japan, France, Turkey have no oil production and have large populations. You can add close to a hundred other countries who will be at increasing risk to being extremely short on oil products starting in the 2030’s regardless of how much light transport sector electrification is accomplished.
Of course light transport sector electrification is the most obvious step countries can take to adjust to the depletion, but it does not solve the rest of the heavy dependency problem that a civilization deep into population and technological overshoot has cultivated.
Yikes indeed.
And for a country like the US the smart policy would be save as much oil as possible for later, rather than to use it as if there is no depletion like we do now.
And, oh yeh, to remember to cultivate friendship with Canada.
Hickory —
Well said. As usual you have hit nail on it’s head!
Hickory,
There is much that needs to be done. All we can do is present the problem and advocate for sensible policy. Higher prices may lead to allocation of the resources to best uses and more efficient use.
During the sharp depletion phase, just beginning in the 2030’s-
“Higher prices may lead to allocation of the resources to best uses and more efficient use.”
That would be nice to the extent that it actually happened. 12% perhaps.
More-so in China.
Hickory,
12% of what?
It was flippant commentary on the likely degree of optimal allocation of scarce oil derivatives in the world after peak.
Of course ‘optimal’ means different things to different peoples in this context.
We’d be lucky to even get some degree of ‘reasonable’ allocation when you consider the great distortions of concentrated wealth, country borders, and geopolitics.
I want to thank Dennis and OVI for their great work.
Without them, this kind of post wouldn’t be possible.
Thank you very much.
https://futurocienciaficcionymatrix.blogspot.com/2025/04/la-produccion-de-petroleo-de-eeuu-ha.html
Quark
Thanks. Much appreciated.
Quark,
You’re welcome. I agree Ovi does excellent work.
Nice post. (My Spanish is not good so I used Google translate for your post.)
Keep in mind the weekly output estimates by the EIA are based on the STEO models which are revised monthly. Also note that the estimates for the drilling productivity report (particularly the most recent 5 to 12 months) are also model based. In my view the drilling productivity models are not very good so the estimates for wells drilled, wells completed etc are not very accurate.
Thanks, Dennis.
Yes, I agree that almost everything is an estimate and that making predictions about the future is synonymous with error. I assume my conclusions will likely be wrong, but I can’t help but think (with the data currently available) that we’re very close to the peak.
Quark,
I agree we are probably near the peak in oil output, some of this will depend on future oil prices and economic activity which are of course unknown.
I think your analysis is excellent, I was just pointing out that in my opinion EIA weekly output data is not very accurate historically (due to inaccurate STEO forecasts) and the drilling productivity data is not very accurate. Unfortunately we no longer have any new Novilabs data that can be used to update Permian well profiles beyond 2022. This makes good analysis more difficult.
Real WTI spot prices in 2024$ per barrel.
Thank you for this. Great chart to keep things in perspective.
Thanks Shallow Sand,
I was noticing that real oil prices are similar now to what they were in 2015 and 2016. As I recall you have said that was a tough time for oil producers.
Have tariffs on steel affected drilling pipe prices yet? I would think that and low oil prices will be a problem in 2025.
Recent article on tariffs and oil industry with focus on recent earnings report from Liberty Energy (company was founded by the current Energy Secretary).
https://www.scientificamerican.com/article/trump-tariffs-hit-oil-companies-despite-administrations-support-for-fossil/
Also first quarter survey from Dallas Fed
https://www.dallasfed.org/research/surveys/des/2025/2501
excerpt:
The company outlook index decreased 12 points to -4.9, suggesting slight pessimism among firms. Meanwhile, the outlook uncertainty index jumped 21 points to 43.1.
…
Costs increased at a faster pace relative to the prior quarter. Among oilfield services firms, the input cost index advanced, from 23.9 to 30.9. Among E&P firms, the finding and development costs index increased, from 11.5 to 17.1. Meanwhile, the lease operating expenses index rose from 25.6 to 38.7.
Dennis. I don’t know the answer to that question. We have no intention of drilling wells.
We bought tubing and rods last year and haven’t had to buy more yet. Need to be checking into that.
I’m aware of a handful of wells drilled in our field by the only rig left in our field. Those were planned in mid-2024 and drilled and completed over the winter. I doubt any are drilled until we have more clarity, which could be years?
I noticed some quotes from people who are officers in the National Stripper Well Association in an NBC story. They said the tariff actions are really hurting all facets. One said he put a multi-million drilling project on hold. That story was published April 12.
Thanks Shallow Sand,
Good to get some real World news from the field, I imagine farmers in your area may also be hurt by the tariffs. It is unfortunate.
I thought sometimes pipe might be needed for repairs and you might know what prices are like.
I’m going to be looking at an AFE for a 10,000′ vertical well in a week or so. I’ll let you know how the price of tubular steel compares to a year ago.
Thanks Gerry.
Chevron announces first oil at Ballymore project in US Gulf
Interesting headline. It is now the US Gulf. Sneaky.
The $1.6 billion project called Ballymore, located about 160 miles southeast of New Orleans, is composed of three wells that is expected to produce up to 75,000 barrels of oil equivalent per day (boepd).
Chevron aims to grow oil and gas production from the Gulf to 300,000 boepd in 2026, and at the same time, it is working to cut up to $3 billion in costs across the business. Instead of building a new production platform for Ballymore, the wells will transport oil and gas back to an existing platform, which the company said will allow it to increase production at less expense.
https://ca.finance.yahoo.com/news/chevron-announces-first-oil-ballymore-130958453.html
US Great Lakes too.
Gold To Oil Ratio HITS a New All-time High of 52/1
With the Gold price surging past $3,400 and the Brent Crude price at $66, the Gold-Oil Ratio is now 52:1, the highest since 1933, when Roosevelt revalued the Gold Price to $35, while the oil price averaged $0.67 a barrel.
It’s amazing how the Dead Yellow Rock still plays a significant role in the Global Financial Markets.
The previous high was 40:1 in 2020, due to the collapse in the oil price during the Pandemic.
Just imagine how PEAK ENERGY will negatively impact the over $400 trillion in Stocks, Bonds, and Real Estate, not to mention the $90+ trillion in M2 Money Supply.
At some point in time, the 99% of Investors who continue to invest in Stocks, Bonds, and Real Estate are going to wake up to the fact that these supposed Assets DON’T PROTECT WEALTH in an Energy Scarcity Future.
steve
Steve,
Is your primary business selling gold & other precious metals?
Nick G,
No… I don’t sell any metals. But, I realize many folks would jump to that conclusion.
steve
So, how much revenue do you get from Tom Cloud (a sponsored gold seller on your site), and other advertisers of precious metals?
Nick,
Yes, I sponsor Tom Cloud, but I don’t have metal advertisers.
The overwhelming majority of my revenues come from Paid Subscribers to my analysis on Energy, Mining, and the precious metals.
Now, Nick, why don’t you ask a question regarding the analysis?
steve
Well, I don’t have any questions about the analysis.
When I first encountered the idea of Limits to Growth I was quite alarmed. But, I’ve explored the dynamics of energy transitions thoroughly over many years and found that the idea that catastrophic energy scarcity is likely is unrealistic (except, of course, it will be catastrophic for exporters and sellers of FF). I’m just curious why someone is pushing the idea so hard, and tieing the idea to metal sales.
I guess making a living selling scary information to gold bugs is as good a reason as any.
You may wonder why I’m being a bit impolite about this: it’s because I think that excessive emphasis on the dangers of Peak Oil is counterproductive: it pushes the idea that we need to maintain oil and FF production as much and as long as possible to prevent civilizational collapse. This is a destructive idea: we need to transition away from oil & FF ASAP: we need to defund Russia, KSA, etc., and reduce FF pollution ASAP.
Nick G,
Energy Scarcity is unrealistic? I see.
Thanks,
steve
Steve, agree…
Nick G …. “But, I’ve explored the dynamics of energy transitions thoroughly over many years and found that the idea that catastrophic energy scarcity is likely is unrealistic ”
Good grief, what an absurd statement clearly showing you have NOT done thorough research.
We’ve had solar panels and wind turbines for many decades now, yet we continue to rely upon building these machines with fossil fuels because it’s way cheaper to do so..
Your rhetoric is consistently that solar, wind and batteries are cheaper, yet reality is clearly showing they are not, as No-one anywhere has moved ALL their industrial processes to make any renewables from just this type of energy.
If you think this is incorrect, then name any business that uses exclusively the energy and products of ‘renewables’ to make any solar panels, wind turbines or batteries, telling us what processes they use and what they use for insulation instead of the products from fossil fuels (plastics)…
I have consistently proven you knowledge of energy is severely lacking yet if I don’t post for a period of time you always come back with the same garbage.
SRSR/ Hideaway,
You are shoveling excrement uphill replying to Alim and Nick G who are nothing but internet experts who have learned learned nothing about the real world. Their understanding of basic thermodynamic principles is absent as is their ability to see reason.
In their magical world of renewables I just wonder how they propose to produce the simple building blocks of the chemical industry (ethylene, propylene, butadiene, BTX and ammonia) to enable their renewable green future.
Don’t hold your breath.
Nick says: “But, I’ve explored the dynamics of energy transitions thoroughly over many years”
What energy transitions?
Jean-Baptiste Fressoz says there ain’t none.
Definitely an interesting book trying to look at the history of energy and material use.
The bits that have stuck in my memory are:
– the idea hydropower dams were developed in the 1910-1920’s by capitalistic leaning proponents to reduce the political power of labour (coal miner strikes were big problems for capitalists!) I’d not really thought about hydropower except from a “renewable” and “environment damage” perspective
– the idea the IPCC was created so governments (and particularly the US and Russian governments), not scientists, would direct what should be done about climate change
Comment from Oilystuff
I am trying to sort this shale oil stuff out. Working from the top down from some hypothetical bull shit about technically recoverable resoures that some government funded entity estimated 7 years ago, then trying to make real life fit on p50, or p75 basis, is stupid. The oilfield does not work that way. Nobody has ever been thru anything remotely like production from unconventional shale.
What exactly is the point in qualifying a prediction about the future by saying you are likely to be wrong, then making the prediction anyway, over and over again, one model after another? I can think of no bigger waste of time in all of life. 95% of internet experts analyzing oil and gas these days did not even know the difference between pipe dope and condensate 13 years ago.
The only way to predict the future is with bottom up analysis done as things change, which they do all the time in the oilfield. Why are EUR’s falling in core areas is the key to understanding the future. You can’t know where you are going unless you know where you’ve been. Data is just numbers unless you know what they mean.
My analysis uses completion rate and well profiles based on Novilabs data. It is done by year through 2022, I don’t have enough 2023 data to estimate the EUR for wells after 2022. Every scenario of the future will be wrong, except those done by God.
My current guess is around 39 Gb, which is roughly 52% of the USGS mean TRR estimate for the Permian basin (75 Gb). It could be much less if oil prices remain under $65/b long term, maybe 30 Gb or even less if that proves true.
Permian well profiles used for my model,
Cumulative output at 160 months 2019 well is 418.5 kbo, in 2020=449.7 kbo, 2021=454.4 kbo, and 2022=426.6 kbo.
I assume 2023-2025 wells are the same as the average 2022 well, starting in 2026 I assume new wells EUR starts to decrease, those are my assumptions, they are likely to be incorrect.
Permian EUR in kbo with my guesses for 2023 to 2036 (last year Permian wells are completed for my scenario. We can only guess what future EUR will be and I don’t have enough data after 2022 to estimate the EUR for Permian wells in 2023 and 2024. These EUR estimates after 2022 may be too optimistic or pessimistic we don’t know.
Note that there are some EURs which assume 30 year well life, these EURs are based on the first 160 months (13.33 years) of output, I assume the average well is shut in after 160 months.
Adjusted Permian model to match recent update to Permian tight oil output estimate, slightly lower URR than before (38 Gb vs 39 Gb). This model uses the EUR estimates in previous chart, the shape of the well profile after 2024 is based on the shape of the average 2022 well. Peak is in March 2026 at 6214 kb/d, the CTMA is also at its peak at 6208 kb/d in March 2026. The 2026 annual average output for this scenario (peak calendar year) is 6202 kb/d.
This scenario has changed the previous scenario’s assumption of new well EUR starting to decrease in Jan 2026 and moved it to Jan 2025, also reflected in the previous EUR chart where 2024 is 427 kbo and 2025 is 419 kbo.
Went back and looked at Saputra et al paper from 2022
https://www.mdpi.com/1996-1073/15/1/43
In that paper they estimate 34902 existing horizontal wells in Permian Basin (using fig 6, they have a mistaken number in the paper) when the paper was written and a potential for 55k more wells in the future in the core areas with total URR of 32.2 Gb if only core areas are drilled (total wells drilled is 90,305 wells.)
My scenario has somewhat higher EURs compared to the Saputra paper, so for a similar number of wells (90.2k wells) I get a URR of 35.7 Gb, perhaps my scenario is on the optimistic side (roughly 10% higher URR than the Saputra scenario for core Permian wells.)
D C,
The 2012-2025 EUR numbers in the above plot are not corrected by lateral lenths? NOVI has plots showing no improvements in IP 9months per foot since 2016, and the EUR per foot probably decreased obviously with same decline pattern as older shorter laterals.
The Marcellus and Haynesville gases’ IP9months EUR per foot both improved obviously after 2016.
Saputra 2022 paper also did not correct the well numbers with lateral lenths?
Here from oilystuff.com is the actual post I made discussing EUR’s in the Permian Basin:
https://www.oilystuff.com/forumstuff/forum-stuff/oily-stuff-news-stuff,
and here is the comment I made to my post regarding AI, to which Mr. Coyne selectively copied, and pasted here on antioilbarrel, completely out of context: https://www.oilystuff.com/forumstuff/main/comment/aa1f0b9c-eebf-4cfa-a574-681b6394dfe2?postId=680309724521b93c1f181036. If anyone here is remotely interested in this stuff, I suggest you read the entire thread.
Mr. Coyne’s first pretty colored chart is a direct contradiction to my post and supporting evidence I provided from TGS Analytics, Novi Labs, my research and thru an article with the Permian Basin Oil & Gas Magazine, and Art Berman. Mr. Coynes chart is titled “EUR’s” but production profiles have nothing to do with EUR’s. Production profiles can imply EUR tracks into the future, nothing more. All of the sources I relied on categorically state EUR’s have declined since 2016 in the Permian Basin. Berman I know actually did DCA on his data set and his EUR’s were actual EUR’s. There was some stinky dung heap floating around in 2019 about 1.5 MM BOE EUR’s that he had nothing to do with.
The second bar chart from Mr. Coyne shows ESTIMATED cumulative production from Permian wells peaking in 2021, contrary to reality, then declining at the rate of about 2% annually out to 2036. Well, you can’t say what cumulative production will be in 2021, or thereafter, because it has not occurred yet. Who says wells in 2021 will make 454 K BO? If the analyst does say that, lets see the actual DCA/EUR estimate, with all the methodlogy and parameters. Even then the E in EUR stands for estimated.
Two percent (2%) decline in estimated year to year production is a wild ass guess; I actually provided data that suggests cumm prods. (and possible EUR’s) have been declining at the rate of 4% annually, and in 2023 jumped to >5%. I provided a very recent Novi chart (2.25) showing Wolfcamp A,B and the the current lie of the year, the Dean, had declined a whopping 16% between 2023 and 2024.
Chart 3, yet another model using incorrect assumptions about EUR’s, is just another model. I therefore stand by the quote Mr. Coyne cherry picked… models are a waste of time. I was not even remotely addressing that comment in Mr. Coyne’s direction; in retrospect I should have been.
Novi’s full of shit, no Permian Basin HZ tight oil well will be alive in 30 years, not even 20. Produced water will kill them dead at 15-18 unless oil goes to $120.
Finally, to quote Mr. Coyne, “My scenario has somewhat higher EURs compared to the Saputra paper, so for a similar number of wells (90.2k wells) I get a URR of 35.7 Gb, perhaps my scenario is on the optimistic side (roughly 10% higher URR than the Saputra scenario for core Permian wells.)”
This paper was written in 2021 by PE’s at the University of Texas. Its already been proven, categorically, that the longer laterals it speculated would provide higher EUR’s, has not. Now Mr. Coyne, chooses to use even higher EUR’s, or rather higher imaginary production profiles.
Whatever, I just get tired of the horse shit. I’ve stated little more, on my blog, not yours, EUR’s are going down and that is way more important to America’s future than big IP’s and we should be concerned. I don’t care if you folks here read my stuff, or what you think of me because of my political beliefs but, Jesus, in the land of the blind don’t let the One Eyed Jack be King. Be smarter than…THAT!
Thanks Mike.
The EUR’s are hyperbolic fits on Novilabs data. EUR has decreased when normalized for lateral length since 2016, but the well profiles I presented are not normalized for lateral length, I don’t have the data needed to do that.
Yes many here are aware that the E in EUR means estimated, that’s why it is a scenario based on a set of assumptions about the future. Here is the fit for the 2020 well, fewer data points for the 2021 and 2022 wells so the fit will not be as accurate. How quickly EUR for wells that are not normalized for lateral length will decrease in the future is not known we have to guess, these will be wrong about 100% of the time. Data pulled from
https://public.tableau.com/shared/Y9PPBFDDY?:toolbar=n&:display_count=n&:origin=viz_share_link&:embed=y
The 2021 average well profile is based on 26 months of data from Novilabs and an OLS fit to a hyperbolic for months 4 to 26.
Arps hyperbolic equation can be found at link below
https://www.phdwin.com/wp-content/uploads/2017/05/About-Arps-Equations.pdf
q sub i I simply label as q and D sub i I call D in my chart. After month 82 I assume exponential decline at 12.5% per year for the 2021 well.
Mike,
I agree that EURs will decrease and normalized EURs for the Permian started decreasing in 2016.
In the Saputra paper they have EUR increasing from 2012 to 2020 as lateral length proppant intensity and frac fluid intensity increased, see figure 3 of paper.
Also they say in the text that increased lateral length and bigger frac jobs lead to higher EUR, but if you look closely at Table 1 (reproduced below), you see that for most core areas (Bonespring is exception) the EUR stops increasing after 2017, my estimate is less sophisticated as I look at the entire Permian and not individual formations. I believe they assume no change in future well profiles for their different cohorts from their 2018-2021 estimates for their projection.
Here are average Permian well profiles (not normalized for lateral length) from Novi labs. The 2023 well does not have enough data to make a good estimate (only two data points with the average of all 5822 wells completed in 2023). On this chart it looks like the 2020 and 2022 wells may be very similar, 2021 looks like it will be the highest EUR year. The date range is 2016 to 2023, shorter curves are more recent.
Novilabs Permian wells normalized by lateral length, 2016 was the peak, but not a significant decrease from 2016 to 2020 in chart below.
In 2016 when we normalize to a 10k lateral, EUR is about 502 kb, for the 2020 well it is about 481 kb, it increased to 497 in 2021 and fell to about 443 kb in 2022. That is a decrease of 12% over a 6 year period, a decrease of 2.1% per year on average over the 2016 to 2022 period.
Sheng wu,
No the EUR per foot is not presented.
The model uses average output per well and number of wells completed to estimate future output. I don’t think the Saputra analysis normalizes their EURs.
Sheng Wu,
This is my estimate for normalized Permian EUR per 10 thousand lateral feet. Lateral lengths from link below, for 2022 it is based in Jan thru Sept data
https://www.eia.gov/todayinenergy/detail.php?id=54079
EUR are my estimates based on Novilabs data published in April 2024.
the IP increase might compensate for the lateral length increase from 2016 in Permian, but the tail after 2 or 3 years did not reflect the increase in lateral length. This is different in Marcellus, Hayneville where the tail after 2~3 years obviously improved, sometimes obviously larger improvements than lateral length increases. The EIA/USGS estimates are based on IP, but not fully absorbing the later faster decline after 2-3 years.
Sheng Wu,
The EIA estimates are far higher than USGS estimates. Also USGS does not consider economics,
Sheng wu,
Not seeing it for Haynesville, tails change from 2013 to 2017 and then are bunched together post-2017.
Any of the charts (this comment and next two with charts) can be clicked for a larger view, this is always true for any chart in the comments at this blog.)
For Haynesville, the tail improvements are indeed smaller than Marcellus when you compare curves after 2016. But the improvements from 2014 to 2016 in Haynesville is much larger than what happened in Marcellus, not only there is offset, but also the first 4 years’ decline changed from hyperbolic to linear with logrithmatic vertical .
Sheng Wu,
For Pennsylvania shale gas (includes Marcellus and some Utica) there is some bunching from 2010-2012, then 2014 to 2016, and 2017 to 2019, might be more significant jumps in lateral lengths or dry gas may be less affected than tight oil with lower efficiency of increased lateral length (in productivity per foot). Note that 2020 and 2021 look like high grading as we see a productivity decrease in 2022.
There is also a Novi chart that shows the wells all tend to have terminal decline rates around 10% per year see post at link below.
https://novilabs.com/blog/pennsylvania-update-through-march-2023/
Sheng wu,
Here is Permian chart, tail improved from 2010 to 2016, after that you are correct, little increase in tail (output after 36 months) post 2016.
Note that all of these EUR estimates assume wells are shut in at 15 bopd, which occurs at about 175 months for 2020 to 2022 wells and earlier for older wells, less than 15 years in every case. Not 30 or even 20 years. Also I assume terminal decline at 12.5% per year after about 6 or 7 years from first flow.
50 million barrels a day in 2050 pops up a lot.
This is the strategy paper of Trump & Co
A User’s Guide to Restructuring the Global Trading System
https://www.hudsonbaycapital.com/documents/FG/hudsonbay/research/638199_A_Users_Guide_to_Restructuring_the_Global_Trading_System.pdf
It says the US dollar is overvalued because of its function as a reserve currency and the root cause for the trade deficit.
Suppose the tariffs and other proposed measures like withholding interest payments on Treasury securities (see page 30) lead to a devaluation of the dollar.
What will that mean to oil prices? Has the EIA studied the above paper and analyzed its consequences?
The value of the dollar is determined in the Eurodollar market and no where else.
The US has been running twin deficits both fiscal and trade for decades. And the dollar is up since 2008. Not down.
Why 2008? Because that is when the Eurodollar was at its peak. And it’s been in contraction ever since.
All the rounds of QE and interest rate cuts and yet the dollar is still up.
Central banks aren’t the center of the monetary universe. Commercial banks are and when commercial banks decide to expand their balance sheets by making loans into the economy. They are expanding the money supply.
Everyone is looking at this from the demand side. Thinking the dollar is going to crash due to lack of demand.
All while ignoring the supply side of dollars. Dollar is going to crash but it’s going to continue crashing upwards as the Eurodollar continues its contraction since 2008.
This short term pullback in the dollar due the selling of dollar denominated assets. Is in fact short term. All the debt in the Eurodollar market is short term and it constantly needs to be rolled over.
And now global trade is down like 60% which if that persists we are going to see an eruption in the Eurodollar market.
To understand the dollar you need to focus on the supply of dollars.
Because 99% of all dollars are loaded into existence instead of printed. More dollars are needed to repay principal plus interest than there were created in the first place.
If the dollar supply outside the US shrinks then the dollar debt outside the US is unplayable. The selling of assets is providing some dollars that are needed outside the US. This pullback is temporary.
HHH,
Why 2008? Because that is when the Eurodollar was at its peak. And it’s been in contraction ever since.
Can you show me the data to support this statement please ?
Also it seems like China is dumping USD for GLD. But eitherway the U.S government under Trump wants a weaker USD as they see this as the main cause of the trade deficit. So i think they will do whatever they can to weaken the USD, essentially hurting importers on two fronts.
Iron Mike,
The average US consumer will not be happy about the inflation that will result from a weak dollar. To this we add the inflation that is caused by high tariffs. Note a recipe for happy voters who were promised lower prices by Trump.
A weakening dollar reinforces the dollar as the world’s reserve currency. A weakening dollar 99% of the time is a good thing. 99% of the time it’s what you want.
A weakening dollar means business is good and a lot of loans are being made.
What people are currently failing to understand is why right now a weakening dollar is in the 1% of times where it’s not a good thing.
People are selling dollar denominated assets to provide dollars that just aren’t being provided by the market.
When things are good the dollar naturally falls in value.
QE and moving interest rates around does nothing to move the supply of dollars being provided to the economy.
Look across the pond. The ECB has cut interest rates 7 times over the last 12 months. And the past few weeks the Euro has gone straight up against the dollar.
It’s not central bank monetary policy nor is it fiscal and trade deficits. Nor is it confidence loss.
The dollar’s value is determined by supply. Supply that only commercial banks are able to create via loans. Demand will remain because all the dollars were loaned into existence in the first place. So you need dollars to repay the debt.
And another misconception is what if China sales all our bonds. Who will then step in to buy the debt. I’ve heard this argument for years.
News flash. US banks can expand their balance sheet as much as they want. And also have incentive to do so.
The banks have a dollar funding cost. Or what banks pay for deposits. So if you’re a large bank and you’re paying 0.01%-2.00% on deposits .
They buy treasuries yielding 4% and they pocket the spread. The banks can and will buy all the treasuries. What is 2-3% on say $50 billion or $100 billion? Or a $1 trillion?
We are in no way shape or form in danger of not being able to fund our deficits.
CANADA’S SEABORNE OIL EXPORTS SURGED IN MARCH
“A record number of oil cargos set off from Vancouver Port in March thanks to the expansion of the Trans Mountain pipeline, the Vancouver Sun reported, citing data showing that as many as 30 tankers loaded with crude left the port last month. This is up from an average of two per month before the Trans Mountain expansion and a high of 25 in the fall of 2024, after the expanded pipeline began operation in the spring of last year.”
https://oilprice.com/Latest-Energy-News/World-News/Canadas-Seaborne-Oil-Exports-Surged-in-March.html
Thanks for the link.
I am highly sceptical that very much could be done in the short term to alter the energy landscape globally. I would guess the recent drama could defer investments and reduce output. Still, the expansionary model based on transfer of new technology globally and exploitation of new resources in “not so politically correct” countries have a huge role to play in stabilising output for years to come. To stabilise the economy enough to make a transition possible for the longest timeframe possible could be a goal I guess in western countries.
It will mostly be felt like peeling away on the onion of prosperity, if not low payback energy in the form of wind, solar and geothermal (some projects are actually not low payback) can do enough to offset the issues somewhat. But like my neighbours said: “Maybe it is reasonable that we now look at grocery prices more closely, since we haven’t for.. (the last 10-20 years would be my input)”
All North Dakota down by -11,251 thousand barrels per day in February 2025.
Click on chart to enlarge.
Ron
I think we have to learn what decade long changes will mean for the oil sector:
“The Triffin dilemma
The persistent global demand for safe US dollar assets feeds America’s exorbitant privilege, but the quid pro quo is America must let capital flow freely across its borders and readily absorb the savings and current account deficits in other countries. In 1959, Robert Triffin predicted that the nascent USD-gold standard was unsustainable because of an insurmountable dilemma: if America stopped providing other countries with US dollars, global trade would stagnate, tipping the world into a contractionary spiral. But if it continued, America’s foreign liabilities would exceed its gold stock, eroding confidence and eventually leading to a run on US gold. Herein lies the Triffin dilemma.
America still faces a modern-era Triffin dilemma between satisfying the increasing demand for safe US dollar assets by the rest of the world and maintaining their safety. However, as the US share in world GDP continues to trend down and the global financial wealth outside the US continues to expand, will America’s USD assets still be deemed safe? Highlighting this challenge is the widening gulf between US international financial liabilities and assets.”
https://www.nomuraconnects.com/focused-thinking-posts/trumps-populist-policies-and-the-triffin-dilemma/
“I think we have to learn what decade long changes will mean for the oil sector” should rather be:
“….will mean for oil trading”
Eurodollar was the answer to Triffin’s dilemma. Way more dollars are created outside the US than inside the US.
There is really no such thing as a safe haven asset. All assets are bought with money that was loaned into existence. So on someone’s balance sheet somewhere there is a liability that has to be repaid principal plus interest.
So under the right circumstances even the so called safe haven assets will be sold in order to obtain currency to repay debt.
The only dilemma we have is the currency providers. The commercial banks aren’t going to be providing sufficient currency via loans as the energy supply shrinks.
To me the current dollar weakness is simply foreign investors unwinding their positions. They were chasing yields in the stock market and now they’re picking up their toys and going home. Once that ends there will be shortages again and the dollar will strengthen. For as long as the US could pretend it wasn’t in recession and the market momentum continued no one was going to leave the trough.
And as the corporate buybacks return so will the CTA’s and foreign investors.
Stocks have become one big shit show that only reflect the ability for corporations to borrow more money to repurchase stocks and then everyone follows.
This can continue longer than anybody thinks it can. Until the credit taps get turned off it will continue.
It’s quite remarkable that the retirement security of most people in the rich world is dependent on companies borrowing money to purchase their own shares.
When I was young, retirement security was dependent on the growth of profits.
We’re like a starving snake eating its tail to survive.
The damage has already been done, chicken out
https://x.com/Nouriel
My former colleague and co-author
@SteveMiran
is getting a lot of attention – and criticism as in a WSJ oped today – for a paper he wrote last November where he discussed – among many other topics – a possible tax on US capital inflows into US Treasuries as a way to possibly weaken the US dollar, effectively capital controls on inflows. I worked as an advisor at Hudson Bay Capital (HBC) with Steve when he was there. I read the piece, and though I disagreed with a lot of it, I gave him many comments and feedback that made it better. The piece was written for HBC portfolio managers and clients and as such was an attempt to help investors understand the universe of potential tools a Trump Administration might use to achieve some of the aims the President has expressed in his four decades in political life. It’s a catalog of a variety of tools, not a proposal for or advocacy for any specific of them, and Steve stated plainly and repeatedly that it’s not advocacy. Steve dwells at length on the potential downsides and risks from several of the tools, which would be a really weird form of advocacy. It’s an attempt to help investors think through some possibilities and is a piece of hedge fund research, not a think tank research or policy advocacy paper. That’s what economists do all the time – they analyze policies. Just because one might write about the pros and cons of, say, fiscal austerity or fiscal stimulus, doesn’t mean you’re advocating for either policy. I know Steve well and I know he wasn’t then and is not now advocating for something like capital controls. I disagree with many of the views in that paper like his advocacy for optimal tariffs or the view that the inflationary risks of protectionism are low. But any economist (and Steve has a Harvard Econ PhD) may have a broad intelligent discussion of the pros and cons of changing the current international trade, monetary and financial regime in different ways without necessarily advocating specific tools. So there is no “proposal” for a “Miran fee” on capital inflows. The views of the Trump administration on trade go from a spectrum of sensible doves who want to escalate to de-escalate (Bessent, Miran) to protectionist hawks (such as Navarro and Greer). On matter of currency policy and reforming the international monetary system and the role of the US dollar in it the Trump administration has barely started to discuss such matters and all the talk about a possible Mar a Lago accord to change currency values and how to do it is only chatter and no policy yet. Bessent has spoken that the US dollar may remain strong if US fundamentals remain strong and he has replied with perplexity when asked about a Mar a Lago deal. Even Trump – who has in the last spoken of the alleged costs of a strong dollar – has threatened with sanctions countries in the Global South who may think about de-dollarizing. So if there is a hint of any policy about the US dollar – and there is no clear Trump administration policy so far – it is the opposite of capital controls on inflows; rather a veiled threat of capital controls on outflows out of the use of US dollars in trade, payments and finance. But again the Trump administration has so far no coherent or fleshed out policies towards the US dollar and it will take a while until it figures them out. For now they are struggling to find some coherence on trade/tariffs and taxes/spending/deficits. So a clear dollar policy will emerge only much later …
https://www.hudsonbaycapital.com/documents/FG/hudsonbay/research/635102_Activist_Treasury_Issuance_-_Hudson_Bay_Capital_Research.pdf
Will the Last Investor to Leave America Please Turn Out the Lights
The damage from Trump’s trade war is far greater than the losses in stocks, bonds and the dollar seen so far
April 13, 2025 5:30 am/ ET/
The general flight from American assets stood out during a turbulent week. Photo: Michael Nagle/Bloomberg News
When market veterans gather, the talk often turns to memorable crashes: Where they were in 2020, 2011, 2008, 1998, or for the older among them, 1987. Last week should join that list .
Where were you when investors fled America?
The week was full of thrills that will be more fun to look back on than they were for those trying to trade them. Stocks had among their biggest-ever two-day drops
and one of their largest one-day rises , whipsawing investors. Meanwhile, the dollar plunged and Treasurys flashed warning signs of deeper trouble.
https://www.wsj.com/finance/will-the-last-investor-to-leave-america-please-turn-out-the-lights-cdf727b4
“But again the Trump administration has so far no coherent or fleshed out [economic] policies”
And much more damaging than these economic policy flounderings,
The standing of the US as a reliable diplomatic and cultural partner and advocate for international treaties, rule of law, democratic process, and international institutions of civil society has been knee-caped…a self-inflicted and well-deserved wound. That diminished stature and trust is unlikely to ever be regained, regardless of the economic ramifications of the current disorder.
And, it’s deliberate.
Billionaires want to cripple government and the class of knowledge professionals, because those two threaten their power. Government is the tool used by the middle and working classes to maintain some share of power vs the “owning” class, so it must be crippled. Science tends to give power to knowledge professionals. Billionaires can’t tolerate this competition.
Just one example: there are many trillions of dollars of potential stranded assets if fossil fuels were to be replaced. Preventing that loss is a key element of Republican policy.
Again the US government and the Fed aren’t the central of the dollar universe. Eurodollar bank are and what matter is if they are extending credit or not and at what cost.
Everybody view the dollar from the lens of the Fed and US government being at the center and that is incorrect.
If Eurodollar banks were to stop lending in dollars. Then all the dollar liabilities on their balance sheet can’t be repaid.
All the largest banks in Europe and Japan and so on would go bust.
Dollar is not central issues.
Transnational Corporations are the issue.
If Corporations loose the dollar as reserve currency they will loose their paper wealth. They loose monopoly, they loose markets. They loose everything.
Saudi Arabia would lose its paper wealth from all the decades of previous oil sales.
Moving Eurodollars around the globe is a very efficient form of medium of exchange. Moving gold on boats and planes around the globe isn’t very efficient.
Moving ledger money between bank balance sheets is very efficient. Literally nothing physically ever has to move between banks. For banks to net out their balance sheets nothing real ever leaves one bank and goes to another.
The Fed’s SWIFT system is used to make these transactions between banks. But there is nothing preventing one bank not wanting everyone to know what they are doing from moving money in and out of say Russia by just picking up the phone.
The Eurodollar is decentralized money that the world uses to transact with. There is no government oversight in the Eurodollar market.
And the Fed will be cutting soon because they have to. Just like every other Central Bank is doing. Orange man needs to chill the Fed controls nothing it chases the market.
Yeah if the orange man wants cuts it must mean cuts are powerful stuff. Hell he should ask for QE while he’s at it.
I sometimes wonder if this is all a big collaboration to give the Fed credibility and credence so everyone will believe they matter.
Those low interest rates in China sure do have their economy running on all cylinders. You can smell the stimulus effect in the air from those low interest rates on the other side of the earth.
Yeah it’s the signal that the economy is improving and so people invest and magically the economy grows. But this time I don’t think it will work. The global system is too fragile. I think Bessent was caught off guard when bond prices fell during the tariff rampage. The world is in a position that requires it to sell everything that isn’t nailed down. China we know is faking their GDP and preventing price discovery in their markets. The US could have done that in 1929 but didn’t to that extent. The true cause of the 1929 depression was coal peaking in 1927 crashing the global banking system. The addition of oil and the equipment it powered gave the world its last growth period that ended in 2008. And since 2018 even the patches have been unraveling. Great Depression 2.0 unavoidable.
There is sleight of hand shit that Bessent can do. Like treasury bond and bill buybacks. Basically issuing new bonds that are on the run and buying the illiquid off the run treasuries. To hold yields down.
Again all this crap they do to extend and pretend doesn’t matter when energy is in contraction
The true cause of the 1929 depression was coal peaking in 1927 crashing the global banking system.
Do you have some analysis for that, or a source?
The US debt curve shows everything with an upward trend since oil prices >$20
Go into FRED
https://fred.stlouisfed.org/series/GFDEBTN
and add as 2nd line the oil price
See the kinks?
World lives on borrowed time since oil price shock in 2008
The Wuhan virus, deliberately allowed to escape from China, was another disaster
That Fred chart doesn’t show the interest expense that is attached to the debt. Just the nominal value in dollars of the debt.
More is owed than was borrowed. Commercial banks don’t abide by the 10% reserve requirements when it comes to making loans. They just move assets/liabilities around to offshore entities to pass the Fed’s audits.
So the banks just expand their balance sheets to purchase the government debt. Banks pocket the spread between their dollar funding cost. Which is what they pay on bank deposits and what the yield on government debt is. If the government spends another $36 trillion the banks will buy every bit of it with a smile of their face.
This works so long as there is an expanding energy supply.
The dollar liabilities on these banks balance sheets can be repaid regardless if the banks are lending directly into the economy or to the government.
That breaks down as energy availability goes into contraction.
Since 99% percent of all money is created via the issuance of credit or a loan. Having less energy is going to be very deflationary.
Don´t mention the unfunded liabilities…
Even Usdebtclock changed the presentation for some strange reason, total were in the 200Ts+ earlier.
On the bright side my daughter is now a prepper “light”, but still some information needed there.
Btw, I wasn´t here…
Dennis, Ovi and anyone else.
I was looking at the EIA data on crude and condensate production in the USA by gravity. Very interesting stuff. It is for the lower 48, appears to exclude Alaska.
I know this has been discussed quite a bit here.
The data is from 2015 through 2/2024.
Have any of you analyzed this data? How relevant is it? Has sub 45 API gravity already hit an obvious peak in the USA? If so, how relevant is this?
Most of our crude is 31-36 API, with some in the high 20’s. It is light sweet (at least everyone around here calls it that).
Our basis has stayed strong and has been consistent, which has helped through the years 2015-2024, where I would say years 2018, 2022-24 were good, and the rest weren’t, in terms of economics.
Appreciate comments on the gravity issue.
Shallow sand,
I haven’t looked at the data recently for API gravity, I don’t think the EIA is collecting this data anymore.
Did they stop 2/24, or is there a one year delay?
while EIA has this link for API production allocation,
https://www.eia.gov/dnav/pet/pet_crd_api_adc_mbblpd_m.htm
last year, EIA report almost a million BOPD more in API 30.1-40deg oil,
and see my new article here,
https://www.linkedin.com/pulse/shale-tight-oil-getting-heavier-more-natural-gasoline-sheng-wu-mevfc
and youtube link here a year ago,
https://youtu.be/2hxyNIhxmnQ
SHENG WU: This is very good stuff. In some fields in the shale basins, the “true” reservoir is a surprise. For example, in the far NW corner of Divide county North Dakota it had long been a mystery why the wells drilled into the thicker areas of the Three Forks bench (with more oil in place) produced inferior wells, compared to those drilled into thinner sections of the bench. Finally it was found that brown dolostone overlying the Three Forks bench was the superior reservoir, and that the lower gravity oil in that area was due to the dolostone being chock full of oil (by fluorescence). As you know, dolostone is a good place for migratory oil to settle. In that area, there is more non-polar long-chain hydrocarbons than expected. This all fits with migration of heavy oil from Saskatchewan, with polar long-chains staying behind in the bitumen, but migration of non-polar, with eventual uptake by the dolomite. So at least in this area, a pinch-out forming a stratigraphic oil trap, when frac jobs were directed toward the thin first bench of the Three Forks shale, they were also fracking the thin layer of brown dolostones overlying the shale bench, with admixture of shale LTO and migratory heavy oil. I couldn’t transfer the paper but if you google this title you can read a fairly entertaining article on it: “Pitfalls of Model Driven Unconventional Development – The Stratigraphic Trends that Drive Oil & Gas Productivity in Divide County, North Dakota.”
In your nice report, this is obviously not the case, and the aberration of normal C-component production is indicative of what is happening to the pressure in the entire reservoir. But I wanted to illustrate that what has been fracked has not always been the whole story. I would imagine quite a bit of “carbonate oil” has been collected in the shale basins.
Shallow sand,
I think they stopped. Can’t find announcement though.
Also, Chris Wright did a 180 on oil prices needed by the US industry.
Appears he had good fortune to divest all of his holdings of Liberty Energy in the $18-19 per share range, as 2-3 months later it has been $10-12 per share.
Nick G
Here’s a couple references for your life long energy transition study.
https://heartland.org/wp-content/uploads/2025/04/Apr-25-ARC-Scorecard.pdf
https://www.mackinac.org/archives/2024/MCPP-NWU_Energy_Report_Card.pdf
They’re rather large so I’ll sum it up . Basically Natural Gas wins on cost and environmental issues. Second is coal. Dead last is solar and wind.
Now maybe just maybe considering you’ve grown up likely in a capitalist society you’d recognize that the markets already knew this since coal and gas are the largest electricity generators on the planet. It’s not a coincidence.
It ain’t what you don’t know that gets you in trouble. It’s what you know for sure that just ain’t so. S.C.
New posts are up
https://peakoilbarrel.com/opec-update-april-2025/
and
https://peakoilbarrel.com/open-thread-non-petroleum-april-25-2025/