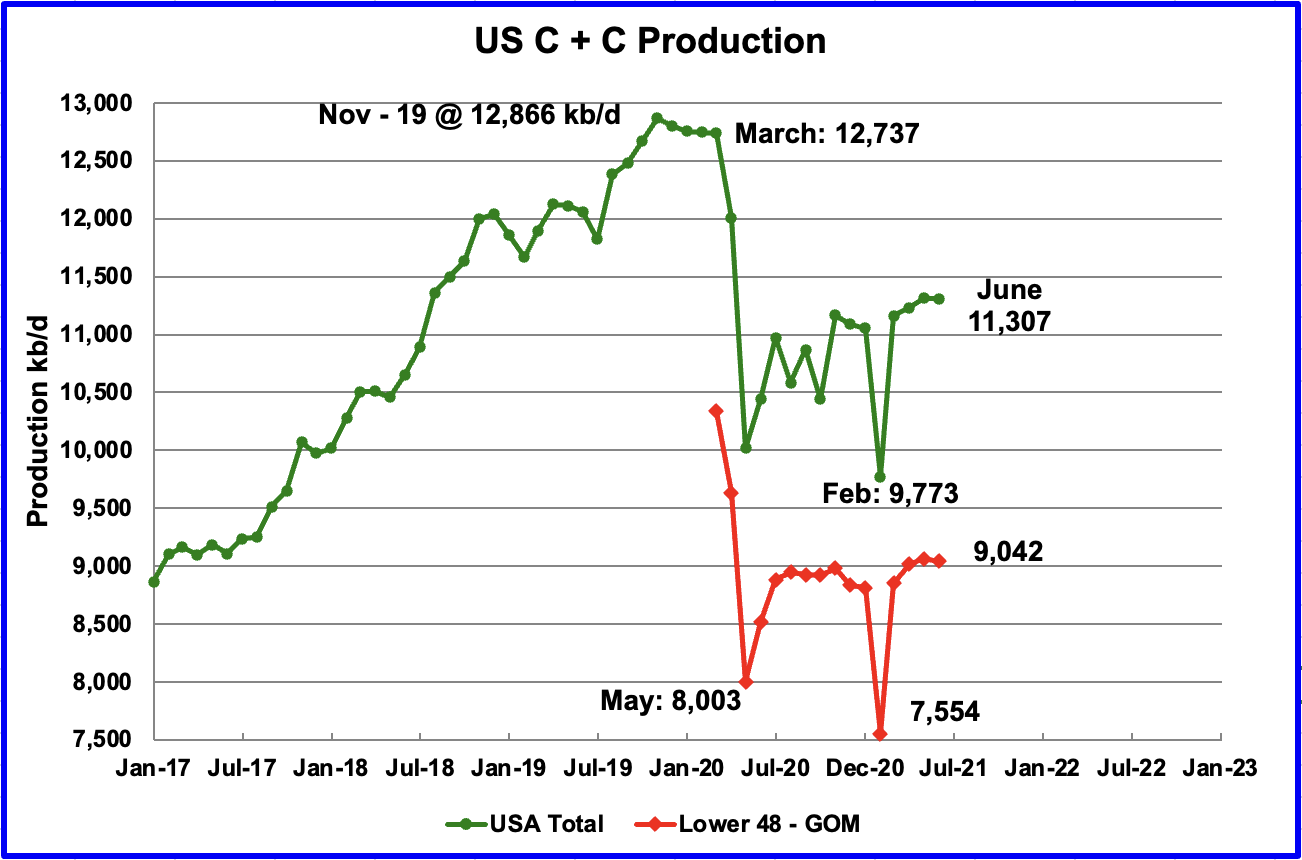
All of the oil (C + C) production data for the US state charts comes from the EIAʼs Petroleum Supply monthly PSM. After the production charts, an analysis of three EIA monthly reports that project future production is provided. The charts below are updated to June 2021 for the 10 largest US oil producing states.
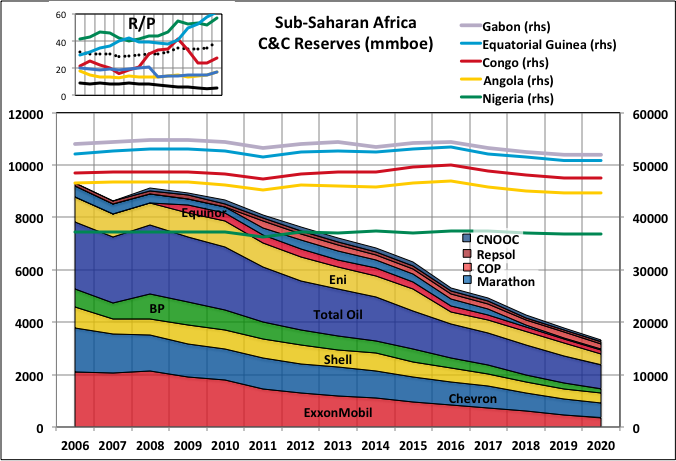
About the only place where properly audited estimates for OPEC’s claimed reserves are available is sub-Saharan Africa, principally Nigeria and Angola, but with Congo, Equatorial Guinea and Gabon as minor players. Except for some on-shore legacy production in Nigeria most of the fields are partly owned and wholly operated by western IOCs that are required to provide accurate estimates for reserves and revisions for SEC and other financial reports.
In the 10-k or 20-f reports the estimates are presented geographically with Africa seprated out and, usually, sub-Saharan Africa separated from North Africa, which is typically lumped with the Middle East (in which the IOCs now have little direct ownership in OPEC countries).
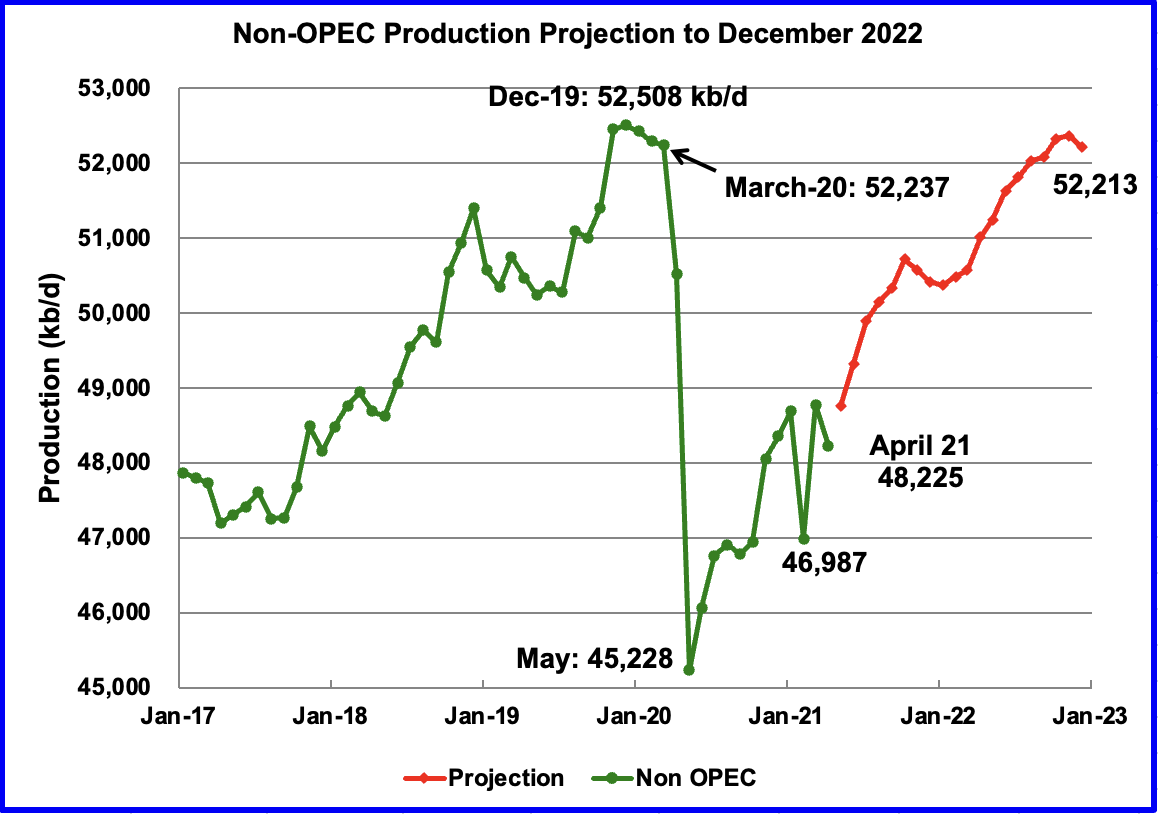
Below are a number of oil (C + C ) production charts for Non-OPEC countries created from data provided by the EIAʼs International Energy Statistics and updated to April 2021. Information from other sources such as OPEC, the STEO and country specific sites such as Russia, Norway and China is used to provide a short term outlook for future output and direction for a few countries and the world.