Comments not related to oil or natural gas production in this thread please, thanks.
Read MoreFuture Decline Rate of World Oil Output
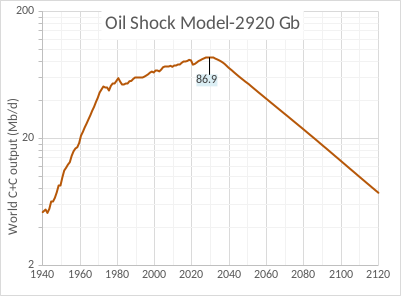
A conservative model of future World Crude plus Condensate (C+C) output is presented below with an average decline rate of 2.8% from 2040 to 2110. From 1933 to 1972 World C+C output increased at an average annual rate of about 7.8% and after the oil shocks in the 1970s and 1980s from 1983 to 2016 output increased at 1.2%/year on average. The decrease in the rate of change in World output was 6.5% between the high growth period up to 1972 and the slower growth period up to 2016. My model projects continued 1.2% average annual growth in C+C output from 2022 to 2029 when the final peak in output is projected. The annual rate of decline gradually increases to above 2.5% by 2039 and is followed by steady decline at 2.8% for the next 70 years. The decrease in the rate of change in output from the earlier period from 1983 to 2029 (about 1.2%) to the period after 2039 is 4%. Chart has a log vertical axis to indicate rates of change in output.
Open Thread Non Petroleum, August 8, 2022
Comments not related to oil or natural gas production in this thread please, thanks.
US May Oil Production Extends Dropping Trend
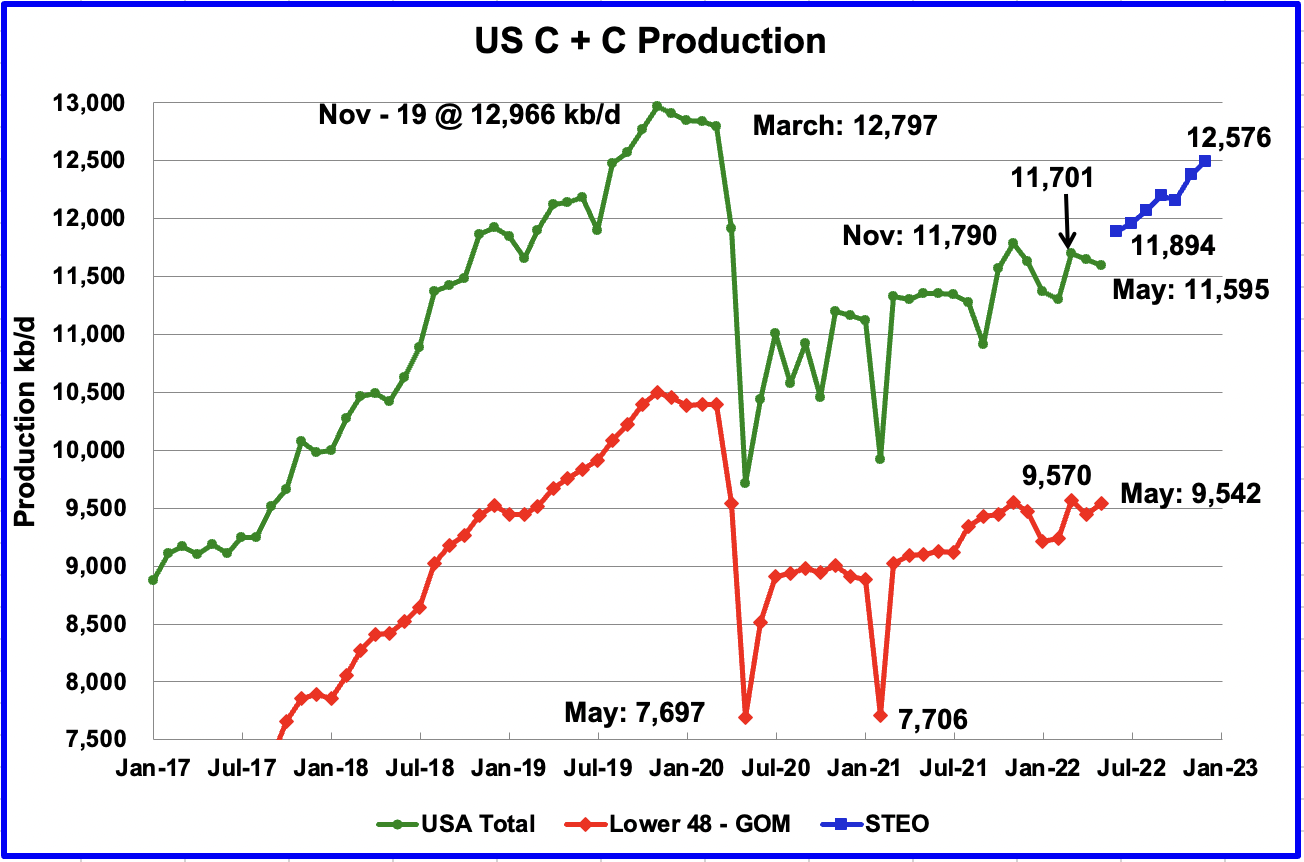
All of the oil (C + C) production data for the US state charts comes from the EIAʼs Petroleum Supply monthly PSM. After the state production charts, an analysis of two EIA monthly reports that project future production is provided. The charts below are updated to May 2022 for the 10 largest US oil producing states.
Open Thread Non-Petroleum July 31, 2022
Comments not related to Oil and/or natural gas production in this thread please. Thanks.
Read More