A guest post by Ovi
Read MoreOPEC Update, September 18, 2022
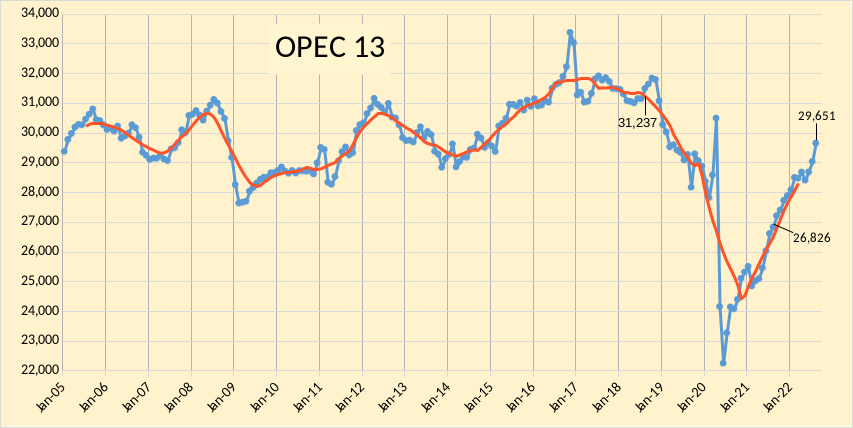
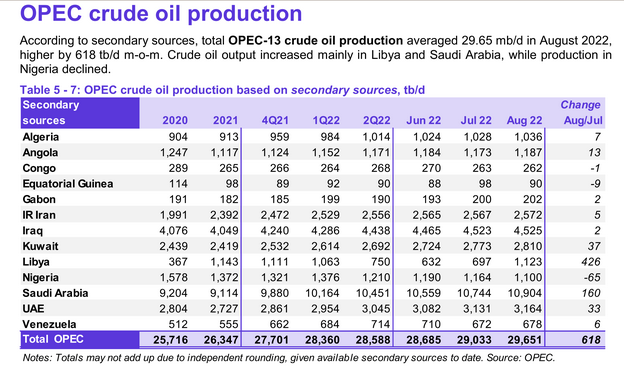
The OPEC Monthly Oil Market Report (MOMR) for September 2022 was published recently. The last month reported in most of the OPEC charts that follow is August 2022 and output reported for OPEC nations is crude oil output in thousands of barrels per day (kb/d). In most of the OPEC charts that follow the blue line is monthly output and the red line is the centered twelve month average (CTMA) output.
Open Thread Non-Petroleum, September 18, 2022
Comments not related to oil or natural gas production in this thread please. Thanks.
May Non-OPEC Oil Production Declines Again
A guest post by Ovi
Below are a number of Crude oil plus Condensate (C + C ) production charts for Non-OPEC countries created from data provided by the EIA’s International Energy Statistics and updated to May 2022. This is the latest and most detailed world oil production information available. Information from other sources such as OPEC, the STEO and country specific sites such as Russia, Brazil, Norway and China is used to provide a short term outlook for future output and direction for a few countries and the world. The US report has an expanded view beyond production by adding rig and frac charts.
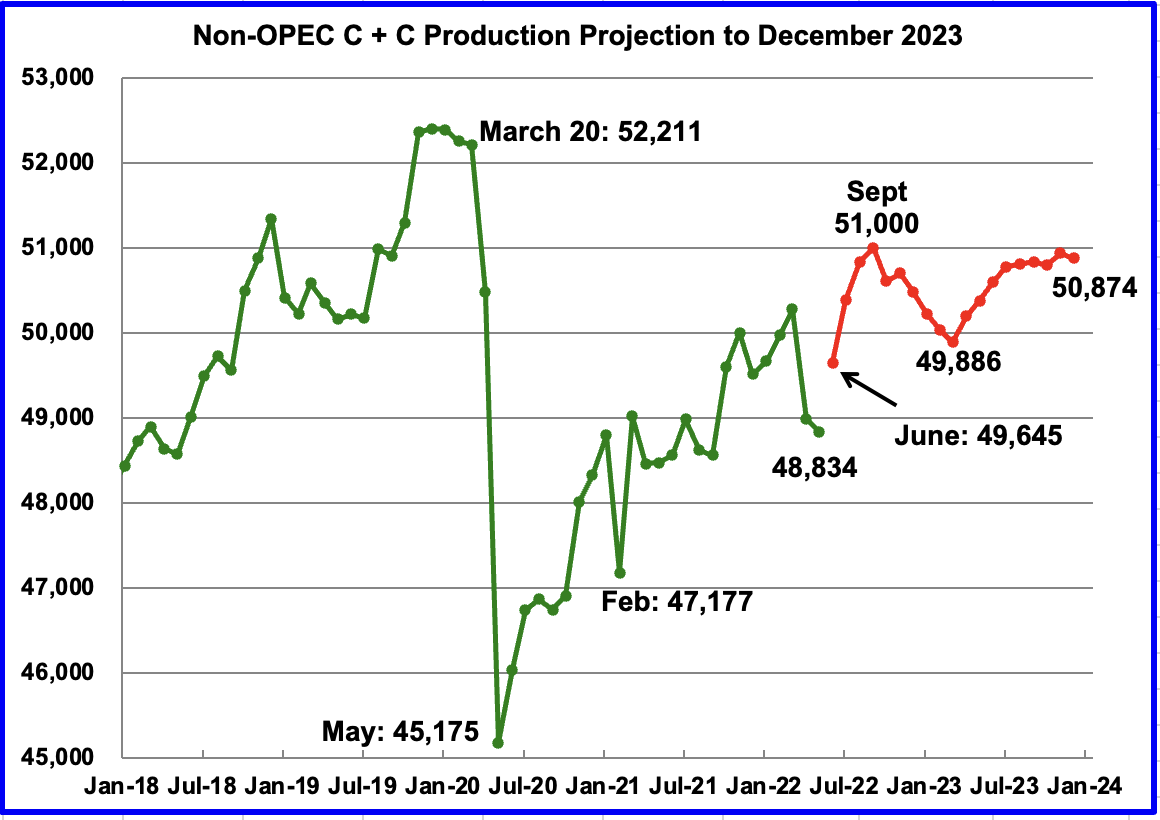
May Non-OPEC production decreased by 148 kb/d to 48,834 kb/d. The biggest decliners were Canada 193 kb/d, Brazil 120 kb/d, US 56 kb/d and Norway 38 kb/d. The biggest offsetting increases came from from Kazakhstan 148 kb/d and Russia 145 kb/d.
Read MoreOpen Thread Non-Petroleum September 10, 2022
A guest post by Ovi
Comments not related to oil or natural gas production in this thread please, thanks.
Read More