North Dakota published their Bakken Production Data yesterday along with their North Dakota Production Data. This all happened the same day the EIA’s Drilling Productivity Report came out. This has resulted in two post in two days.
All charts below are in barrels per day with the last data point May 2014 even though the horizontal axis may only go through April 2014.
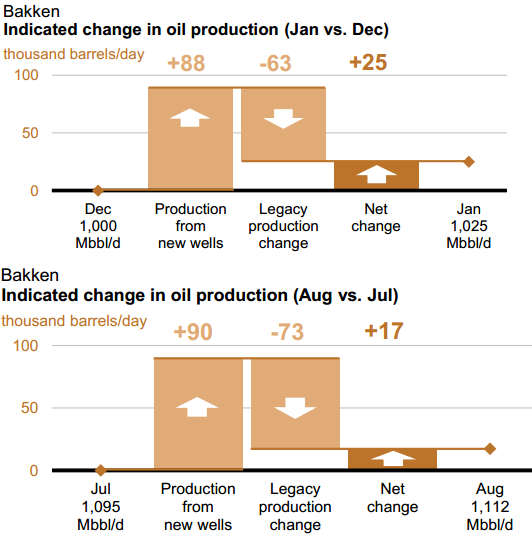
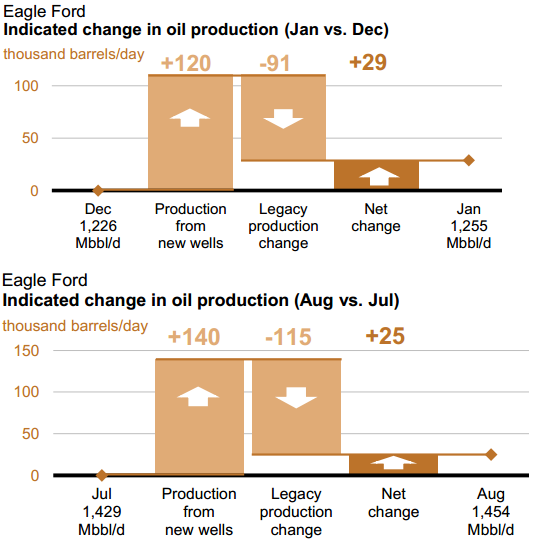
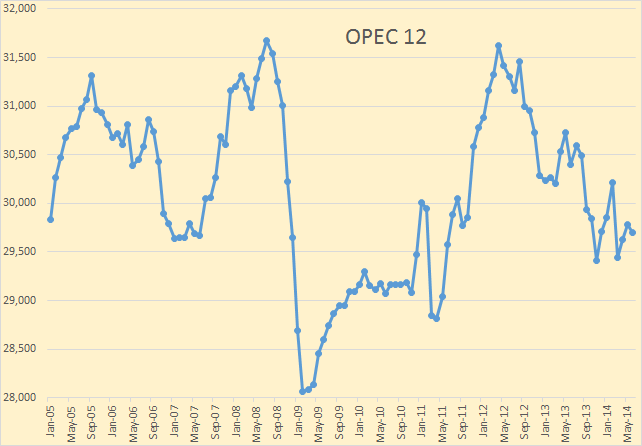
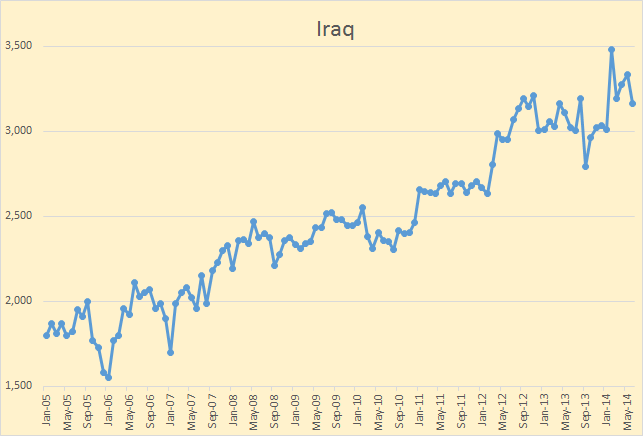
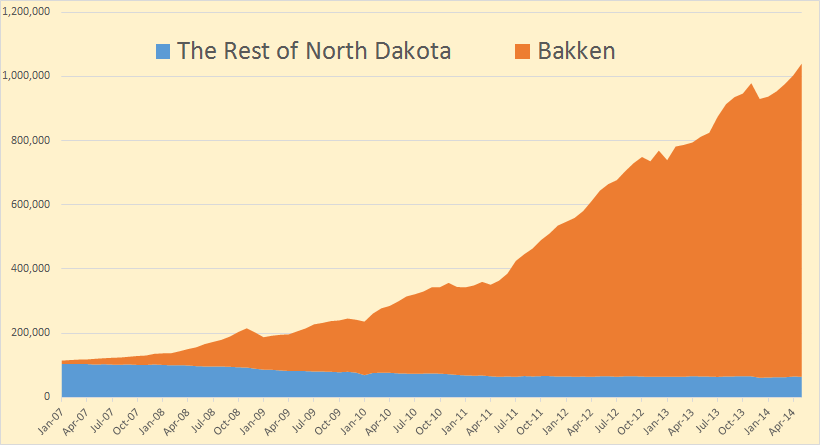
What type of chart is preferable to most folks, the below type?
Or this type?
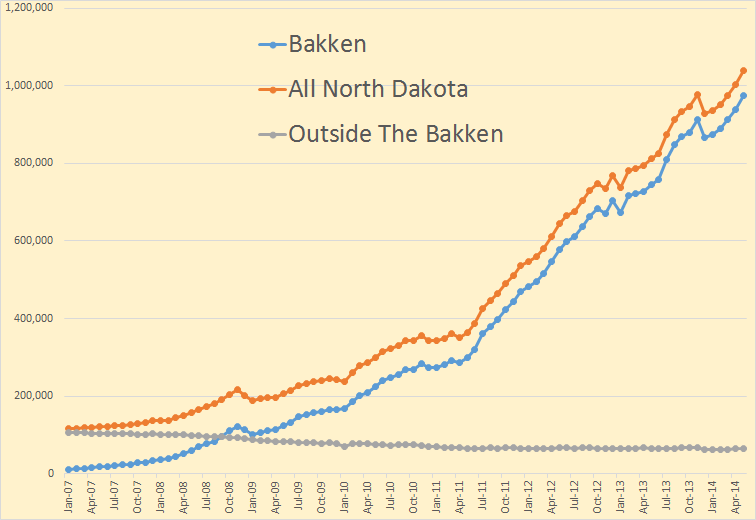
This was a good month for the Bakken. Production was up 36,653 bp/d to 974,695 bp/d. All North Dakota was up 36,379 bp/d to 1,039,635 bp/d. This meant that North Dakota production outside the Bakken was down 274 bp/d to 64,940 bp/d.
From the Director’s Cut, bold mine:
The drilling rig count was up slightly from April to May, and from May to June the rig
count increased by one. The number of well completions increased 14% to 227, but weather continued to impact activity in May with 2 days of heavy rain near Dickinson and 5 to 6 days with wind speeds in excess of 35 mph (too high for completion work).
At the end of May there were about 610 wells waiting on completion services, an
increase of 10.
Read More