The EIA updated their International Energy Statistics on Monday September 29. However there was an error in their data which I caught right away. They had Kazakhstan increasing C+C production by 856,000 barrels per day.

Above is their C+C data, January through June. I emailed Patrica Smith, the EIA employee who posts these stats. She emailed me right back:
Mr. Patterson, Thank you very much for catching the error. The numbers were transposed. I will ask the database manger to make the correction.
So I waited. The next day the correction had not been made so I emailed her back asking her for the correct numbers because this error also affected total world production as well as non-OPEC production. She emailed me back:
Mr. Patterson, The crude number should be 1520 instead of 2420.
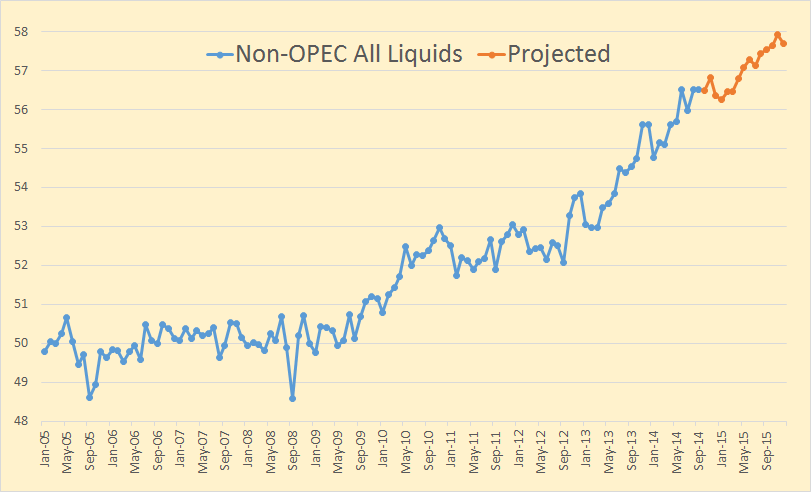
So the number was off by 900 kbpd, Kazakhstan C+C production was actually down 44 kbpd instead of up 856 kbpd. And here three days later the correction still has not been made in the database. I think the international data is getting a very low priority these days. A few years ago, when the International Petroleum Monthly was still being published, they made a similar error. They had Canadian production one million bpd too high. I emailed Ms. Smith and the correction was made immediately and an email went out from the EIA, to all subscribers of the data, informing them of the data error and correction.
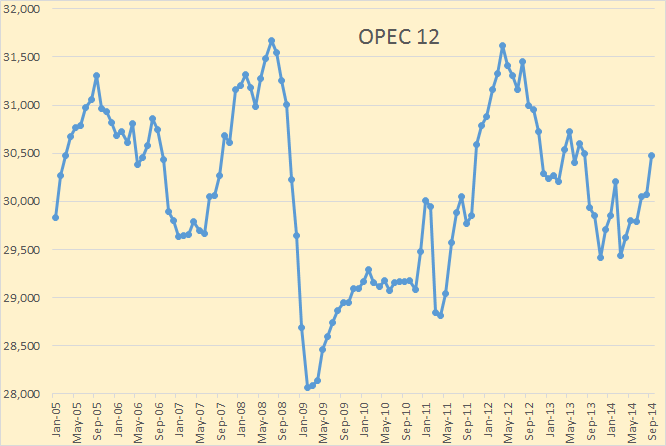
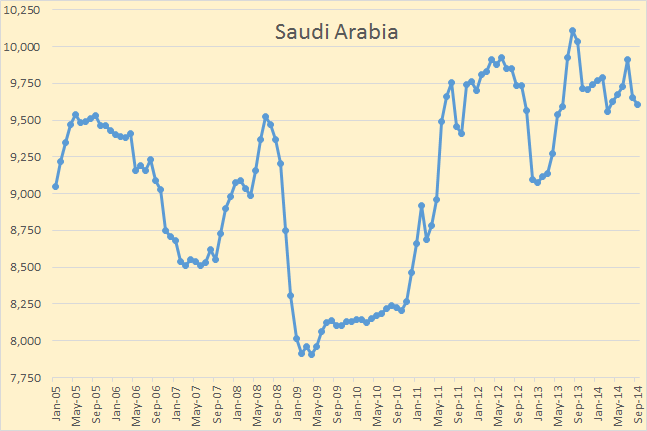
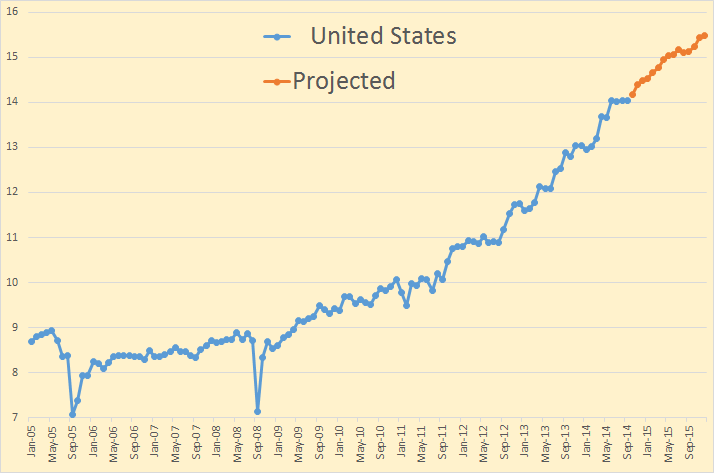
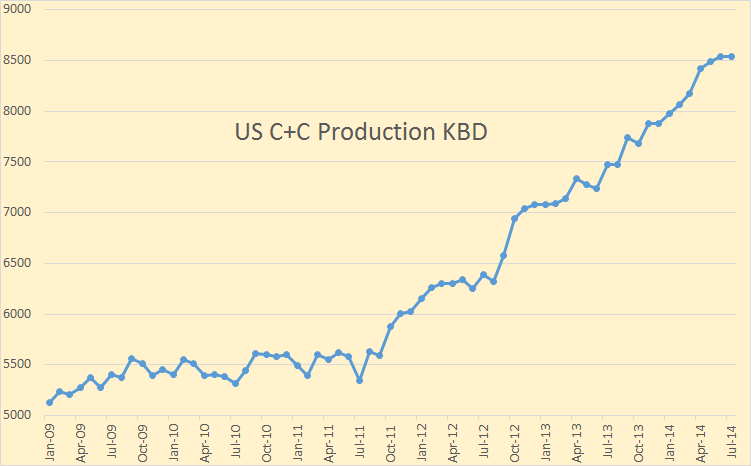
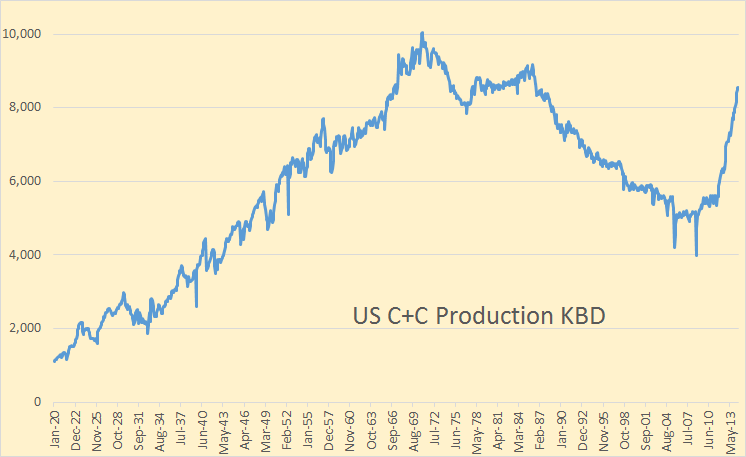
Anyway, the data for all charts below is in thousand barrels per day with the last data point June 2014.
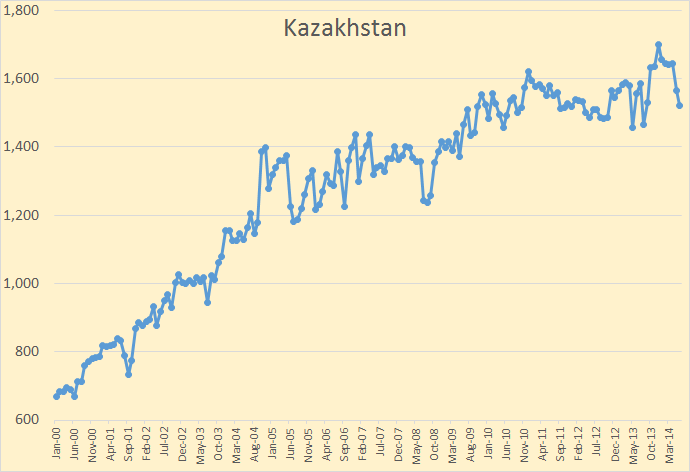
Production from Kazakhstan’s Kashagan field is not expected until the second half of 2016, or about two years from now.
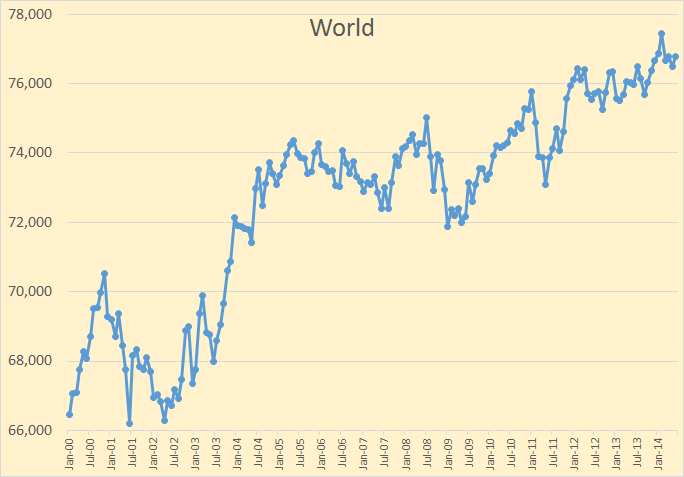
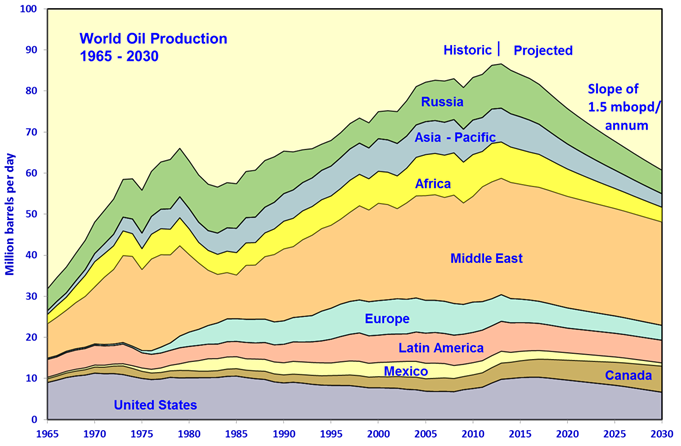
World C+C production was up 189 kbpd in June to 76,695 kbpd but is still down 747 kbpd below the peak in February.
Read More