This is a guest post by Ciaran Nolan
Bakken December Production Numbers
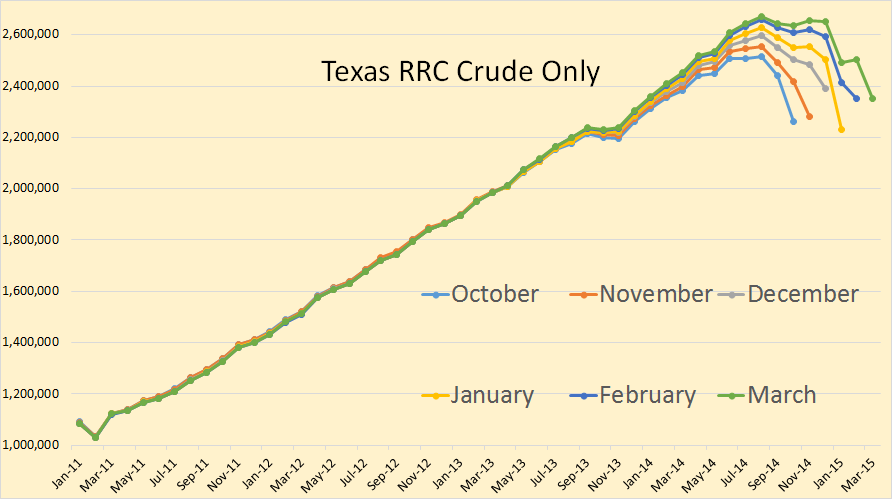
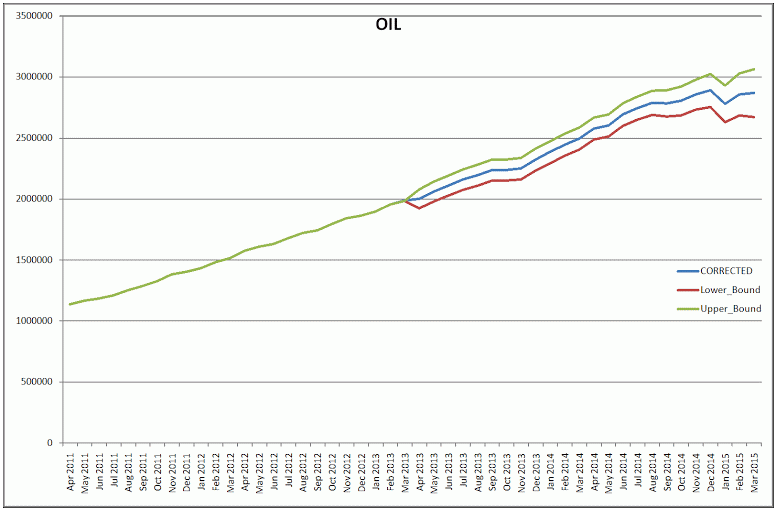
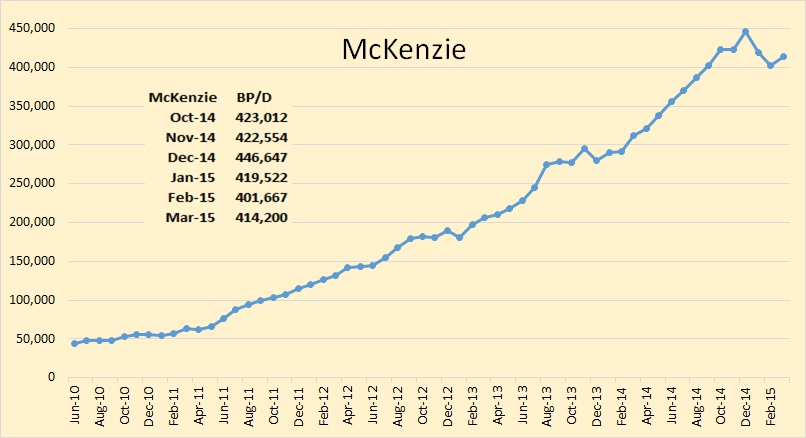
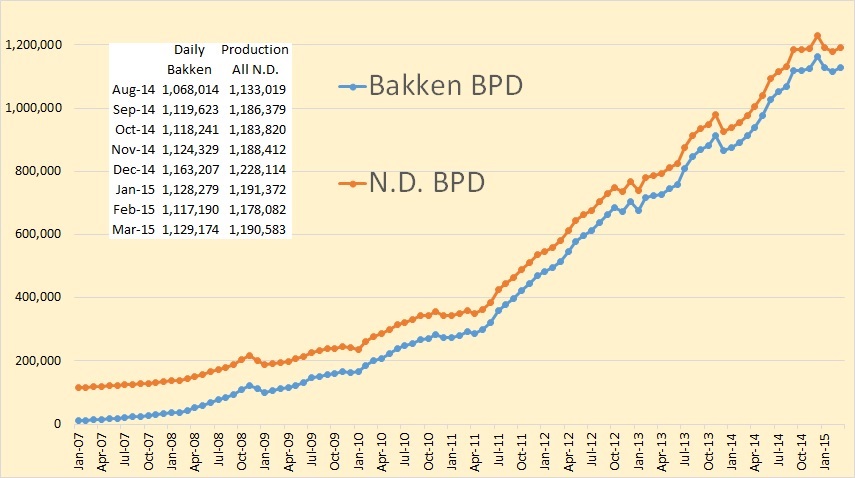
The North Dakota Industrial Commission has released the Bakken and North Dakota monthly production numbers for December 2014. There was a bit of a surprise as Bakken and all North Dakota production was up just over 39,000 barres per day.
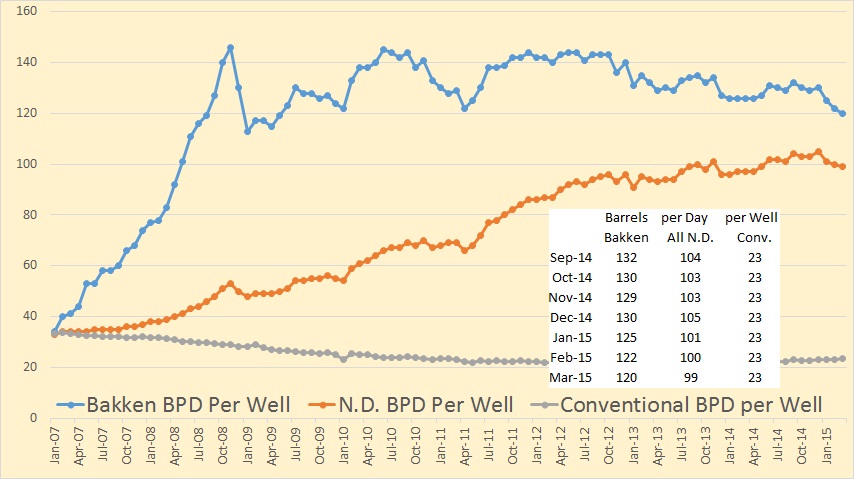
Since Bakken production was up at almost the exact same amount as the rest of North Dakota, (Bakken up 39,080 kbd vs. 39,086 bpd for ND), suggest that all the wells being brought on line are Bakken and Three Forks rather than conventional wells.
The North Dakota change per month, 12 month trailing average reached a new high in December of 25,006 barrels per day. That means North Dakota oil production was up an average of 25 thousand barrels per day every month in 2014.
OPEC’s Production and Outlook
The latest OPEC Monthly Oil Market Report is out with all the OPEC crude only production numbers for January 2015. There were very little revisions in the December numbers this month.
Total OPEC production of crude only was down 53,000 barrels per day in January to 30,153,000 barrels per day of crude only.
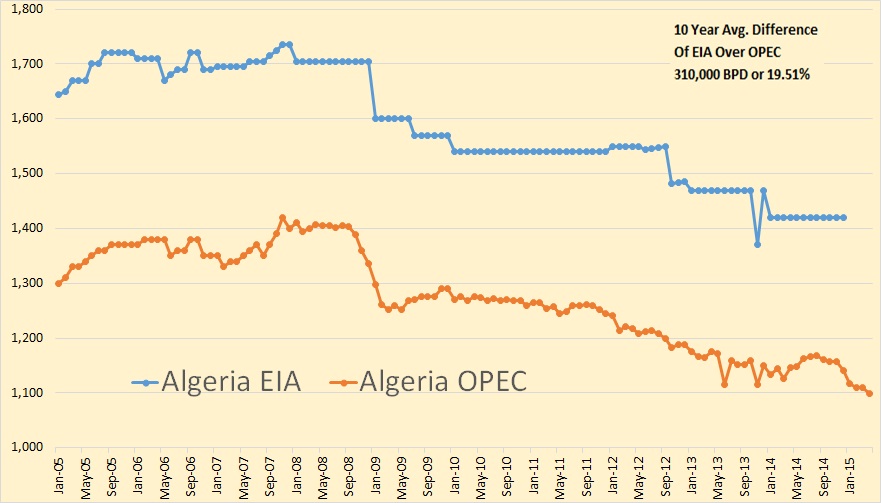
Algerian production has leveled out in the last year and a half but down slightly the last couple of months. January production slipped 13,000 bpd to 1,130,000 bpd.
The EIA’s Great Expectations
The EIA, in their INTERNATIONAL ENERGY OUTLOOK 2014 publishes what they call “World crude and lease condensate production by region and country, 2009-2040, (Table A5). Since I only track C+C, or Crude Only in the case of OPEC, I thought it would be interesting to see where they thought C+C production was headed in the next 25 years.
An note about the charts below. The EIA data in this report only uses historical data for 2009 thru 2011. However I extended that historical data through 2014. The data for 2014 is the average C+C production January through September. Also note that the historical data is yearly but the projected data is in 5 year intervals, 2020 through 2040. All data is in thousand barrels per day.
The EIA is expecting world C+C production to be over 99 million million barrels day in 2040, or about 22 million barrels per day higher than today. And just where do they expect all this oil to come from?
They expect about two thirds of that increase to come from OPEC. They have OPEC increasing production by almost 14.1 million barrels per day by 2040. The “Call on OPEC” is going to get quite large. They don’t say which countries all this oil will come from but they say 11.5 million barrels per day will come from the Middle east, 900 kbd from North Africa, 1 Million barrels per day from West Africa and 700 kbd from South America.
Why we are at Peak Oil Right Now
In this life nothing is certain. Therefore I am not declaring, absolutely, that we are at peak oil, only that it is a near certainty. But I am putting my reputation on the line in making the claim that the period, September 2014 through August 2015 will be the year of Peak Oil. Below are my reasons for making this claim.
First of all, Peak Oil is not a theory. The claim that Peak Oil is a theory is more than a little absurd. Fossil hydrocarbons were created from buried alga millions of years ago and they are finite in quantity. And as long as we keep extracting them in the millions of barrels per day, it is only common sense that one day we will reach a point where their extraction starts to decline. In fact most countries where oil is extracted are already in decline. So obviously if individual countries can experience peak oil then the world as a whole can also experience peak oil.
All charts below are in thousand barrels per day of Crude + Condensate with the last data point September 2014.
First I want to deal with the portion of the world that reached peak oil about four years ago, in January 2011. That is everywhere else in the world except the US and Canada. I am not saying that every country outside the US and Canada has reached peak oil, but combined they have reached peak oil
The world outside the United States and Canada has been on a bumpy plateau for ten years now and now, even with that last September 2014 surge, is still 1,670,000 barrels below the peak of January 2011. However only a few countries is responsible for this plateau.
The bumpy plateau actually began back in 2005 where the peak was in July. Since them, outside the USA and Canada, there have been 15 countries with production increases and 21 countries with production declines. Here is a look at the 15 winners outside the US and Canada.
Dealing with the winners one at a time: