Where did all the oil go? The peak is back
An extensive new scientific analysis published in Wiley Interdisciplinary Reviews: Energy & Environment says that proved conventional oil reserves as detailed in industry sources are likely “overstated” by half.
According to standard sources like the Oil & Gas Journal, BP’s Annual Statistical Review of World Energy, and the US Energy Information Administration, the world contains 1.7 trillion barrels of proved conventional reserves.
However, according to the new study by Professor Michael Jefferson of the ESCP Europe Business School, a former chief economist at oil major Royal Dutch/Shell Group, this official figure which has helped justify massive investments in new exploration and development, is almost double the real size of world reserves.
Wiley Interdisciplinary Reviews (WIRES) is a series of high-quality peer-reviewed publications which runs authoritative reviews of the literature across relevant academic disciplines.
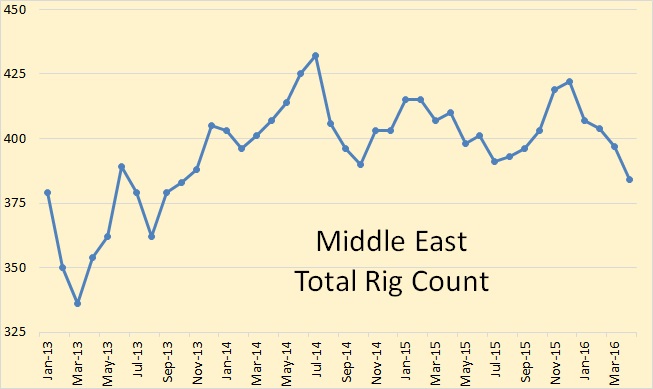
According to Professor Michael Jefferson, who spent nearly 20 years at Shell in various senior roles from head of planning in Europe to director of oil supply and trading, “the five major Middle East oil exporters altered the basis of their definition of ‘proved’ conventional oil reserves from a 90 percent probability down to a 50 percent probability from 1984. The result has been an apparent (but not real) increase in their ‘proved’ conventional oil reserves of some 435 billion barrels.”
Global reserves have been further inflated, he wrote in his study, by adding reserve figures from Venezuelan heavy oil and Canadian tar sands – despite the fact that they are “more difficult and costly to extract” and generally of “poorer quality” than conventional oil. This has brought up global reserve estimates by a further 440 billion barrels.
Jefferson’s conclusion is stark: “Put bluntly, the standard claim that the world has proved conventional oil reserves of nearly 1.7 trillion barrels is overstated by about 875 billion barrels. Thus, despite the fall in crude oil prices from a new peak in June, 2014, after that of July, 2008, the ‘peak oil’ issue remains with us.”
Read More

