Many different oil shock model scenarios have been presented over time at Peak Oil Barrel. Information on the Oil Shock Model, originally developed by Paul Pukite can be found in Mathematical Geoenergy. The future is unknown, so future extraction rates from conventional (excludes tight oil and extra heavy oil) oil producing reserves are unknown. Also not known are future oil prices which will affect the amount of tight oil and extra heavy oil that is ultimately produced.
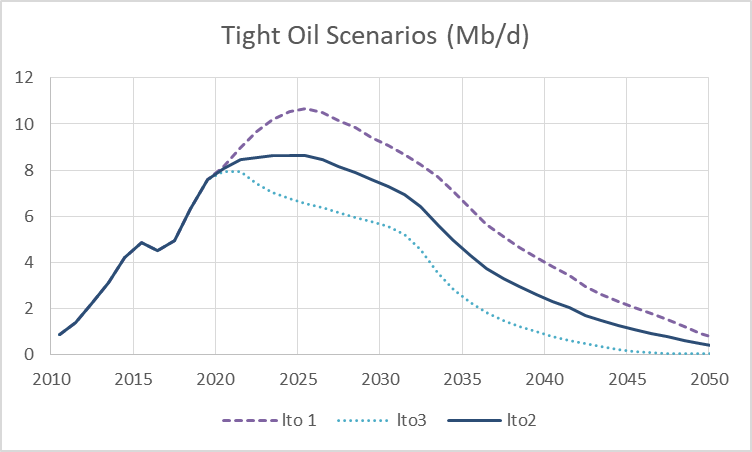
For tight oil I have created three scenarios corresponding to a low, medium and high oil price scenario. Likewise I have created three scenarios for extra heavy oil which correspond to the same low to high price scenarios used for the tight oil scenarios.
The mean estimates by the United States Geological Survey (USGS) for technically recoverable resources in tight oil plays combined with reasonable economic assumptions and data gathered from www.shaleprofile.com are used to model tight oil output. The EIA’s AEO 2018 reference oil price scenario is used for the high oil price case and the low scenario uses the AEO reference price case up to the date when it reaches $70/b in 2017$ and assumes oil prices remain at $70/b for all future dates. The medium oil price scenario is the average of the low and high price cases.
Read More