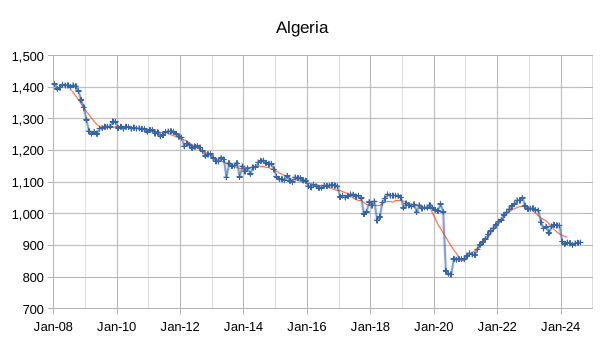
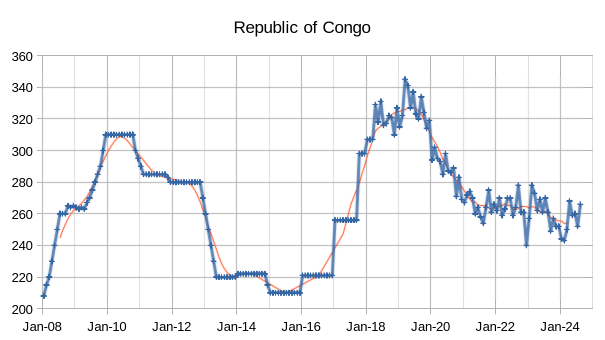
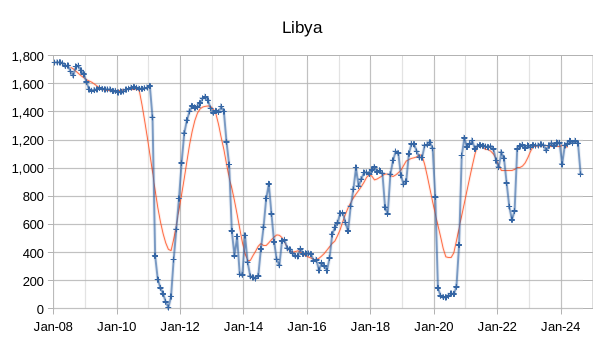
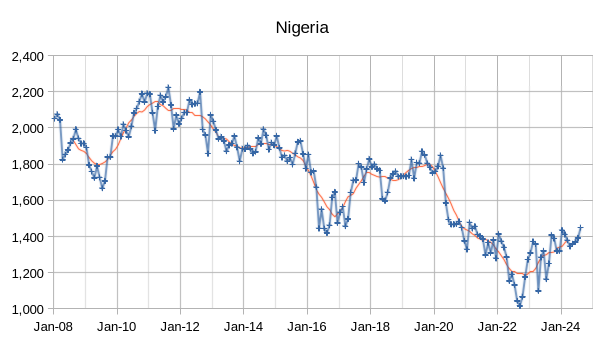
The OPEC Monthly Oil Market Report (MOMR) for September 2024 was published recently. The last month reported in most of the OPEC charts that follow is August 2024 and output reported for OPEC nations is crude oil output in thousands of barrels per day (kb/d). In the OPEC charts below the blue line with markers is monthly output and the thin red line is the centered twelve month average (CTMA) output.
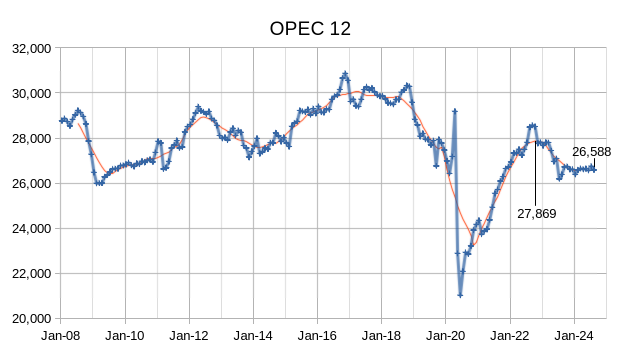
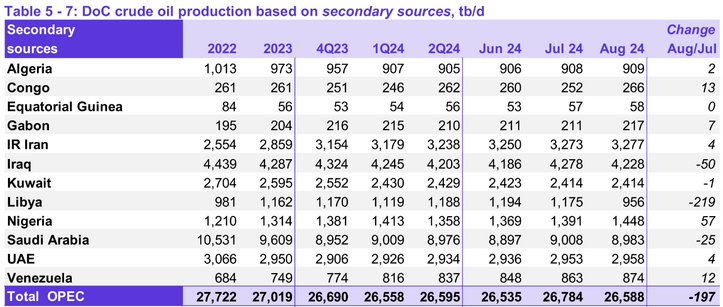
Output for June 2024 was revised lower by 27 kb/d and July 2024 output was revised lower by 28 kb/d compared to last month’s report. OPEC 12 output decreased by 197 kb/d with most of the decrease from Libya’s output (219 kb/d.) Iraq decreased by 50 kb/d, Nigeria increased crude output by 57 kb/d, Saudi Arabia saw a decrease of 25 kb/d.
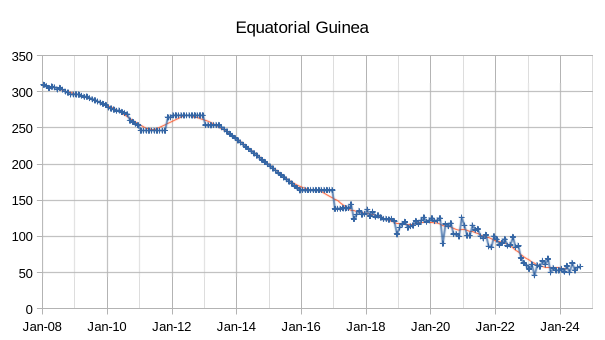
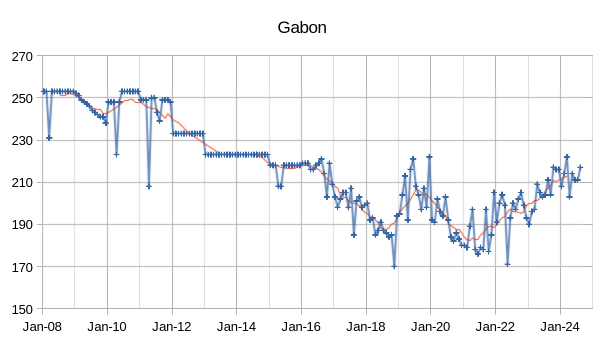
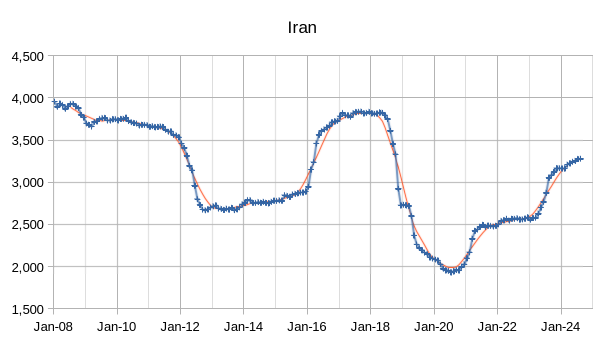
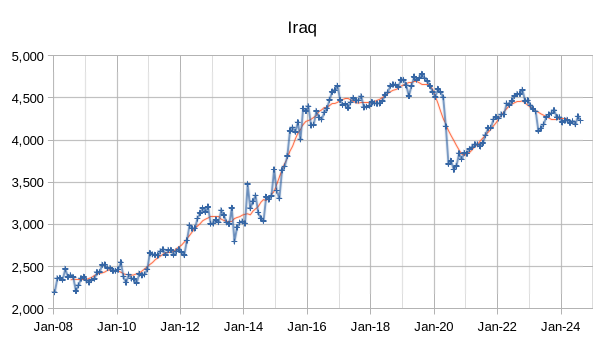
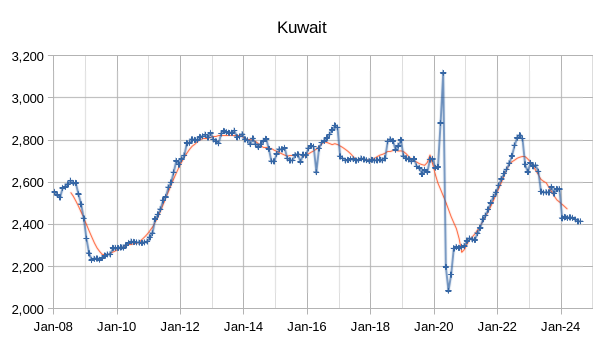
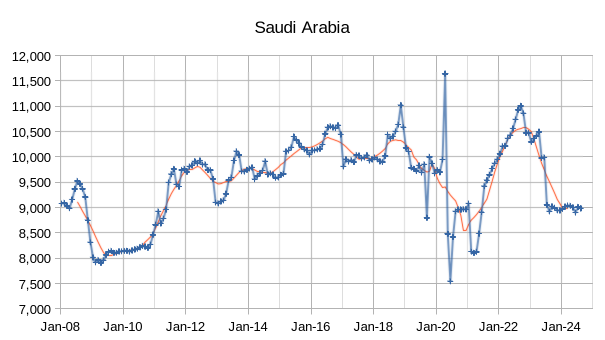
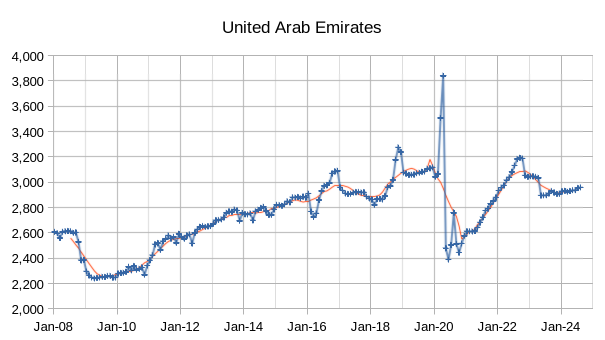
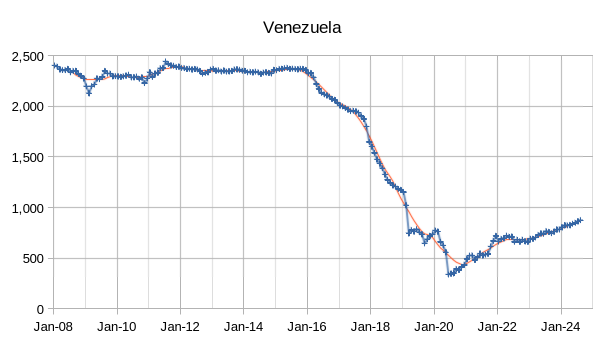
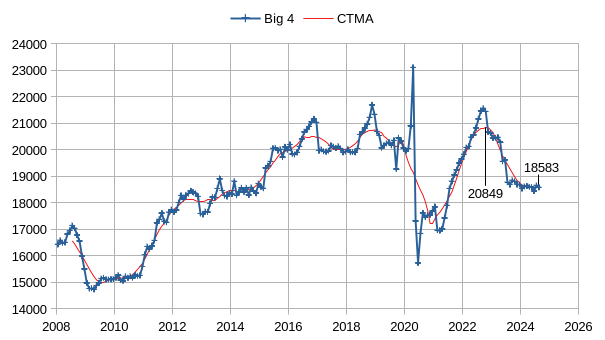
The chart above shows output from the Big 4 OPEC producers that are subject to output quotas (Saudi Arabia, UAE, Iraq, and Kuwait), since the post pandemic peak in 2022 where centered 12 month average (CTMA) output from the Big 4 reached 20849 kb/d, crude output had been cut by 2266 kb/d relative to the 2022 CTMA peak to 18583 kb/d. Potentially the Big 4 may have roughly 2270 kb/d of spare capacity when World demand calls for an increase in output.
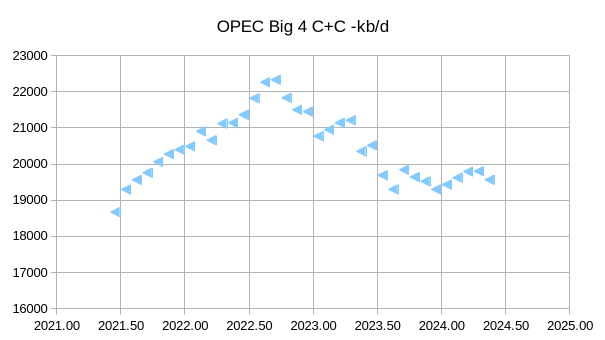
Since the pandemic the Big 4 OPEC producers output has been relatively flat with an increase to 2022Q3 and then back down up to 2024.
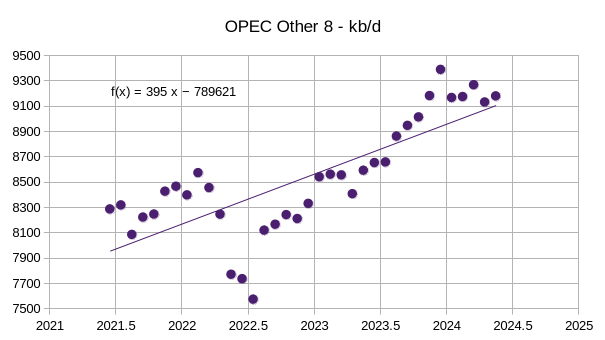
The OPEC Other 8 (not Big 4 OPEC producers) has increased at about 400 kb/d over the past 3 years on average.

My expectation is that future growth of C+C output in the US may be much lower than the recent past and possibly even no future growth in output. The World C+C minus OPEC Big 4 and US output has increased at about 860 kb/d over the past 3 years, if we deduct the OPEC Other 8 (from previous chart) increase of 400 kb/d, this leaves about a 460 kb/d increase for World minus US minus OPEC.
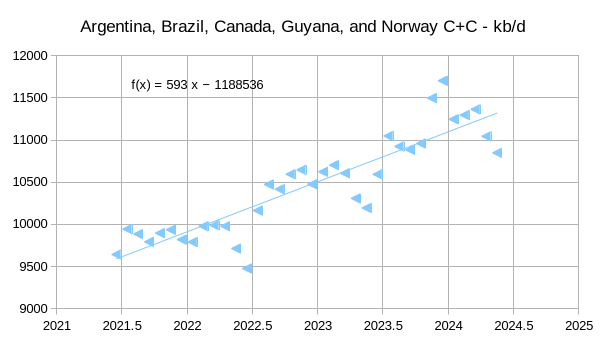
The chart above shows that all of the World increase in C+C output from the past 3 years was primarily from the US and the 5 nations in the chart above. Future increases in World output are likely to be from these 5 non-OPEC nations and the OPEC Big 4, if my assumption that US growth will be low is correct.
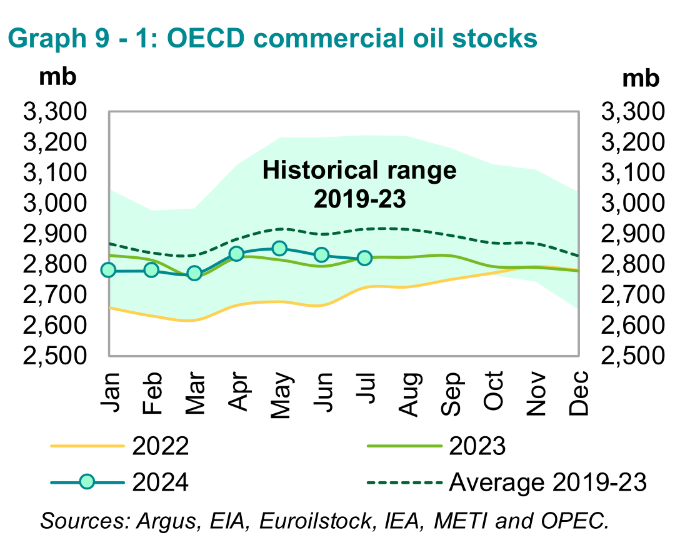
OECD stocks are close to the 2023 level and below the 5 year average. Brent crude prices remain under $75/b, which is $5/b less than last month. The World oil market seems adequately supplied with oil at present.


The World demand estimates for 2024 and 2025 were revised lower by 100 kb/d compared to last month, estimates are significantly higher than EIA estimates for World demand in 2024 and 2025. The supply estimates from the non-DOC were raised by 100 kb/d compared to last month. If World oil demand is as high as OPEC forecasts, the World may struggle to meet demand in 2025, though it seems likely that the 2025 World liquids demand estimate by OPEC is at least 1 Mb/d too high. If I am correct then the World will have adequate oil supply in 2025.

The OPEC forecast for US tight oil growth ha been revised lower since last month, though it still seems a bit optimistic.
Any thoughts on doombergs statement that only gas capacity is restricting shale oil production?
Sean,
Low natural gas prices may be reducing tight oil profits and reducing output, we will know more as more capacity gets built. Eventually tight oil output will fall, probably by 2028, meantime growth in tight oil output will either be slow or zero (no growth in output).
On the margins, natural gas prices have to affect oil production. This is just economic theory. Any time you have coproducts, the price of one will affect production of the other (in addition to the price signal for the primary product).
The classical example is sodium hydroxide and chlorine production. Processing of NaCl leads to both Cl2 and NaOH. Now…it turns out that chlorine gas is generally the more valuable product (for use in PVC and the like). Often the revenue extracted for sodium hydroxide is negative, but still less than disposal cost. Again, this is a classical example…and just a microeconomics textbook case. Not an issue of peak oilers versus cornucopians, not an issue of right wingers versus left wingers. Just basic concept of economics with coproducts.
Now, the situation with oil and gas is very similar. Most wells produce oil and natural gas, both. In general, oil is the more valuable product, but both are generally sold. And of course some wells are carried more by gas revenue than by oil.
Perhaps the classic example is “ass gas” (associated gas) from oil wells. Many wells in the Bakken and Permian can justify their drilling from oil price alone, so the gas is “associated” (i.e. “extra”). As such, this ass gas tends to lower the price of natural gas in general.
But of course the opposite can occur also. You can even have wells that are sort of 50-50 in terms of revenue from natty and oil (lease condensate). This is common in OK and in the Eagle Ford.
The effect of natty price (low prices inhibiting oil drilling) can be exacerbated by flaring restrictions. For example we have had semifrequent examples in Canada and in the Permian of natural gas prices going negative! Why do the companies sell at a negative price? Because the law limits them from flaring (burning the natty) or from venting (just letting the natty loose). However if the oil is valuable enough, it may still make sense to pay the negative cost (or to flare if allowed). But when things get bad enough, and for wells on the margin, low natty prices can inhibit oil drilling.
Overall, I think this is mostly a “cope”. I don’t think the natty inhibitions are huge (except when governments prevent flaring AND prevent building pipelines…then you can hard shut down those evil oil drillers). To me, it’s mostly an issue on the margin. Something. Sure. But not huge.
Nony,
Economics is all about marginal cost and marginal revenue (when they are equal profits are maximized), low natural gas prices can be the difference between profit and loss.
If oil prices and natural gas prices fall to a level that production is no longer profitable, the rational producer stops development of new wells when the expectation is that they will lose money on their investment.
Nony,
EIA says low natural gas prices have reduced revenue for US Oil producers for 2024Q1.
https://www.eia.gov/todayinenergy/detail.php?id=63204
I come here for the oil production. I stay for the chloralkali electrolysis. 🙂
Russia, crude only. Data is through August 2024.
I believe Russia is at maximum production and is in slow decline.
Click on chart to enlarge.
Ron,
Part of the fall in Russia’s production may be due to western sanctions and part may be due to OPEC plus quotas. I doubt Russia returns to their 2019 peak, but they might return to 10 Mb/d if the war with Ukraine ends and with that the end to western sanctions.
I knew that would be your opinion Dennis. It is just that I believe you are wrong this time.
Ron,
Fair enough. Note that current crude target for Russia for OPEC plus agreement (DoC) for August 2024 is 8.98 Mb/d and according to OPEC secondary sources Russia’s crude output was 9.06 Mb/d in August, pretty close to their quota. When quotas have been removed we will have a better idea of what Russia can produce, in my opinion.
IEA has Russia’s capacity at 9.76 Mb/d in Sept Oil Market report and in 2022 OPEC secondary sources has Russian output at 9.77 Mb/d for the yearly average crude output.
https://www.iea.org/reports/oil-market-report-september-2024
Dennis/Ron
I think that Western sanctions are playing a big part in the drop of Russian crude because the drilling of new wells is being hampered by lack of spare/crucial drilling parts along with the expertise of knowing where to drill. Decline is also playing a roll. It will take a few more months of data to see if the decline continues slowly or stabilizes at some lower level.
According to Argus, Russian August crude production of 8,978 kb/d is essentially in compliance with their OPEC target of 8,980 kb/d. S & P Platts estimates Russian crude production to be 9,050 kb/d, close to the OPEC estimate of 9,059 kb/d.
Russia just looks after its own interests and has always over produced. Let’s see if the next Argus update shows production below OPEC’s Russia target.
DENNIS
the end to western sanctions.
Well maybe, but it’s hard to imagine a scenario where that happens in the short term. Putin seems unlikely to back down, and Ukraine can’t defeat Russia.
It’s hard to see what the latter would even mean. Overthrowing the government? That might end the sanctions, but won’t do oil production much good. And if Russia wins by conquering Ukraine, the sanctions won’t end.
It looks to me like Putin has put an end to Russia oil exports to the West for a couple of decades.
Alimbiquated,
There is the possibility that an extended stalemate could lead to a negotiated settlement. It is possible Russians may get tired of the Putin cult.
The market will be supplied, just by a more roundabout route, via India blends, for example.
Also, the west has less and less visibility on where RU oil goes, as RU buys its own tanker fleet and arranges its own insurance.
I am doubtful that Russian oil industry restriction by the ‘West’ will be lifted unless Russia gives back all of the Ukraine that it has taken. And that is not in cards.
My guess is that the war between Russia and Ukraine will end 3 to 7 years from now. Likely to he incorrect.
End of this year or first half of 2025 if Ukraine doesn’t create a provocative on undisputed Russian territory (dirty bomb, attack on Kursk nuclear power station etc).
Russia is now a war economy which means high inflation, now 19%
https://www.youtube.com/shorts/kJpGaZn8uz4
For me this is peak oil in a dictatorship. Similar to Sudan, Yemen, Libya, Syria
Rystad did an estimate before Covid. See Fig 3 in my post:
https://crudeoilpeak.info/russian-oil-production-update-nov-2021
Needs an update of course.
I was too busy with participation in public consultation and writing submissions against oil/energy illiterate projects in Sydney, Australia, like the 2nd airport and very expensive metro tunnels which do not replace car traffic because toll-ways are built parallel to the metros
Thanks Matt. Not many people realize just how close Russia is to total collapse. Putin’s war has backfired on him horribly.
It’s High Time to Prepare for Russia’s Collapse
That headline was from January of last year, but this one is from just 12 days ago:
Russia’s Central Bank Raises Rates to 19% as Inflation Ticks Up
Russia’s Central Bank on Friday raised its key interest rate from 18% to 19%, a widely anticipated move as the country struggles to cool down inflation amid soaring military spending for the war in Ukraine.
Russia may survive this war but the effects on it will take decades for its economy to recover. It will leave Putin’s rule tedious at best. But it doesn’t matter if Russia survives or collapses, as your charts show, Russian oil production will continue to decline and every economist in Russia knows this.
Yes of course oil will decline. The gas resource is enormous.
Russia is proactively moving to develop it’s non fossil fuel sector, promote small nuclear plants suitable for export esp. to the global majority countries, and, like everyone, going for ‘value added’ exports, rather than export of the raw materials.
The economy is doing astonishingly well.
https://www.lauriemeadows.info/conflict_security/The-West's-Apartheid-Trading-System.html#How_is_the_Russian_economy_doing
By the way the Russian deputy Prime Minister said the other day that 90% of drilling tech has been replaced by locally produced gear, and the last 10% will be replaced in the next few years.
He noted demand for “energy” increases by about 13% a year due to global population etc growth and expects that to continue.
He believes “oil and gas” won’t peak until 2050. Of course he is deliberately conflating the 2 streams!
Laurie, thanks for the rebuttal. Obviously, I disagree with your analysis. But I am just not in the mood to argue with you right now. I have bigger fish to fry. So you can claim victory.
Take care, Ron
Wow.
Russian propaganda is sometimes pretty over the top. Funny how Russians like to use very American names, like Laurie Meadows…
What might matter is if NATO aligned oligarchs?? take over for Putin….
Orban and who else? I really don’t think there is a chance of that happening. The risk of getting kicked out of NATO is too great?
It was said before that oil production decline from the Russian mature oil fields would be compensated by EOR. As the Russians counted on foreign investment, consumables from abroad and foreign technical expertise to achieve this and much of these ressources are no longer available now, I suppose what we are watching is the ”naked” oil production decline.
Dennis,
Thank you for the report. Much appreciated.
What is your view on the percentage chance of an economic slowdown or a recession into 2025 ?
I suspect you are correct that OPEC has a spare capacity of ~ 2 Mb/d. And future demand growth will come from a the 5 countries listed.
I assume you think chances are WTI prices will be in the range of 65-85 for this and next year ?
Iron Mike,
Thank you.
I would put the probability of a Worldwide Recession (which I define as less than zero World real GDP growth in a 12 month period) as less than a 10% probability. I expect future production growth from those 5 nations plus the OPEC Big 4, also possibly some growth from Russia and Venezuela if political problems are eventually resolved (this seems not likely in the next 5 years). Demand growth will come from non-OECD nations, but much of this may be offset eventually from lower demand from OECD and China over the next 10 years. Yes that would be my guess for oil prices in 2024 $ over 2024 and 2025 for average 12 month Brent oil prices.
For the most recent 12 months the average real Brent price has been $85/b in 2024 US$ with a range of $80/b to $96/b from Sept 2023 to August 2024, so a fall in oil prices to $65 per barrel for Brent in 2024$ for the 12 month average price seems quite unlikely in the near term. A better guess would be $75 to $85 per barrel for 12 month average price and perhaps $65 to $95/b for monthly average prices (90% confidence interval for my subjective guess).
Also the last period where real Brent prices in 2024$ were under $70/b for average monthly price consistently (2 months or more) was Feb 2020 to Jan 2021. In addition the real Brent average monthly price in 2024$ has been over $75/b every month since March 2021. It will be a while until we see an average Brent monthly price of $25/b or less.
Dennis,
Thanks for that. So in your view it is highly unlikely we will see a global recession.
Yea for Brent hitting $65/b is unlikely i agree with that. But WTI already hit that last week or so.
WTI is on average ~$5/b cheaper except for periods like covid where the price differentials were huge. Brent never hit negative prices. In covid the lowest point for brent was ~ $17/b but for WTI was ~ $-36. A $53 differential.
I agree the demand will come from non-OECD countries. The question is which ones ? China is in an economic slowdown it seems.
Iron Mike,
Yes in next few years I am doubtful there will be a World recession.
As nations become wealthier the rates of growth tend to slow down. China has become much wealthier than most other non-OECD nations. Much of the high rates of oil demand growth will come from South Asia, East Asia, Africa and Latin America, China is rapidly electrifying its vehicle fleet and may see demand for oil drop more rapidly than some of the OECD nations, the US is lagging far behind China on moving away from oil for land transport, perhaps this is also true of Australia and Canada.
The IMF forecast in April 2024 has China’s real GDP growth at 5.2% in 2023, 4.6% in 2024 and 4.1% in 2025, so yes China’s growth is slowing, but not near a recession if the forecast is accurate. For the World real GDP (PPP exchange rates) is expected to grow at 3.2% from 2023 to 2025 for the IMF forecast from April 2024. At market exchange rates the IMF forecasts 2.7% growth from 2023 to 2025 and falls to 2.55% by 2029.
https://www.imf.org/en/Publications/WEO/Issues/2024/04/16/world-economic-outlook-april-2024?cid=ca-com-compd-pubs_belt
In July 2024 the World Bank forecast for global growth was 2.6% this year and 2.7% in 2025 and 2026 (these are at market exchange rates). The World Bank’s forecast using PPP exchange rates (preferred by most international economists) are 3.1% in 2024 and 3.2% in 2025 and 2026 (fairly similar to the IMF forecast).
https://openknowledge.worldbank.org/server/api/core/bitstreams/6feb9566-e973-4706-a4e1-b3b82a1a758d/content
Brent has become the World price for Oil, at one time WTI was the World price, but it is of less significance outside of the US today, so I focus on Brent.
If you look at the US EIA’s STEO for example they no longer quote a forecast for WTI, they use Brent because it is considered by the EIA to be the benchmark for World oil prices.
The growth may come from South Asia and other east Asian nations besides China.
Dennis,
I don’t believe the Chinese figures, and i take what the “experts” predict with a grain of salt. I guess being in a younger generation than you, i am more skeptical of institutions such as the world bank, IMF, EIA, OPEC, FED etc.
Fair point about Brent. Ill use that from now on as the standard.
Regarding China they have huge issues regarding their demographic and they have flooded the world with EVs which is causing lithium and other battery metals to plummet in price. A lot of miners are going bust because of the crash in prices. I don’t think they will continue flooding the world with EVs because there is a slowdown in their take up. For e.g. in Australia there is a huge number of EVs just sitting on the ports. No one is buying them.
I think a global recession in 2025 is 25% and 2026 50%. But yea its only a guess based on nothing really.
Iron Mike,
You maybe right, sometimes big institutions get their forecasts wrong as in 2008/2009. Generally they do pretty well, I have been following this pretty closely for 40 years, but have been wrong often, this could be one of those times.
Time will tell.
Iron Mike,
I found this article on China’s economic outlook which offers a balanced perspective imo.
https://www.brookings.edu/articles/peak-china-why-do-chinas-growth-projections-differ-so-much/
Dennis,
I don’t know. I read the article. As usual i am too stumped to predict what will happen, but it seems China cannot be treated like a western economy. They have an intrinsic Marxist approach to economics, so i don’t see them bailing out corporations or throwing state money at failing private enterprises. I think these failing corporations will just be overtaken by the state, remains to be seen and my knowledge on this is minimal.
I don’t see the lowy institutes prediction of China growing 2-5% to 2050 as reasonable. Infact I’d see that as quite ridiculous. They might fudge their numbers to give the impression of growth but i don’t buy it.
The whole thing about economics and productivity. I mean we are trying to implement A.I to increase productivity, maybe humans will be largely successful at implementing this, but the question of peak productivity is interesting and complex.
What is your view on productivity and how far we can go implementing more of it for economic growth ?
Iron Mike,
If AI leads to robots that can replace human labor then productivity could increase a lot.
Iron Mike,
Nobody knows what the future will bring. Humanoid robots that can replace humans labor are probably decades away (30 years would be my estimate, maybe more). When it arrives it may happen very quickly (in a decade or less) as it will become cheaper and cheaper as robots build more robots, it will be a big social problem which will need to be addressed. Difficult to see the solution today.
Theoretically a single human could be in charge of a huge factory run by robots and the productivity of that one human would be very large indeed. This seems like the stuff of science fiction, but smart phones would have seemed much the same to an adult in 1960.
Iron Mike,
Increases in labor productivity don’t depend on AI. AI will likely help, but every industry is working continuously to reduce costs, and that won’t stop for a very long time.
If humanoid robots were the sensible approach to the improvement of work methods, the replacement for cleaning clothes by beating them on river rocks would have been a robot carrying clothes to the river and beating them on the rocks.
Instead, we developed washing machines using simple electric motors in a big box. This exemplifies a general rule: don’t automate the old system, instead look closely at your fundamental goals, and develop a new and better method that addresses them better and cheaper.
If you’re spending a lot of labor searching for microfilm, don’t automate the search process, instead get rid of the microfilm.
Spending too much time driving to work? Don’t improve the drive, instead telecommute.
Spending a trillion dollars annually to fight people from oil exporting countries who seem to object to US military invasions? Don’t develop better weapons, instead kick the oil habit*.
Etc., etc.
————————-
*This could be a distraction from the main topic of ever-increasing labor productivity, but it’s actually a very good example of this rule about fundamental change vs incremental.
Nick G,
I agree that companies will continue to cut cost. Our point of disagreement is physical limitations.
Generally i agree with your sentiment in this context. Free market economies although not perfect will follow your line of thinking of getting rid of inefficiencies and increasing productivity with less energy usage, which translates to less energy consumption per unit GDP.
However there is physical limitations to this. Oil being a primary example. Replacing oil is extremely difficult if not impossible (my conjecture). But we’ll agree to disagree on this point.
Iron Mike,
Using oil for energy mostly occurs in transportation, the substitutes already exist for land and water, perhaps some oil will still be needed in Mining operations and for farming. Currently this is a very small part of overall oil use as an energy source, probably under 10% of World use of oil for energy.
Dennis,
Using oil for energy mostly occurs in transportation
Your tone comes across as if you are brushing it off. Transportation is the lions share if not all of the global economy.
What do you think trade is ?
What is going to move those massive container ships ? Batteries ? Give me a break, i ain’t buying that for 1 minute.
Iron Mike,
Nuclear or natural gas would work fine, sails would also work for water transport. For water transport I was thinking in terms of natural gas in liquified form, but here are alternative options such as nuclear or wind.
I agree batteries don’t seem like a viable option.
Note also that there won’t be a need to eliminate oil use entirely for 100 years as long as we reduce the amount we use currently, a lot can change in 100 years, much more than I can imagine.
Iron Mike,
Decarbonizing water transport is entirely doable. If you want to know more about how to eliminate oil for water transportation, just google with the following search terms: maritime industry strategy for net zero.
Here’s just one thing that comes up:
https://climate.mit.edu/posts/un-just-set-net-zero-goal-shipping-heres-how-could-work
We can talk about it here at length, but better to just go to the sources.
Following Nick’s link to the sublinks explaining it all, it comes down to magnitudes more biofuels and of course synthetic fuels…
“Making fuel from biological sources requires chopping up the complicated chemical structures that plants make to store energy. Fats and carbohydrates can be broken apart into smaller pieces and purified, sometimes using existing refineries, to make the simple chains of carbon-rich molecules that are jet fuel’s primary ingredient.
Electrofuels (also called e-fuels), on the other hand, don’t start with plants. Instead, they start with two main building blocks: hydrogen and carbon dioxide.
While both can come from a variety of sources, the most climate-friendly way to make e-fuels starts with hydrogen that’s been generated by splitting water into its constituent elements using renewable electricity, plus carbon dioxide that’s been pulled out of the atmosphere through direct air capture. These are then combined and transformed in chemical reactions powered by electricity. ”
Of course as always never do those articles use any real world numbers for efficiency of such processes of synthetic fuels, nor how many, of the last existing natural forests, would have to be destroyed to grow the biofuels.
The synthetic fuels is currently being proven to be a non starter by the Haru Oni plant in Tierra Del Fuego, with the best renewable resource in the world, all the plant especially designed for the amount of power and a 1.6% actual process efficiency, but don’t even include a carbon capture bit yet which will lower efficiency further..
I worked out that the workers going to and from the Haru Oni plant go close to using the equivalent fuel produced by the plant, just to get to work and home each day….
the entire problem is the number of different processes that you have to go through to turn electricity into fuel, with every step having it’s own inefficiencies because of pressures and temperatures needed in different steps and the heat lost to the environment that can’t be captured and reused as it mostly low quality heat…
Betaloo article:
https://www.skynews.com.au/australia-news/politics/nt-betaloo-basin-has-enough-gas-to-supply-australia-for-the-next-400-years-company-about-to-start-drilling-the-region-says/news-story/cb2b29ed24e43decde8dd7fea3c9ed53
I think the PIONEER guy Scott Sheffield’s son has targeted the BEETALOO for his next project.
Makes sense, they got the tech and skills.
You gotta admit BEETALOO is a great name.
Just watch out for the Saltwater Crocs and Snakes when you are dumping your frac’ing water.
They are aggressive and will stalk humans.
No worries mate! If you’re dumping frac water on or near them, they will all be dead soon enough.
Personally I’d be rooting for the crocs.
Would love to hear any oil experts on the OIL potential of the BEETALOO?
@Got2Surf:
Yes, climate change is a huge political topic in Australia.
We talk about it, talk about it, and then continue to export fossil fuels.
You are a solar panel guy if I remember? An Ideal lifestyle for a surfer..wink wink
You should come surf Australia? Great hard chargers over here!
Kelly Slater (great USA surf champion)…loved it over here.
Andre, thank you for your previous kind words. I am humbled.
I’ve surfed both coasts of Australia, some of the best friends I have live in Australia, including a PE working the Beet. I have been on two blowouts in the Cooper Basin, north of Adelaide, one of those a geothermal blowout, and one a pressure control event, offshore Carnarvon Basin. I flew over, first class, all the way to Perth to that job with the Red Hot Chilli Peppers. You would not BELIEVE that story. I am lucky to still be alive, not from the blowout, but my time with Flea at 40,000 feet.
Respectfully, what “oil experts” are you hoping to hear from on anti-oilbarrel? There are none left, mate. Who wants to contribute here after ignorant comments like those of Got2Surf, Hickory, the infamous, never quit, HB and a host of others?
Salt water crocs live in salt water, the Beetaloo Basin is onshore, nobody in the world puts “frac water” on the ground, and don’t you guys need the gas, badly, anyway? Or do you think the sun will move you around the continent OK? How many EV charging stations are there along AUS Highway 1? Thats a long ass haul, man.
Looking to AOB for unbiased info on anything relevant to hydrocarbons, the REAL energy source the REAL world has to rely on, is a waste of time. Keep searching, buddy. Stay open minded.
By the way, 80% of commercial fiberglass resin used to glass surfboards is petroleum based.
Mike,
Saltwater crocodiles don’t just live in salt water, they inhabit many of the rivers and other freshwater ways around north queensland, northern territory and northern western Australia.
We don’t need the gas, our country is basically a corporatocracy run by lobbyists. What we need is a gas reservation policy for the east coast of Australia for domestic consumption, but we won’t get it because our politicians are foreign corporate lobbyist shills.
We do need the oil though. It would come in handy at least for domestic consumption, but once again knowing this country. We will export all of it and let private overseas investors get rich.
Always love when Mike S chimes in. Again, if you value hydrocarbon honesty…he is a big part of the team IMO.
And that is what we NEED!!!
Dinosaurs went extiicnt.
Saltwater Crocodiles did not.
And pretty much the same age!!!
There is no animal on earth that scares me more than a Saltwater Crocodile or a Python or maybe a bear…
All respect to Florida Gators…but Different beast.
They will figure out your living pattern and ambush you. And you stand no chance without a gun and ready for the AMBUSH!!.
Hi Andre,
The Beetaloo Basin has the potential for significant oil and gas resources. The USGS estimates that the Beetaloo Basin has 429 million barrels of undiscovered oil, with a range of 0 to 1,135 million barrels. An estimated 8,044 billion cubic feet of undiscovered gas, with a range of 0 to 23,749 billion cubic feet. Plus 278 million barrels of undiscovered natural gas liquids, with a range of 0 to 867 million barrels.
The Kyalla Formation and the Amungee Member of the Velkerri Formation are shale plays that are likely to be developed in the next decade. In addition a Hayfield sandstone member of the Hayfield mudstone is a tight sandstone play. However, fracking can impact the environment, including the loss of fauna habitats.
HB: “USGS” . . . “Beetaloo” . . . “An estimated 8,044 billion cubic feet of undiscovered gas, with a range of 0 to 23,749 billion cubic feet.”
Got2Surf: “Personally I’d be rooting for the crocs.”
I really have to respond to these comments. I don’t have first-hand knowledge of the Beetaloo sub-basin, either, but am interested in the geology. And the future world.
First, as I understand it, the USGS looked at previously acquired 2-D seismic and magnetics from the Beetaloo and came up with an estimate based on the relatively sketchy data that was available over five years ago (which is kind of like sending a drunk picture of your potential spouse to your friends and asking them what they think). By now there is actually a cluster of test wells, mostly by Empire Energy, and the estimate is somewhere north of 500 TCF. (T=Trillion.) That’s absolutely massive!
To compare with #1, it’s a third of Mother Russia’s estimated total reserves, only the bulk of hers is in the old burned-out coal bed leeward of the Siberian Traps, where the permafrost is melting and methane craters are erupting in the earth, spewing gas out into the troposphere in a totally uncontrollable manner (the biggest craters are named and numbered on GPS maps). Needless to say, that Siberian Traps gas is becoming a giant headache for the world’s air quality and yet our climate czar hasn’t mentioned it.
In contrast, the Beetaloo has the potential to be a huge positive for the world. After all, the single greatest move to immediately influence climate change would be to replace coal with NG (< than 1/2 the GHG). Right now Australia is a big user of coal and the #2 coal exporter.
Not to get political but the Green New Deal has resulted in a substantial net increase in world coal consumption. The Beetaloo should be high priority by anybody who gives a damn.
Thanks Gerry. Note that the 470 TCF pf prospective resources is similar to the USGS undiscovered technically recoverable resources that oilmen like to scoff at, perhaps half of this will be profitable to actually produce. For the World the EIA estimates about 20,000 TCF of natural gas resources in the World as of the end of 2012. So 500 TCF would be about 2.5% of 20,000 TCF.
Talk about it, talk about it, talk about it… I like that song! Unfortunately it’s also an anthem for humans in general.
Having no knowledge of ecology doesn’t stop people here from making ignorant comments, talking about what lives where and what is toxic, poisonous, and cancer-causing to whom.
I have had several glorious surf trips to Australia, you are right, mostly west coast. Red Bluff was my favorite, near Carnarvon. Traveled on to Indonesia each time. And you are right again, the solar community tends to be supportive of travel, love of the outdoors, etc.
It’s shale gas, tight gas
https://www.hydrocarbons-technology.com/projects/beetaloo-gas-field-northern-territory-australia/
The Rig Report for the Week Ending September 20
– US Hz oil rigs added 1 to 442 and are down 17 rigs from April 19. They are up 15 from 9 weeks ago and are well into an increasing trend. How far will they go? 450 is a good guess.
– The Texas rig count added 2 to 239.
– Texas Permian rigs added 2 to 195 while the New Mexico Permian dropped by 1 to 99
.– In New Mexico, Lea dropped 1 rig to 51 rigs while Eddy was unchanged at 47.
– In Texas, Midland added 1 to 24 while Martin was unchanged at 31.
– Eagle Ford was unchanged at 41
– NG Hz rigs dropped by 1 to 80, down 20 from 100 in March. (Not shown).
Thanks, Ovi!
Looks like the expected pick-up after Matterhorn is becoming somewhat noticeable in the counts….
Frac Spread Report for the Week Ending September 20
The frac spread count rose by 6 to 236. It is down by 23 from one year ago and down by 36 spreads since March 8.
Dennis,
You list Brazil twice in the five nations output graph. Please ignore if you are planning to correct already.
SGP,
Thanks. The second Brazil should have been Guyana. Now corrected in the post and chart also in comment below.
SGP,
The new chart is below, thanks again for the correction.
The US EIA Short Term Energy Outlook (STEO) has a forecast for these 5 non-OPEC nations up to December 2026 for total Petroleum liquids production (this includes NGL and biofuels along with C plus C output). For the period from June 2021 to May 2024, the annual trend is a 618 kb/d increase in total liquids production, fairly close to the C plus C annual trend for the same period (593 kb/d). For the period from Jan 2023 to December 2025 the annual trend is an increase of 833 kb/d as forecast by the STEO. This forecast seems optimistic to me, but I often underestimate future output (or have done in the past).
About half a dozen YouTube videos on why the US cannot use much of the oil it produces and why it is both an importer and an exporter of oil.
Why the U.S. can’t use the oil it produces
I thought the first video (the NPR one) was pretty decent in terms of being correct and of giving useful analogies.
I would just add that it is certainly a matter of degree. Plenty of LTO is used internally (after all, you save some shipping). Either as is, or with blending of heavier crudes. It does help (for producers) to have an export market though. It’s basically, more valuable than heavier, sourer crudes. The issue is that US refineries are generally “complex” (meaning have lots of installed machinery to handle uglier heavy sour crudes). So, they make more money handling worse crudes (which are also cheaper).
Again, the video was pretty good, actually. But I see a lot of popular explanations that are not good. The “Crude Quality Matters” hysterics. For instance that seem to treat types of crude as fundamentally different. When there are all kinds of ways to blend (either before distillation or by filling some of the downstream parts of the refinery like the FCC or the coker with heavy fractions from other producers) or to export/import. After all the industry has been handling different types of crudes for a long time. (Consider that California crude is very ugly…17 API, with high sulfur and has been around for over a hundred years.)
At one time, there was a concern that all the replacement barrels would be too heavy and sour. That there would not be more WTI (this was actually the standard line for TOD types prior to the shale boom). Ironically (I’m not religious, but God has a sense of humor), what did we get? The Permian roaring back with…too much WTI!
When you include the ability to import/export, it’s really not that awful of a problem to deal with the shale, since the global “pool” is about 5 times larger than the US “pool” of oil, so the disruption of new shale gets diluted substantially. Actually WTI fits older, weaker refineries in Europe (and some in Asia) very well. Better than heavy or medium sour crudes. And in particular, WTI (or DSW) tends to be very sweet. And with sulfur restrictions getting more and more arduous, having sweet crudes makes things easier. It’s not just an API gravity game. Heck, maybe WTI keeps some marginal refineries open.
Even complex refineries can handle WTI. Refineries live in the margin business (very different mindset from producers). Producers care about the overall oil price. But refiners make money on the crack spread (difference between cost of the oil and what they can sell the products for). So, a small change in the differential creates huge incentives to use cheaper brands of oil. It’s not so much that the complex refiners hate WTI…the whole “cat piss” argument. But that they have the gear to use cheaper, heavier sourer crudes. So the economics is better using “worse” crude, but which they can handle.
I worked (briefly) at a medium complexity refinery that was getting WTI for $5 cheaper than it’s traditional slate of medium sour Persian Gulf oil (called “Basrah Light”, but it’s not very light), back before the export restrictions were lifted. We had a few issues handling the WTI (some foaming in the tower, but you can add things to help that) and a few heat exchangers that needed upsizing. But not huge capex spend. Of course when the “free money” from getting WTI at depressed prices (because of the export restrictions) went away, they went back to the traditional slate, which was now cheaper.
Ron,
I watched 3 of the videos and gave up. They all missed the crucial points, which are the gasoline compostion and the gasoline demand as a fraction of the crude input. About 45% of the US refinery output is gasoline (ex ethanol) which is very high compared with other regions.
A typical gasoline will contain 4 main components:
1.Refromate – from naphtha
2.FCC gasoline – from vacuum gas oil
3. Alkylate – indirectly from vacuum gas oil
4. Iosmerate- from naphtha
There are also other components that can be blended in small quantities.
The days of leaded gasoline are long gone. In those days there were no limits on aromatics or olefines in the gasoline pool. It was even possible to blend a gasoline from reformate and naphtha with a large dose of lead (TEL). Now there are strict limits on the amount of reformate and FCC gasoline that can be blended, but these two components make up over 70% of the gasoline pool.
Aside of the logistical issues that were listed a major constraint this is a minor issue relative to the crude oil yield. These days, for transport fuels the most desirable crude is a medium API crude with a yield of about 40% atmospheric residue. Heavier crude generally require a coker or hydroprocessing to upgrade the vacuum residue.
I went into more detail in two posts some weeks ago.
LTO has huge variation in compsition. The very light grade are more like condesnate and are rich in a naphtha and jet, and lesser volumes of diesel and residue. The 40-45 API grades are more valuable as the yield is biased towards jet and diesel. The lighter grades of LTO are more suited to petrochemical production, especially steam cracking and aromatics production.
Another myth is that the US refiners could invest to process light tight oil. Not only would the capex be significant and unlikely to payout but the technology to produce an equivalent to FCC gasoline economically does not exist. It would be possible to crack diesel
in an FCC but this would be highly expensive and diesel is generally priced above gasoline (by mass). Vaccum gas oil has a price range that is discounted to naphtha.
I was amazed that none of the experts who made these videos never mentioned this. Not even the chemical engineers in the comments.
Thanks Carnot, very informative.
There was an interesting comment a while ago about NGL volume versus oil. I went ahead and did some analysis. Pulled the EIA data and did the ratio and looked at the trend.
Here is the result (apologies for formatting, I don’t know how to upload graphs):
Date oil NGL ratio
1973 9208 1738 0.19
1974 8774 1688 0.19
1975 8375 1633 0.19
1976 8132 1604 0.20
1977 8245 1618 0.20
1978 8707 1567 0.18
1979 8552 1584 0.19
1980 8597 1573 0.18
1981 8572 1590 0.19
1982 8649 1539 0.18
1983 8688 1547 0.18
1984 8879 1626 0.18
1985 8971 1595 0.18
1986 8680 1546 0.18
1987 8349 1591 0.19
1988 8140 1621 0.20
1989 7613 1546 0.20
1990 7355 1559 0.21
1991 7417 1659 0.22
1992 7171 1697 0.24
1993 6847 1736 0.25
1994 6662 1727 0.26
1995 6560 1762 0.27
1996 6465 1830 0.28
1997 6452 1817 0.28
1998 6252 1759 0.28
1999 5881 1850 0.31
2000 5822 1911 0.33
2001 5801 1868 0.32
2002 5744 1880 0.33
2003 5649 1719 0.30
2004 5441 1809 0.33
2005 5184 1717 0.33
2006 5086 1739 0.34
2007 5074 1783 0.35
2008 5000 1784 0.36
2009 5357 1910 0.36
2010 5484 2074 0.38
2011 5674 2216 0.39
2012 6524 2408 0.37
2013 7495 2606 0.35
2014 8781 3015 0.34
2015 9432 3342 0.35
2016 8850 3509 0.40
2017 9360 3783 0.40
2018 10959 4369 0.40
2019 12314 4825 0.39
2020 11323 5175 0.46
2021 11308 5425 0.48
2022 11992 5933 0.49
2023 12935 6499 0.50
Some commentary (my thoughts):
1. From 73 to 89, both oil and NGLS dropped (with some undulations, but overall). Ratios were sorta constant in the .18 to .20 range (but trending up).
2. From 89 to 08, oil dropped…almost monotonically. NGLs varied some, but overall rose. So the ratio of NGLs to oil was up to .36 at the end of this period.
3. From 08 to present (23), both oil and NGLs rose, very substantially. Some undulations, sure. But over this period, more than doubling (oil) and more than tripling (NGL). Since the NGLs grew faster, the ratio rose to .50 at the end.
—
Note:
It is extremely FAIR to say that NGLs are not as valuable as oil (they are not). So when looking at “total liquids” increase, it’s important to factor out the growing proportion of NGLs. However, if you are already restricting yourself to “C&C”, you’ve already taken NGLs out of the equation. So their growth is not a bag sign. And for that matter they do have positive prices. So they are still an overall benefit, still help carry oil projects. NGLs are not “bad”.
Nony
Attached is your data plotted.
Ovi, thanks.
Not to be fussy, but the caption is off. Natural Gas Liquids to Oil. Not Oil to Natural Gas.
Nony,
Nobody has said NGL is bad, just not as useful as crude plus condensate, mostly used for heating and cooking (propane), lighters (butane), and as a petrochemical input (ethane). A very small portion is C5 plus that can be blended back into the crude stream as an input to refineries and a small amount of butane may be blended into gasoline as well, but the total for NGL that is input into refineries is small (probably less than 10% of the NGL output). The main point of oil production is the crude used to produce gasoline, diesel, and jet fuel, most of the rest is low value by products.
NGLs are not “bad”.
No, of course they are not bad. They are just not oil.
Ron,
Yes I like your characterization that they are “bottled gas” and for the most part are not used as transport fuel. They are a source of energy and can be a substitute for oil used for heating homes or water (propane in place of oil in rural areas of US for example), but not that much oil is used for heating any longer in the US (more so in rural areas where there is little natural gas infrastructure in the US).
NGL’s are not used for transport fuel in the US much, but they could be.
In a world short of oil, NGL’s would/will be cherished as much better than dung, wood, or coal.
Dennis,
A sharp distinction between C&C and NGL may not make sense:
“In Yanbu, a massive industrial town on Saudi Arabia’s Red Sea coast, two Saudi state-owned firms—the oil company Saudi Aramco and the petrochemical maker Sabic—are planning a new complex that could prove to be a bellwether for the next decade in petrochemicals.
By 2025, the partners expect to have a facility that will make petrochemicals—9 million metric tons (t) of them—directly from 400,000 barrels (bbl) per day of Arabian light crude oil. Whereas most refineries convert just 5–20% of incoming oil into petrochemicals, some 45% of the output of the Yanbu facility will be chemicals, including olefins, aromatics, glycols, and polymers.
The partners are hardly alone in diverting their refinery product slates away from gasoline, diesel, and other fuels and toward petrochemicals. ExxonMobil has practiced direct crude cracking technology in Singapore since 2014 and may build another such unit in China. Several facilities under construction in China will transform 40% of their oil into p-xylene and other petrochemicals. Aramco itself is considering another chemical-laden refining project in India.
Over the next decade, oil may be the next big thing in petrochemicals. This is a change from the 2010s, when billions of dollars flowed into the US to build crackers and downstream petrochemical plants to process low-cost ethane from shale gas into ethylene and its derivatives.
The driver this time is the market more than it is cheap raw material supply. By 2030, demand for gasoline and other fuels will be on the decline. The petrochemical sector, in contrast, still has room to grow. Oil companies and engineering firms have noticed. They are installing new equipment and even designing new processes to seize on the trend.
The trend is so strong, says Bryan Glover, general manager of Honeywell UOP’s process technology and equipment business, that internally, UOP uses the term “refinery of the future” to refer to flexible technologies that enable refining complexes to make a wide variety chemicals. “The best outcomes result when you can match the molecules to the best market opportunities,” he says.”
https://cen.acs.org/business/petrochemicals/future-oil-chemicals-fuels/97/i8
Nick G,
Perhaps in the future that will make sense. Currently crude is a much more valuable product than NGL, this might not remain true in a future where demand for crude falls to less than supply. We have not arrived there yet, but maybe in 5 or 10 years. In that world, the value of crude oil falls due to over supply of crude relative to demand. Not sure when or if we get there.
North Dakota C+C production in August was down 18,488 barrels per day to 1,167,906 bp/d
Click on chart to enlarge.
EIA stopped publishing the drilling productivity report. Why? Some data are in the STEO, but not the legacy decline. Why?
Matt
Maybe you missed the production/decline data I posted in the last US update. Attached is the chart and comments.
“According to the EIA’s August DPR report, Permian output will be flat out to January 2025. It is expected to decrease by 5 kb/d to 6,385 kb/d in July. By December 2025 output is expected to be 6,750 kb/d, 144 kb/d lower than estimated in the previous report.
Production from new wells and legacy decline, right scale, have been added to this chart to show the difference between new production and legacy decline. For comparison, in the previous DPR report new well production was 443 kb/d, 10 kb/d higher than in the current report.
What is surprising is that production from new wells and legacy decline are different. They should be the same since production is flat? That has to make one question whether those numbers are correct?:
Chart from most recent STEO for Permian new well trend and existing well trend.
If we take the data for the one year trends for change in new well output and change in existing wells and combine them for the Bakken, Eagle Ford, and Permian from the August STEO Drilling Productivity table we get the chart below. Probably not accurate for recent 3 months as the drilling productivity model is flawed.
If we use centered 12 month trends for data reported for Bakken, Eagle Ford, and Permian regions, we can compare the data with model for change in output as in chart below.
The match between the drilling producitivity table (model) and the data for US tight oil regions (the major 3 regions) is better than I expected. Note that the last 6 data pints include the STEO forecast data for the 3 major tight oil regions for the period from Sept 2024 to Jan 2025 (as the centered 12 month trend requires data from the forecast). The final 6 “data” points on the chart use an increasing amount of forecast “data” to find the 12 month trend. Based on the forecast the rate of increase will approach zero by the end of 2024 (rate of increase about 16 kb/d) for the Bakken, Eagle Ford, and Permian regions. By July 2025 the rate of increase returns to about 40 kb/d for the 12 month trend of the major 3 tight oil regions.
The forecast does not seem unreasonable, if STEO oil and natural gas price forecasts are roughly accurate through December 2025 (which is not highly likely, perhaps 1 in 3 odds).
Note that the rates of increase are per month, multiply by 12 to get annual rates of increase. So the low point is an annual rate of increase of about 200 kb/d (for Dec 2023 to November 2024) and this rate increases to 480 kb/d for the annual rate of increase from Jan 2025 to Dec 2025 for the Bakken. Eagle Ford and Permian regions combined.
In France, we could say something like ”Breaking the thermometer won”t break the fever?”
Allegedly
https://x.com/Geiger_Capital/status/1838549913086337034
USA Navy Oiler ran aground. Leaving the Abraham Lincoln Carrier group without its primary fuel source.
“The Navy doesn’t have a spare oiler to deploy and is now scrambling to find a commercial tanker.””
Think the military isn’t aware of Peak Oil???
I´m a bit surprised that the connection between the charts and projections presented here are not discussed, even at this forum, in connection to the present happenings in the world, eg. ME, Ukraine, Africa etc. My personal belief is that there is a strong correlation!
Just had to say:
I cannot believe that a multi-billion dollar carrier group would have a single point of failure like this.
This seems like a terrible design.
Need to have atleast two oilers in case one goes down. Duh!
It’s always been like this. There’s also only one carrier, after all. If you take out either the carrier or the oiler, you take out the group. Oilers are large, capital, ships, often with an O-6 aviator before his flag tour. Oilers are a big deal. They are not just click your fingers and get another one.
Interesting comparison of NGLs and C&C, by price $/BTU):
https://www.eia.gov/energyexplained/hydrocarbon-gas-liquids/prices-for-hydrocarbon-gas-liquids.php
Note that the chart is in $/BTU, not volumetric. As NGLs tend to be less dense (or higher APi gravity), a comparison using barrels would be even worse for NGLs. For instance pure pentane (reasonable proxy for natural gasoline) is 92 API or 0.63 specific gravity. In contrast 40 API crude is 0.83 specific gravity. Of course a comparison using mass would be pretty similar to $/BTU and not show the density issues.
Few observations:
1. On a BTU basis, natural gasoline (also called pentanes plus, plant condensate, or drip gas) has traditionally been a little better than C&C, but pretty close. The price of the two appear closely linked (over the wiggles), with perhaps a recent drop in relative value of natural gasoline, towards equivalence.
2. Iso/normal butanes are worth about 2/3 of C&C on a BTU basis (yes, even less on a volumetric basis). They appear to track the wiggles of crude price pretty much. Probably a recent drop in relative value, from the shale gas revolution (look at 2012+). (Would have to get the data and graph the ratio, but looks like it to the eyeball).
3. Propane is worth about half of C&C on a BTU basis. Also follows the crude price. But maybe even more of a drop caused by the shale gas revolution, for the last decade. (Similar to butane story, but even more so.)
4. Ethane is worth a quarter or so of C&C on a BTU basic, nowadays. Traditionally it followed the crude price, and was higher, maybe 50%+ of the crude price, prior to the shale revolution. Since 2012 has diverged to match natural gas, not crude. So the wiggles don’t really track any more (prices not linked) and the exact ratio is more variable. Note that ethane is difficult to export (almost like LNG).
5. Natural gas (not an NGL, but sort of the source of them and useful for comparison) traditionally followed C&C and was about half the value of C&C, prior to the shale gas revolution. Look at the early 2000s. However, since shale gas exploded, the relative value of gas has dropped massively (because of the massive growth in supply, demand could not keep up, so price dropped). Since 2009, the two products have basically diverged and do their own thing. Note that natural gas price (in the US) is a regional product and difficult to export, so the situation in Japan or the like would be different.
In general, can think of the amounts of the NGL products being (unfortunately) inversely related to their value. So a stereotypical mixed NGL barrel has ethane>propane>butanes>pentanes plus in percent yield. Of course the products also have different markets, uses, also, so it is not just a supply story. All of the products can be used in petrochemicals, but butanes and pentanes plus can be blended into motor gasoline (or, for butanes, even reacted in refinery alkylation to make 7 or 8 carbon molecules). Neither is exactly ideal, but the fact that they can go into this market, helps support their prices, also.
Behind a paywall:
“Saudi Arabia ready to abandon $100 crude target to take back market share.”
https://www.ft.com/content/1d186f62-5941-4f9e-aef1-7d93a8a696cd
1. Free version.
https://archive.is/qk2ug
(You’re welcome.)
2. I don’t know if SA is defending share, or not. But clearly even the threat of them doing so, tends to spook the markets. So, the markets see the threat as viable. (I.e. not the “SA is pumping all they can” cope/hope of peak oilers.)
3. And…we have examples in 2014 and 2020 of SA unleashing spare capacity. And many previous ones, going back to the 80s and even 70s. So…be careful with that Matt Simmons or Stuart Staniford analysis that says SA can’t pump more. SA still going strong, two decades after Twilight in the Desert. And Matt Simmons is literally gone. And Stuart Staniford is figuratively gone.
Nony,
Saudi spare capacity is less than often quoted, they are not currently pumping all they can, I only believe what I see in the data which is the maximum 12 month average output of Saudi Arabia, that is what I think defines maximum capacity, not what KSA claims to have for capacity. Currently that number is 10649 kb/d for C plus C output based on EIA data and recent August C plus C output is about 9253 kb/d (August 2024), which suggests spare capacity of roughly 1400 kb/d. The Saudis could defend market share as they decided to do in 2015, but they would be giving up revenue and reducing their profits by doing so, not a smart move for them, but good for consumers.
For the OPEC Big 4 (Saudi Arabia, UAE, Iraq, and Kuwait) where most of the OPEC plus spare capacity exists currently the maximum capacity is 21493 kb/d and recent August 2024 output was about 19558 kb/d (C plus C output) so a total of 1925 kb/d of spare capacity in August 2024. If it is all brought online oil prices will crash and tight oil output would quickly crash in the US, many future offshore and Arctic oil projects would be shelved and long term output would probably be lower than before due to the low price environment. OPEC may be smart enough to realize this, we will see.
The chart below has monthly real WTI Oil price in 2024$ on right hand axis and US tight oil output on left axis in kb/d. It looks like the output crashes around the $60 to $70/b range, output has been relatively flat lately at around $80/b, it will be interesting to see if $70/b results in reduced tight oil output, if that level is maintained.
Note that the average real WTI oil price from Jan 2023 to August 2024 was $79.82/b in 2024 US$.
Opec , Saudis have no target oil price: sources
Dubai, 26 September (Argus) — Neither Saudi Arabia nor the wider Opec group have any specific target for oil prices, and no member of the producers’ alliance is about to abandon output discipline in favour of chasing market share, multiple Opec sources have told Argus.
Oil prices fell earlier on Thursday following unconfirmed press reports that Saudi Arabia may be willing to tolerate lower oil prices as part of a plan to increase crude output to regain market share.
Sources within Opec have since dismissed those assertions outright, insisting that the basis for the group’s collective decision-making will always be market fundamentals, and in particular the five-year average of crude inventories, rather than targeting any particular oil price.
“Neither Opec , Opec nor the Saudis have any price target, let alone $100/bl,” one source said, in response to a Financial Times report that stated Saudi Arabia is ready to “abandon its unofficial price target of $100/bl”.
A second source said the $100/bl figure being reported is not a target but is more likely to refer to a recent estimate issued by banks and other financial institutions of Saudi Arabia’s “so-called break-even oil price” — that is, the price the kingdom needs to cover its spending plans.
Can US drillers turn a profit at $68/b WTI?
https://www.argusmedia.com/pages/NewsBody.aspx?frame=yes&id=2612241&menu=yes
https://www.newarab.com/news/saudi-arabia-abandon-100-target-take-back-market-share
Can US drillers turn a profit at $68/b WTI?
No. But I think it would be a great exercise in restraint to see them try.
Drill baby drill. And while you’re at it, go broke.
Many US E&Ps claim to still be profitable at $68 Bbl or even below……
-Diamondback, for example, has indicated they have a large inventory of locations that are sub $40 WTI breakeven.
-EOG uses a flat $40 WTI price as their “Premium Hurdle” for achieving a 30% ATROR.
-Vital claims 4 years of breakeven drilling at an average $45 WTI
No doubt things will slow, but the US E&Ps appear more resilient than in the past. They will be more strategic and disciplined.
Gungagalonga,
Those $40/b breakeven claims are bunk. Those “breakeven prices” often exclude a bunch of real costs in the analysis. Go back and look at 10K reports for EOG when oil prices were $40/b or less on average (2020Q2 and 2020Q3).
For 2020Q2 EOG had a net loss of 1 billion dollars, for 2020Q3 the loss was 42 million. In the fourth quarter of 2020 EOG was barely profitable with oil prices at $41/bo and natural gas at $2.50/MCF. Net income was only $337 million with debt at close to 6 billion at the time. Lots of hype in investor presentations which are discounted by smart investors. The $68/b breakeven sounds fairly reasonable, I would guess that assumes $2.50/MCF for natural gas would be needed as well, they haven’t seen those prices at WAHA for quite a while.
We haven’t seen an average quarterly price for WTI under $68/b since the second quarter of 2021, tight oil activity was pretty slow from 2020Q2 to 2021Q1 when oil prices were less than $68/bo.
Dennis, you misunderstood my post and maybe I wasn’t clear enough… not talking corporate profits, talking profitable individual well locations at $68.
Gerry asked if US Drillers can make a profit at $68 (and then stated they can’t). According to those companies, they have enough quality inventory to make money drilling above a $40-$45 breakeven range, implying they make better profits on those same locations at $68. Your example on EOG’s 2020 losses (during COVID, so probably not a great example) are companywide earnings related… I am discussing drilling profitable locations, not full company earnings. EOG has many “science programs”, for example, that are certainly losing money trying to develope the next play…. these efforts are certainly dilutive to earnings, but a necessary R&D.
Hypothetically, if these companies only drilled and produced the high-quality locations and did nothing else, they may still make profits at $68 or well below for the life of their Tier 1 premium inventory.
I am fully aware of the cartoon aspects of investor presentations, but they are claiming it, so there must be some meat to it.
Gungagalonga,
The basic point is that profitable locations are of little importance, it is the companywide earnings that matter. If a company has 100 profitable locations which is offset by 1000 unprofitable wells, they may not survive as an ongoing enterprise. Companywide profit is the only number that matters in the real world IMHO.
Do you expect to see tight oil output rise if oil prices remain at $68/bo? I agree we will see more discipline (aka fewer wells completed) and it is very likely that future output will be lower unless oil prices rise.
Dennis, I disagree. In time of stress, E&Ps will drill top tier locations for a profit to offset corporate stress in other areas. Meaning, in a low price environment, many locations are still profitable….so I disagree with your statement above that “profitable locations are of little importance”. Back to the original discussion…. Gerry said $68 loses E&P money…. I disagree, there are thousands of West Tx locations profitable at $68 at an AFE level.
Gungagalonga,
Yes there can be some high grading in a low price environment, in the long run this will lead to lower cumulative profits, the smart move in a low price environment is to stop developing new wells and wait for higher prices. So we have some fundamental disagreements on how to run a business, you seem to think the idea is to produce as much oil as possible, that’s wrong, the idea is to make as much money as possible.
Overall company cumulaive profits is the proper metric over the long run. Why complete your best wells in a low price environment to barely break even?
Dennis, I never said this is how to run a business or to produce as much oil as you can in any environment. Was just pointing out that many large Permian players say they have years of premier locations that are profitable to drill above that $40-$45 range. How they run the company is a different, but related discussion.
This was just a pure discussion on profitable locations without the noise of debt service, hedge books, etc. However, the oil company must keep cash flow rolling in hard times too… and one of the best places to harvest from is the premier locations that are still profitable in tough times. You don’t want to drill tier 2 or 3 for a loss in tough times, right? Sometimes you have to burn through your best at a lower price to keep the lights on.
the smart move in a low price environment is to stop developing new wells and wait for higher prices.
That kind’ve suggests that you have a crystal ball for price trends. If you had that, you wouldn’t need to drill at all: you could just day trade oil futures…
Nick G,
Nobody knows future prices, but current prices are known, if they are low and expectations of future prices are current price or lower and your average well is expected to lose money based on current expected future price then you stop drilling new wells. It is a basic maxim if your in a hole digging is probably not the answer to the problem of getting out of the hole.
Well, it’s an interesting question.
There will be some wells that meet normal criteria for profitability, and which can sustain the company in the long run. Those are a no-brainer.
There will be some wells that are profitable on a marginal basis: their revenues are expected to be greater than their direct costs, but the overall profit isn’t enough to cover corporate overhead. Those probably make sense to sustain the company through lean years.
There will be some that are needed for the longterm viability of the company: drilling to retain leases, meet contractual obligations, etc.
And, of course, if the longterm picture doesn’t look viable, it may simply make sense to fold up your tent…
Dennis,
For once I totally agree with you. Haynes and Boone did some great work on LTO producers debt.
Carnot,
Hey I can’t be wrong every time 🙂
New posts are up.
https://peakoilbarrel.com/short-term-energy-outlook-september-2024/
and
https://peakoilbarrel.com/open-thread-non-petroleum-september-27-2024/