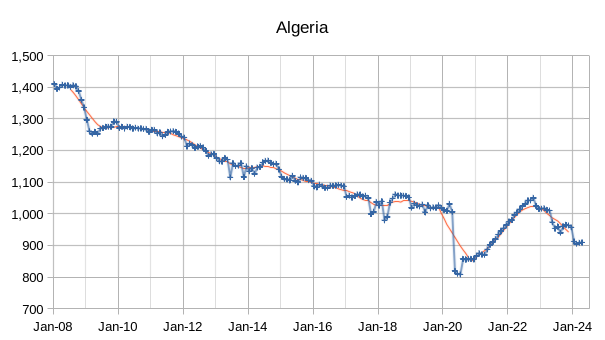
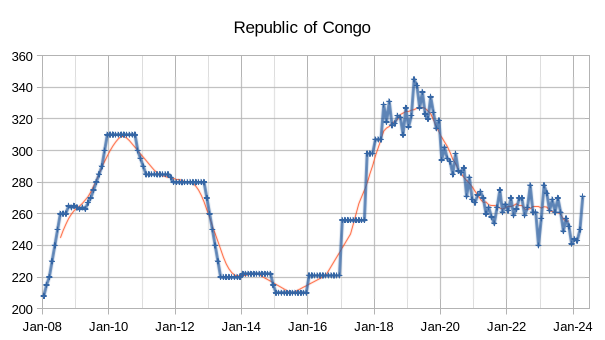
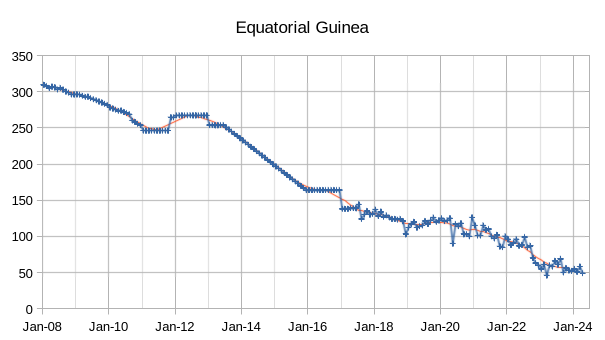
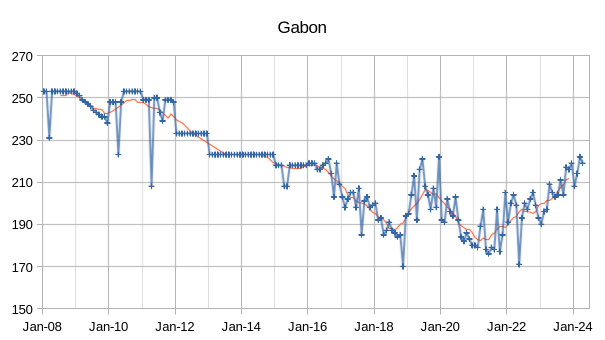
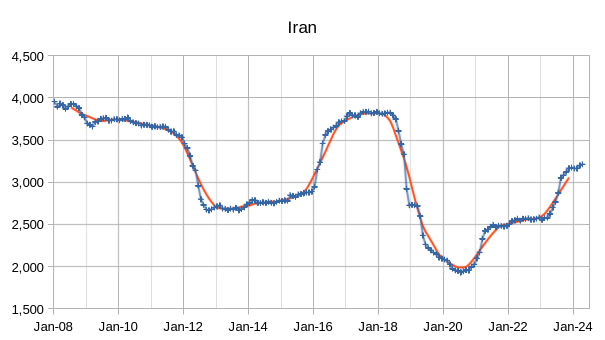
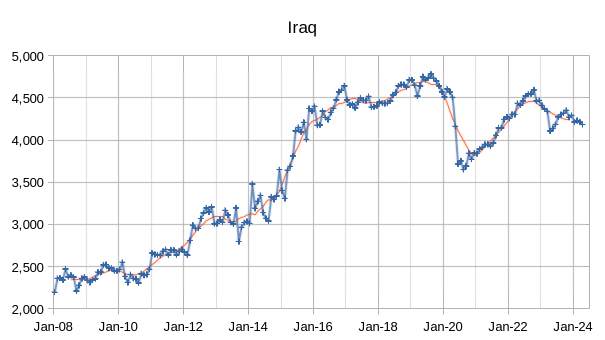
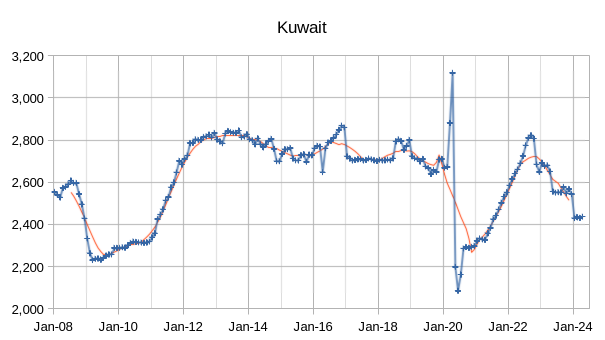
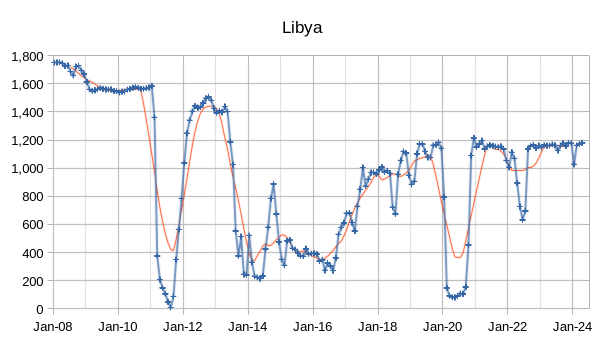
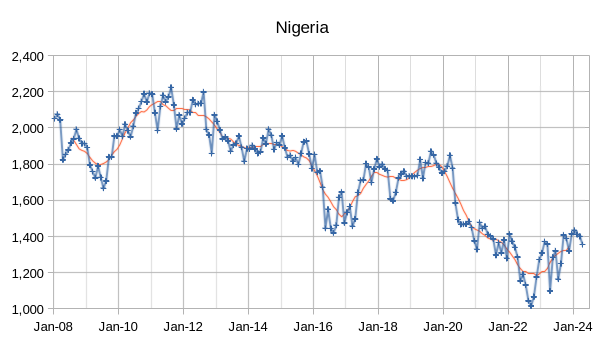
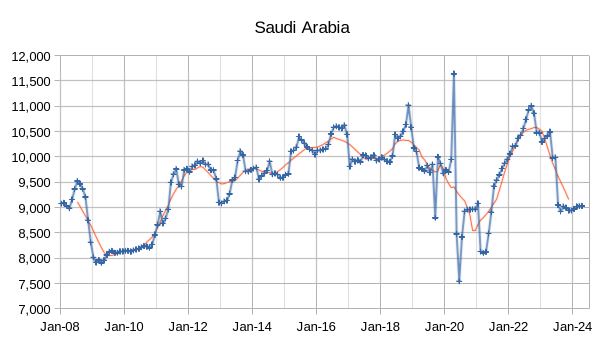
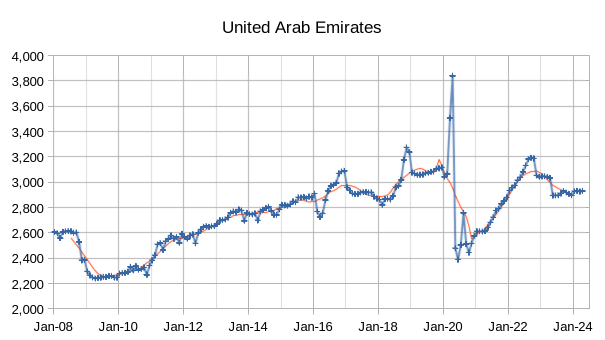
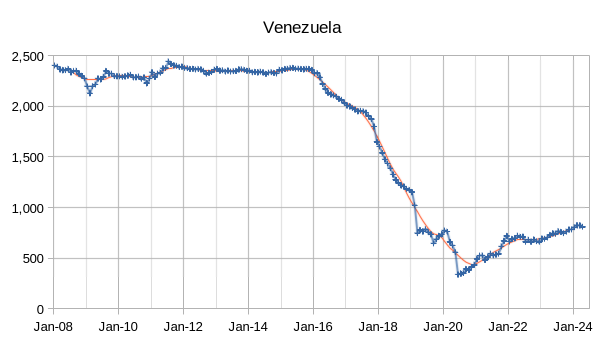
The OPEC Monthly Oil Market Report (MOMR) for May 2024 was published recently. The last month reported in most of the OPEC charts that follow is April 2024 and output reported for OPEC nations is crude oil output in thousands of barrels per day (kb/d). In the OPEC charts that follow the blue line with markers is monthly output and the thin red line is the centered twelve month average (CTMA) output.
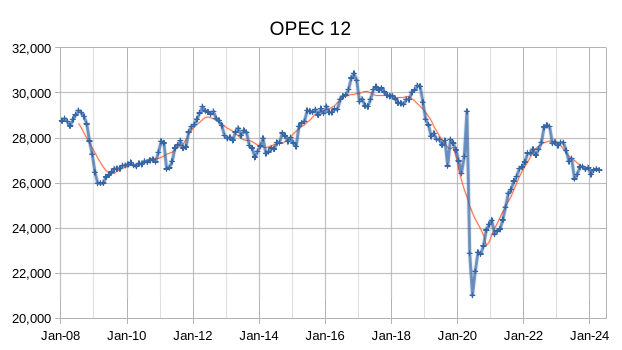
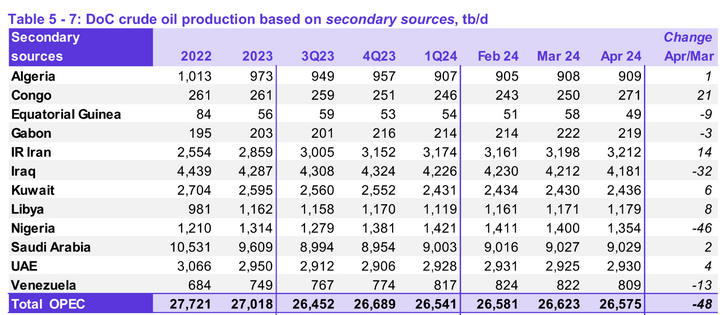
Crude output for OPEC 12 decreased by 48 kb/d in April with decreases coming from Nigeria, Iraq, and Venezuela which were offset by increases in Congo and Iran.
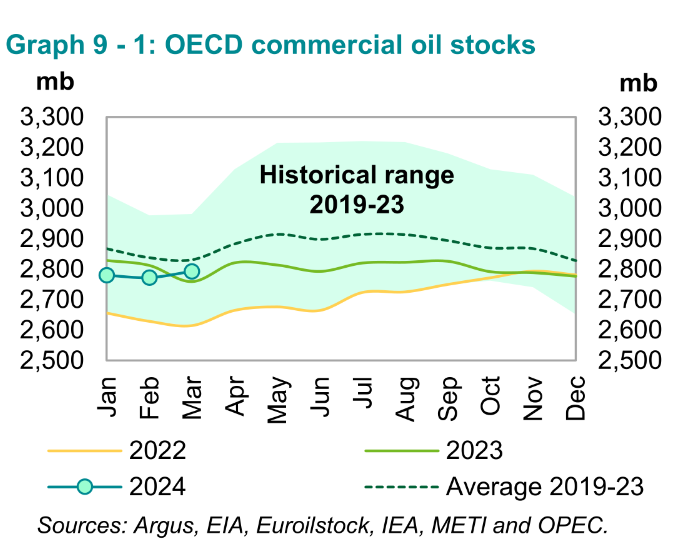
Preliminary March 2024 data shows total OECD commercial oil stocks up by 20.2 Mb, m-o-m. At 2,793 Mb, they were 34 Mb higher than the same time one year ago, 38 Mb lower than the latest
five-year average and 121 Mb below the 2015–2019 average.
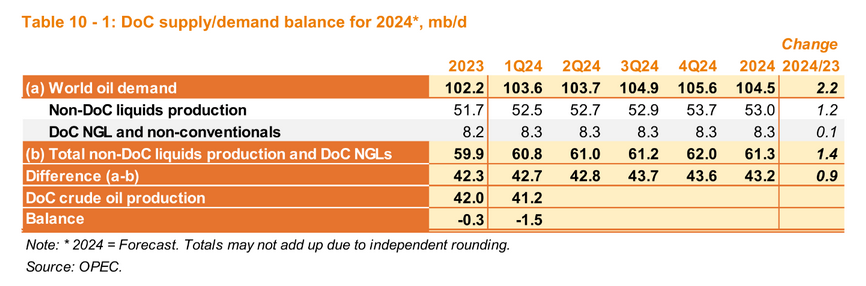
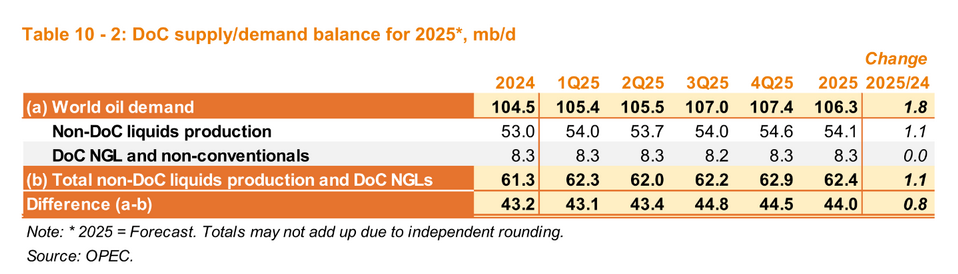
In this month’s MOMR OPEC has stopped reporting the balance of supply and demand for OPEC and is reporting the balance of supply and demand for the Declaration of Cooperation (DOC) nations. They also reported this DOC estimate last month along with the OPEC supply and demand and the DOC estimate for May 2024 is unchanged from last month’s estimate.
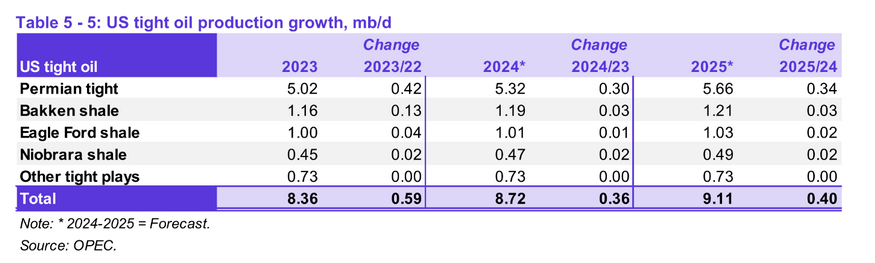
Thre OPEC estimate for US tight oil in 2023 was revised higher by 40 kb/d compared to last month’s estimate, the estimates for 2024 and 2025 were also raised by the corresponding 40 kb/d with the change in output each year remaining the same as last month’s estimate (360 kb/d increase in 2024 and 400 kb/d increase in 2025). My estimate remains about a 150 kb/d increase on average for 2024 and 2025 US tight oil output with most of the increase coming from the Permian basin.
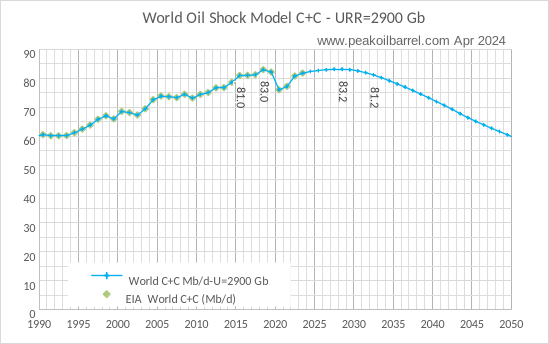
This chart suggests a plateau in World output from 2015 to 2032 at an average output of about 82 Mb/d (if we drop the 2020 and 2021 Covid-19 affected years) with output in the range of 81 to 83 Mb/d. This scenario assumes incremental changes which are not likely to be enough to avoid the danger of collapse due to environmental damage, much more needs to be done.
103 responses to “OPEC Update, May 2024”
Hello, what do you mean by “collapse due to environmental damage”? Thank you.
See Limits to Growth.
Also consider
https://www.clubofrome.org/publication/earth4all-book/
Limits to growth (from 1972) can be downloaded for free at
https://www.clubofrome.org/publication/the-limits-to-growth/
Another paper (more recent) at
https://www.clubofrome.org/publication/earth4all-ahmed/
Link to many reports below from Club of Rome
https://www.clubofrome.org/publications/?filter=cor-reports
Iraq looks like it peaked in 2019/2020.
Nigeria in 2011/2012.
Kuwait in 2022/2023.
Saudi Arabia in 2022/2023.
UAE in 2019.
Dennis,
Much appreciation to for your work.
“This scenario assumes incremental changes which are not likely to be enough to avoid the danger of collapse due to environmental damage, much more needs to be done.”
This is very left field. It’s a sudden mention of environmental doom. It disoriented me as a reader.
Global climate disruption is becoming the more likely source of the end of globalization rather than a peak in world oil production. Once the Thwaites glacier breaks free, the West Antarctic Ice Sheet will rapidly flow into the ocean, causing a multi-meter rise in sea level. All port infrastructure will be doomed as soon as this happens and uninsurable. Oil and other infrastructure will be abandoned. This is likely to happen in the next 10-40 years.
https://www.reuters.com/business/energy/oil-shipments-risk-rising-sea-levels-think-tank-warns-2024-05-21/
R,
It is a realization that without significant changes (which history from 1972 to 2024 suggests are unlikely to occur) we are at serious risk of collapse.
For a change in approach consider page below
https://www.clubofrome.org/blog-post/korten-ego-nomics-extinction/
Dennis,
I understand where you’re coming from now, but as a matter of good writing style it’s very disjointed. It’s a very big leap to go from something as dry as OPEC oil production to mentioning environmental doom seemingly out of nowhere. There should’ve been some kind of segue between the two different (but related) topics.
R,
Sorry. It was on my mind, was trying to keep it short and sweet. This is commonly a topic of discussion on non-oil thread, but resource depletion is the main topic of the blog and collapse a potential consequence. So the topic constantly lurks beneath the surface, I usually don’t mention it.
I think we broke Dennis. I’m not sure how I feel about this. He’s supposed to be the foil to those watching the oncoming freight train of accelerated biosphere collapse. Now what am I supposed to do?
Frugal,
Nigeria may hve peaked, but less clear for the others that you mention OPEC has been restricting output since May 2020. When quotas are removed we will know more.
OPEC 12 as a group likely peaked in 2017 (I focus on the centered 12 month average (CTMA) to determine the peak which is the thin red line on the chart). The peak was around 30058 kb/d in April 2017 for the CTMA, the most recent CTMA is November 2023 with OPEC 12 crude output at 26626 kb/d, which is about 3432 kb/d below the 2017 peak. There may be some room for OPEC 12 to increase output, but only about 2600 kb/d which would still leave output about 832 kb/d below the April 2017 peak.
I would add Russia, 2018 – 2019
Perhaps USA 2024 ????
Guyana hasn’t peaked!
Guyana is a bit player in this game of giants. Her production matters very little.
I forgot my sarc tag.
You’ll be sorry when Guyana is calling the shots globally in our Mad Max world.
Where would we be without the Permian basin?
Venezuela and Guyana will play a huge role for the USA when serious decline sets in.
Neither have a navy or subs. The USA navy can just park boats off the coast. No oil tankers other than to the USA.
https://oilprice.com/Energy/Energy-General/US-Leaves-The-Door-Open-for-Oil-Majors-to-Operate-in-Venezuela.html
“The U.S. Treasury is currently reviewing up to 50 individual license requests from companies willing to do energy business in Venezuela, a U.S. official said this week.
The U.S. “is seeking a Goldilocks solution to sanctions on Venezuela,” said David L. Goldwyn, chair of the Atlantic Council’s Energy Advisory Group and a nonresident senior fellow with the Council’s Global Energy Center.
Despite the return of the sanctions, “the US Treasury Department was clear that it welcomes, within the next forty-five days, requests for specific licenses that serve US interests,” Goldwyn said.
“The impact on the global oil market remains to be seen. Much depends on how many private companies apply for debt or product swaps and on whether the small but significant oil projects in Venezuela apply for licenses as well.”
These OPEC MOMRs have lost all credibility. Their balance table shows 1.5 MMBpd draws in Q1, but the OECD stock graph shows a build? Are we to believe that there was a massive draw in non-OECD stocks, without any reason or evidence given?
This has been going on for the last few years: inconsistencies, errors, “quiet” revisions in subsequent reports, etc. The quality is extremely poor. People complain about EIA, but I have 10x more respect for EIA than for OPEC and IEA…
Note that the chart for OECD stocks is commercial stocks only, oil on water and SPR stocks also increased for OECD. As I have pointed out in the past (and still believe is correct) the OPEC Demand estimates for 2024 and 2025 are likely too high by at least 1.5 Mb/d, the EIA STEO estimates are likely closer to reality (though in my view may also be a bit too high).
Dennis,
predictions about the future are hard. However, Q1 is in the past. Showing 1.5MMbpd draw just looks bad.
Kdmitrov,
Consumption estimates are usually not as up to date as production, we probably don’t have good consumption estimates yet for 2024Q1 the demand estimates are forecasts which will be revised as we get the actual data, but the OPEC forecast is just what they wish demand was and will be, the models that are used by the EIA seem more reasonable in my view.
For Comparison, the EIA STEO only has actual estimates for World Demand through 2022Q4, in 2024Q1 the STEO has World demand at 102.1 Mb/d vs the OPEC MOMR model at 103.6 Mb/d, a difference of 1.5 Mb/d which likely accounts for the stock draw in the OPEC estimate. The EIA has World production of 101.8 Mb/d for 2024Q1, suggesting a slight stock draw of 0.3 Mb/d for the World for 2024 Q1, if the models are accurate.
it’s an organization with billion dollar budget. to publish such incoherent graphics side-by-side without any comment or explanation is embarrassing.
Speaking of the potential for disruption of oil production over the next 10 years
it is geopolitical tumult/anarchy that is the big risk.
Think of the disruptions over the past 10-20 years-
Libya collapse, MEND in Nigeria, Iraq invasion, Venez sanctions, Russian invasion, Iran (need I say more), Houthis vandalism…
I don’t see any trend that would make these type of disruptions less likely. In fact, the development of drone warfare makes disruption more likely I believe.
Make good use of this calm plateau phase.
Hickory,
The main disruption to output at the World level in the past 40 years has been lack of demand due to the GFC in 2009 and the Pandemic in 2020 and 2021. Perhaps wars will be worse in the future, especially if BAU thinking is unchanged, a new paradigm distinct from neoliberal theology is needed.
You already have the West trying to hold together the Rules Based International Order despite making every effort to piss away any advantage from this structure. It’s like the driver’s seat is being filled constantly with people who don’t understand they have a good thing and are adamant to dismantle it as fast as possible.
Sure, why not force Russia, Iran and China closer. Hey, let’s have a trade war too! Easy and simple to win. Yes, I will be doing this as the imperial core suffers inflationary pressure and supply disruptions to an already hollowed out industrial base.
OMOMM sets the limits for the oil production of the OPEC countries. Each country has a specified limit (spec). Iran, Libya and Nigeria have no specified limit.
SA and Russia add voluntary cuts (vc). The following graphics show the limits in light colour for OPEC9, the OPEC associates and OPEC . In dark colour is the real production.
In january, the OPEC countries follow their limit, but the associates produce more. I expect, the associates will reduce their production.
Berndt,
For Kuwait, Iraq, UAE, and Saudi Arabia (the Big 4) the quotas are limiting output, for the other 5 OPEC members (3 are not subject to quotas) their output is below their quota so they are producing all they can. Roughly 2273 kb/d of output is being held back by the Big 4 as of April 2024 relative to most recent peak in CTMA output (20849 kb/b) for those 4 nations.
OPEC output capacity is about 28.8 Mb/d by my estimate based on recent CTMA peak in 2022 for Big 4 and current output for the other 8. Potentially Venezuela and Iran might be able to increase their output above the April 2024 level with a removal of US sanctions, but the current political climate suggests that is not likely.
“Department of Energy used gas industry insiders and consultants to build the case for soaring LNG exports”
What else is new?
“Drain America First” – it just makes so much sense….
/s
It’s really funny that Europe just agreed to shoot itself in the foot to appease the US.
Haynesville might got a 3rd life, the western TX deeper part is twice as productive as the Lousina Eastern part
https://gohaynesvilleshale.com/forum/topics/monster-gas-aethon-s-16-000-foot-dive-in-haynesville-west
Dennis,
Thank you for your ongoing efforts. Much appreciated.
Tom
Thanks Dennis – Not sure if you saw the recent Rystad piece or not, think it echoes other ‘strong demand’ forecasts out there, the infographics below:
https://www.rystadenergy.com/news/stronger-for-longer-oil-demand-to-grow-in-the-mid-term-future
Think things are headed for a high demand-low supply situation, not sure when but likely in next 3 – 6 months or so….surprised that oil (WTI) is under $80. I didn’t compare Rystad’s forecast to OPECs, would be curious if there’s any major difference?
Kengeo,
OPEC has World Demand for oil at 106.3 Mb/d in 2025 in May MOMR. The EIA STEO for May 2024 has 2025 Wotld oil demand at about 104.3 Mb/d (up from 101.9 Mb/d in 2023), these are annual average output. The OPEC estimate for World demand in 2023 is 102.2 Mb/d (about 300 kb/d higher than the EIA estimate). It looks like the Rystad estimate is closer to the OPEC estimate. My opinion is that the EIA estimate is more likely, and even that seems a bit high to me (I think 103 Mb/d in 2025 may be a better estimate).
Kengeo,
I agree with Dennis, I think OPEC is too optimistic on their demand side for liquid fuels. Barring any geopolitical turmoil oil prices at the moment don’t reflect a high-demand low-supply environment. That could obviously change, but personally i don’t see oil prices shooting higher other than geopolitical turmoil of sorts. But we’ll see.
Attached is a good article discussing the demand differences between OPEC, IEA and EIA.
Time For OPEC To Put Money Where Mouth Is On Demand
If OPEC believes its bullish forecast for global oil demand, then the cartel should be tripping over itself to raise production targets at its next meeting on June 1.
However, oil traders are unconvinced the cartel wants to increase output. Indeed, the market increasingly expects OPEC group producers to roll over their already steep production cuts into the third quarter of the year due to recent signs of weakening demand in the industrial sector and a mild winter in Europe.
The problem is that there still is no consensus on future demand. OPEC continues to stand by its robust forecast that global oil demand will increase by 2.25 million barrels a day this year. Other market forecasters, however, like the International Energy Agency (IEA) and the U.S. Energy Information Administration (EIA), see demand growing by less than half of OPEC’s estimates.
Of course, actions speak louder than words. If OPEC rolls over cuts into the third quarter, the market will know its demand forecast was too optimistic. Easing some of the cuts – perhaps as little as 500,000 barrels a day – might inject more confidence into the demand picture, but at the risk of sending prices significantly lower, perhaps by $5 to $10 a barrel, as more supply enters the market.
That could be a bridge too far for state budgets among cartel members. Last month, the International Monetary Fund (IMF) said that de facto OPEC leader Saudi Arabia needs an average oil price of $96 a barrel to balance its national budget.
The article is much longer
https://www.forbes.com/sites/daneberhart/2024/05/17/time-for-opec-to-put-money-where-mouth-is-on-demand/?sh=245e034671e5
Thanks Ovi,
The piece is behind a paywall. The OPEC forecast is hopeful from OPEC’s perspective, but I agree with Kdimitrov that it is not credible.
Dennis
When I click on it, it is not behind a paywall. Would be interested to hear from others if they can get it.
I was able to get it.
OK, hold on. Maybe I overreacted.
I see that in their balance tables OPEC measures total liquids, even though the call on DoC is for crude only.
It is reasonable that Q1 has seasonally higher demand for NGLs: propane for heating and butane for winter gasoline blending. We know for a fact that US draws NGLs stocks every year in Jan-Mar, maybe the same is true worldwide.
So it is plausible that the 1.5 MMbpd deficit is all NGLs. Maybe I owe OPEC an apology. Still, would be nice to provide some commentary in their report on how we are supposed to reconcile their graphs.
Ovi,
I was able to get it after deleting cookies. The article seems to support what I have been saying for months, that the OPEC World Oil Demand estimates are too high and that OPEC’s actions on quotas suggest they do not believe their own forecasts.
Also in the piece there was this:
The UAE’s investment in new production capacity looks dubious now given that the OPEC+ group is sitting on over 5 million barrels a day of spare capacity after making repeated supply cuts since 2020.
OPEC+ might have 2800 kb/d (2300 kb/d for Big 4 and about 500 kb/d for other DOC producers that are not part of OPEC-12), they do not have 5000 kb/d of spare capacity, that is a myth, unless one believes that Venezuela and Iran will return to their previous combined peak of about 5772 kb/d in March 2017. Note that even with that heroic assumption DOC spare capacity is only about 4550 kb/d, but a realistic assessment is 2300 kb/d because the Russian Ukrainian war is unlikely to be resolved in the near term so only OPEC Big 4 spare capacity is actually available and in my estimation that is about 2300 kb/d to 2600 kb/d as of April 2024. The 2600 estimate takes the individual maximum CTMA for each of the Big 4 since Jan 2019 and adds them, the lower estimate looks at the CTMA maximum of the Big 4 combined in October 2022, the individual maximums of each of these nations did not occur at the same time over the Jan 2019 to Nov 2023 period for the CTMA. In my view looking at the overall CTMA peak of all 4 nations combined is the better methodology, also if we look at individual nation CTMA maximums since May 2020 (post-Pandemic) the estimate is very close to the Big 4 combined CTMA maximum (20849 vs 20861 kb/d) with the average of the two spare capacity estimates being 2279 kb/d for OPEC-12.
Dennis
I agree with your estimates.
While many believe that the financial markets have a big influence on the price of oil, and I agree somewhat within a certain bandwidth, in the end physical supply has to triumph. If demand continues at a higher level than supply, price will rise. The current WTI price in the range $77 to $82 tells me supply and demand are reasonably balanced. We will have to wait for summer driving in the US and Europe to see if demand will increase by 1 Mb/d and whether this drives WTI back over $82/b to get a more realistic view on the supply/demand balance.
The argument in the article is very tortured. If Saudi needs $96 they’ll withhold oil in hopes it reaches $96, period. The OPEC demand forecast, and whether the Saudis “believe” in it, has nothing to do with the decision to reverse the cuts, it’s all about price. (it’s actually price + backwardation, but that’s another discussion).
The OPEC strong demand forecast “may” be accurate, but that doesn’t mean the price will respond. Price is determined mostly by financial players and narratives. Strong demand leading to some kind of a small deficit of oil does not guarantee you $96 any time soon. The world can operate with a small stock draw for a long time before the price responds. Until then the Saudis will likely keep the cuts.
Kdimitrov,
I agree OPEC is likely to continue the cuts, the supposed stock draws are based on the demand forecast. If demand is as robust as OPEC claims and OPEC continues their cuts, eventually prices will respond, stocks are not unlimited. I think the OPEC demand estimate is likely wrong, if I am wrong then prices will start to rise by September assuming OPEC plus DOC nations continues with current output levels.
Dennis,
Why September? Why not next May? A 1MMbpd deficit draws 365 MMb per year, but the world has more than 4B bbls in storage. so 8-9% destocking… The physical market can stomach such de-stocking, without feeling the need to bid-up the prices to keep their stocks. At the same time, sufficiently motivated bearish financial class can keep the price in this range for another year.
Keep in mind, this is not a low price by historical standards now. Somebody has to have impetus to bid-up further from here. Either the physical sector will have to say, I can’t destock anymore, it will affect my business; or the financial sector will have to buy into some bullish narrative to start bidding up the futures. We don’t really know when that will happen.
Kdimitrov,
Often the highest crude oil demand period for the World is June to August, so I picked September as a time stocks may have been reduced. Let’s assume DOC continues at 41 Mb/d for all of 2024 and the OPEC demand estimate and non-DOC supply estimate are both correct, this implies a 2 Mb/d stock draw for a year, that is about 730 Mb/d. The OECD has about 87 days of forward supply, let’s assume the stock levels are the same for non-OECD. Daily demand was about 102 Mb/d in 2023 so 87 times 102 is 8874 million barrels. If we deduct 730 million barrels we get 8144 million barrels, if we use 103 Mb/d for demand in 2025 then stocks would be at 79 days of forward supply, this would definitely set off alarm bells in futures markets and the futures price would be bid higher in my opinion.
The fact is that the demand estimate by OPEC is wrong and everybody knows it. That’s why oil prices remain subdued in the face of two wars and political tension throughout the World.
Dennis,
I agree 2Mbpd+ deficit will probably move prices. ~1Mbpd deficit could linger for pretty long time, though…
Kdimitrov,
It is never clear to me where the markets will react, mostly the market seems to focus on OECD stocks because non-OECD stocks are not very visible. OECD days of forward supply are at about 87 days, I think the market may get nervous if this falls to less than 85 days, the number used to be 90 days so things have changed, maybe it could go as low as 80 days with no problem we will have to watch and see. If we look at OECD crude stocks only in March for commercial plus SPR it is 2581 Mb, in 2022 refinery throughput was about 37 Million, if we assume 38.5 million in 2024 (a guess by me) then crude stocks are at about 67 days of forward supply, SPR is about 270 Mb less than in 2021 in 2024Q1. The days of forward supply for OECD crude stocks in 2021Q1 was about 81 days, and in 2019Q1 the days of forward supply for OECD crude stocks was about 78 days.
At some point the market may realize that crude stocks are pretty short, but they may be focused on commercial pertroleum stocks where NGLs hide the problem or they just worry about commercial crude stocks. I am not a trader in these markets.
Interesting piece on clean energy disruption, 21 minutes. Listen at 1.5x speed to reduce listening time by 50%.
https://www.youtube.com/watch?v=6zgwiQ6BoLA
Dennis, I love these type of videos where they are actually stupid enough to give numbers so proving their contention is wrong is so simple…
Firstly did you notice, throughout the video they were talking solar, wind and batteries, yet at the approx 7 minute mark he mentions that solar and wind are now the cheapest form of electricity. He never stated solar, wind and batteries were the cheapest form of electricity, but everyone watching the whole video is left the impression that it’s a combination of the lot is cheaper..
Let’s put this ‘cheaper’ to the test, or should I say sword….
Take the new Adaro Aluminium smelter and power plant as the example we are going to make ‘cheaper’ by having 5 times actual generation in solar and 90 hours batteries, as stated in the video…..
The Adaro power plant of 1.1Gw capacity plus the smelter is being built for $US2B…
The 1100Mw coal power station will produce around 23,760Mwh assuming a 90% capacity factor per DAY. This is the amount of useful electricity needed.
According to numbers presented in the video, we will need 5 times this generation capacity, or 118,800Mwh generated by solar. Luckily Adaro is on the equator and gets an average of 5.5hrs sunlight per day, so we divide the 118,800Mwh by 5.5 to get capacity needed = 21,600Mw of solar installed.
We also need 90 hours of battery storage as per video. 1,100Mw X 90 hrs = 99,000Mwh of battery storage.
Let’s assume around current pricing, so $1/w for installed solar and $500/kwh for installed batteries.
Solar cost $US21,600,000,000 batteries installed $US49,500,000,000 = total of $US72.1B
Somehow, in their world $US72.1B, is cheaper than the $US2B coal power plant, which you get a free Aluminium smelter with…
That’s the numbers from the video which I encourage everyone to watch and do their own sums to get to the reality of what’s happening. Also remember they didn’t bother mentioning how much environmental damage is being done will all the mining for the materials, nor the land clearing to place all the solar panels.
I’d love some economist to explain to me how solar will get cheaper, if we build it from Aluminium that comes from sources that cost $US72B to provide power, instead of sources that cost $US2B to provide power (likewise for every other material). I’ve never been able to work that one out myself…..
Intermittent sources of renewable energy should be used for intermittent needs. That reduces both the battery load and the solar load. Residential, transport, much of business make good cases for this type of energy.. Continuous needs like an aluminum smelter should run off continuous sources of renewables. Much aluminum production is done in Iceland on 100% renewable hydro and geothermal. These are cost effective operations that turn a profit. See below:
https://www.bechtel.com/projects/fjaroaal-aluminum-smelter/
And
https://www.greenbyiceland.com/metal-production/#:~:text=Aluminum%20smelters%20in%20Iceland%20are,light%20metal%20with%20versatile%20uses.
Stephen,
A combination of solar wind and batteries can give 100% of average load 24/7 at low cost. Sure Hydro, geothermal, and pumped hydro could also be used where available, in addition there can be regional sharing of electricity resources as is done in most of the US (except Ercot that wants to go it alone) which reduces the need for backup, also vehicle to grid sharing is possible, and demand response pricing, none of these were included in the Rethinkx analysis, it is very conservative.
Hideaway,
It might not be the lowest cost in every microeconomic case, but things don’t always add up correctly in a bottoms up analysis as network effects of systemwide efficiencies are difficult to account for in a bottom up analysis. Capacity for system would be 4 times and with cost reductions to 2030 would be about 1.9 billion if the system were all solar (some would be wind as well, optimal system unknown for Indonesia.) Battery cost would be for about 62 hours of batteries 69 GWh energy capacity about $7 billion with reduced costs to $100/kWh AC by 2030 about $9 billion system cost with no need for buying coal and associated carbon emissions. Compared to equivalent cost in the US of $4.4 billion capital cost and $6 billion in coal cost over 25 years (in China the cost would be $12 billion for imported coal from Australia).
Costs of these systems will continue to fall over time.
One also needs to account for the environmental damage of carbon emissions over the life of the coal power plant, coal would cost about 14 billion at current coal prices (assumed at $100/ton) over a 25 year period. Also note that in the US a coal plant with capacity of 1100 MW would cost about 4.4 billion.
Dennis, coal is just as free to humanity as is sunlight. The only cost to Adaro is digging it out of the ground.
Adaro phase 1 of 1.1Gw is $US2B, the $US4.4B is for phase 1 and 2 and would be double the electricity, so all my costs for solar and batteries would have to be doubled.
The amounts of energy I used were straight off that video you linked to. They clearly stated 5 times generation capacity. The costs used are slightly below current fully installed costs. I’m not trying to guess years into the future.
Their claim on the video was solar and wind are cheaper NOW, so why did you use an imaginary 2030 number?
Indonesia on the equator has poor wind resources, but the solar at a fairly consistent 5.5 hours/d is way better than world average for installed solar, not far off double capacity, yet the whole solar and battery system is still over 30 times as expensive as using just coal fired power.
There is no way the cost of solar and batteries fully installed are going to 3% of current costs, which they would have to do, to equal the cost of coal to humanity.
Hideaway no they said 3 to 5 times capacity, you should listen better. I used 4 times in my estimate. So 4.4 GW at $0.43/WAC in 2030 for 1.9 B for solar. Battery needs were 35 to 90 hours in video, I took the average at 63 hours or 69.3 GWh of energy storage at $100/kwh or 69 times 10^8 which is 6.9E9 or 6.9 billion dollars. Total cost about 9 billion in 2030 with coal cost over 25 years at 12.4 billion so even if the capital cost of the coal plant were zero, if real interest rates were low the solar plus batteries would be better (note in reality wind, batteries and solar would be lower cost, but I am trying to keep the analysis consistent with what you presented for simplicity while also correcting your errors).
See chart below from video. I am using costs for US as that is where my costs for solar and batteries are coming from, the cost in the US for a 1100 MW coal plant is $4.4 billion, the opportunity cost of coal dug up from the ground is the cost one could sell it for to say China (which pays about $100/ metric tonne for coal currently). Even at $2 billion or 1 billion for capital cost, the major cost for the coal plant is coal and other operation and maintenance costs and you have not accounted for environmental damage at all (nor have I).
In the video they said in some places solar is cheaper now, in 2030 they expect it will be true everywhere, they clearly presented what they expect for costs in 2030 so I used that information a reduction of 70% in solar costs (cost in 2030 at 30% of 2020 cost and 80% in battery costs over the 2020 to 2030 period 2030= 0.2 times 2020 cost).
You are correct that wind is not a viable option in Indonesia, probably the low cost option would be 5 times capacity with perhaps 35 hours of battery backup. That option reduces system cost to about 6.2 billion for solar (5.5 GW capacity) and battery (35 hours or 38.5 GWh) at assumed 2030 costs.
Dennis, They did say 3-5 times capacity, so you agree they said 5 times capacity. We all know that every promoter of something ‘new’ tries to make out we can get by with less than in reality. It’s the same for every major project built, we can do it for $2B, but by the time it’s finished it was much more, like the new Nuclear power stations.
Underestimation is common, for every large project. The lower the overbuilt capacity and lower the quantity of batteries you provide the greater the occurrence of blackouts throughout the year when typical cloudy periods of 3-4 days happen. Last I looked 4 days was 96 hours, and 4 days also includes 5 nights so realistically 108 hours.. sometimes there will be longer cloudy periods, Indonesia is in the tropics after all.
Coal power stations will have planned outage periods for major maintenance, which gives plenty of time for an Aluminium smelter to prepare for the outage. I only used a 90% capacity factor in my calculations. They also take one generator offline at a time so the rest continue producing power. When night hits and cloudy weather hits solar the whole lot goes out all at once..
You keep using 2030 numbers that simply don’t exist. This year is 2024, the Adaro coal power plant and smelter are being built NOW. The costs to do it are those applicable NOW.
Again I remind you the video you linked to claimed solar was cheaper NOW. (plus the video was made several years ago!! Perhaps we should use the costs from when the video was made!!)
Here are the real questions for you Dennis.
How do we get cheaper solar in 2030 if we don’t use new coal, oil and gas built mines and factories NOW??
How does solar become cheaper if we use more expensive renewables and batteries to build all the new mines and factories needed NOW?? Please make sure you include all the balance of system aspects.
Hideaway,
It cannot be done overnight, so a requirement that it be done NOW with no fossil fuel is a convenient straw man. The obvious answer is that the world cannot operate wothout fossil fuels currently. Notice that you took the highest number for both capacity and hours of battery, do you see looking at the chart that this is incorrect? If you use 5 times capacity it would be 35 hours of battery storage. I used the middle case of 4x capacity and 63 hours of battery storage and US costs, these would undoubtedly be cheaper in Indonesia, probably about 66% of US costs.
The 3 to 5 times capacity is what their analysis shows for the regions they analyzed in the US, the case for Indonesia would be different. I notice that when it is pointed out to you that coal is expensive, you switch to talking about EROI. Note that the money is equal to energy claim needs to be proven. I think it is a specious claim. Value cannot be boiled down to one thing, it isn’t labor, or energy, or gold, in fact any good could be used as a measure of value, whether a banana or a kilo of coal, this is simply a choice that one makes and is irrelevant.
Hideaway
coal is just as free to humanity as is sunlight.
Heh. Mr Peabody still charges for it though. Made a pretty penny doing it too. Nobody has come up with a way to charge for sunlight yet.
That’s the problem. Nobody will try to run a coal plant during the day when there is solar around. Your 90% coal plant will look like a 40% plant. We see that happening already in China, where vast coal capacity is running at a very low load factor.
Coal and gas can’t compete with solar when the sun shines because the marginal cost of solar is zero. Even if coal were cheaper based on balance sheet considerations (including construction costs), it wouldn’t matter. Cash flow sets market prices. Anyone buying fuel to generate electricity will go cash flow negative trying to compete with solar. So they’ll shut down during the day, wrecking their balance sheet but cutting capacity factor.
At night, fossil fuel can still compete with batteries, though prices for batteries keep falling. The “whaddaboutbatteries” argument is a tacit admission that fossil fuel can’t compete against renewables (for the reason stated above) and the industry’s future depends on battery prices staying high. That isn’t happening just now. Prices are crashing. We’ll see how that goes.
We built the system we have by building coal power plants right next to coal mines, then built transmission lines to the cities. It was the most efficient method to get power to where it was needed for industry and people 24/7.
There was no ‘cost’ for the coal, it was in the ground and the governments eventually charged the companies a ‘royalty’ to take it out of the ground.
We need the energy to maintain the existing system repairing and replacing all the separate bits that wear out due to natural entropy. If we do it with far greater ‘cost’ in terms of dollars which represent energy then there is less energy available for every other aspect of the system on average.
If you want cheap solar, we build it with cheap fossil fuels. It’s clearly cheaper to build the coal fired power plant in Indonesia to increase Aluminium production cheaply. This is happening today in 2024, not in 6 years time with Dennis’s mythical cheaper solar. By 2030 solar only gets cheaper if it’s all built with fossil fuels.
If we start making all the Aluminium, silicon wafers, glass, copper and balance of system parts, plus all the mines for metals needed in batteries with solar and battery systems, the solar installations and batteries all becomes MORE expensive, because solar and batteries are MORE expensive than coal!!
I clearly show above, using the numbers presented in the video that solar and batteries are over 30 times as expensive at present, when the video claims renewables are the cheapest source of power CURRENTLY.
Can you show the costs of building an Aluminium smelter and geothermal power station in Iceland of 1,100Mw, then transporting the bauxite from Indonesia to Iceland, including the port facilities you’d need, please?? Your making the claim it’s cheaper….
If the world wants cheaper solar, then building the cheapest capital cost and operating cost plants is how it’s done, for everything. Building more CHEAP solar and batteries means burning more coal, gas and oil to mine and provide all the components, it’s that simple..
It means higher CO2 levels is what you and Dennis are promoting, but clearly don’t understand it yourselves in an effort to get cheaper solar, it’s the same for everyone in the ‘green’ movements that advocate for more solar and wind. They don’t want to understand that the ‘cheapness’ comes from using cheap coal and labor in developing countries.
There was no ‘cost’ for the coal, it was in the ground and the governments eventually charged the companies a ‘royalty’ to take it out of the ground.
That statement makes no sense whatsoever. The government did not own the coal. The coal companies owned the land and the coal. They paid miners to dig the coal out, and the miners often paid with their lives. The coal mining towns were eventually left high and dry.
Whatever happened to the beautiful valleys in the coal mining lands? Mister Peabody’s coal train hauled them away.
Ron, I’m not disputing any of what you wrote. I meant in terms of energy cost compared to what is almost always written about coal power ‘costing’ $100+ per tonne.
In energy terms alone the cost of coal to humanity to gain the energy from it, is the cost of mining, often only a few dollars per tonne. It’s how the system of civilization we have, was built. There was no concern for environment nor workers health, when we built our civilization over the last couple of centuries.
The way we did it gave us a high EROEI for coal deposits.
Cost of providing civilization with power from coal is going up, because it costs energy to move more and more of it from where mined to power stations.
All the environmental costs are on top and clearly we can’t continue to use coal because of both environmental damage, and it’s EROEI is falling because we used the best, easiest to get, best located resources first.
My whole point is we can’t get the energy to maintain civilization, let alone grow it, unless the EROEI was the same or better than how we built it.
‘New’ coal as per all the LCOE type calculations, with expensive non polluting plants with theoretical CCS and low capacity factors, also wont give us the high EROEI we need to maintain civilization.
All the ‘guff’ about renewables being cheaper than coal, is in reference to ‘new’ coal, never the way we built the system. Even then, they have to give ‘new’ coal a cost burden of $100+ per tonne used, otherwise it’s still a better EROEI than renewables and a much cheaper cost.
New coal power stations like the one Adaro is building in Indonesia are right next to the coal mine and Adaro ‘owns’ the land and right to mine it. It will cost around $4-10/tonne to mine it and ‘ship’ it, via conveyor belt into the power plant next door.
Talking about solar and wind being cheaper in energy terms is just nonsense.
You’re off on a crazy tangent dude. Coal costs money. You don’t get to subtract the cost of the coal because it’s in the past. There is a lot of hydro and geothermal energy in addition to solar in Indonesia. Aluminum can be made profitably using these methods. Otherwise Alcoa, Bechtel, and Rio Tinto wouldn’t do it.
Sorry to misunderstand you Hideaway.
I try to stay out of these renewable debates. I am all for renewables but, like you, I don’t believe they will be sufficient to save humanity from a terrible disaster. But my debate is not only about energy but everything else. We are running out of everything, not just energy.
Most of those who believe renewables will save the world have their head in the sand. We are running out of fresh water, topsoil, ocean fisheries, forest, almost every natural resource. And we are killing off the megafauna, they will be all gone in fifty years. But we are gaining on pollution. Plastic is poisoning everything. And the climate warming is already past the point of no return.
But not to worry. They believe wind, solar, and battery power will save the world. They have faith, and nothing will dent their faith.
On, one more thing. I can remember when coal was 7$ a ton, delivered and dumped in the yard beside our house. That would last us all winter.
Hideaway,
You did your calculations wrong, capacity is measured in Watts, you switched to Energy in your calculations and got incorrect solar costs. A decade ago people claimed Seba’s estimates for solar energy were absurd, but costs have continued to fall, battery costs have also fallen dramatically. EVs can reduce a large percentage of oil use, much natural gas use for heating spaces and water can be replaced with air and ground-source (aka geothermal) heat pumps.
Hideaway,
Yes fossil fuel energy has been used in the past, but it is becoming less important as non-fossil fuel energy grows.
Hideaway,
The value of the coal is the price on international markets, if the coal costs $10 per tonne to mine and ship to the power plant and $20/tonne to mine and ship to China to be used in a power plant there and the Chinese Power plant is willing to pay $120/ tonne for that coal then the opportunity cost for the “$10/tonne” coal is $100/$, by using the coal in Indonesia the company is forgoing the opportunity to make a net profit of $100/tonne.
This is how economics is done.
If you are going to use economics to evaluate a solar plus battery plant, you need to do the same when evaluating the coal power plant.
A 1.1 GW coal plant operating at a 30% thermal efficiency factor generates 7.92 GWh per day. Using your back-of-the-envelope calculus an equivalent solar park would be about 1.5 GW, costing 1.5 G$.
A lead acid battery (used in standing installations) costs 100 $/kWh. A 99 GWh complex thus costs 9.9 G$. This indeed sounds insane, but not the end of the story.
What you omitted from your little story was fuel cost. In a 30 year lifetime that plant will consume close to 48 million tons of coal (6 MWh/ton). At the current price of 150 $/ton you get to 7.2 G$. And that’s without compound interest. And shortages. And assuming it wont get back again above 200 $/ton.
Whereas indeed the battery component is yet to be wrested, you should realise how unattractive coal has been since 2021. It is not by chance it is disappearing in Europe.
Luis, a 1.1Gw power plant puts out 1.1Gw of electricity. It’s measured in output not input of coal energy content, pretty much everyone knows this…
A 1.1Gw plant X 24 hrs = 26.4Gwh. I used a 90% capacity factor, which comes to 23.76 Gwh which equals 23,760Mwh.
Despite what Dennis claimed and your way of working it out, I’ve included the correct electrical output…
To get 23,760Mwh in a single day with 5 times capacity to cover days and all nights without power, plus of course efficiency losses into and out of batteries, which I left out, the solar equivalent is a total of 118,000Mwh. We divide this by 5.5 as there is an average of 5.5 hrs of sunshine per day.
This equals 21,600Mw of installation. There is no error, it is a simple calculation anyone can do.
At $1/w fully installed, including all balance of system components, this costs $21.6B for the solar power plant. The batteries if you go for Dennis’s minimum will lead to many days of blackout throughout the year.
Even if we accepted the 35Gwh which means blackout if a full day is very cloudy, because i’m pretty sure there is a night before a day, and another one after the day, which is 36 hours at least and realistically more like 40-44 hours of little to no sun because the sun is so low in the sky near dawn and dusk.
90 hours is much more realistic as it covers a couple of days and the 3 nights that would accompany the 2 days of cloudiness. People tend to forget about this bookending effect of nights when they count days of solar.
Also Luis, Adaro are not paying for the coal, it’s in the ground they own. The only ‘cost’ is the $4-10/tonne to mine it.. I think you should read the post you object to properly, as I already covered this.
Dennis my numbers are correct, you just want to deny the reality of how wrong that video you linked to is with their claims. Their claim is clearly solar is cheaper than coal….
It’s interesting how blind you all are to the big picture. The video claimed that solar is CURRENTLY cheaper than coal, yet here is a clear example of the costs that prove their claim wrong!!
The other aspect is if you want solar to be built cheaply, then the parts it’s made from have to come from cheap sources, like the Adaro plant.
Once we have to build solar parts, like the Aluminium frame, from solar and batteries the parts will no longer be cheap. plus if you want more cheap solar panels now then you are promoting more coal, oil and gas use NOW to build it.
The very action of gaining more materials to build the solar and batteries with are coming from cheap plants like the Adaro plant!!
If you are in favor of building a lot more cheap solar, then you are in favor of putting more CO2 into the atmosphere, just like we have on average for every past year over the last 200 or so..
Look at the Keeling curve….
https://keelingcurve.ucsd.edu/
It’s clearly on an exponential path, yet we have been spending trillions on solar, wind and batteries for a couple of decades. All the climate conferences over 30 years, all the solar and wind, plus all the factories and mines to supply the materials, has not made a dent in that curve. The answer is clearly NOT more of what we have been doing, nor accelerating what we are doing, we are already far too exponential on that curve, I don’t want it to go higher faster!! Do you??
Hideaway,
The Capacity is the nameplate capacity in Watts. The reason for the 5 times capacity estimate is to cover the fact that solar and wind are intermittant. So the capacity needed is 5.5 GW to replace a 1.1 GW coal plant. Average annual capacity is about 22% of maximum so output would average about 1.21 GW for the 5x Solar system, the 35 hour backup battery would be 38.5 GWh would cover times when the sun is not shining at night and cloudy days, potentially more than this would be needed, a full analysis of typical weather in Indonesia would be needed to evaluate.
Dennis if you replace a 1.1Gw coal power station with only 5.5Gw of solar, you don’t even cover 24 hours use on any day that’s cloudy. Do the math on it!!
5.5Gw X 5.5hrs would give a total output of 30.25Gwh, assuming there are ZERO obstructions as in bird droppings, nor clouds on that day, nor any leaves on the panels etc. Into and back out of batteries for most of that power production would suffer at least a 10% efficiency loss The coal power plant has an output of 1.1Gw X 24 X .9 (CF) = 23.76Gwh.
You get one day when it’s partially cloudy, reducing the solar output by 50% and you are draining the batteries that day. That night you get a blackout.
Now what happens if the following day is partly cloudy as well?
What happens if you have a week of PARTLY cloudy weather, let alone a couple of full days in a row??
Also that video you linked to, discussed what could be done with all the excess power generated. You don’t get vast excess power unless it’s the full 21.6Gw of solar built.
I think you have been mislead by that video. They portray solar as doing something cheaply it simply can’t do. On fully cloudy days my solar systems, as in plural, can have an output of less than 5% of their rated capacity.
I’m in the Southern hemisphere, and on a heavy clouded day, a panel facing fully South will put out as much solar power as one facing North into the sun (that’s behind clouds). I’ve done the calculations for our area, and to go off grid without having to use a generator, to run a simple household of low energy household standard goods, just doesn’t work until you get to extreme levels of solar and great battery back-up. Extreme as in 20kw of panels for a house that would use 10-15Kwh of electricity a day on average, with wood heating in winter, not a reverse cycle air conditioner, that you seem to think the world can go to.
With the Adaro power station and smelter, we are talking industrial application of energy that takes massively more than a household type use. If they really mean only 5.5Gw can replace a 1.1Gw coal power station, they are straight out lying, or so amateurish in their understanding of solar to not be taken seriously anyway.
Solar does not work the way they are claiming, whether on a household level or a large grid level. It’s all the same just different scale, however it’s the industrial applications where the vast amounts of energy are used, in relatively small areas.
Dennis your a smart person, so could easily work out that even with such overbuilding of solar as the full 21.6Gw and the full 90 hours of batteries, that there would still be some time periods where a week or so of heavy cloudy weather comes along, they will still have to shut the Aluminium smelter down because of no power, which can damage the plant if it happens without warning.
To clearly show how I’m correct on this, lets assume they only install the 3 times capacity, using your understanding of the calculation, only 3.3Gw of installed solar. Over a 5.5hour period of perfect sun, the solar set up would output 18.15Gwh of electricity, not enough to run the operation that uses 23.76Gwh in a 24 hour period, all before calculations of inverter plus input and output into batteries losses..
Silence is deafening sometimes when reality on the ground strikes at peoples belief system..
BTW, even at the equator there are seasonal difference in sunlight. During the 2 solstices the sunshine might only be 4.5hrs/d while around the equinoxes sun hours might be 6.5 hrs/d.
It’s even more evidence that the 5.5Gw of solar can’t replace 1.1Gw of coal power for Adaro, and probably why even the 90hrs of batteries would be too low.
Once you go to 30*+ of latitude the variation of solar between summer and winter is often so great that the numbers don’t come close to working from that video.
Your analysis doesn’t account for coal fuel costs. Not my area / not sure how significant that is relative to the plant itself, but I assume it’s a much larger contribution.
Ivanislav… There is no coal fuel cost other than mine it out of the ground. They are not buying it. It is on the site of the coal power station.
Coal is a natural resource that’s in the ground. The only cost to humanity is to dig it up. That is precisely the cost for Adaro, to dig it out of the ground, an open cut pit. It will only cost around $4-$10/tonne.
It’s why they are setting up the power plant and smelter at the location, because the coal is there, they own the land, by govt proclamation, and just have to dig it out of the ground. They do have to pay a low royalty to the govt.
Hideaway,
You do not understand economics. The cost of coal is the cost one could sell it for on the open market. This is a freshman 101 level that most people understand.
Paper below suggests Worst 2 consecutive days on Java would have about 57% of output of average day for a PV solar facility, the 15.4% capacity factor from that paper suggests about 6 times PV capacity would be needed (rather than the 5x capacity I estimated earlier using a 20% capacity factor), but only about 20 hours of backup battery would be needed, based on worst 2 day scenario. Only by ignoring the opportunity cost of coal can the coal powered facility be justified. Yes the coal may be cheap to mine, but if you can sell it for $100 per tonne, but choose instead to burn it in a coal power plant, you essentially are losing out on $90/tonne of potential profit. You seem to miss this basic point.
https://www.mdpi.com/1996-1073/14/17/5424
See link below to understand opportunity cost
https://en.wikipedia.org/wiki/Opportunity_cost
He’s right. You don’t get to do your analysis with free coal. That’s why no one is responding to you, because your position doesn’t make sense. I’m reasonably sympathetic to your argument but the way it’s presented is flawed.
Read about opportunity cost. Correct your math and see if the numbers still work out how you think they do.
Co-locating power plants at open pit mines is nothing new. Look at the open pit lignite plants in the Rhineland and Saxony, or Bełchatów in Poland.
I’m fairly sure I have stated many, many times that situating coal power stations next to coal mines is how we built modern civilization. The coal was free to the power station for the cost of digging it out of the ground. It made the EROEI extremely high.
Once you have to pay a $100/t for coal it makes the EROEI much lower.
Coal is free to humanity, it is humans that put a ‘price’ on coal when we needed to move it to other locations. For humanity as a whole coal is just as free as wood, wind, sun, and flowing water. They are all just natural resources we use.
Unlike Dennis’s reply above about opportunity cost of the coal, I’m going to assume the Indonesians know what they are doing and there is zero economic advantage in them trying to sell coal via port handling facilities that don’t exist for 25mt/a, and instead are doing what works economically in their interest. Spending $6-$10B on building appropriate port facilities, let alone other infrastructure to get the coal to port, is not considered in Dennis’s argument. It’s economics 101 to look at the entirety of the situation, not to just assume coal is ‘worth’ $100/t exported….
The coal in the ground has zero value until used. Burning it to make Aluminium CHEAPLY makes the most sense economically, which is why they are doing it.
BTW Dennis, using cloudy days for Java that is only around 1,300km away from East Kalimantan where Adaro is building, would be similar to using Northern Florida cloud levels to explain what’s happening in New York also about 1,300km away….
All of the cornucopians here are so stuck in the cost of coal making it more expensive in the Lazard type LCOE numbers that don’t show the reality, that coal is just as free to humanity as a whole as is sunshine. The only reason such reports use a high cost of coal is because the numbers do not add up to solar being cheaper than coal unless they include a high ‘price’ on coal while zero price on sunshine, or backup for when the sun doesn’t shine!!
Solar is great for those of us paying RETAIL prices for electricity, to reduce some of the costs, but it is not a panacea for replacing coal, because the REAL numbers that are relevant just don’t add up!!
Hideaway,
Lowest private cost is not always the optimum solution, the full social cost should be considered, when those are considered with current scientific understanding, coal is rarely the optimal choice over the life of the project.
An analysis of of Adaro Aluminum smelter project phase 1 (cost of coal power plant is 1.3 billion, coal power cost estimated at $0.06/kWh)
https://ieefa.org/resources/coal-cost-aluminum
Interesting that the Indonesian government is calling these coal power plants “green” power because the aluminum is needed for the “energy transition”. They were unable to get financing from international banks, but found local financing, the project will require high aluminum prices to succeed.
Iraq still seem to have important remaining capacity production. Below is the historical oil discoveries for iraq as well as cumulative and remaining reserves
With the above data and thanks to various sources on internet, i made a raw forecast just below, the left axis is difficult to see : it range from 0 to 7000 kb/d and with 250 kb/d grid. Iraq still have a huge potential to increase it’s production but it has to be noted that most of this came from a few fields who urgently needs injection water program. In this forecast i had assumed that this will be provided right in time, which i think is quite doubtful. The total URR assumed for Iraq is 150 Gb. At the end of 2019 more than 135 Gb have been discovered and i assumed that there’ at least 10 to 20 Gb more to find. Hence i think this forecast is quite optimistic but, nonetheless, Iraq is far from it’s geological peak.
PS : the sources of the data for the discoveries came from the report of the shiftproject on european union oil supply.
French Fries
Interesting chart and forecast.
Could you please start the chart around 2000 so we can get better resolution.
French fries,
Not clear that Iraq actually has the infrastructure to make this happen. I use average 12 month output to judge short term capacity. Looking at Iraq by itself shows the reduced output from 2019 to 2022 of about 250 kb/d perhaps due to reduced output in the northern part of Iraq due to disputes with the Kurds. If this higher level in 2019 is used, the Big 4 capacity is 250 kb/d higher. I agree your scenario is quite optimistic, I doubt Iraq reaches 5000 kb/d by 2030, but have been too pessimistic on many occasions. Thanks.
Is it better like this OVI ?
French fries,
Is their any evidence that Iraq is expanding capacity beyond the level they reached in 2019?
I found these
https://www.eia.gov/international/content/analysis/countries_long/Iraq/iraq_exe.pdf#:~:text=Iraq’s oil ministry intends to lift its crude,international oil companies’ uncertainty about the investment climate.
and
https://www.argusmedia.com/en/news-and-insights/latest-market-news/2251084-iraq-signs-27bn-energy-deal-with-totalenergies
The EIA report say the Iraq oil ministry is planning to expand capacity to 8 Mb/d by 2028, perhaps your 6 Mb/d guess is reasonable.
Looking back at historical increases in Iraq we saw a doubling of output from 2008 to 2015 (about 8 years), in 2021 output was about 4000 kb/d, if output could double again in 8 years from 2021 to 2029 we might see 8 Mb/d, but that is optimistic and even an increase to 6 Mb/d by 2028 seems optimistic, but perhaps the investment by Total will help boost output.
See also the following where the author seems appropriately skeptical that the Common Seawater Supply Project (CSSP) will be complete by 2028. As far as I can tell work has not yet started.
https://oilprice.com/Energy/Crude-Oil/Iraq-Looks-To-Finish-Phase-1-of-CSSP-Oil-Megaproject-by-2028.html
Note that Iraq has been working to get the CSSP going since 2008, so far nothing has happened in the 16 years since bids were first submitted for this project. Corruption is problematic in Iraq, it is not clear that anything has changed in this regard.
Also it is not likely that there will be any increase above 4500 kb/d until project completion which would be 2028 at the earliest (2035 might be a better guess given the history).
Dennis,
The sanctions after the first Gulf War were detrimental to Iraq’s producing fields. Sanctions didn’t allow Iraq to import the equipment and services needed to properly maintain and manage their reservoirs that were in production. Conventional oil reservoirs can collapse or bleed pressure if there is no proper managment of the reservoir. The legacy of that damage is biting to this day. Iraq has to import whatever natural gas or CO2 Iran can spare to inject into its wells. Iraq’s political, geological (because of sanctions) and engineering challenges are all factors to take into account when watching Iraqi oil production.
It’s safer to bet on Iraq’s long term plateau but not its ability to grow. It can grow, but at a very slow pace, perhaps not much higher above replacement levels. It’s ability to grow production is dependent on its ability to resolve the aforementioned challenges and making new discoveries, which purportedly Iraq has alot of smaller undiscovered fields.
R,
You may be correct, from what I ahve read there is a seawater injection project that is in place that supposedly will invreas output to 7 Mb/d, it is supposed to be completed in 2028, but earlier attempts to do this were plagued by corruption, not clear the current project will be completed on time or at all. If not, I agree Iraq’s output will likely remain in the 4400 to 4700 kb/d range (roughly a plateau) and this is likely the highest probability case based on recent history.
Thanks
Much better and readable
I wouldn’t bet against a motivated Chinese effort. Motivation for energy is much stronger for China than US, since for the time being US has domestic production to an extent that China does not.
China imports over 11 Mbpd.
‘Iraq and China signed an oil-for-reconstruction deal in 2019, with Beijing funding infrastructure projects in exchange for 100,000 barrels per day. As of February, Chinese firms oversee two-thirds of Iraq’s oil production.’
https://www.semafor.com/article/05/13/2024/chinese-oil-companies-win-iraqi-bids-over-us
https://www.voanews.com/a/chinese-companies-win-bids-to-explore-iraq-for-oil-gas/7608186.html
or
Beijing to Baghdad: China’s growing role in Iraq’s energy sector-
https://www.mei.edu/publications/beijing-baghdad-chinas-growing-role-iraqs-energy-sector
Maybe the Cheney/Bush invasion of Iraq wasn’t such a great way to $1.8 Trillion dollars. Killed about 300,000 civilians on an immediate basis, much more during the chaos of the next decade.
And opened the door wide open for the Islamic Republic of Iran to extend its influence toward the Mediterranean in a major way.
https://www.youtube.com/watch?v=qtsV8QFtHa0
5 minutes.
Chinese Shale and military expansion plans searching for oil
Interesting Insights ( Chinese shale is located in secessionist China and Gov’t doesn’t want to develop them an energy resource)
China has second largest Shale resource in the world. But the energy return on energy invested is terrible!
Peter Zeihan – geopolitical strategist.
Keep in mind that Zeihan is incredibly pro-US and anti-China/Russia in his takes. His speaking fees are paid by US establishment (MIC and think tanks). Thus, take what he says with a grain of salt if you haven’t already seen all of his bad takes on how the Ukraine war would go, or just about any of his longer-term takes over the last 15 years.
Zeihan is a Gadfly.
steve
The Rig report for the week ending May 24
– US Hz oil rigs decreased by 3 to 448. This is the third consecutive drop, down 10 from 3 weeks ago.
– Texas Permian was down 1 to 196 while NM rose by 1 to103. The Texas Permian is down 48 rigs from the May 2023 high of 244.
– In New Mexico, Lea county added 1 to 49 and Eddy dropped 1 to 53.
– In Texas, Martin dropped 1 to 32 and Midland was unchanged at 21.
– Eagle Ford dropped by 1 to 46. EF has been at 46 ± 2 rigs for the last 4 months
– NG Hz rigs dropped by 5 to 88. (Not shown)
Understandably unenthusiastic with WTI below $80. The Permian has consolidated. It’s hard to imagine a large increase in rigs at this point until probably $100.
Stephen
WTI price could be affecting the rig count. I also thing the number of good drilling spots in the Permian is dropping and a problem.
.
Ovi,
I think activity in the Permian will pick-up in the second half of the year, when the 2bcf/d Matterhorn pipe goes online. Gas egress is capped out at the moment, there is no need or urgency to do much at the moment.
Kdimitrov
Thanks. I recently became aware of the Matterhorn pipeline. It certainly will have an effect on drilling. Still a very complicated situation regarding company strategy, cash allocation, maintain production or increase, etc?
Frac Spread report for the week ending May 24
The frac spread count dropped by 6 to 257 and is down by 3 from one year ago. The chart continues to indicate the frac spread count will bounce between 250 and 275 going forward but with a bias closer to 250.
OPEC heavyweights are cheating on their targets
Saw this Economist headline and just a few paragraphs. The story is behind a paywall. Maybe someone with access could add a few more paragraphs.
The organisation of the Petroleum Exporting Countries (opec) and its allies, a group that produces 40% of the world’s crude, wants to keep oil prices high and stable. Lately they have certainly been stable, even if not that high. Despite the recent death of Iran’s president and the escalating war in Gaza, prices of Brent crude, the global benchmark, have stayed within $2 of $82 a barrel since the start of May.
Part of the reason why opec is failing to keep prices high is because its members are failing to keep to their output targets. In March the group’s leaders and Russia extended production cuts, vowing a reduction of 2.2m barrels a day (b/d), or 2% of global supply, until the end of June, on top of 3.7m b/d of previously agreed cuts for 2024. Yet the cartel is now overproducing so much that its daily output in 2024 is little changed from the last quarter of 2023. This will create tensions when members get together to decide their strategy at opec’s ministerial meeting on June 2nd.
Analysis by Jorge León of Rystad Energy, a consultancy, shows that some countries are misbehaving on a grand scale. Last month the voluntary cutters produced 806,000 more b/d than called for by their collective targets. The worst offenders, Iraq and Kazakhstan, have consistently flouted commitments.
I assume OPEC is hoping that demand will rise by more than 1 Mb/d in H2 to reduce this excess supply. I had also read that Russia was exceeding its limits and Putin ordered his oil companies to back off a bit.
https://www.economist.com/finance-and-economics/2024/05/27/opec-heavyweights-are-cheating-on-their-targets
New posts up
https://peakoilbarrel.com/short-term-energy-outlook-may-2024/
and
https://peakoilbarrel.com/open-thread-non-petroleum-may28-2024/