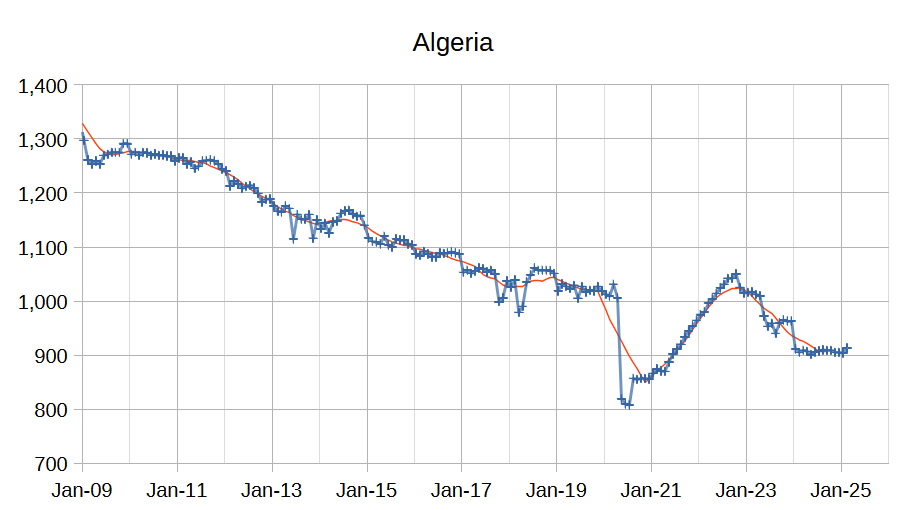
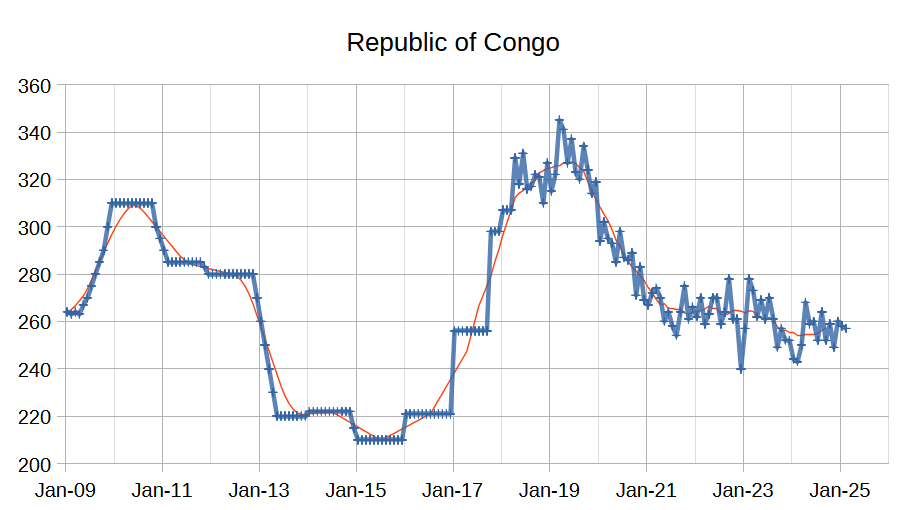
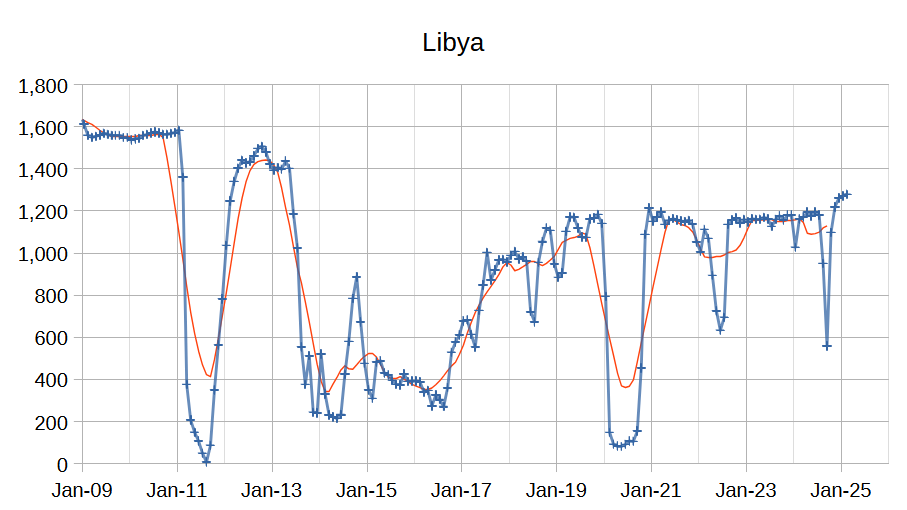
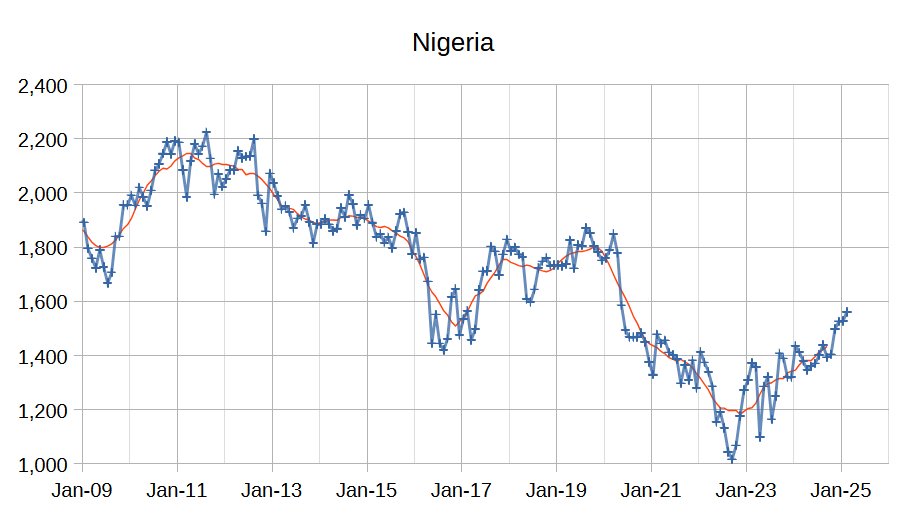
The OPEC Monthly Oil Market Report (MOMR) for March 2025 was published recently. The last month reported in most of the OPEC charts that follow is February 2025 and output reported for OPEC nations is crude oil output in thousands of barrels per day (kb/d). In the OPEC charts below the blue line with markers is monthly output and the thin red line is the centered twelve month average (CTMA) output.
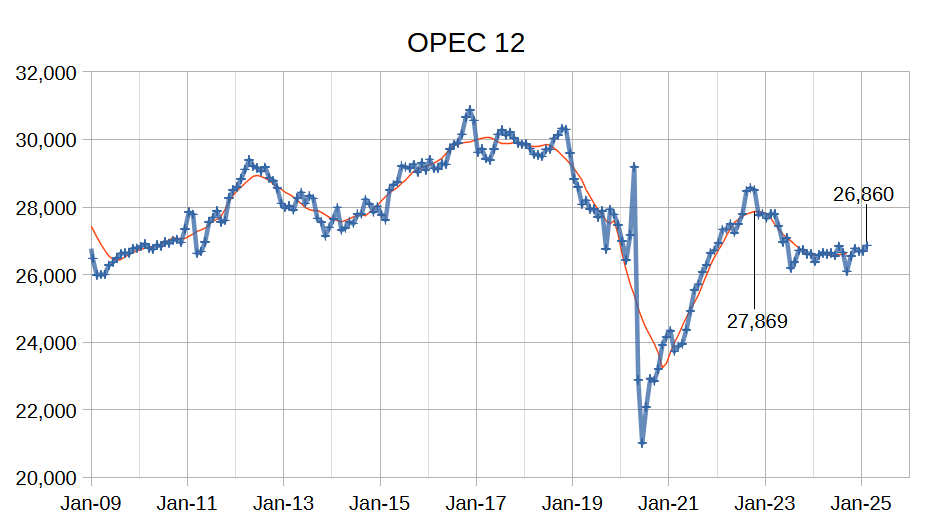
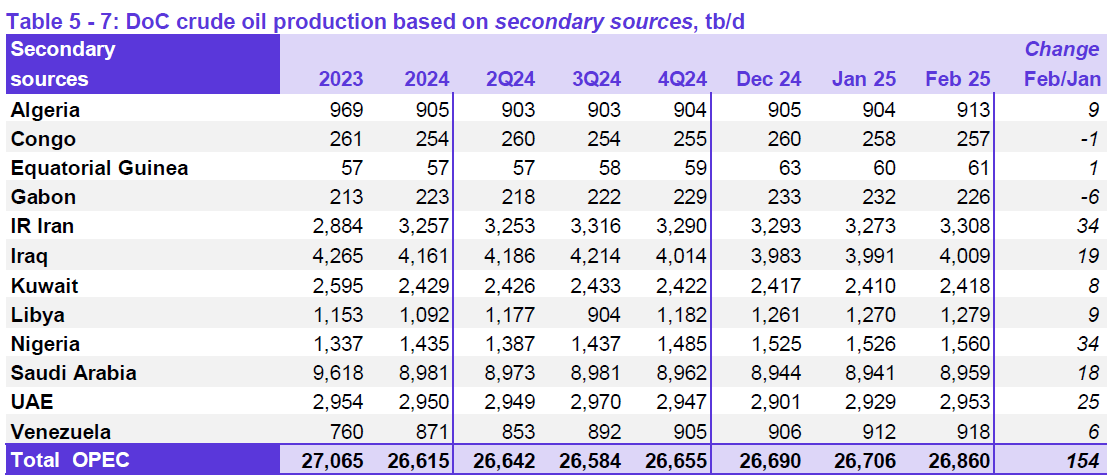
Output for December 2024 was revised lower by 110 kb/d and January 2025 output was revised higher by 28 kb/d compared to last month’s report. OPEC 12 output increased by 154 kb/d with the largest increases from Iran and Nigeria (both at 34 kb/d), also UAE (25 kb/d), Iraq (19 kb/d) and Saudi Arabia (18 kb/d) saw increased crude output. Other OPEC members had small increases or decreases of 9 kb/d or less.
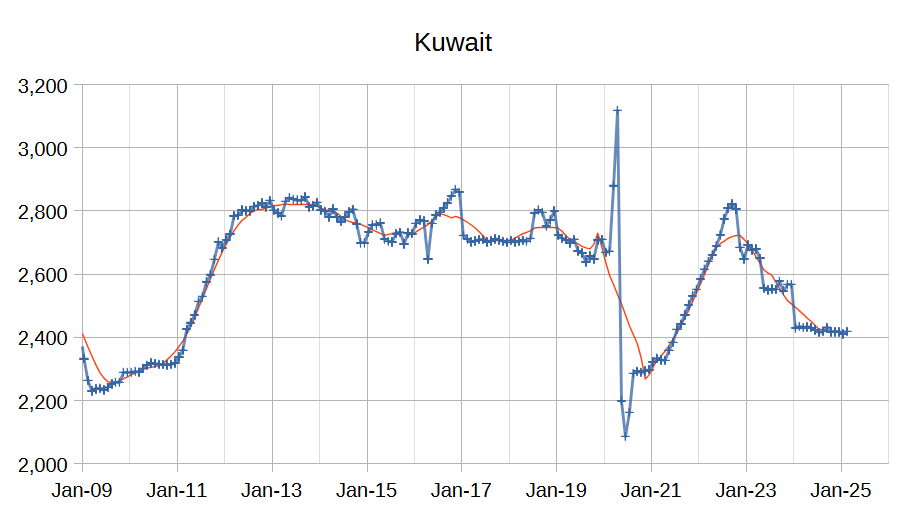
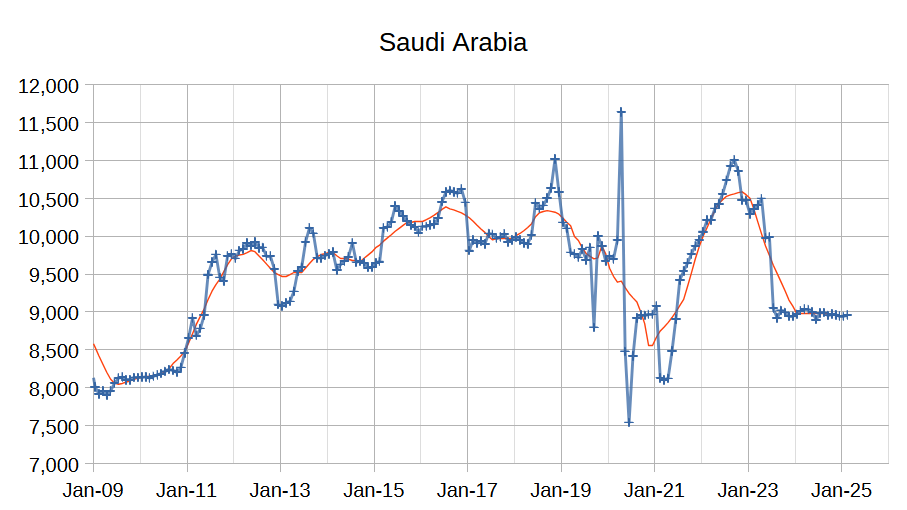
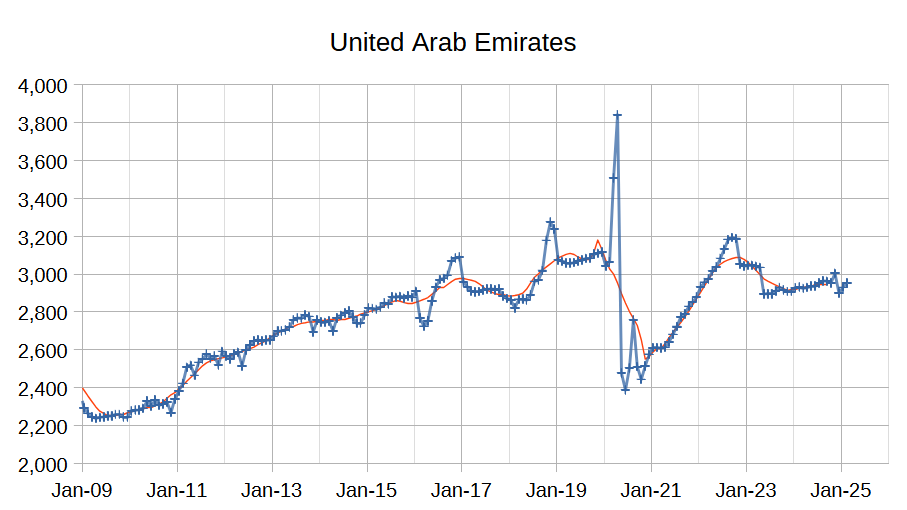
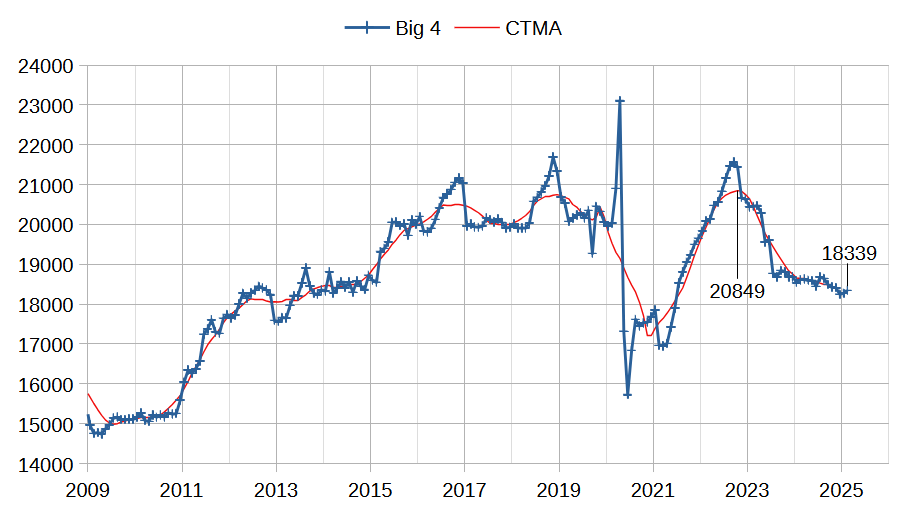
The chart above shows output from the Big 4 OPEC producers that are subject to output quotas (Saudi Arabia, UAE, Iraq, and Kuwait.) After the pandemic, Big 4 average output peaked in 2022 at a centered 12 month average (CTMA) of 20849 kb/d, crude output has been cut by 2510 kb/d relative to the 2022 CTMA peak to 18339 kb/d in February 2025. The Big 4 may have roughly 2510 kb/d of spare capacity when World demand calls for an increase in output.
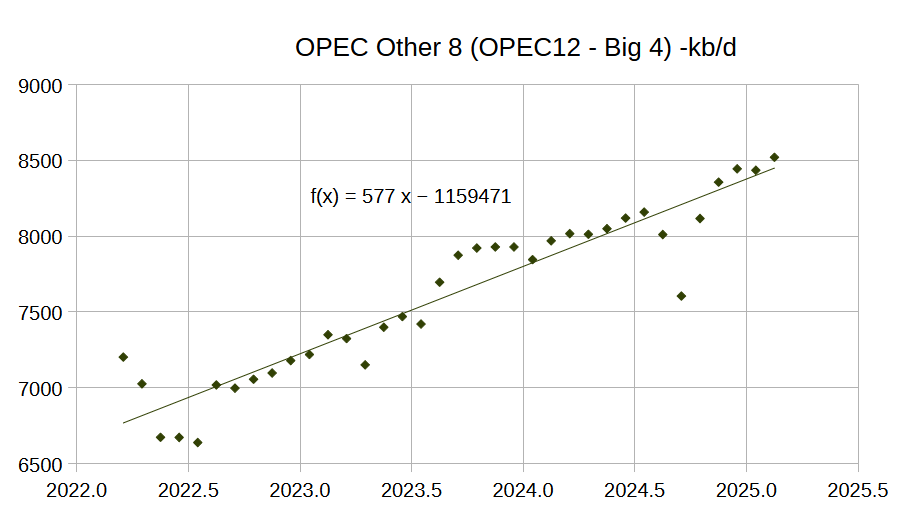
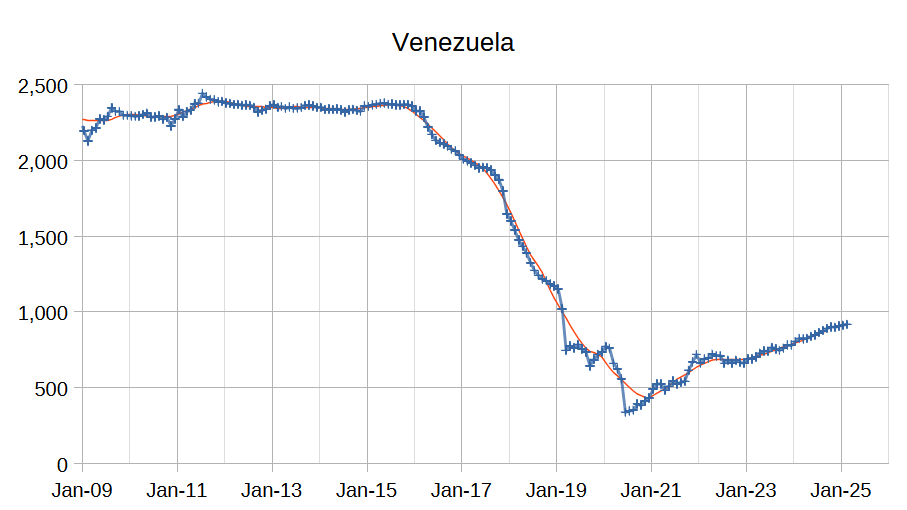
Most of the increase in the Other 8 OPEC nations (those OPEC 12 nations that are not part of the Big 4) over the past 3 years has come from Iran and Venezuela (about 439 of the 577 kb/d average annual increase or 76% of the total.) The the remaining 6 nations (all except Libya were subject to quotas) had relatively flat output over the 36 month period covered in the chart above (March 2022 to February 2025.) See chart below for OPEC Other 6 (OPEC 12 minus Big 4 minus Iran minus Venezuela) with an average annual increase of only 138 kb/d over past 3 years.
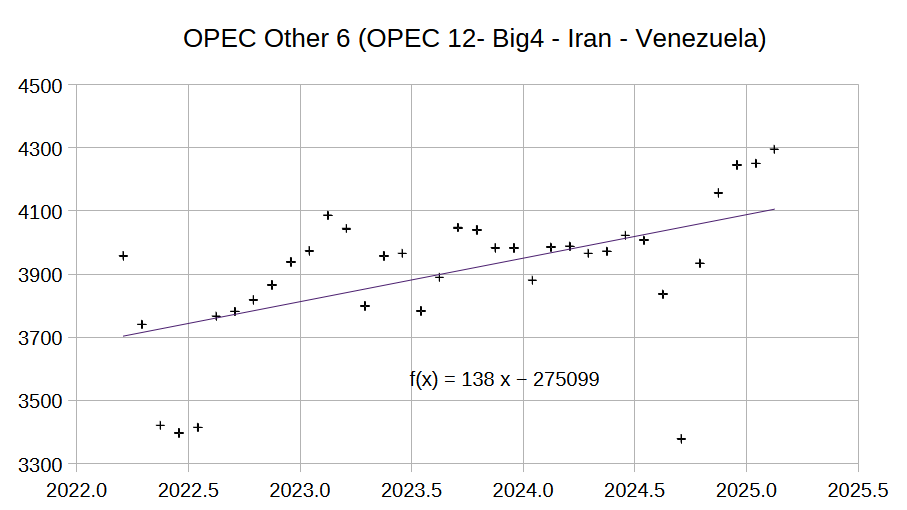
The increase in Iran and Venezuela’s crude output has been slowing lately so I expect OPEC other 8 output to eventually slow to an annual rate of 200 kb/d or less by 2028.
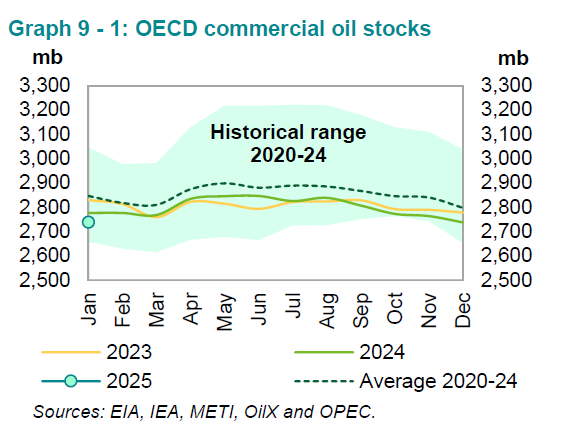
The very high OECD commercial stocks during the April 2020 to March 2021 period (height of pandemic shut down) may be making it appear that stocks are low, but judging by oil price levels the market believes stocks are adequate. Days of forward cover have remained at about 87 days for commercial stocks plus SPR in the OECD from 2022 to 2024. Oil on water (not included in days of forward cover) has decreased by about 143 million barrels since 2022, this is about 3 days of forward supply in 2024, there are about 31 days of forward cover in tankers in transit in addition to the 87 days of oil on land at the end of 2024.
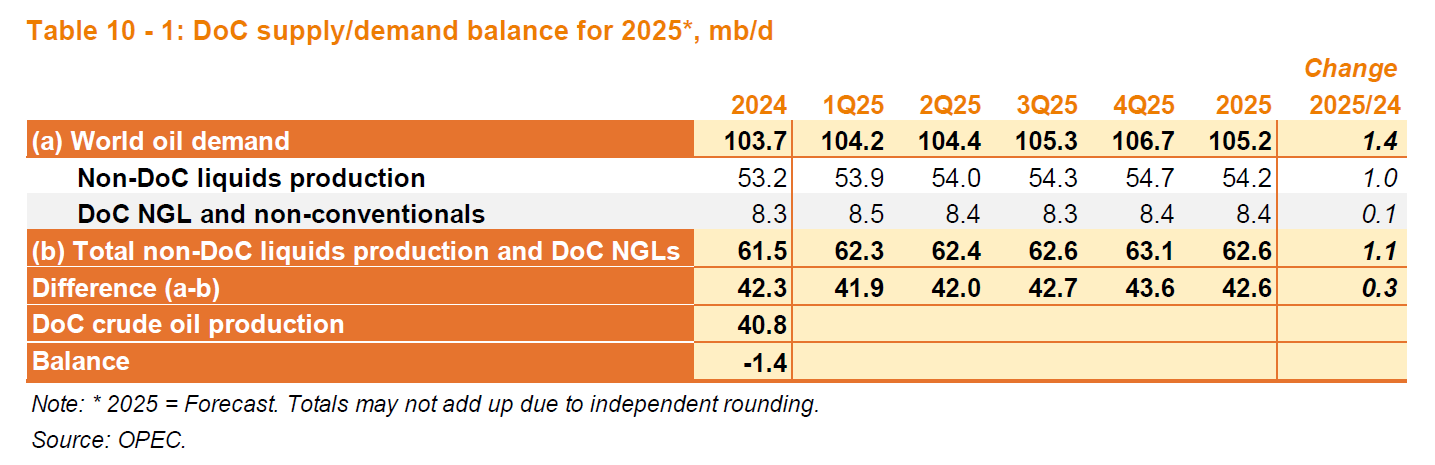
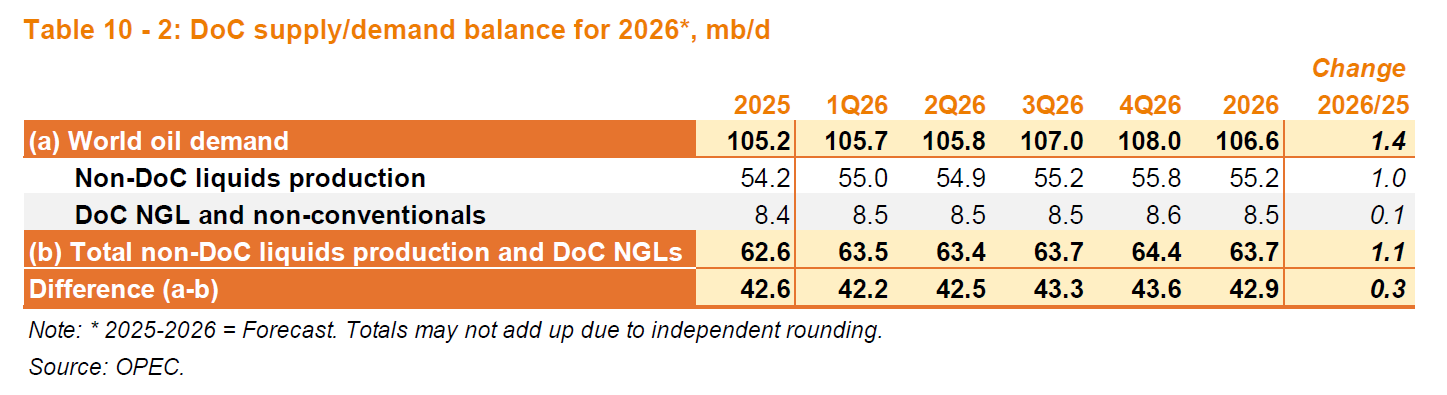
The estimates for the balance of supply and demand are unchanged from last month.
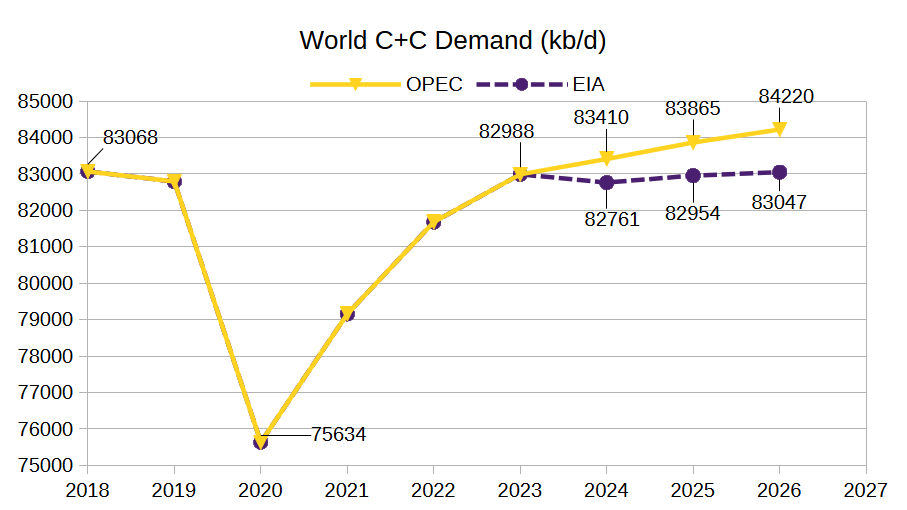
The chart above attempts to estimate World C+C demand based on both the OPEC MOMR and the EIA STEO. It uses Energy Institute data for refinery throughput from 2020 to 2023 and EIA and OPEC estimates for Total liquids consumption. The trend in non-C+C liquids is combined with the EIA and OPEC forecasts for 2024 to 2026 to find the estimates in the chart above. Most of the forecast for liquids demand increase is from NGL and other liquids rather than C+C over the period from 2023 to 2026. OPEC expects a bigger increase than the EIA, but it is relatively modest at 1232 kb/d over 3 years or roughly 410 kb/d per year.
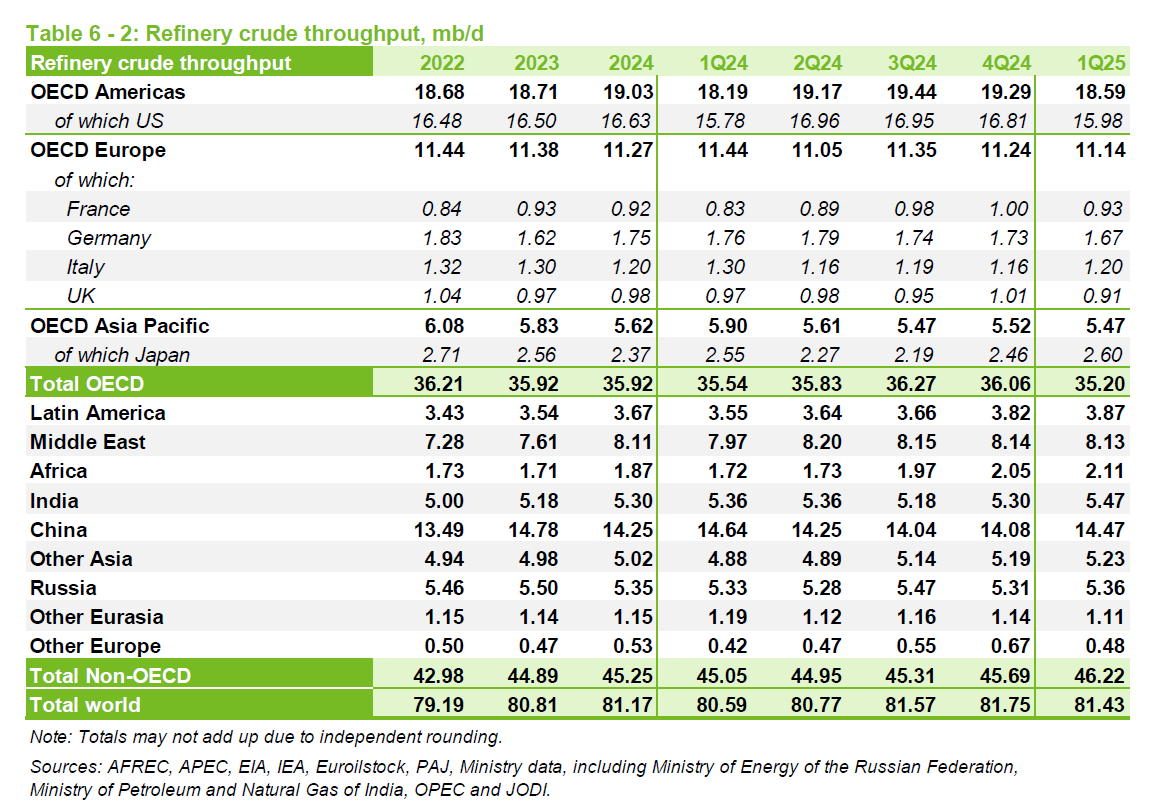
OPEC estimated a peak refinery crude throughput of 81.68 Mb/d in 2018 and the most recent 4 quarters have an average refinery crude throughput of 81.41 Mb/d so it looks like we may reach a new peak in crude oil demand in 2025, based on the OPEC estimates currently available. Note that the estimates are often revised. Last month’s MOMR had the most recent 4 quarters at 81.45 Mb/d.
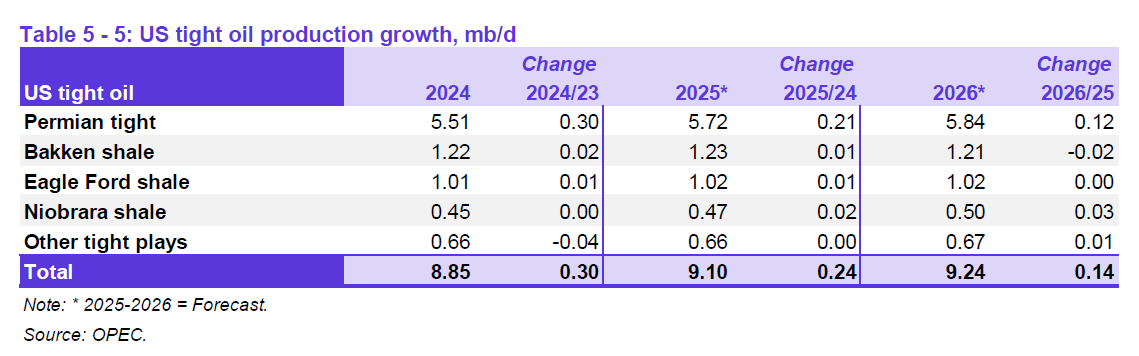
OPEC expects fairly slow growth in US tight oil output in 2025 and 2026, most of the increase comes from the Permian Basin, but the growth rate in 2026 falls to less than half of the growth rate in 2024.
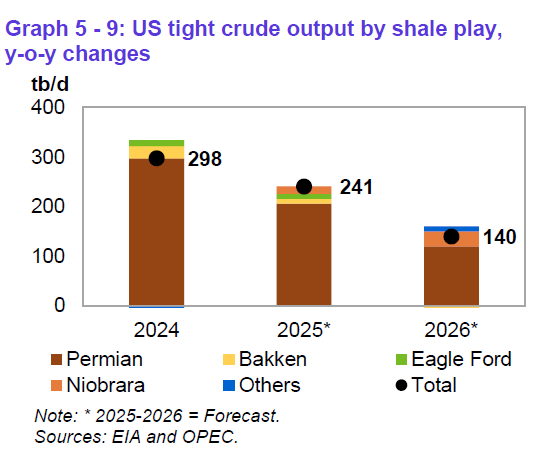
The chart above shows clearly the dominance of the Permian Basin and the slow down in the rate of tight oil growth.
145 responses to “OPEC Update, March 2025”
OPEC
Spare capacity
In 2017 OPEC production averaged 32.3 million barrels per day.
Minus current production of 26.8 million barrels per day equals 5.5mmd/d
Is it possible that OPEC has lost 3 million barrels per day in 8 years
Loads of Oil,
The only OPEC members that are currently restricting output are Saudi Arabia, UAE, Iraq, and Kuwait, the other 8 OPEC members are either not subject to quotas (Iran, Venezuela, and Libya) or they are producing as much as they can (all except Gabon are producing below their quota so they are producing all they can.) Sustainable Capacity is 2.5 Mb/d more than current OPEC output or about 29.3 Mb/d.
Also in 2017 OPEC 12 month average peak crude output was about 30 Mb/d, and recently in Feb 2025 output was 26.86 Mb/d, so a difference of 3.14 Mb/d. There have been big drops in Venezuelan and Iranian capacity since 2017, roughly 1.6 Mb/d, but some of this has been offset by increases in Big 4 capacity from 2017 to 2022. The Big 4 control all of the OPEC spare capacity at present.
Dennis
Where do you get your figures from, I took figures from OPEC monthly report 2018 mid year. So I will stick to the 32.3 mmb/d.
I have a spreadsheet with OPEC monthly crude output from secondary sources back to 2008. Note that there are now 12 OPEC members, Angola and Ecuador are no longer part of OPEC so to compare to OPEC today you need to deduct Angola’s output (1634 kb/d in 2017) and Ecuador’s output (530 kb/d in 2017) based on November 2019 report. Together this adds to 2164 kb/d, deduct from OPEC 14 output in 2017 of 32014 kb/d and we get 29850 kb/d for the OPEC 12 members output in 2017.
OPEC ASB has OPEC crude at 30 Mb/d in 2017.
Here is link to spreadsheet from OPEC ASB
https://docs.google.com/spreadsheets/d/1dvRxBMk92i-ZPSRUy09ybY-Yg-KFid6a/edit?usp=sharing&ouid=105320434049434900507&rtpof=true&sd=true
Screen shot below, in 2016 the output was highest at 30.75 Mb/d, but in that year Iran was at 3651 kb/d and Venezuela was at 2373 kb/d, combined at 6024 kb/d, in 2023 they were at 783 and 2859 kb/d for a combined 3642 kb/d. This is a drop of 2382 kb/d from the 2016 level.
You can also find C plus C data at link below
https://www.eia.gov/international/data/world
You will find OPEC C plus C will be a bit higher than crude only data below
2010 28719
2011 29486
2012 30695
2013 29656
2014 29727
2015 30947
2016 31996
2017 31976
2018 31901
2019 29880
2020 26286
2021 27202
2022 29579
2023 29030
OPEC 12 capacity for C plus C is roughly the post pandemic peak of 29.58 Mb/d in 2022. For crude only (as reported in MOMR) OPEC 12 capacity is about 27.76 Mb/d.
Dennis
Thanks for the link.
You have have no idea how much oil is produced by Nigeria
https://www.ifri.org/sites/default/files/migrated_files/documents/atoms/files/oil_rent_and_corruption_the_case_of_nigeria.pdf
Auditors have plainly stated they do not know.
The same can be said of Iran, Russia and many other corrupt countries.
https://www.lloydslist.com/LL1151538/Fake-origin-certificates-disguising-Russian-oil-OFSI-warns
These are just two of hundreds of observations done by auditors, anti corruption agencies,
Methane emissions from Venezuela suggest higher oil production than is recorded.
Legally sold alcohol is checked , recorded and taxed. Do you know the extent of the trade in illegal alcohol. Alcohol that is produced without being publicly advertised, sold without inland revenue finding out.
https://www.economist.com/finance-and-economics/2024/10/17/inside-the-secret-oil-trade-that-funds-irans-wars
Loadsofoil,
I go by the data available, rather than making stuff up. You can make up any number you want,
Loads of oil,
As before there is very little in the piece on Nigeria on estimates of oil production and the quantities stolen, the piece is also 7 years old things my be better or worse today.
The article points out that it is difficult to measure the quantity of oil stolen, estimayes seem to range from 70 kb/d to 300 kb/d according to the piece you linked. As I have said before the secondary sources used by OPEC and other agencies are no doubt aware of the corruption in Nigeria and attempt to include this in their production estimates. The average of low and high estimates is about 185 kb/d, in Feb 2025 Nigeria’s reported output by the IEA was about 1440 kb/d. There is no doubt other oil that is stolen throughout the World and may or may not be accounted for in official statistics.
We don’t have perfect information and I have never claimed that is the case. I work with the information available and I am not omnicscient.
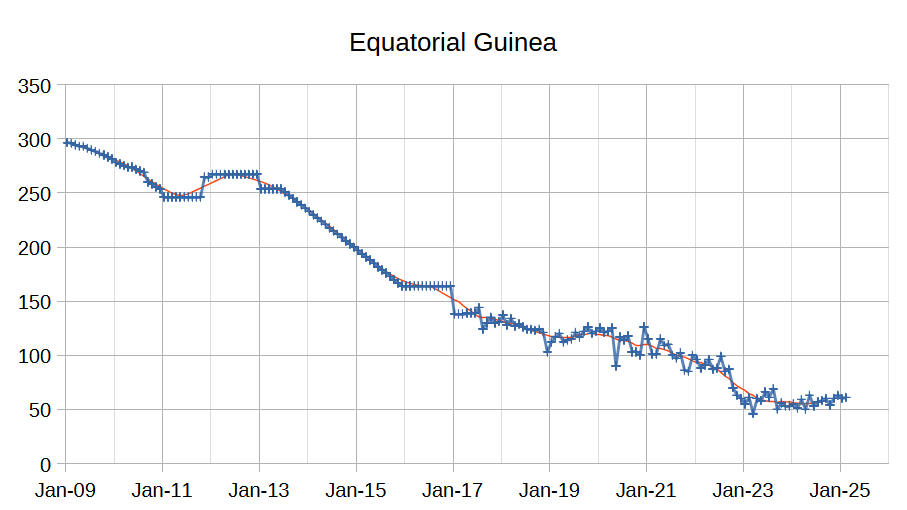
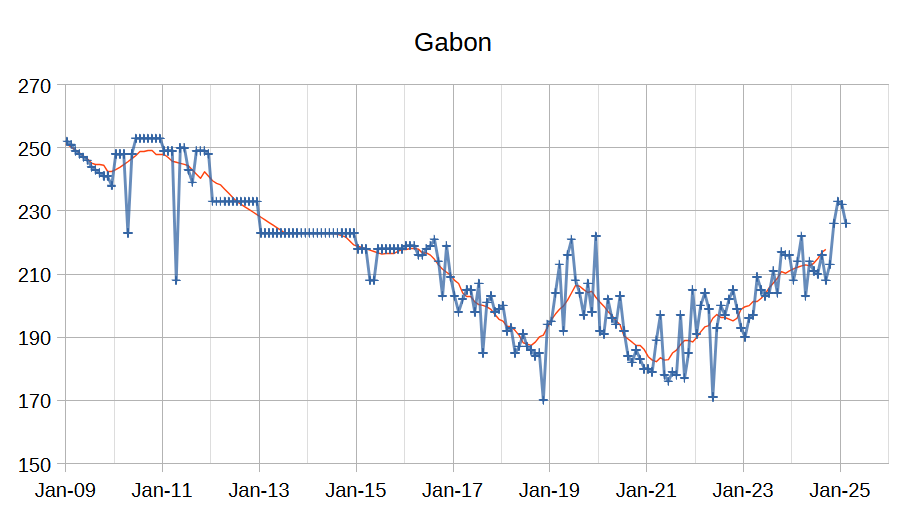
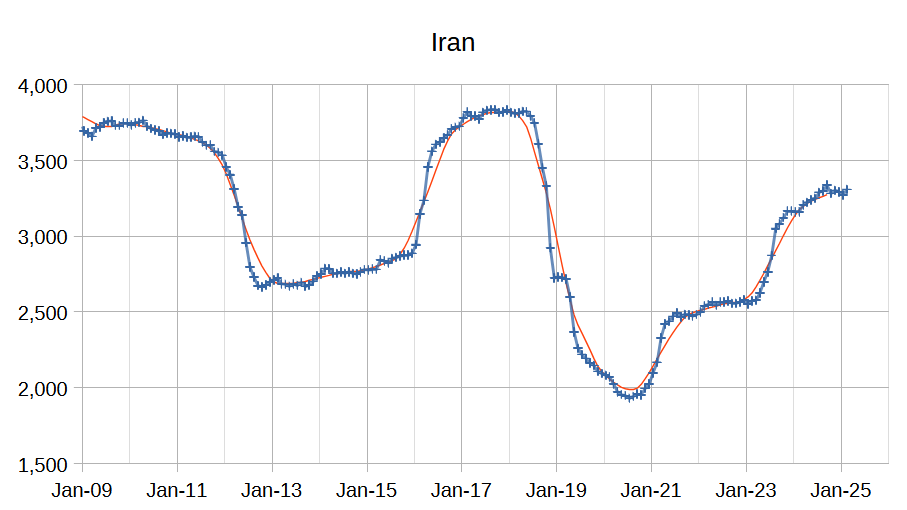
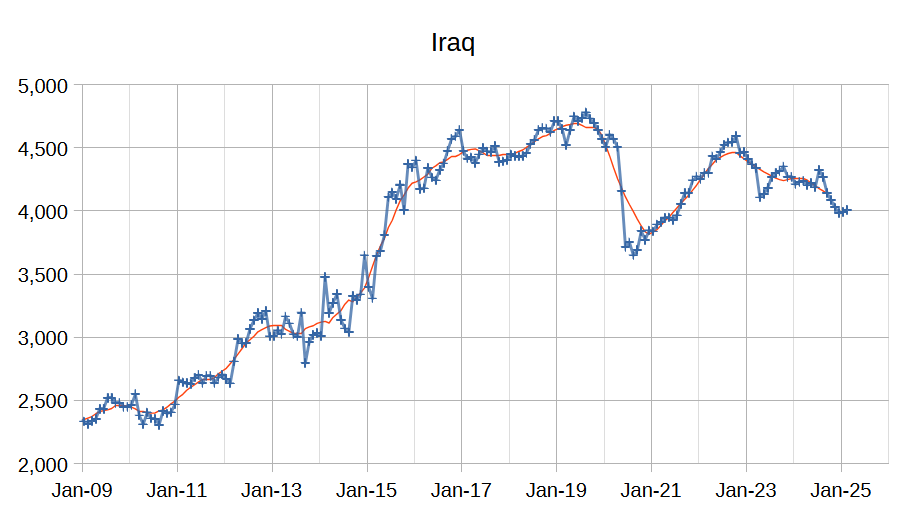
Oil output information from OPEC Annual statistical bulletin (ASB) for 6 OPEC nations Big 4 (Saudi Arabia, UAE, Iraq and Kuwait) and Iran and Venezuela which have seen big decreases in output since 2016 and are currently producing all they can (they are not restricted by OPEC quotas).
For Iran and Venezuela the right hand column is labeled correctly, for the other nations and OPEC and Big 4, this column is 2016 minus 2023 output. For Feb 2025 the IEA estimates 19000 kb/d for Big 4 output, compared to 2016 peak this suggests spare capacity of about 2150 kb/d and relative to 2022 peak spare capacity would be 1800 kb/d.
Click on image for larger view.
Loads, not only is it possible, it’s likely that the lost productivity will not be brought back anytime soon. While it would be almost a black swan event, it’s possible that the largest oil basins peaked over the last 10 years, covid masked this but we might see a massive oil price turnaround. The simple fact is that it took 250 million years of sunlight (or more) to accumulate 10,000 – 100,000 billion barrels of oil, we are doing the best we can and have liberated more than 1,500 billion barreling. It’s a sharp productivity curve and it’s likely that we don’t have much easy oil left…
What does spare capacity actually mean? Does it mean the amount production could be increased by immediately?
Alimbiquated,
I define it as capacity that can be brought online in 90 days and maintained for 12 months, I typically judge it by 12 month historical average.
Dennis
Congrats on making an attempt to get a handle on C C demand. Looking at your 2025 numbers, they may be a bit on the high side. In my previous World post, World C C supply for 2025 will be closer of 82,400 kb/d avge. So something is wrong here because if your predicted demand is close to reality, WTI would not be sitting close to $68/b.
So how to resolve this difference. I think that nobody really knows what the current supply situation really is. I think there are too many secret barrels entering the market. Could it be in the order of 1,000 kb/d. Maybe. It appears that even OPEC is beginning to realize that something is amiss.
This morning Opec overproducers outlined a new compensation plan to reduce production.
London, 21 March (Argus) — Seven Opec members have submitted plans to the Opec secretariat detailing how they intend to compensate for producing above their crude production targets since January 2024.
The plans show that Iraq, Kazakhstan, Russia, the UAE, Kuwait, Oman and Saudi Arabia will reduce their combined output by an average of 263,000 b/d over the 15 months to June next year (see table).
This is to compensate for exceeding their production targets by a cumulative 4.203mn b/d between January 2024 and February 2025. This figure does not represent a monthly average, but rather the sum of the monthly volumes by which the group’s overproducers have surpassed their respective output ceilings. It works out to an average monthly overproduction of 300,000 b/d in the same period.
This is a tacit admission that OPEC does not really know, with all their resources, what is really happening on the supply side. This also applies to the EIA and IEA.
The full article below includes a table showing which countries claim they will reduce production. Within OPEC promises are Cheap.
Note: The 4.203mn b/d above should be 4.203mn b.
https://www.argusmedia.com/pages/NewsBody.aspx?frame=yes&id=2670109&menu=yes
Ovi,
Thanks. Demand is often difficult to measure and my estimate is based on the Energy Institute’s estimate of refinery throughput, other agencies have different estimates.
Also note the Energy Institute measures crude plus condensate output differently from the EIA. In 2023 they had World C plus C at 82636 kb/d while the EIA has 81963 kb/d, a difference of 673 kb/d. There may be similar differences in consumption, my estimate is very rough and may indeed be too high (or the EIA may be too low, we don’t really know which).
Interesting piece by Argus, doubtful these cuts will be made in my opinion. Not clear OPEC will be increasing output, if all these cuts are followed net output would be down from OPEC rather than up as the 2200 kb/d increase over 18 months amounts to an average increase of 122 kb/d each month, the average cuts outlined in the Argus piece are about 263 kb/d so it suggests a net decrease of 141 kb/d each month over the next 15 months for a total decrease of 2100 kb/d.
This scenario seems very unlikely. Flat output is possible for OPEC plus, unless Trump clamps down on Iran and Venezuela, in which case the rest of OPEC will increase output to make up the difference. Iran may send its oil to Trump’s buddy Putin and Russia will export it as Trump will likely relieve sanctions on Russia, which is unfortunate, but the US Congress seems likely to continue its spineless stature due to cowardly Republicans fearful of Trump and Musk.
On the secret barrels entering the market, perhaps there is some of this, but the OPEC plus producers watch each other very carefully and use a lot of proprietary data to watch other members to make sure they are abiding by their quotas and to guess at output levels and demand levels, so al lot of the secret barrels may be in the estimates. Unfortunately the only crude plus condensate estimates readily available at the World level come from the EIA and Energy institute. From 2000 to 2023 the average difference between these sources was about 1000 kb/d so if we took the average of the two estimates and assumed it was correct, then the EIA estimate would be 500 kb/d too low.
Dennis and Ovi-
What do you two think the margin of error is on the global refinery throughput tally? 2 or 3 Mbpd?
How trustworthy is data coming out of rogue, politically untrustworthy or unstable countries like Sudan, Syria, Russia, and the US?
Hickory,
That sounds like a good guess, the numbers may not be very good. There may be better proprietary data somewhere.
Hickory
I have no opinion on refinery input. However i think that C plus C production estimate is low by 500 kb/d.
Ovi,
Which production estimate do you mean? The EIA STEO?
Hickory
I just came across this headline.
“Oil’s Oversupply Spiral: Can Prices Stay Above $60?”
According to the chief executive of Vitol, Russell Hardy, the current developments in supply and demand could push oil prices consistently lower, to between $60 and $80 per barrel.
The International Energy Agency just threw a bucket of ice water on oil bulls, reporting that crude supply is outpacing demand by 600,000 bpd and slashing its demand outlook for the year. And the IEA isn’t alone. The world’s biggest oil traders are also sounding the alarm, turning bearish as overproduction ramps up both inside and outside OPEC.
https://oilprice.com/Energy/Crude-Oil/Oils-Oversupply-Spiral-Can-Prices-Stay-Above-60.html
Ovi,
And this supply/demand setup with global GDP projected to be in the 2-3% range by most.
HB- lets keep in mind that refinery capacity is different than global refinery throughput, which I see as the most important metric on production/demand.
“It’s horrible, entire base is burning” – Residents in Krasnodar show the fire spreading violently
https://www.youtube.com/watch?v=FXNryMAKSk4
The most “destructive” night for Russia: Drones attack five oil refinery facilities
https://www.youtube.com/watch?v=sqMq9tWNM48
People flee burning Russian oil refinery after reported drone attack
https://www.youtube.com/watch?v=lgoJTRZAJiI
Who knows Hickory, one thing for sure. There is less capacity 2 weeks ago than a month ago. Less capacity 1 week ago than 2 weeks ago and less a few hours ago than last week.
The only thing Trump could get Putin to agree to is a cease fire on energy infrastructure. At the same time the only energy infrastructure Ukraine has remaining are 3 nuclear power plants that Russia is afraid to bomb because of radiation fall out. So Putin ask Trump to take them over to stop Ukraine from building nukes during the 2 hour phone call.
I don’t think destroying refineries affects crude oil production, does it?
How oil prices impact on Russian oil revenue
From Joe blogs
https://www.youtube.com/watch?v=49lZaTvLlII
New Sec. Of Energy Dishing Out the Word Salad On U.S. LNG Export Ban
Yesterday, new Energy Secretary, Chris Wright was on CNBC with Joe Kernen about the Biden LNG Export Permit Ban. Wright suggests due to crazy Climate policies, the Biden Administration put a ban on new LNG Export permits and wanted to do a study.
Energy Sec. Wright goes onto to say that he totally reversed this ban and has signed 5 new deals to get more LNG facilities approved and into construction.
This is hilarious because the Biden Administration Ban was on those projects ABOVE & BEYOND the already 48 bcf/d of approved projects. At the time of the new policy in Jan 2024, there were:
14 bcf/d in Operation
12 bcf/d in Construction
22 bcf/d approved awaiting FID and etc.
Does the USA need more than 48 Bcf/d of Approved LNG Facility Capacity when the current capacity is at 16 bcf/d, which would mean an additional 32 bcf/d of U.S. domestic natgas production??
Clearly, Sec Wright is part of the new Trump “Cheerleading” Administration, rather than providing “Authentic” Energy policies that make sense.
Gonna be an interesting 4 years… LOL.
https://www.cnbc.com/video/2025/03/20/energy-secretary-wright-on-energy-dominance-pres-trump-was-elected-to-bring-some-common-sense-back.html
steve
Hopefully some Senators will grow a spine and in 2.5 years Trump is removed from office. It will require a flip in the House to Democratic control in 2026, then 67 Senators that will fulfill their oath to the Constitution. Probably wishful thinking.
Dennis,
Gosh, I don’t know how the situation is going to unfold in the Trump Administration and in the U.S. Economy over the next several quarters and years. However, I got my best Silver Dollar betting that even many of the MAGA folks are going to become disenfranchised with Trump & Elon as all of these Chainsaw policies start impacting their lives negatively.
Now it looks like the Chainsaw Role Model from Argentine President Miley is beginning to really Backfire as public protests mount.
We live in interesting times…
steve
Note that if we add the 34 BCF/d to the 110 BCF/d currently produced, that is around 143 BCF/d unless US consumption decreases. Let’s assume we ramp up output at 5 BCF/d each year, it takes 7 years to reach this level of output. If this is accomplished it will likely be the peak in US output. URR for US natural gas will likely to be about 50 to 60% of the Potential Gas Committee resource estimate. My guess is 3000 TCF.
I have updated my Permian Model with a comparison to an old scenario from Enno Peters from December 2021, this scenario for the Permian has a URR of about 45 Gb. It is assumed that new well EUR decreases at about 1% per year starting in Jan 2025, about 480 wells per month from 2025 to 2028, then decreasing completion rate after that. Peak is in late 2028 at about 6470kb/d, December 2024 output was 6040 kb/d, so a fairly slow increase over the next 4 years, about 108 kb/d annual average increase for this scenario.
https://www.youtube.com/watch?v=aHjLICrl5OI
10 minutes; credible source with evidence
The Pentagon preparing for war with Iran, including a scenario with nukes.
Andre – WTI prediction – 117 end of year, 100 average.
Based on :
Trump wanting to exact revenge on Iran for attempting to assasinate him
Chevron out of Venezuela ( I didn’t predict that )
Permian decline
Tariffs ( I didn’t predict that )
Going to war with Iran would be inflationary to the world economy so i dont think they will take this route.
They might try take out Khamenei that is a possibility, but going to war with boots on the ground in Iran. Nah unlikely i reckon. After the Iraq and Afghan war fiasco but who knows.
“i dont think they will take this route”
All bets are off with this US government. I’d be surprised if he’d invade Canada though.
Might be time for Australia to start looking for more reliable partners…perhaps China.
Well it went so swimmingly well in Iraq. Only Iran has double the population and three times the area.
Iron Mike,
“I reckon” … you are an Aussie (love Australia). I can tell from that statement.
This is Trump, he is a narcissist that has never had any consequences for his actions and only cares about himself.
Trump is not a chess player.
If you come after him, he will come after you and it doesn’t matter whose lives get destroyed in the process.
Inflation? Trump doesn’t understand what inflation is. He’ll blame any criticism on Biden.
Mike, what are your thoughts on the Chinese warships that were encircling Australia? would love to hear your opinion!!
https://www.aspistrategist.org.au/chinas-navy-sends-a-steady-drumbeat-of-ships-around-australia/
Andre,
Haha yea i am not originally Australian, i immigrated to Australia in 92.
As reckless and nutty as Trump is, he doesn’t want to disappoint his voter base. So essentially he doesn’t care if the world burns just as long as his voter base isn’t that affected from the fall out.
Again for me boots on the ground in Iran. Very skeptical that will occur. No doubt Netanyahu has wet dreams of such a scenario. But i think he will be satisfied as long as the head of the Islamic regime is gone, Khamenei.
Regarding China, i think China is more bark than bite. I don’t think they have won a single war they have been involved in historically. In some ways i see them as the opposite of what Japan was, all bite.
China reminds of the guy we all knew who talked the talk and thought they are tough. But as soon a fight broke out, they were the first to run away lol
Anyways that is my worthless opinion.
Iron Mike, I like your thinking.
China is a heck of a lot more capable than in the last century. Hope that they don’t earn your respect the hard way.
I often wonder the same thing about China. They talk a big game but they’ve really never, in modern times at least, taken an actual side in a conflict and really put their money where their mouth is. They’re touting a much more modern military now but have zero experience actually using it in the real world. Despite the middle east war debacles, the US clearly gained extensive experience in command and control as well as tactics.
I guess one might say, well, if you’re China then why would you step in when your arch enemy seems to be tearing itself up all on its own. And there’s some logic to it, though I distinctly believe that all sides of the political isle would quickly fall in line with each other if we went to war with China so I think that’s a losing hand for China to try and play.
Hopefully we don’t find out either way.
https://mishtalk.com/economics/trump-announces-25-percent-tariffs-on-countries-that-buy-venezuela-oil/
Trump announces 25% tariffs on anyone that imports Venezuelan oil
A pirated library for training AI LLM apps is available for search here, Enter your name and find out if you are included.
https://www.theatlantic.com/technology/archive/2025/03/search-libgen-data-set/682094/
The book describing the oil shock model is included in the library so just a matter of time until it can automatically make projections
https://chatgpt.com/share/67de4b9e-3b8c-800d-88e3-a0f98f5b26f2
It is a violation of copyright laws to train AI on copyrighted material, without permission.
Severe, per use, penalties can occur.
This is an issue that LAWYERS are starting to gear up for.
Not sure if this is the case for your book Paul.
Andre said:
“This is an issue that LAWYERS are starting to gear up for.”
Our book is published by John Wiley & Sons. They have a licensing agreement with some unspecified AI company:
https://www.marketwatch.com/story/john-wiley-sons-rallies-on-brighter-outlook-ai-potential-0cc53af1
I found a number of journal articles by my father (Dr. H. L. Johnson) so it looks like they ingested many scientific journals covering Astrophysics, Astronomy, etc. “Publications of the Astronomical Society of the Pacific”, “The Optical Society of America”, ” The International Astronomical Union”, Even “Science” the Journal of the AAAS (American Association for the Advancement of Science.)
Rig Counts for week ending 3/21/25
All Horizontal oil rigs (HOR) in US up one from last week and down 5 yoy, Permian unchanged from last week and down 11 yoy, Bakken (aka Williston Basin) down 1 from last week and down 2 yoy, Eagle Ford unchanged from last week and down 5 yoy, Niobrara up one from last week and down 6 yoy, other basins (not part of big 4 tight oil basins) up 1 from last week and up 19 yoy.
HOR=HOR for all US basins
March 21, 2025 HOR counts for Bakken-31, Eagle Ford-42, Niobrara-6, and Other basins-83, US HOR and Permian on chart.
Frac Spreads from
https://www.aogr.com/web-exclusives/us-frac-spread-count/2025
US Frack spreads (includes tight oil and shale gas wells) count increased by 3 from last week to 215, down 50 yoy (from 265) and up 14 from 12 weeks ago (201 for w/e 12/27/24). We don’t have information on frack spread oil/gas split or information on frack spreads by basin that is easily accessible, the frac focus data tends to be incomplete for many months.
A brief update/snapshot for those receptive to pondering future hydrocarbon scenarios – especially how natgas – and the Mighty Marcellus, in particular – is currently impacting the energy universe …
Less than 7 months ago, the 4 well Indian Foot pad came online in Bradford county by Expand Energy (formerly Chesapeake/Southwestern, combined).
In this brief timeframe, this pad has produced over 40 Billion cubic feet of gas … the heat energy equivalent of almost 7 million barrels of oil.
The top producer – Indian Foot 102HC- has produced over 11 Billion cubic feet … over 2 million Boe alone.
Stated another way, this single pad – production cost under 50 million dollars – has already provided the total yearly residential natgas needs for the cities of Cincinnati, Buffalo, St. Louis, Pittsburgh, Newark and Toledo COMBINED!
At an average residential cost of $2.22 par day, consumers can daily heat their homes, cook their food, warm their water, wash/dry their clothes … all for a little over 2 bucks per.
The Age of Gas is in its early ascendancy stage.
Those who continue to fret over perceived liquid hydrocarbon scarcity are completely missing the boat.
“Those who continue to fret over perceived liquid hydrocarbon scarcity are completely missing the boat.”
Cummins everywhere?
If so, there will come a point where Americans will want to shut down those LNG export terminals, I suspect.
Coffee gas,
Couple birds don’t make spring come about. Lol
Coffeeguyzz,
Classic cherry picking, 4 wells don’t really do it.
Here is Appalachia marketed natural gas output from EIA, Pennsylvannia, Ohio, and W. Virginia marketed Natural gas output. Looks like growth has slowed quite a bit.
Natural Gas will become scarce especially if we export as much as the planned LNG capacity, natural gas will become expensive in the US as a result and we may consume less in the future as a result.
Mighty Marcellus hasn’t looked so mighty since about 2021.
https://www.eia.gov/naturalgas/data.php#production
Dennis,
Yeah, your routine response of showing graphs/charts with flat annual production output is always (mis)interpreted as indicating some type of scarcity.
Well, in this case there actually is … scarcity of pipeline takeaway capacity.
After you posted your first ‘rebuttal’ yesterday, I spent some time checking recent in basin pricing and even I was surprised at how low it was.
For 2024, Eastern Gas South and Tetco M2 citygate pricing out of the App Basin was ~$1.60/mmbtu for much of the year.
This explains why the big producers lost so much money in 2024.
Also explains why rig count dropped from ~55 to ~35.
Thirty five rigs and still producing about 35 Billion cubic feet a day.
I no longer have the time to focus on the hydrocarbon world as I once did and – as such – have little to offer of a ‘contrarian’ view on this site as has been my inclination over these past years.
However, I will say, Dennis, that your apparent aversion to the production/consumption of hydrocarbons seems to strongly influence your interpretation of ongoing data.
Perhaps sooner rather than later you may have your own Road to Damascus moment like Art Berman and come to recognize just how awash this globe is in recoverable oil and gas.
… or mebbe not.
Coffeeguyzz,
Yes there is more supply than demand and prices for oil and gas are relatively low, that does not bode well for the profitability of the oil and gas industry or for future supply.
I agree that a slow down in output does not mean there is scarcity of supply, it can indicate a scarcity of profits though. Keep in mind that many of the very high resource estimates such as those published by the Potential Gas Committee do not include any economics in there analysis.
More gas will be produced at $10/ MMBTU than at $2/MMBTU and demand will be lower at the high price than at the low price. At a higher price natural gas fired power plants are no longer competitive with wind and solar except as a backup source and at $10/ MMBTU they may not even be able to compete with battery backup or pumped hydro.
My guess is that at a price that brings on adequate demand for natural gas the resource that will be profitable to produce is about 60 to 65% of the mean USGS shale gas TRR estimate for the US. If this WAG is correct, US natural gas output peaks between 2030 and 2035.
Dennis,
An ‘out there’ component that you may want to keep in the back of your mind in the coming years … cost of hydrocarbon recovery.
As noted by Art Berman referencing his November interview with Chris Wright (your favorite ‘not the sharpest tool in the shed’ former CEO. No lie, Dennis, SO many of your comments have – literally – made me bust out loud laughing over the years), Art stated that the DOE will be exerting efforts to bring the cost of oil recovery down to the ~$25/bbl range.
I have no idea of how that might be accomplished (or if it’s even possible), but more effective EOR seems like a logical pathway.
Think, Dennis. You are a bright guy. Take the inverse approach from your $10/mmbtu versus $2/mmbtu paradigm as it impacts economically recoverable natgas.
What would the potential recoverable impact be if recoverable costs dropped to one half, one third today’s structure?
That’s right … enormous expansion of economically viable hydrocarbon reserves.
Again, like you, I do not know what the future may bring.
However, I am a fervent advocate of mimicking the ancient Greeks in regards to perceiving the passage of time and weighing future probabilities. These guys would customarily look backwards – as in seeing the wake of a boat – by which they might best glimpse future destinations. So too the astonishing advancements in the ‘Shale Revolution’ (now spreading worldwide) indicate a greatly reduced cost of doing business.
This is my expectation.
Coffeeguyzz,
If costs go down, more will be profitable to produce. I will believe the $25/b cost for tight oil when I see it. In the mean time this sounds a bit like the claims that the Bakken/Three Forks would recover 30 Gb, you probably still believe that one as well.
What I see are diminishing returns on technological progress in tight oil and shale gas and bringing down cost. EOR is indeed a possibility for increased output, but nothing is free, it will require higher not lower cost to make this a reality as has always been the case historically.
Chris Wright, 2023, ‘There is no climate crisis’.
Three main possibilities here. Unintelligent, unaware, or untruthful.
MechE BS and EE MS from MIT. Not likely to be unintelligent. I suppose the latter two are both possible, but again the old Upton Sinclair quote points to what is most likely.
Art too. His blog often contains data that is at least tough to confirm. Other times it appears to mis-represent current reality, such as out-of-date costs for tech he is bashing. But it helps tell his story.
D C, Coffeeguzz, T Hill,
THe AB price demand was distorted by government manipulation in the New England next door. They would rather use Russian LNG and $8 average NG all year long, and along with solar panels made in China in Buffalo City, Maine and Boston, warming up big mansions on Long Island with bunker fuel. All these illogic policies are driving up inflation, and driving out industries, and worse climate changes.
Also, the grow or plateau in AB gas is held up by the liquid rich production in WV, SWPA, some of the Marcellus wells in WV could produce enough liquid that it easily outpace the cost due to shallow depth, i.e. the drilling 5miles in 5 days, and even more cost saving is the completion — more stages in a shallow depth really saves a lot in completion. These wells generally also pulled down the gas production, so 2.6BCF in first 7 months .
Also, for the Bakken URR, I still want to ask why they have not drilled the upper and lower Bakken shale yet? Bakken is the fake start of shale oil revolution?
T Hill,
My wild guess is that Koch Industry, the 2 MIT brothers are behind Trump and Wright. Art has been faking data lately, probably after Novi stopped the free service.
Sheng Wu,
New York State is holding up the permitting of new natural gas pipelines, I would think there might be a commerce clause law suit that could be filed by a New England State, but I am not a lawyer. Pennsylvania could also try to connect to pipelines that flow to the Gulf Coast and the LNG facilities there or to LNG facilities at Cove Point in Maryland.
Note that the Novi data is Pennsylvannia Appalachian only see
https://novilabs.com/blog/pennsylvania-update-through-march-2023/
Completion rate has been pretty steady from 2021 to 2024 at about 900 Appalachian wells per month (according to EIA), Novi has about 500 horizontal shale wells being completed in PA in 2021 and 2022, if both estimates are correct this would suggest about 400 wells completed in Ohio and W Virginia combined in these 2 years. There certainly does not seem to be a big increase in average new well productivity since 2021 as output has been fairly flat with a constant completion rate. So I doubt there has been a large increase in PA Appalachian Basin average new well EUR. The average new well EUR for 1122 wells which started producing in 2020 and 2021 in PA Appalachian shale gas basins was about 4 BCF cumulative at 12 months. The Tioga county wells may be a sweet spot where the wells tend to be very good, perhaps 50% better than the average well (6 BCF/4 BCF=1.5.)
DC – cove point is already full subscribed. There was talking of another train being added but was not seen as economically feasible in the current economic situation.
There is also a problem in getting gas from the NE down to the Gulf Coast. Dominion energy had their ACP to free up gas stranded in this region and get it to the SE but regulatory problems caused them to abandon the project mid-construction at a huge loss.
D C, Dan and Hickory,
Coffeeguyzz has simply provided a single, specific real world example of the immense undeveloped nat gas resource in the lower 48. Just a single Unit has produced this immense volume. You are dismissing it without realizing that there are thousands of more undeveloped Unit locations like this one on millions of acres in various proven nat gas shale plays in the Marcellus, Eagleford, deep Bossier, Haynesville, etc. Then there’s the still yet to be discovered acreage out there…. This isn’t cherry picking, y’all are just not aware of the details here.
We will be burning plenty of USA nat gas for a long, long time. And exporting. Whether nat gas is at $2.00 or $10.00/mcf, the average American won’t know the difference and gas turbines will still be spinning. And wind and solar will also have their place for many years to come too. Of course, someday, humans will innovate their way into a new source of energy and feedstock that we haven’t even conceptually discovered yet. But that’s a debate for my kids to have.
Sometimes, I think this gang on POB wants the nat gas industry to fail completely for their own political agenda. There’s a lot of “talk it down” anti produce gas strategy here at POB. I myself cranked up my gas fired oven and grill tonight for a great dinner!
As always, though, many thanks for the data processing and presentation.
So start a blog called “PeakNaturalGasPipeLine.com”
Paul – You actually have a point, may be time to have three posts:
Oil
Gas
Misc
Yea, they always come up with fallacious arguments — in this case, there is no peak oil because natural gas is exchangeable with crude oil. Well, perhaps water is exchangeable with natural gas since one can always crack the water to extract the hydrogen and replace the NG with H2 gas. So apparently there is no peak NG either.
Gungagalonga,
You seem to not understand what cherry picking means. When one cites output from 4 wells out of roughly 12000 Marcellus wells, the average 2020 and 2021 Marcellus wells had about 6.3 BCF cumulative output over the first 24 months. So the 10 BCF per well numbers cited by Coffeeguyzz (over 7 months) is not representative, the average 2020-2021 well (about 1122 of these in the Marcellus that started producing in 2020 or 2021) had average cumulative output of 2.6 BCF, about 4 times lower than the wells cited by Coffeeguyzz.
Here is what Marcellus output might look like. Not really so “Mighty”. URR about 214 TCF. Cumulative production through Dec 2024 for Marcellus was about 92 TCF. The half way point to URR, 50% cumulative output is reached in 2026 for this scenario.
Dennis,
From your above post …
1.) ” … the average 2020 and 2021 Marcellus wells had about 6.3 BCF cumulative output over the first 24 months”.
2.) ” … the average 2020-2021 well (about 1122 of these in these in the Marcellus that started producing in 2020 or 2021) had average cumulative output of 2.6 BCF …”.
Now, I readily acknowledge that I am not the sharpest tool in the shed, but those statements seem contradictory.
Dennis, can you appreciate just what over 6 Billion cubic feet produced in the first 24 months signifies? That is the energy equivalent of a million barrel plus oil well in just the first two years online! And – presumably, if I correctly understand what you are trying to convey – over 1,100 Marcellus wells have hit the 1,000,000 Boe mark … in 24 months.
My highlighting of the Indian Foot pad was absolutely NOT meant to be representative of the Mighty Marcelus’ operations.
Quite the opposite.
I picked THE highest daily producing well in Pennsylvania just to get a glimpse of some of the most recent goings on in the App Basin.
Lottsa natty in the AB.
Coffeeguyzz,
The 2.6 BCF cumulative was over the first 7 months (to compare with the wells you cited over 7 months) sorry this was unclear, the 6.3 BCF cumulative is over 24 months, I looked up the 7 month number to compare with the 4 well pad you cited, which is probably not representative of the average well. For the average 2022 Marcellus well (327 wells in sample, last Novilabs report was from May 2023) at 7 months the cumulative output average was 2.3 BCF vs 2.7 BCF at 7 months for the average 2022 Marcellus shale gas well.
https://public.tableau.com/shared/G4ZC9Z2SG?:toolbar=n&:display_count=n&:origin=viz_share_link&:embed=y
The point is a simple one, very few of the Marcellus wells produce as the 4 that you cherry picked, the average well in 2022 produced about 23% of the output of the 4 wells you cited (2.3 BCF vs 10 BCF).
Dennis,
You just used the figure of 3.6 Bcf cum 24 months when I believe your earlier posting had the correct number of 6.3 (1,000,000+ Boe).
As you seem to more and more be ‘correcting’ commentators whom you feel inaccurately misread your posts, I will – again – emphasize that the Indian Foot pad is not representative of average or typical Marcellus wells nor was it presented to be as such.
But, hey, you can continue to characterize it that way if you want.
Coffeguyzz,
Thanks for the correction, I mistyped. What does output from 4 wells tell us? I would say very little. A basin wide average is more interesting, though I don’t have that information for newer wells (in 2023 and 2024).
Coffeeguyzz,
There is a spread in well productivity. Out of 1100 wells the average well from 2020-2021 has output of 6.3 BCF over the first 24 months of production. Some wells will have less output and others will have more. The four wells that have average output of 10 BCF in the first 7 months are likely in the top 1% in terms of well productivity in the Marcellus.
Dennis,
Trying to average out AB wells can be a little dicey as there are no set, geometric (1 square mile, 2 square mile) leasing units like most of the rest of the US.
For example, a 4 well pad might have a 7,000 foot lateral, a 9,000 footer, a 12k and a 16k lateral all going off in different directions.
In addition, operators routinely choke back output in attempts to maximize profitability according to seasonal demands and – as always – pipeline takeaway availability.
Taking a slightly more macro view, Dennis, the viable acreage is actually expanding as the oil window in Ohio is just now being aggressively developed; the Northern Tier Utica is providing exceptionally productive Utica wells in Tioga county; next county to the west – Potter – lies dormant after Terry Pegula’s company proved out the Utica there with a couple of dozen successful wells; then you have operational events such as the just-announced Expand’s 4.7 mile lateral – drilled in under 5 days – in West Virginia.
Again, the amount of natgas in place is simply staggering.
Edit: Just quickly checking some new Tioga Utica wells (Bauer pad from Seneca) and 4 of the wells are clearly being choked at 24 MMcfd for 90 days and the 5th is bouncing around 18 MMcfd. Laterals might be different length, maximizing formation integrity might be playing a role, and/or pipes are just maxed out. An outside observer has difficulty understanding just what/why these production numbers are what they are.
Coffeeguyzz,
There are often differences in lateral lengths, I don’t have access the the detailed data well by well, often the increased productivity is simply a matter of longer lateral lengths, but there are many factors such as amount of proppant, frack fluid used, number of fracks per foot of lateral that are also a factor (along with other factors I am unaware of).
As far as acres expanding we will see what happens as the area is developed, lately Appalachia’s natural gas output has been pretty flat, but higher natural gas prices or more pipeline capacity to the Gulf Coast might change things.
Here is the EIA STEO forecast to 2026 for Appalachia’s wet natural gas
Coffeeguyzz,
Took a look at a Seneca well in Tioga, Utica formation API is 117-22190.
Cumulative output at 12 months was 5.8 BCF, well started producing in Feb 2024, no idea how representative this well is (picked at random from recent Seneca wells in Utica formation that had at least 12 months of output in Tioga county, PA), average output over first 364 days of output was 15.9 million cubic feet per day.
The average 2020 and 2021 wells had about 4 BCF cumulative output at 12 months, so this single well is significantly better that the 2020 and 2021 average well, my guess is that it is much better than average if the EIA estimates for completions and gas output are correct for Appalachian Basin.
Dennis,
That well – official name DCNR 007 Pad K 111 HU 52676 (on the pad with the same name) – is an outstanding representative well for many reasons.
There are 17 currently producing wells on that pad consisting of slightly older Uticas, some Marcellus, and 5 new Uticas.
The new 5 have 5.8, 6.1, 5.4, 5.2, and 4.8 Bcf cums.
The site that has all this easy-to-access info is Marcellusgas.org.
I need to go now but plan on fillng in with more details tonight.
These 17 wells’ production histories display much of what I have been describing vis a vis AB developments.
Coffeeguyzz,
It seems more likely these wells are considerably above average. I think the average well productivity may not have increased much since 2020, in fact in 2022 it seemed to drop a bit from the 2020-2021 average to 3.6 BCF cumulative at 12 months ( a drop of 10%.)
Dennis,
” … more likely these wells are considerably above average.”
Nope.
The only other recent Seneca Utica wells in Tioga county were the 7 wells on the Bauer pad.
At less than 4 months production, 6 of the 7 are already at ~2.5 Bcf and flowing on obviously restricted choke at ~23/25 MMcfd.
Probably all 6 will reach 5/6 Billion at the 12 month mark, matching or exceeding those DNCR wells.
The ‘laggard’ is at 1.8 Bcf and flowing ~18 MMcfd.
This is the new reality, Dennis … (over)abundance, not scarcity.
D C or Dennis,
The Bradford County wells were just an example of a current real world data moment. You are getting too technical with the cherry picking comment. The citing of the big well completions and the reference to the big acreage fairways remaining should have led you to the implied message that there are thousands of additional locations like this one that we know of. And completions have had a quantum leap performance improvement on trend the past 5 years. AKA… we are good on gas supply growth. This is starting to sound like Die Hard.
Also, these wells cited by CoffeeG. are 2024 vintage. The topic here is also tracking the insane completion results improvements from 2020 to now. So, what you are also missing is the velocity of change on the upside for completion results in the future. You cited production data from 4-5 years ago. Things have changed big time positively on completions since then.
DC, I appreciate your efforts here, but you don’t seem to accept micro data results as legitimate. However, these micro data results add up to the later macro data dumps that you copy and paste into your model.
Gungagalonga,
I would need to see average output data from new wells, Novilabs no longer provides free data as it once did. Note that the average output from 2022 wells was lower than the 2020 and 2021 average Marcellus well. I would need to see data from more than 4 wells to be convinced that average output has increased.
Chart below has Appalachia completions according to EIA, they have been steady in the 900 to 907 completions per year range from 2022 to 2024. Output increased a bit from 2022 to 2023 from 34.6 BCF/d to 35.51 BCF/d and increased very marginally in 2024 to 35.57 BCF/d. Perhaps there was a productivity increase in 2023 and 2024, but see chart in next comment, considering the relatively steady completion rate since 2020 (completions per year at 907, 888, 905, 907, 900 for 2020-2024) the flat output suggests little change in average well productivity.
Appalachia natural gas output from STEO.
D C.,
My observation on your dry gas Marcellus production chart above in yellow is that production was rising through late 2023… then 2024 saw nat gas prices collapse causing EQT, Expand (Chesapeake), Coterra and other big players to curtail production. So, the 2024 flattening suggests this is due to temporary voluntary production cuts. Will see if new data starts to show volumes increase in response to the current better price environment.
Gungagalonga,
The Marcellus output has been pretty flat since 2021.
From EIA see chart below.
I agree output could increase if we see an increase in completion rate from the 2020 to 2024 level of about 900 new wells completed per year. Higher natural gas prices may cause such an increase.
Thanks, but I see consistent growth thru the end 2023, ending with a new all-time high at ~27.5 BCFD in late 2023.
Looks like a ~10% rise in production from the beginning of 2021 at 25.0 BCFD to the end of 2023 at 27.5 BCFD.
2024 has been flat to down due to lower activity and significant curtailments of existing production.
My opinion anyway.
Thanks Gungagalonga,
If we use OLS to fit both an exponential and linear function for Marcellus data from Jan 2021 to Dec 2023, we find there was a 2.3% annual increase in Marcellus output over this period (using an exponential fit) or an annual increase of 0.598 BCF/d using a linear OLS fit to the same data.
I also agree low prices, was likely the reason for the drop in output in 2024.
For comparison I looked at Jan 2018 to Dec 2020 where the increase was 9.8% per year or an annual increase of 2.12 BCF/d. So you may see an increase, I do as well, compared to earlier it is a very slow increase. For exponential fits it is 2.3% vs 9.8% about 4.6 times lower. For linear fits it is 0.598 BCF/d vs 2.12 BCF/d, about 3.54 times lower.
US Dry Shale Gas Output from EIA
https://www.eia.gov/outlooks/steo/data/browser/#/?v=33&f=M&s=0&start=201211&end=202612&ctype=linechart&maptype=0&linechart=~SNGPRL48&map=
US L48 excluding GOM Marketed Natural Gas
https://www.eia.gov/outlooks/steo/data/browser/#/?v=15&f=M&s=0&start=201212&end=202502&map=&maptype=0&ctype=linechart&linechart=NGMP48NGOM
Note that more than 100% of the increases in output are from shale gas as conventional natural gas output has been decreasing over the period covered by the chart. Also not how much slower the rate of increase is from 2024 to 2026 compared to earlier periods. For example from July 2020 to July 2023 US wet natural gas increased at an annual rate of 5 BCF/d. Compare this to an average annual rate of increase of 1.25 BCF/d from Dec 2023 to Dec 2026 that is forecast by the EIA STEO (a rate that is about 4 times lower than the earlier period).
D C, you are plotting the “Shale natural gas production from Marcellus formation”, which implies dry gas, or does not include NGL and condensate?
My guess is that the production in Marcellus is transferring from dry gas heavy in NEPA to wet gas heavy in SWPA, WV. This is confirmed in the difference between your above plot “Marketed (wet) Natural Gas output ” by STEO and “Shale natural gas production from Marcellus formation” by EIA. The wet gas wells in SWPA and WV do not have the high gas but lots more liquid NGL. These wells thus bring down the average IP 12months gas production, but they are much shallower with lower cost to drill and complete and much better economics with lots of NGLs.
Sheng wu,
The plots from Novi labs are Pennsylvannia wells only, read the piece here, that is the only recent data I have (newest wells with 12 months of data completed in 2022). Yes my Marcellus Plot is dry gas and includes all states with Marcellus Formation shale gas output.
https://novilabs.com/blog/pennsylvania-update-through-march-2023/
Sheng Wu,
Looking at Marketed Natural Gas for PA, Ohio, and WV since Jan 2022 all of the increase in output has come from West Virginia. The chart below is monthly wet natural gas output in millions of cubic feet, data from link below.
https://www.eia.gov/dnav/ng/ng_prod_sum_a_EPG0_VGM_mmcf_m.htm
Coffee-
if Nat Gas was to be used for light transport it is about twice as efficient (mileage provided/btu) to combust the nat gas at a central plant and use the electricity to charge EV’s rather than for each vehicle to have an individual combustion engine.
There is probably a vehicle weight beyond which the equation reverses, perhaps for a towing rated pickup and larger.
Hickory,
I am too ignorant of the economic particulars to evaluate electric versus natgas vehicular transportation.
I do note that I save a ton of money by zipping around town on my electric scooter versus firing up my F 150.
As wary as I’ve become of ‘Advocacy Science’ – directed towards promoting/denigrating any ‘ideological’ stance – I find the Science of King Dollar to be a fairly solid indicator of future preferential choices made by most people.
If one pathway proves to be cheaper, that choice is apt to reign supreme.
Businesses will lead the charge as their very survival depends on being more efficient/economical than their competitors.
Dennis
I do not make numbers up, what I do is read information from other sources other than, one robotic government department.
https://www.lloydslist.com/LL1151538/Fake-origin-certificates-disguising-Russian-oil-OFSI-warns
This is not made up, these studies and information are conducted by people who have immediate evidence of what is happening day to day.
The auditors in Nigeria have no political angle, they studiously gathered data of the extent of sheet of oil before it gets counted. You can’t even be bothered to read the report.
Since the Ukraine invasion the amount of oil being sold secretly has increased several fold.
You can ignore all these professionals giving us various information if you want, again your dismissal of all this data just shows you have no idea what goes on in the oil industries of countries that are corrupt and totally lacking in the type of social structures in America.
https://www.voanews.com/a/official-iran-smuggles-5-to-6-million-liters-of-oil-into-pakistan-daily/7730958.html
People (unlike yourself) who have actually worked in countries like Iraq, Nigeria, Venezuela, Libya have said figures on production and theft are guesswork.
Loadsofoil,
The numbers are not perfect, but there are many agencies, oil companies etc that have access to proprietary data, that I do not, they have professionals that have worked in all these countries and I have read many of the links you have thrown out and yes they are guesswork and much of the information is included in the data reported from the EIA, IEA, OPEC, Energy Institute as well as in reports by Major Oil companies.
You on the other hand make pretty simple mistakes such as not accounting for changes in the number of members in OPEC (14 members in 2016, only 12 members in 2025).
Dennis
Just the other day you agreed with Hickory that global data could be 2/3 mmb/d out.
So make up your mind.
I did remember about Angola, that is why I said 3 to 4 and not 5.3.
What I don’t do is consider my predictions so precious as to discount hundreds of reports that build up a very disturbing picture of the corruption that distorts what you consider reliable data.
Loadsofoil,
Read carefully, I believe the refinery input data might be off by 2 to 3 Mb/d (range from high or low, no idea whether estimates are too high or too low). Let’s call it 2.5 Mb/d for the range and assume the current estimate is in the middle of the range, if currently the estimate is 83 Mb/d we would have a demand estimate of 83 plus or minus 1.25 Mb/d.
This is distinct from oil output estimates which might be better (or not). Those could also be imprecise by a similar amount or perhaps Ovi’s estimate of plus or minus 500 kb/d is correct (not clear if I have interpreted Ovi’s comment correctly). From 2000 to 2023 the average difference between the Energy Institute and EIA C plus C estimates for the World was about 1000 kb/d. If we assume the correct estimate is between these two estimates this suggests a range of 1000 kb/d, recent estimates have been closer at roughly 700 kb/d between the estimates in 2023.
Well you said you would go with 32 Mb/d, when OPEC says about 31 in 2016 and Iran and Venezuela’s capacity with sanctions has decreased by about 2100 kb/d since 2016 so your spare capacity estimate seems high to me, my guess remains about 2.5 Mb/d which is not very far from your estimate of 3 Mb/d, 4 Mb/d seems a stretch. My estimate may prove to be too conservative as has often been the case in the past, perhaps in the end you will be correct at about 3.5 Mb/d. I have given the basis for my estimate and the underlying assumptions, those assumptions might be wrong.
Dennis
What information do you have to base your assumptions on?
What experience on the ground does Ovi have in Venezuela, Nigeria, Iraq or Libya?
I have read reports written by people who have direct experience in these countries and the figures are massive the theft occurs at all points of the production system.
https://www.spglobal.com/commodity-insights/en/news-research/latest-news/refined-products/102424-gulf-of-guinea-emerges-as-latest-shadow-tanker-fleet-hotspot-for-iranian-venezuelan-activity
Words like impossible to know, ships recorded as sunk seen near known ship to ship transfer areas.
Do you have data released by Russian ministry of energy as to how much oil they put through their refineries. As far as I know Putin has made these figures state secrets.
Russia puts out figures they want and the EIA has no alternative but to take those figures because they don’t have spies monitoring the thousands of wells in Russia.
The dark fleet has tripled since the Ukraine invasion, reasonable to assume the shipments of illegal fuel has increased by the same amount.
That puts global oil production probably 2 million barrels per day more than official figures. No one knows.
Loadsofoil,
I agree noone knows, so we could make no estimate at all, we could use the reported data (which likely uses information from proprietary databases which account for fraud, dark fleet, etc from people who are on the ground in these various corrupt nations) or we could add or subtract an arbitrary number from the reported data by agencies like the EIA, IEA, Energy Institute or OPEC.
I have often pointed out that the production numbers are independent of the shipping fleet. Output gets measured at the wellhead before being moved to ships. The purpose of the dark fleet is to hide where the oil originated, it does not change the amount produced. You seem to have difficulty understanding this.
Output of crude plus condensate is an estimate which gets revised over time as more information is collected. For 2023 World C plus C was 81963 kb/d as estimated by the EIA and was 82636 kb/d as estimated by the Energy Institute. The average was 82300 kb/d plus or minus 337 kb/d. For the period from 2010 to 2023 the average difference between the estimates was 755 kb/d, half of this is about 378 kb/d. EIA may be around 81790 kb/d for 2024 (the December estimate is not available yet, my estimate assumes December is 42 kb/d higher than November based on trend of monthly EIA data from 2022 to 2024). If the difference of the two estimates is around 378 kb/d, this suggests about 82170 kb/d for 2024 output, a bit less than 2023.
I only have access to publicly available data, but there are many expensive proprietary databases which no doubt the EIA, IEA, OPEC, and Energy Institute have access to. I have access to the OPEC MOMR reports, OPEC ASB, and Energy Institute data, that is the basis for refinery throughput data which I use as a proxy for C plus C demand. There is some crude burned directly in power plants in some OPEC nations which may account for some of the difference in World supply of crude and World refinery throughput data. Generally there is less data available on refinery throughput (for example this is not reported at the World level by the EIA).
The absolute number is just a number. If illicit or illegal oil has always been around — an invariant IOW — that means it’s just a baseline shift. A similar approximation occurs in climate science. No one discusses the absolute global temperature, but only anomalies in the temperature from the average. The baseline is not as important has how fast the number is changing.
Yes, it would be nice to know everything but you deal with the data you have. If OTOH, this illegal number is increasing over time, the analysis would be more pessimistic, as reserves would be accounted the same but actual depletion rates would be increasing compared to the “official” production data.
Loadsofoil,
Can you point us to a reliable source that shows how much of this extra oil is produced each year for the World as a whole from 1973 to 2023?
If not we have anecdotes for a few nations at different points in time. You seem to think nobody is aware of this except you. I think those who compile the data are aware and have included this in their estimates to the best of their ability.
Loadsofoil,
The Pakistan piece is refined fuel smuggling, also note that 6 million liters per day sounds like a lot but it is about 37 kb/d. Yes smuggling happens, sometimes the oil is purchased legally by a smuggler in Iran where prices are very low and smuggled to Pakistan where prices are higher and the smuggler pockets the difference. Consumption numbers are based on output from refineries, and production of crude is measured at the wellhead.
The Falling EROI of U.S. Oil Clearly Seen by the Massive Debt Increase
When U.S. conventional oil production was being ramped up after WW2, there wasn’t much growth in Public debt. From 1946-1960, U.S. public debt increase a paltry $17 billion. Furthermore, from 1961-1970, U.S. public debt grew an additional $82 billion, or a total of $99 billion for 24 years, representing a 37% increase in debt or 1.5% per year.
That all changed in the 1970s when U.S. conventional oil production peaked as the U.S. Economy imported more oil until the Shale Oil Bonanza started.
However, even with adding 8+ Mb/d of Shale Oil, the U.S. Public Debt still exploded higher.
The Falling EROI of Unconventional Oil only works with a massive increase in debt.
steve
Steve,
Public debt is a matter of fiscal policy more than EROEI in my view. Also Debt to income is the relevant metric. Just as when a bank decides to lend.
Also there looks to be very little correlation in that chart between change in oil output and change in public debt. The R squared is 0.35 and suggests debt increases as oil output increases, which is counterintuitive. I left off the 2021-2030 estimate which is speculative.
I tend to agree with Steve. Public debt is just another form of drawdown. That is a way of borrowing from our children and grandchildren. We are doing the same thing with all our natural resources. We are using oil, gas, coal, and arable land that will not be available to them.
We are Homo colossus, living in the dying days of the age of exuberance.
I know you meant “colossus,” (per Catton) but, yeah, we’re pretty “callus”, too ;->
Corrected it. Thanks.
We are Homo colossus, living in the dying days of the age of exuberance.
Ron… Nah, we will innovate, adapt and figure it out. As humans always have.
Gung wrote: Nah, we will innovate, adapt and figure it out. As humans always have.
No, that’s where you are dead wrong. Humans have not always innovated and figured it out.:
Throughout history, human populations have experienced collapses, often due to environmental factors, resource depletion, societal issues, or disease, leading to societal decline and population shifts.
Here’s a closer look at some examples:
Ancient Civilizations:
Late Bronze Age Collapse: Around 1200 BCE, a period of widespread societal disruption and collapse occurred in the Near East, Greece, and Anatolia, potentially linked to climate change, resource scarcity, and warfare.
Indus Valley Civilization: Around 1900 BCE, the Indus Valley civilization, also known as the Harappan civilization, experienced a decline and abandonment of its cities, potentially due to climate change, resource overexploitation, and social unrest.
The Akkadian Empire: The Akkadian Empire, in Mesopotamia, experienced a collapse around 2200 BCE, potentially due to climate change, resource scarcity, and political instability.
The Classic Maya Collapse: The Classic Maya civilization in Mesoamerica experienced a decline and abandonment of its cities between 800 and 900 CE, likely due to a combination of environmental factors, political instability, and warfare.
The Roman Empire: The Western Roman Empire experienced a gradual decline and collapse starting in the 3rd century CE, due to a combination of internal and external factors, including political instability, economic problems, and invasions.
And there are many others. Get your head out of the sand Gung. It can happen.
Ron, even with all those negative moments you referenced happening… yet we humans are still here and thriving on earth. We are still growing population, technology, culture, etc….
I am sitting here having a nice glass of pinot noir responding to you with my technology even though all those negative human events happened as you cited,
Did those negative human events even count as speed bumps in human development?
Ron, my head is way out of the sand enjoying this nice glass of vino.
+1
Dennis,
While energy analysts, including Art Berman, tend to separate the Massive Increase in Debt from the Falling EROI of the Energy Industry, this is certainly illogical.
A perfect example is a Home Mortgage of $400,000 on a $500,000 New Home. That Debt, not including the massive interest expense (another cost above the value of the home), was paid forward to construct the home, and all components such as Heating-Cooling & Appliances.
That Mortgage pulled forward the energy to construct the home which would be paid back over a 30-year period. However, to pay back that home, the Homeowner would have to work 30 years burning an even greater amount of energy to not only pay back the Energy Amount (In Dollar Terms) to build the house, but to also pay nearly the double the amount in total interest expense.
Then of course, we have to add all the maintenance of the home in energy cost.
Thus, without the Massive Debt Increase, the ability to ramp up Shale Oil would not have been possible because the Debt was a major factor that PAID IT FORWARD.
steve
I don’t understand how this makes sense.
Energy is constant. A joule is a joule. Doing the math for EROI has internally consistent units.
For the argument that money is a direct proxy for energy, you’d have to show that this holds true in many cases. For example, why US dollars only? Can you show that this supposed relationship is uniformly true across all currencies? When country ‘A’ experiences a few years of hyperinflation, does that mean that energy is somehow proportionally less available? Then to make your argument about public debt, you’d have to show correlation between various levels of government public debt and energy production. Nah, lot’s of other variables in public debt.
However, the other direction makes more sense. As Steve Keen observes, ‘labor without energy is a corpse and capital without energy is sculpture’.
Capital is created by banks via loans. Capital is destroyed when borrowers payback capital or are unable to payback capital and default.
If you’re a business. You buy products and sell them for more than you paid for them, maybe add value. You marked them up in price because you have cost. You have employees. Even if your business is a service. You have costs so you must markup what you charge for your service.
The whole idea of profit is based on more money being borrowed through expansion of the money supply via loans created by commercial banks.
If you have savings great. It means you were able acquire some of the capital that was lent into existence. Through your work. But the fact that you were able to save takes existing money and puts it on the sidelines, even if it’s invested it’s still on the sidelines. Unable to be used to repay debts elsewhere. Which means banks have to make even more loans to keep the debts payable.
All the retirement funds in the stock markets represent savings taken out of the economy via retirement accounts passively every month. Money that can’t be used to repay debts. And the only way it grows is through the expansion of credit.
Credit is very much like a light switch. It’s either on and flowing or it’s off and not flowing.
When the light switch gets turned off the first thing you’ll hear out of the politicians and central bankers is we didn’t see it coming. And they aren’t lying. Since they have nothing to do with money and the flow of credit.
I should be clear though. US stocks will likely make new all time highs later this year. And it’s not because things are good. Things are bad. Very bad and that means government and central bank stimulus on the way. And people will respond to that the way they have been trained to which is buy stocks.
With corporate buybacks returning after their end of quarter blackout period and the CTA’s all out of their long positions. It’s a recipe for a major short squeeze sending stocks back to all time highs regardless of the shit show coming out of Washington otherwise known as government policy.
Also means the yen carry trade will be back on chasing stocks higher.
Confusing public debt with debt is just Reagan era Republican propaganda. Brought to you by the same geniuses who claimed that cutting taxes would balance the budget and then went on to double the deficit.
It’s amazing how completely Americans have bought into it.
A whole new belief system: https://wentworthreport.com/the-uranium-hydrogen-carbon-energy-system-of-the-future/
David,
You are a brave man to have posted this on POB. I have read it though and there is not much dispute, other than I think you are a little optimistic on the production of hydrogen by electrolysis. 1 tonne of hydrogen would require 52 MWh of electrical power, making it very expensive indeed. Electrolysers are a bit like nuclear,; they have a small operating turn down-up range. Electrolysers have not been proven at scale, yet, and then there is the question of which technology (Alkaline, PEM or SOE). Another consideration is the supply of demin water.
I am looking in detail into the de-carbonisation of the European chemical industry and oil refining. One report by Nexant/ Accenture suggests a cost of $1 trillion. I do not dispute this figure and it could well run into even higher costs. It means that the EU chemical industry is finished. No company is going to invest in the EU chemical industry with untried and untested technologies, which include:
Bio feedstocks
Green Hydrogen
Carbon Capture
Carbon recycling
and of course low cost renewable energy, only made possible by the use of carbon intensive production technologies, which fail in terms of cost.
Carnot, it is the hand we have been dealt. One day the carbon sources from the ground will run out. Our standard of living will be determined by the cost of power from nuclear reactors. And that day is coming faster than most people think. Unless nuclear expands as fast as the oil supply decline, the consumption rate of coal will double and what were 200 years worth of reserves will become 100 years worth. There are babies being born today who will see the end of coal, perhaps. Places like Belgium and France mined out their coal back in the 1960s.
With respect to cost, I am told that $0.05/kWh equates to a hydrogen price of $7/kg. That only seems expensive compared to the installed base of steam reformers and the natural gas price. In terms of energy content, it equates to a diesel price of perhaps $2.20 per litre which is about $9 per US gallon. On the other hand, hybrids get 20 km to the litre so that might be $0.20 per km. Again, it is the hand we have been dealt and we should be thankful we have it all.
With respect to electrolysers, I am told by someone who advises on these sort of projects that they can now be turned down to 25% of rated capacity without impacting efficiency. It’s alkaline. I will check.
Hubbert, back in 1956, spoke of Civilisation’s ‘margin of safety’. That was 70 years ago. We are running out of time to get things right. Carnot, for your interest, I wrote up the F-47: https://wentworthreport.com/the-f-47/
This year will see the highest increase in oil supply in a decade
https://oilprice.com/Energy/Crude-Oil/New-Oil-Projects-Set-to-Flood-Market-in-2025.html
If correct we will see a new peak later this year or early next year
Loadsofoil,
Excerpt from article you linked:
This year will see the highest amount of new oil supply in a decade, according to data analyzed by Raymond James that showed projected global additions of nearly 3 million barrels daily.
But only if the price is right.
It is far from clear that the price will be right, since 2022 Brent futures prices have mostly been flat to down, it doesn’t look like much will change based on the forecasts I see.
Loadsofoil
So in this quote below, Bloomberg says that new output last year was 800 kb/d. Click on the link below, which links to the last World report, and check World production from January 2023 to January 2025. Where is the 800 kb/d increase? Production is flat. Does that imply that decline is in the order of 800 kb/d?
Last year, new oil output additions came in at 800,000 barrels daily, per data cited by Bloomberg in its Raymond James report. In this context, this year’s expected output additions look even more impressive—and they also beg the question of why it is necessary to boost production at all if demand is indeed so much weaker than before. The answer was recently provided by none other than the head of the International Energy Agency, Fatih Birol.
At CERAWeek, Birol said that the world needs upstream investments in existing oil and gas fields to support global energy security. Many saw these remarks as a stark departure from his usual refrain over the past few years, which has focused on the perceived success of the energy transition that would eliminate the need for hydrocarbons pretty soon. Indeed, that’s exactly what they were.
https://peakoilbarrel.com/november-non-opec-and-world-oil-production-rose/#more-54224
Ovi
Another company that says there is large surplus of oil.
https://oilprice.com/Latest-Energy-News/World-News/Biggest-Indian-Oil-Producer-Seeks-to-Diversify-to-Withstand-Supply-Glut.html
This Indian company can’t compete with illegal oil from Iran.
Why do you think India and China have much higher GDP growth than the rest of the world.
The grey fleet and dark fleet have increased by over 100% since 2018. They are not transporting tulips as Dennis thinks.
Most people know that cheap energy helps propel GDP growth estimates by people researching the illegal trade estimate an increase of over a million barrels per day since 2020.
Note that Iran is not mentioned in the piece, only that there is a supply glut. As the oil is produced it is accounted for, how it is shipped I don’t try to track, no doubt some of it is shipped on the dark fleet to try to avoid sanctions. This is to be expected.
Loadsofoil
Let’s distinguish between “Last year, new oil output additions came in at 800,000 barrels daily” and “Daily surplus production”.
With regard to daily surplus production, you have to look at the price for WTI or Brent to get a clue of where the demand/supply situation stands. There could be a small surplus of 100 kb/d because the price of WTI is off its highs. However it is now off its lows and climbing very slowly. This is typical of what happens as the northern hemisphere moves from winter to summer. Demand is picking up and now demand/supply may be in balance. When it crosses 70/b, it will indicate the demand is picking up.
The more they look the more they find.
https://www.bloomberg.com/graphics/2024-iran-south-china-sea-oil-trade/?embedded-checkout=true
I wonder how much oil China and India is really using?
Why should countries buy at $70 when they can buy it at $60
Loads of oil,
This does not change either output at the well or input at the refinery at the World level.
Dennis
You have no idea what Iran produces. You have no idea how much illegal oil is taken by the Chinese dictatorship. Dictatorships by their very nature are ruthless and secretive.
India is a highly corrupt country only a naive person would believe data they produce
https://www.ganintegrity.com/country-profiles/india/
You think double the number of tankers running dark are doing what?
You are a one trick pony, repeating the same neat little graphs again and again is not real.
On the borders between Iran and Iraq and Pakistan where lines of trucks smuggle oil which by definition is not officially recorded. This is the reality of a criminal and corrupt world.
The grey and dark tanker fleet which has increased 100% and take oil from Venezuela, Iran and Russia
Is reality.
https://www.atlanticcouncil.org/in-depth-research-reports/issue-brief/russias-growing-dark-fleet-risks-for-the-global-maritime-order/
Best estimate is hidden oil amounts to over 4 million barrels per day, could be as high as 6, as this fleet represents up to 20% of wet cargo fleet.
Loadsofoil,
You are making stuff up again. Point to a reliable source that says production or consumption of crude plus condensate is 4 to 6 million barrels per day. The purpose of the dark fleet is to hide where the oil is being imported from so that Russia, Iran and Venezuela can sell the oil that is being sanctioned. So basically you seem to be saying that Russia, Iran, and Venezuela are producing as much as 6 million barrels per day more than is reported by the EIA. In 2023 these three nations produced 14.7 Mb/d, at their peak in 2017 they produced 17 Mb/d. All three are part of OPEC plus and are watched very closely by other members, even though two of these nations are not subject to quotas their production of crude oil is followed very closely. They are also followed very closely by the US EIA because the US has imposed the sanctions (in the case of Russia in cooperation with the EU).
Can you point us to data on your 20% estimate of wet cargo fleet? Is that by volume? You make a lot of claims, but provide very little to back them up. Dark and gray fleet is about 400 of 2000 crude oil tankers Worldwide, but crude oil carriers range from 45 DWT to 550 DWT so we don’t know what it is by volume.
The article you linked focuses on Russia and notes the shadow fleet has expanded greatly since 2022 due to sanctions on Russia.
Russia reportedly produced about 9000 kb/d of crude in Feb 2025 according to OPEC, are you claiming that they are producing 3 to 4 Mb/d more than this? You think OPEC wouldn’t know?
The basic point is that this “hidden oil” is not really hidden, the tankers can be seen loading oil (that has been produced) and unloading oil (that is sent to the refinery).
The number of times it is transferred from one ship to another to hide where the oil is produced does not change the amount produced or the amount that is refined.
Thank you for infusing some reality.
Dennis
Do you know who Windward is?
When they state that tracking these tankers and the amount of oil transferred is very difficult why do you think they are lying?
You think tracking these criminal shipments is so easy. Tell us the last tanker that left Russia and how much oil was it carrying?
Loads of oil,
I agree it is difficult to track every tanker on the ocean, there are only so many ports capable of loading and unloading the oil to land where the oil is refined and where most of it is produced, especially for the major producing nations subject to sanctions (Russia, Iran, and Venezuela). So it does not change the supply (production) or demand (refinery crude throughput) for crude plus condensate. It simply obscures the data on exports and imports by nation in terms of where the imports and exports are coming from.
I don’t track individual ships, but feel free to do so, it does not change the supply and demand at the World level.
Regarding transshipments of oil via the ghost fleet, a larger question is why this had been allowed to morph into a burgeoning industry. Clearly it’s because of sanctions which have largely failed. It’s widely understood that both Iran and Russia are under such sanctions, and that each country moves a lot of oil via transshipment. This was imposed on Iran in order to slow down their uranium enrichment process and Russia in order to thwart their war effort against neighboring Ukraine. China and India get a 20% discount on that bootlegged oil, which is a pretty good deal for them. All in all, it’s silly to impose sanctions and then do absolutely nothing about enforcing them. One wonders if this hasn’t been allowed to go on for so long as a dragging anchor to global oil prices.
Gerry,
This might be a way that tariffs might be used, if in fact most of the sanctioned oil can be tracked to specific nations that are importing that oil, across the board tariffs could be levied on those nations until they cease. Not sure this approach is feasible. If we think most of the Russian, Iranian, and Venezuelan oil is going to China and India we could slap tariffs on just those two nations. Difficult to track the oil so may be unworkable.
In general I agree the sanctions don’t work well.
Dennis
You just said tracking these tankers is easy.
As Ron has said before you flip flop so much it is impossible to pin down what you believe.
Loads of oil,
No I did not say tracking the ships is easy, it is easy to see the ships loading oil at port and unloading the oil back to land so that it can be refined. Reread my comment ( reproduced below).
The basic point is that this “hidden oil” is not really hidden, the tankers can be seen loading oil (that has been produced) and unloading oil (that is sent to the refinery).
The number of times it is transferred from one ship to another to hide where the oil is produced does not change the amount produced or the amount that is refined.
The point I am trying to make is that the ship to ship transfers done on the ocean to the dark or gray fleet does not change the total amount of oil that is produced or refined. Eventually someone watching the unloading terminals that feed the refineries sees all the oil input into refineries. Production of oil is measured at the wellhead is unaffected by efforts to avoid sanctions.
Simple example, produce 500 tonnes of oil and transfer to a VLCC and then transfer that oil to 10 smaller 50 tonne vessels and send them to 10 different refineries to obscure where the oil has been produced, assume for simplicity that no oil is spilled in the transfer process. Has anything changed in the total World production or consumption of crude oil vs the 500 tonnes of oil going straight from a single loading terminal to a single unloading terminal? The only difference is the first process creates more risk for oil spills and the transport of the crude will be less efficient and more costly in energy terms (the large tankers are more efficient and lower cost which is why they exist).
In my view you are very worried about something that is not that important in terms of World Supply and Demand for Oil.
I will stop trying to convince you.
One thing I am sure 100 additional tankers are not carrying carrots
So JD is worried about a spike in oil prices.
Joe Terranova, who is a big Trump backer has said on both Bloomberg and CNBC this week that they need sub $60 WTI sustained to support/pay for their tax cuts.
Trump and his minions sure like to stab their most ardent supporters in the back.
Vis a vis Shallow Sand’s comments above, Doomberg Substack ran this interesting thought experiment about NG becoming the coveted portion of the hydrocarbon stream in the shale oil basins, with oil being a much less valuable portion–just the reverse of the case for years. They didn’t think it through, as they based most everything on the increasing GOR for horizontal well life cycles in the Permian and other shale oil basins (past the bubble point which means the well is approaching its final descent). There is a little bit to their reasoning, however, as the wells to the fringes–tier-2,3,4–start out with a much higher GOR.
In point of fact, while most of their scenario is flawed, switching the emphasis could be germane. I recall natural gas levels above $10. Then the Barnett and Haynesville revved up. I suppose we could see very high NG prices to feed the data centers and AI and sub-par oil prices to satisfy the promised low price at the pump rhetoric.
Gerry,
It is not clear that there will be a lot of demand for natural gas at $10/MCF, even at $4/MCF the EIA expects demand for natural Gas for electric power in the US will drop. Chart below has Henry Hub Spot price centered 12 month average since 2000.
I agree, and don’t want $10 NG. With an adequate pipeline system we should have cheap domestic NG for many years. But unless the rules change, a large proportion is going to be sold overseas.
I read the Doomberg thing on Mike Shellman’s blog and also his thoughtful dissection. A lot of the argument against their article would obviously be that they based a lot of their speculation on the oil & gas curves of aging wells. This paid no heed to the fact that the span within which those wells produce a high GOR past the bubble point is actually pretty narrow.
BUT, the new wells coming online, many of them drilled in tier 2,3 acreage, are more interesting. They are coming online with higher than average GOR in many cases. There the Doomberg concept might have a point.
Your graph showing Henry Hub prices exemplifies a giant energy pricing dichotomy. Most of the Permian doesn’t drain into the Sabine Pass Pipeline system that terminates at the Henry Hub. Most of the Permian drains into other hubs, specifically, the WaHa. Why is this important? Because the Henry Hub is in Erath, Louisiana on the Gulf Coast close to LNG trains for export. The most prolific part of the Permian drains into the WaHa, way up in Pecos, a long way from the water. As such, eternally glutted, the WaHa price for natural gas of the same quality is about a buck fifty lower than the price at the Henry Hub (the one used for NYMEX futures).
New wells with a high IP GOR won’t pencil out using $60 WTI and $1.50 NG. But they would if the price of WTI were kept low (to keep down prices of road and aviation fuel at the pump), but the price of NG were to rise to $5. If they wish to keep the treadmill going and also bring down the price of WTI, then the price of NG has to rise fairly dramatically.
Gerry,
Not much of the tight oil will be produced if oil prices fall below $60/b, I understand that Permian gas prices tend to be lower especially for smaller producers (that often need to take the WAHA spot price) as pipeline capacity is constrained for natural gas in the Basin. Higher natural gas prices may help make oil profitable at a lower oil price. For the average Permian 2022 well with wellhead oil price at $60/bo and NG at $5/MCF and NGL at 35% of oil price the discounted net revenue over the life of the well is about 11.7 million, if the average well costs 12 million, it is a money loser. If the well cost (full cycle) is 12 million the well pays out in about 56 months, which is likely to barely make a profit, but not enough to make it worth the considerable risk.
Hello Gerry,
Waha has seen significant relief lately after the Matterhorn pipe went into service. Also, several other significant Permian takeaway pipes coming soon. All near LNG trains. So, Permian gas should have a decent and improving market now.
https://www.eia.gov/todayinenergy/detail.php?id=63044
Thanks, great to know. The Indian government has just announced that they will drop their import tax on LNG and will likely increase their take from $15B/year to $25B. This is a large amount of LNG. I suspect Europe and the UK will follow suit. I may be the only man bullish on NG in America but I am absolutely convinced our president wants subpar $60 oil and the only way to keep shale oil drilling going is to drive up the price of NG exports. The percentage of the total hydrocarbon stream in shale oil basins has risen, proportionately in energy units, from 30% to about 40%. Count liquids and it’s almost half. I say that in two years the NG–dry and liquids– sales revenue will constitute half the cash flow from shale oil wells.
Gerry,
At what price for Natural Gas does demand for US LNG start to decrease? Whatever that is will be the limit for Natural Gas price increases in the US. Also the US economy has become used to low natural gas prices, as natural gas prices rise in the US it might be a drag on economic activity. Chart below has inflation adjusted Henry Hub spot prices in 2024$ for centered 12 month average price.
CNBC-
“Oil executives issued scathing criticism of President Donald Trump’s policies in anonymous responses to a survey by the Federal Reserve Bank of Dallas…. The executives, shielded by anonymity, bluntly criticized Trump in their responses to a survey conducted by the Federal Reserve Bank of Dallas from March 12 to March 20.”
-“The administration’s chaos is a disaster for the commodity markets,” one executive said. ”
-“Uncertainty around everything has sharply risen during the past quarter,” another executive said. “Planning for new development is extremely difficult right now due to the uncertainty around steel-based products.”
-“The threat of $50 oil prices by the administration has caused our firm to reduce its 2025 and 2026 capital expenditures,”
-‘Drill, baby, drill’ does not work with $50 per barrel oil. Rigs will get dropped, employment in the oil industry will decrease, and U.S. oil production will decline as it did during COVID-19.”
https://www.cnbc.com/2025/03/27/oil-execs-slam-trumps-tariffs-and-drill-baby-drill-in-survey.html?__source=iosappshare%7Ccom.google.Gmail.ShareExtension
Thanks for posting this.
Now imagine if President Trump and his people called for $3 corn, arguing that US farmers could become efficient enough to make it work?
Global tanker fleet
https://public.axsmarine.com/blog/tanker-fleet-q3-24-recap-and-outlook
Global tanker fleet has increased by over 100 vessels in the last 5 years.
Demolitions are at the lowest level for 30 years, only 18 million tonnes demolished while over 80 million tonnes put in service.
100 vessels carrying millions of barrels per day of oil more than in 2018.
Only if these illegal vessels were seized and scrapped will we know how much oil is really being used.
Very interesting information in that link, thanks for sharing. Looks like they have quite a bit of detail about the numbers and capacities of the global tanker fleet, including what AXS dubs the shadow fleet.
I’m not entirely following your logic though. It looks like the expansion of this shadow fleet is largely serving to transport that portion of russian oil subject to the $60/b price cap (plus some cap on products). Isn’t a fair bit of this being purchased pretty openly by Chinese and Indian buyers?
Hi T Hill
The dark fleet operates beyond the law. They are not insured and turn off their AIS so they can’t be seen. Think of the Malaysian Airline that disappeared, all the radars systems did not know where it went.
They load with oil in Venezuela, Iran and Russia and then unseen transfer oil to another tanker.
China does not tell the U.S. how many barrels of illegal oil it imports. China is a ruthless dictatorship that is doing everything it can to gain advantage on countries it sees as enemies.
India is utterly corrupt, people in western countries cannot fathom the level of criminality that goes right up to the top of politics.
https://www.transparency.org/en/press/exporting-corruption-2022-enforcement-against-foreign-bribery-hits-historic-low
One tanker can carry a million barrels, there are now an additional 100 tankers than 5 years ago. They are carrying millions of barrels more than 2018. Probably about 4 million barrels per day more than any legal data records.
New posts are up
https://peakoilbarrel.com/short-term-energy-outlook-march-2025/
and
https://peakoilbarrel.com/open-thread-non-petroleum-march-27-2025/
In response to DC on LNG prices, there’s likely going to be a total disconnect between domestic NG and exported NG via LNG. Everyone wants to get their NG into an LNG train in order to enjoy the higher price; however, we’ve enjoyed fairly decent (~$4) prices in ND, due to high ethane percentages but also the proximity to the Midwest refineries, which are beginning to thin out their input blend. As to export LNG, there’s going to be a bifurcated price with it as well, as long as there are tariff discrepancies. The EU voted last year to impose LNG import fees (tariffs in the form of a carbon tax), and those will be negated by a higher price, until finally both sides decide to equalize or reciprocate their goods. We’re currently producing plenty of NG in the U.S. to supply our nation with inexpensive natural gas, and to export the rest at whatever the market will bear. I just saw where Germany had to revert to gas-fired utility plant electricity when the wind quit blowing. The NG (LNG) industry can’t afford to stand by as a backup without selling more on the open market to save whatever industrial complex is left in the EU and UK. I also saw where Modi and the Indian government will increase their LNG imports up from about $10B (U.S. dollars) to $25B, again in order to avoid inordinate and damaging tariffs. I am not sure I agree with tariffs but they didn’t ask me and this is a certain reaction and way of handling the real world we live in right now.