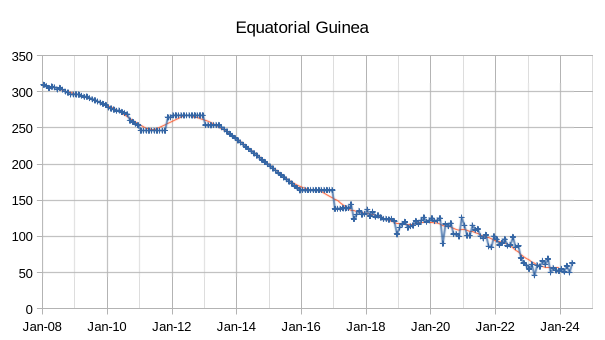
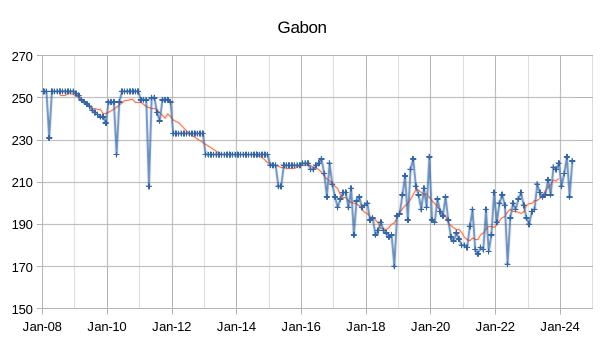
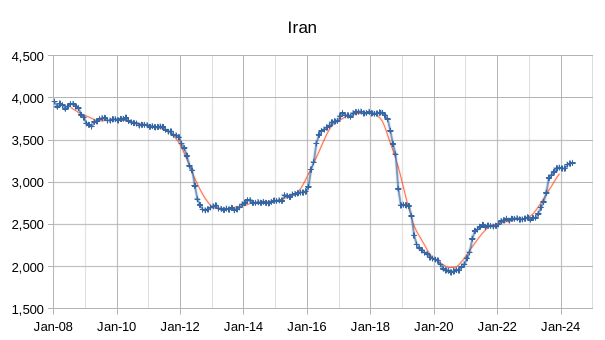
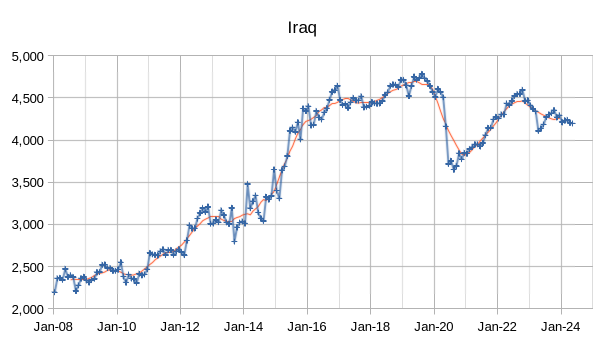
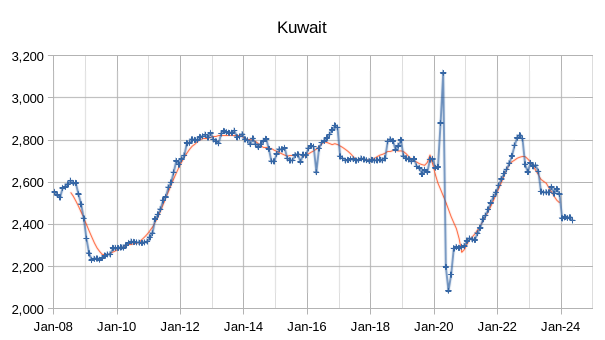
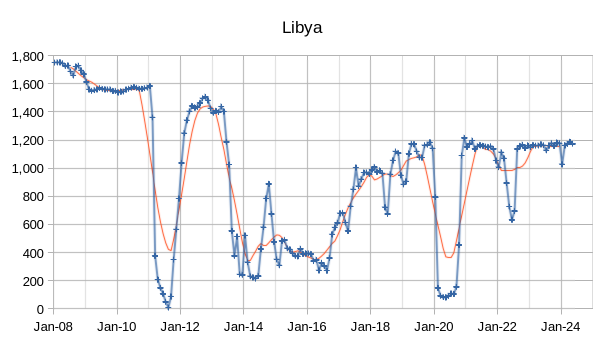
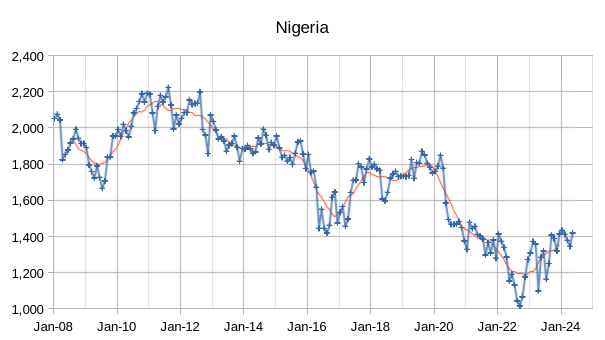
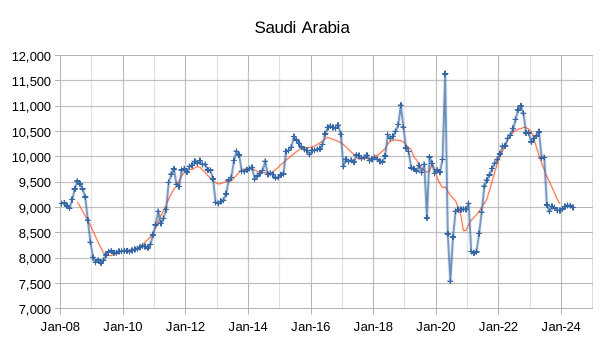
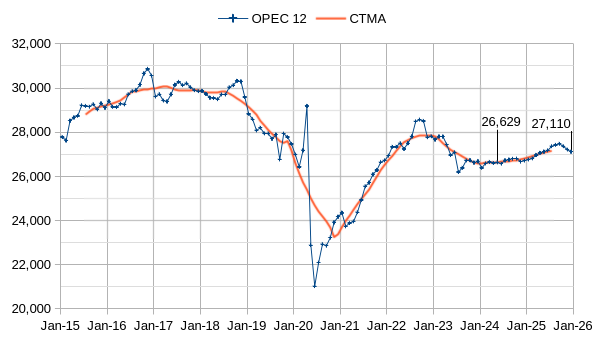
The OPEC Monthly Oil Market Report (MOMR) for June 2024 was published recently. The last month reported in most of the OPEC charts that follow is May 2024 and output reported for OPEC nations is crude oil output in thousands of barrels per day (kb/d). In the OPEC charts that follow the blue line with markers is monthly output and the thin red line is the centered twelve month average (CTMA) output.
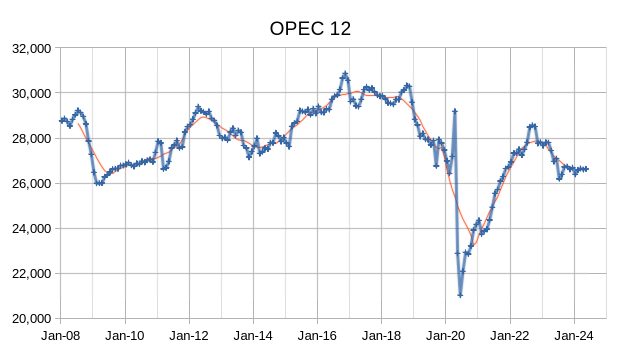
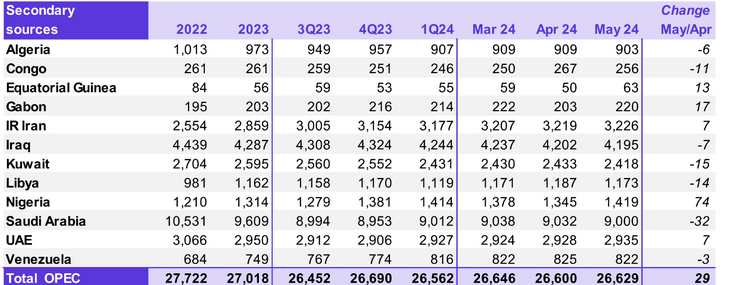
Output for April 2024 was revised up by 25 kb/d and March 2024 output was also revised higher by 23 kb/d compared to last month’s report. OPEC 12 output increased by 29 kb/d with most of the increase from Nigeria up by 74 kb/d and with a decrease in Saudi output of 32 kb/d. OPEC output has been relatively flat for the past 8 months.
The chart below attaches the EIA’s STEO outlook to the secondary source data for OPEC output reported in past MOMRs up to May 2024, the CTMA in 2025 is 27150 kb/d which is about 342 kb/d higher than the most recent CTMA of 26808 in December 2024. The output in May 2024 and the December 2025 forecast are shown on the chart. My expectation is that OPEC output will be flat at around 26650 kb/d up to December 2025.
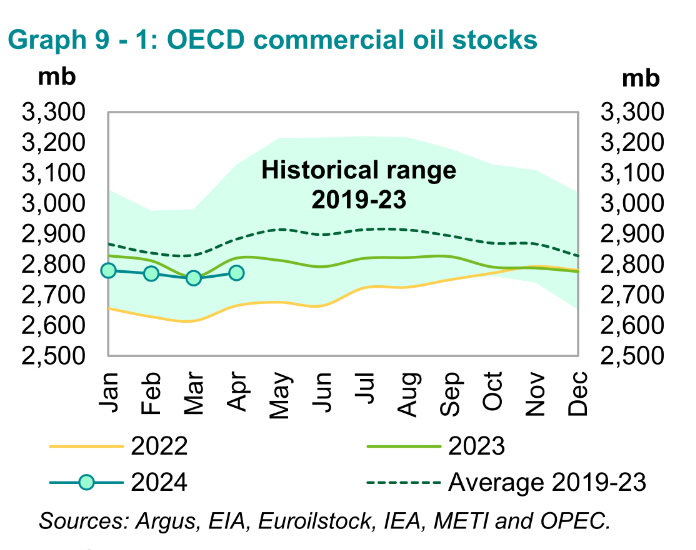
Preliminary April 2024 data shows total OECD commercial oil stocks up by 16.6 Mb, m-o-m. At 2,773 Mb, they were 49 Mb lower than the same time one year ago, 110 Mb lower than the latest
five-year average and 154 Mb below the 2015–2019 average. In terms of days of forward cover, OECD commercial stocks increased in April by 0.1 days, m-o-m, to stand at 60.1 days. This is 1.2 days lower than the level registered in April 2023, 4.9 days below the latest five-year average, and 2.2 days less than the 2015–2019 average.
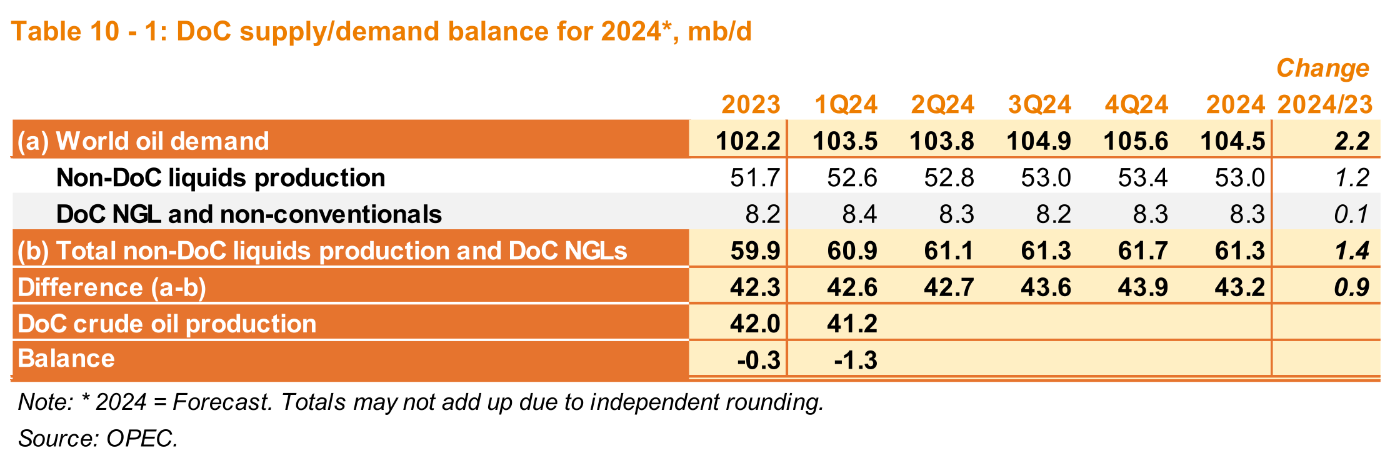
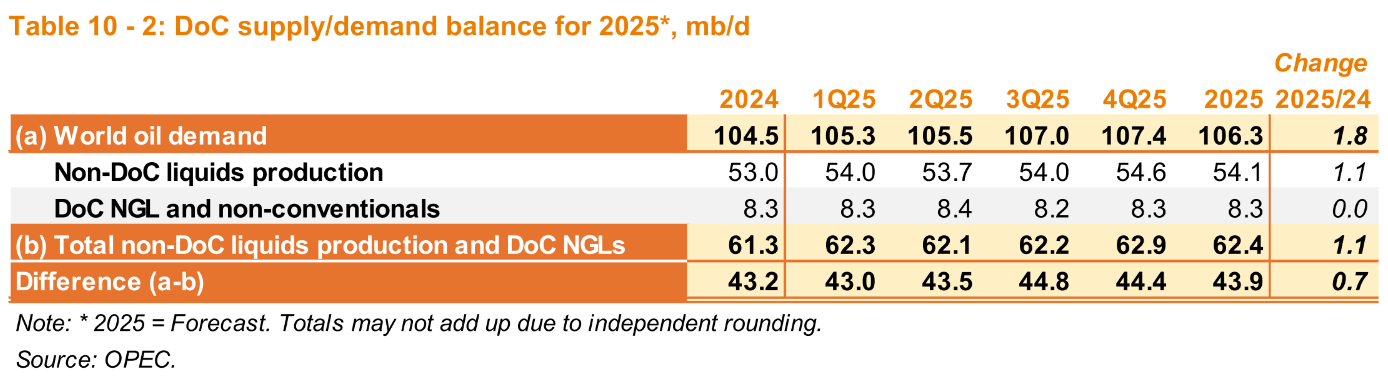
The OPEC estimate for World Demand is likely too high, the EIA STEO has 2023 liquids demand at 101.9 Mb/d, 2024 at 102.98 Mb/d and 2025 at 104.73 Mb/d, in my view these are more reasonable estimates than the OPEC estimates, but still a bit too high. My guess would be World demand of 103 to 104 Mb/d for the 2025 annual average.
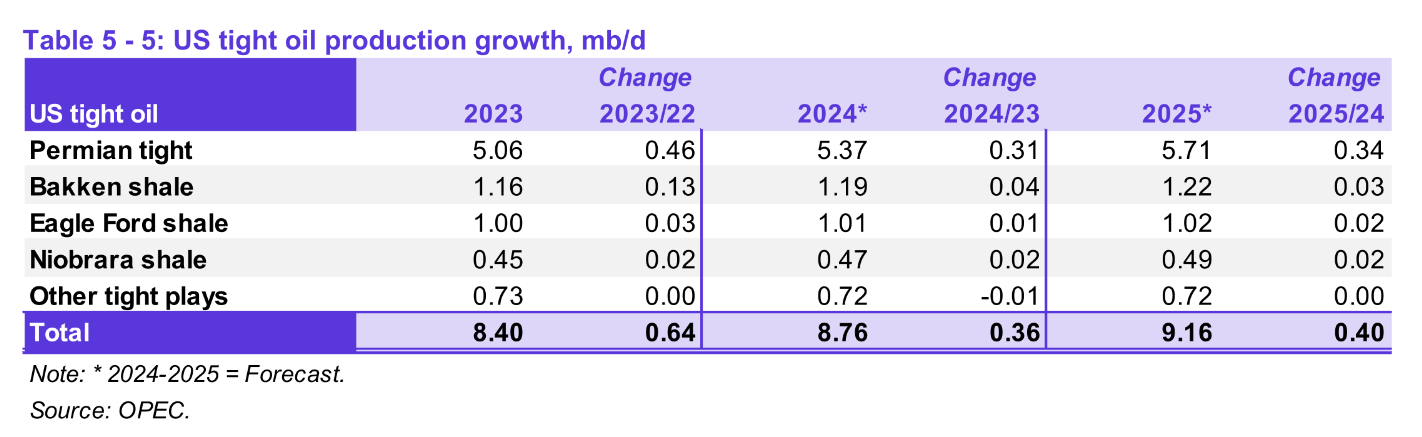
OPEC revised its estimate for US tight oil output in 2023 higher by 40 kb/d this month compared to last month, the EIA currently estimates 2023 US tight oil output at 8.41 Mb/d, I think the EIA is missing a few tight oil formations in the Permian Basin and that 2023 US tight oil output was about 8.59 Mb/d.
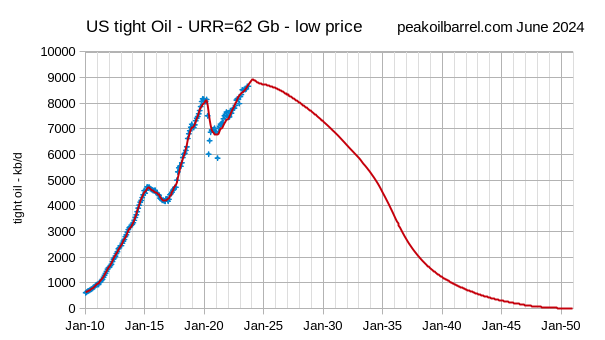
The tight oil scenario in the chart above assumes that oil price remains “low” which I define as under $85/b in 2024 US$ for Brent crude. If we use this scenario for tight oil with my typical World Oil Shock Model (where conventional and oil sands output are unchanged from earlier scenarios) we get the World C+C scenario below.
Note that this scenario is very conservative and that it is likely oil output will be higher than shown in the chart above because oil prices will rise in the 2025 to 2035 period. The EV transition will not happen quickly enough to keep oil demand under 83 Mb/d, so supply would be short for this supply scenario and would lead to higher oil prices and higher oil supply, with a peak of about 84 Mb/d in 2028 or 2029 needed for supply to meet demand for crude.
170 responses to “OPEC Update, June 2024”
Guys, I have a post about my new book on the Non-Petroleum page. Please check it out.
The 22 nations of OPEC Plus. They represent about 54% of the world’s production. This chart is crude only and is through May 2024.
I guess one could conclude that covid had essentially no effect on the long term trend established in 2016 (8 years ago)?
Global consumption of all liquids hit a new high in 2023 of 103.4 mbl/d.
https://www.energyinst.org/__data/assets/pdf_file/0006/1542714/EI_Stats_Review_2024.pdf
C and C consumption is less than one million away from a new high.
Despite increasing renewables global consumption of gas also hit a new high.
Renewables have sadly not prevented a staggering increase in coal consumption in 2022 and 2023.
China being the worst culprit burning 4.7 billion tonnes, 800 million more than what some people claimed would be its peak in 2013.
India is now burning over 1 billion tonnes per year.
An Indian politician recently said. India needs to fully develop its coal resources to provide a reliable supply of electricity to the 1.4 billion population. The population is getting richer and many are for the first time buying fridges, televisions and air conditioners.
Small correction
Natural Gas consumption increased in 2023 but is slightly below consumption in 2021.
Yes!
Happy Statistical Review of World Energy Day to all of us energy nerds out there!
Celebrate!
Tim,
The previous World coal consumption peak was in 2014 at 161.62 EJ, in 2023 (10 years later) World consumption was 164.03 EJ. I agree this is not good, but a net increase of 2.42 EJ over 10 years (0.24 EJ per year) is pretty good.
The chart below uses an OLS exponential fit on 2011 to 2023 World coal consumption with an annual growth rate of 0.078%. I just realized a regression on 2014 to 2023 gives a higher annual growth rate (which is counterintuitive at least to me) of 0.283%.
Dennis
Knowing how much energy is derived from coal is useful for certain calculations. A power station needs to know the energy content of the coal it burns. Globally however what matters is how many tonnes is burned and the fact that brown coal produces more toxic substances and more co2 than anthracite per unit of energy. Burning 9 billion tonnes including far more dirty coal than ever is having terrible consequences.
https://www.oxfam.org/en/press-releases/ten-worst-hit-countries-increasing-floods-and-drought-have-forced-people-flee-8#
The increase in serious flood events is mind blowing.
Tim,
I focus in consumption and the only number given is in EJ. Some of the coal that is produced could remain in stock piles without being burned. For coal production in tonnes we get about a 0.9% annual increase from 2013 to 2023. Using EJ for production the rate of increase is a bit lower (0.7% per year), not clear how these correlate with emissions, it is no doubt complex. We don’t have information the quantities of bituminous, sub-bituminous, lignite, and anthracite produced.
Dennis
sorry but these regressions are meaningless. There is no reason to expect a linear trend. This is not a random statistical variable, there is a signal behind this curve, a story.
What happened was a pretty drastic coal abatement in USA in favor of natgas , and to a lesser extent in EU, too. Superimposed on it is the continued strong growth in India, China, and rest of non-OECD. There is nothing in this story to suggest random variation around a linear trend. This is a sum of two curves superimposed, one is a decay the other is a strong exponential. Unfortunately the exponential has gotten big enough and is now dominating. A lot of other stories are similar, non-OECD trends starting to dominate the aggregate over OECD trends…
Kdimitrov,
Perhaps you are correct, I am trying to convey the trend in the data, nothing more. Fossil fuels are being replaced with wind and solar which are expanding exponentially, particularly in China, once they have completed their transition to wind and solar they will export their wind and solar power to the rest of the World, India, the Middle East, Southeast Asia and South Asia, South America, Africa. Much of the coal use is concentrated in China and India. For 2023 in China Wind and Solar combined gross generation increased by 280 TWh compared to 2022, for coal power gross generation increased by 341 TWh in 2023 compared to 2022. Natural gas power output increased by 22 TWh in China in 2023 and Oil electricity generation decreased by 0.3 TWh. For electricity generation from fossil fuels the increase in 2023 was 363 TWh, which was 83 TWh more than the wind and solar power increase.
When we look at the entire increase in all sources of electric power for China in 2023 the increase was 608 TWh in 2023, with wind and solar contributing 46% of the increase. Solar gross generation grew by 36.7% in 2023 in China and by 52.9% for 2013-2023, wind gross generation grew by 16.2% in 2023 and by 20.4% for 2013-2023. A reasonable scenario can be created where all coal powered electric power is replaced by wind and solar by 2040. India and other nations will be at a competive disadvantage if they do not follow China on this path as their electric power will be much more expensive and China will want to export this technology to other nations to drive their economy.
To me your story of continued growth in coal and natural gas use in the non-OECD does not ring true.
Time will tell. I agree the trend lines are meaningless, trends always change and the current trend in the non-OECD will change as this energy transition occurs.
when significant decline from Peak Oil occurs even if the USA transitions away from Coal
other countries are going to desperately want the coal to liquify it.
Australia and the USA have 40% of the worlds coal reserves and are tight military partners.
The business opportunity to sell coal will be obvious even in a worsening climate.
Andre the giant,
As land transport electrifies due to lower cost there will be plenty of oil,
CTL is unlikely to be cost competitive, a lot of coal will be left in the ground.
Dennis,
That would be great IF it happens. I am not as confident as you that it will.
Art Berman showed ( I’ll try to find it ) that renewables aren’t putting a dent in our fossil fuel use at all.
They are just piling on top.
thanks!
Andre the giant,
Energy provided by non-fossil fuel replaces fossil fuel and the rate of growth of non fossil fuel has been much higher, soon fossil fuel consumption will stop growing and fossil fuel used for energy production will decrease. Probably 2028 to 2030.
Dennis,
How is 341 TWh coal-generated electricity in China not the Big Story in your view? That’s like 8-9% of total USA electricity consumption added in a single year, only from coal!
I fully understand your point that some el. growth is covered by renewables, but that has only a moderating effect.
2023 was a record year for world coal, despite massive abatement from US and EU over the past two decades. 2024 is shaping to be another record… Non-OECD world needs massive amounts of electricity, driving substantial growth, and unfortunately coal remains a major piece of their generation portfolio.
I agree, it is a massive amount added from coal, to ignore it is ridiculous.
Kdimitrov,
It is 341 TWh of electricity generation from coal of a 5754 TWh total, or a 6% increase, I agree it is not ideal. Asia pacific as a whole grew at 5.9% in 2023 for electricity generation by coal with India at 8.6%. For the past 4 years the average rate of growth for Asia Pacific coal generation has been 4.6% per year and for India the average annual growth rate has been 8.3% for the past 4 years.
Dennis,
I meant 8-9% of USA generation, not of China generation. The point is, again, non-OECD is becoming the dominating trend, so whatever abatement efforts are going on in EU and USA are being cancelled and then some by China and India. China is doing renewable, yes, however just the sheer size of just the coal power added is a big problem for decarbonization….
Kdimitrov,
I agree the increasing coal power is a problem in China, India and other non-OECD nations. The high rate of growth in wind and solar power will eventually reduce the need for more coal power. So far coal output in China has decreased in 2024 compared to 2023 (compare cumulative in May 2024 and May 2023), there isn’t any data yet for coal consumption in 2024 that I can find.
https://data.stats.gov.cn/english/tablequery.htm?code=AA0701
Also the drought conditions from last year in China have improved so there may be more output from hydro power this year, reducing the need for coal output. Hydropower output decreased in 2023 by 72 TWh compared to 2022, though nuclear power increased by 17 TWh in 2023.
https://data.stats.gov.cn/english/tablequery.htm?code=AA0701
Dennis
What data are you using for cost of electricity from coal in China and India, kindly also provide the cost data for wind, solar and battery storage for those two countries.
What matters is the cost of installation today, it is the cost of building battery storage today that determines the price of electricity in six months time.
Tim,
I do not have that data, mostly focusing on China where wind and solar growth rates are much higher than coal. China imported 10 EJ of coal in 2023 (about 11% of consumption). The price of coal in South China was about $120 per tonne in 2023. For all coal consumption in China in 2023 at $120 / tonne the total cost was about $568 billion for a year of coal consumption. Roughly 52 EJ of coal was used for China’s coal power output in 2023 at a cost (using $120/ tonne for coal) of $314 billion for fuel alone.
Over the past 4 years coal power output in China grew at 4.8% per year, wind output grew at 20.7% per year on average over 2020-2023 and solar output grew at 26.8% over that period.
I found this piece, but it is old (2021)
https://arstechnica.com/science/2021/10/the-shifting-economics-of-solar-power-in-china/
also this
https://www.pv-magazine.com/2024/02/29/utility-scale-pv-cheapest-power-source-in-asia-pacific-says-woodmac/
Tim,
China produced 5754 TWh of coal power output in 2023, if the coal used in those power plants had an opportunity cost of $314 billion dollars, the price per kWh would be 18.3 cents per kWh just for the fuel (no cost included for capital and ongoing maintenance and ash disposal).
Dennis,
where did you get the $120/t price? That’s an insane price for coal… It’s higher than LNG price.
Kdimitrov,
Price for 2023 listed in Statistical Review of World Energy for South China. Screen shot below fro Coal and Uranium Price tab in Statistical Review of World Energy. We could use $100/ tonne that reduces electricity cost by 17% to 15 cents per kWh for coal only, the actual price would include maintenance, capital cost, ash disposal, labor, etc.
Click on chart for more readable view
Kdimitrov,
Coal is indeed a huge piece of the electricity generation in India and China and Asia Pacific as a region (with 56% of electricity generation from coal in 2023). China produced 67% of coal power output in the Asia Pacific region in 2023 and 54.7% of World coal power output, they also are expanding wind and solar output at high rates (26.8% annual rate of growth for solar output over past 4 years and 20.7% for wind).
The scenario below assumes China’s electricity output grows by 6% per year until 2029 and 5% per year from 2030 to 2041, wind and solar output exponential growth gradually slows and becomes linear in 2040 (rates are 15% for solar in 2039 and 10% for wind in 2039). Only coal wind and solar power are assumed to grow, other sources remained fixed at 2023 level. Coal power peaks in 2029 and falls to zero by 2038 (power from sources besides wind, solar and coal was 3703 TWh in 2023 and remains at this level through 2041 by assumption.)
Dennis
The costs of solar and wind could very well be cheaper than coal, that is why China is installing large amounts. However that is not even half the issue, electricity is needed all the time. Countries with poor electricity supply have one thing in common. They all have grinding poverty effecting the majority of the population.
The Chinese and Indian governments know this and issued orders to generators to increase coal power. China completed the equivalent of 150, 500MW power stations last year.
Coal is the bedrock of Chinese and Indian electricity supply and therefore wealth and therefore social stability. China has long winters with 14 hours of darkness, no serious attempt is being made to power the country with batteries.
Wind and solar will simply ensure China’s coal reserves to last longer.
The environmental costs will be paid by all of us.
TIM —
Chinese coal plants are running at very low capacity — roughly 50%. Most of the new ones use the flexible design pioneered in Germany which allows coal plants to act as peakers like combined cycle gas plants.
Because coal costs more than wind and solar, it isn’t very likely that coal will dominate electricity production in China for very long. A more likely scenario is that it will supplement cheaper energy sources when demand outstrips supply. A lot of the power plants being built now are likely to end up as stranded assets.
Tim,
The solar and wind can be overbuilt to reduce intermittency, hydro can be saved for times when wind and solar output is low and there can be some battery backup an with the expansion of EVs in China perhaps they will set up a vehicle to grid backup, a widely dispersed highly interconnected set of wind and solar power sites has far lower system level intermittency, power is moved around the system to where it is needed and demand can be curtailed using demand pricing for electricity.
China could increase its solar power buildout by building more utility scale solar which has higher capacity factors, they have low population density areas of their nation with high solar and wind resources, they just need to build transmission lines to bring the power to the higher population areas in the east of the nation.
Annual BP energy bible (outsourced to energy inst) is out for 2023.
Highlights
US oil Consumption up 0.6% at 19 mbpd
World oil Consumption up 2.6% to 100.2 mbpd
China oil Consumption up 10.7% to 16.6 mbpd (! ! ! all those EVs must run on oil)
India oil Consumption up 4.5% to 5.4 mbpd
KSA oil Consumption up 5.1% 4.1 mbpd
Russia oil Consumption up 1% to 3.6 mbpd
Ukraine oil Consumption up 1% to 204K bpd (falling since 2007’s 324K bpd)
Something amiss in Gas Reserves — they didn’t update, under review
Russia still displays as #1 big kahuna at 37.4 trillion cubic meters
followed by Iran and Qatar
Global gas consumption flat at 4 trillion cubic meters
Europe overall -7% — doesn’t look like warm weather, Italy and Portugal sharply down
Russia gas consumption 1%
KSA gas consumption -2%
China 7%
India 7%
Global gas production flat at 4 Trillion cm
Iran and Qatar both gas production 1%
Australia gas production -1.6%
Russia gas production -5% at 586 billion cubic meters
UK gas production -9.6%
Norway -5%
US 4% at 1 Trillion cm — (with as of 2020 12 Trillion cubic meters remaining)
World light and middle distillates and fuel oil in chart below. From 2018 to 2023 consumption of these (basically all petroleum transport fuel for land, water and air) increased by 253 kb/d from 73563 kb/d to 73817 kb/d, an average annual increase of 253/5=51 kb/d or (51/73690=0.07%.) As Ron has often said we are less interested in bottled gas and other petroleum by products (wax, road oil, etc).
This is from the regional oil consumption tab of new Statistical Review of World Energy 2024.
https://www.energyinst.org/__data/assets/excel_doc/0020/1540550/EI-Stats-Review-All-Data.xlsx
Global natural gas consumption is lower than the 2021 peak by 0.49 EJ (0.3% lower.)
OK Dennis,
now do the 2020-2023 trend.
🙂
Kdimitrov,
I always expected a v shaped recovery from the pandemic. Thinking that the 2020-2023 trend would continue is unrealistic in my view and I think yours as well.
Chart below is World refinery throughput from the Statisical Review of World Energy 2024, the level in 2023 (82988 kb/d) remains 80 kb/d below the 2018 peak (83068 kb/d). That 2020 to 2023 trend looks great though 🙂
Note that the red diamonds go from 2018 to 2023, the 2018 marker is hidden by the big blue square. so the red linear trendline is for an OLS on 2018 to 2023 data. We could also just take the line between 2018 and 2023 which would have a slope of -16 kb/d per year with a y-intercept of 115356 kb/d.
Dennis,
The point is that we don’t know how long the COVID recovery trend will continue. It could continue until it intersects the 1985-2019 trendline, and then that trendline can continue. Or it could continue at the accelerated rate, due to booming non-OECD demand. Or it could inflect lower due to energy transition…
The 1985-2019 trendline seems tight and meaningful. the 2018-23 or 2020-23 are both meaningless.
Kdimitrov,
I agree we do not know what the future will be. We only know that the 2018 peak remains through the end of 2023, unless there are future revisions to the data. Note that we do know that each year the increase has become smaller and smaller.
Annual change in refinery throughput from 2021 to 2023 was 3520, 2526, and 1308 kb/d, maybe 200 kb/d next year and maybe a decrease the following year.
Note that there is a big increase in sales of electric 2W and 3W vehicles in China and India, I have read that 70% of 2W sales in China were electric in recent months, there aren’t great numbers on this though a lot of the stuff on the net is proprietary reports that are being sold. The IEA has Indian 2 and 3 wheel vehicles rising from 200 million to 300 million from 2023 to 2030, but I have read that 2020 sales for 2W were about 42% EVs in China, but in India the share is far lower at 5% (in 2024), but the recent rate of sales growth was 176% y-o-y. Many of the 2W vehicles are small engine with fuel efficiency of 100 miles per gallon, so assuming 5000 miles per year that is about 1.2 barrels per vehicle per year and for 100 million of these would be 1200 million barrels per year or 3.28 million barrels per day, if 30% of the ICEVs were replaced with EVs over time that is a reduction of 980 kb/d in fuel demand. Unfortunately finding good data on this market is difficult.
Dennis,
I think refinery throughput growth in 2024 will be equal to 2023: ~ 1.3 MMbpd
How do you get 200 kbpd? Just the USA is tracking at +250 kbpd as per the EIA, and the USA is supposed to be a senescing refinery country…
Kdimitrov,
So in 2021 you might have guessed 3520 kb/d for 2022 (you would have been about 1000 kb/d too high) and in 2022 you would have guessed 2500 kb/d in 2023 (you would have been roughly 1200 kb/d too high). We will talk in June 2025 to see of you are 1050 kb/d too high for your 2024 guess or maybe I will be 1050 too low (my current guess has been revised to 250 kb/d).
Looking at change in refinery throughput 2021 to 2023 the change has become smaller each year, I am simply extending this trend to 2024 to make my estimate. Could be wrong, we will know more in 12 months. I hadn’t done this earlier, it looks like 250 kb/d rather than my initial estimate.
The EIA is wrong almost as often as me.
Chart below is for World annual change in refinery throughput.
For US historical data we see the change in refinery crude input has decreased each year from 2021 to 2023 and 2023 crude input to refineries remains 808 kb/d below the level of 2018.
https://www.eia.gov/dnav/pet/pet_pnp_unc_dcu_nus_a.htm
It looks like 2024 may be a decrease of 300 kb/d or so for the US refinery crude input.
Yes, Dennis, but here’s the thing, instead of 300kbpd decrease in US, EIA is showing 250kbpd INCREASE at mid-year.
https://ir.eia.gov/wpsr/overview.pdf
(Cumulative Daily Average in Row 17)
Kdimitrov,
Two things, the refinery inputs are seasonal and the weekly data is crap (it should be ignored in my view).
See link below for monthly data (which is pretty good and gets revised when there is an error, not the case for weekly estimates).
https://www.eia.gov/dnav/pet/hist/LeafHandler.ashx?n=PET&s=M_EPC0_YIY_NUS_2&f=M
Perhaps this won’t hold for the US because excess products can be exported, not all product output is consumed in the US.
For the World I am fairly sure that the exports to other planets is relatively limited (my guess is zero) so we don’t have any net exports in that case.
Also STEO has refinery crude inputs down a bit in 2024 (only 20 kb/d) compared to 2023.
https://www.eia.gov/outlooks/steo/data/browser/#/?v=27&f=A&s=0&start=2019&end=2025&map=&maptype=0&ctype=linechart&linechart=CORIPUS
You make a valid point if the weekly data is to be believed, in many cases in the past it has been far from the mark. In September we will have the monthly data through June. The cumulative monthly data through March 2024 is up by 67 kb/d compared to first 3 months of 2023, so you may be correct for US refinery throughput increasing in 2024.
Note that finished petroleum stocks were higher in March 2024 than a year earlier so perhaps refinery activity decreases after March relative to a year ago.
Dennis,
First, the weekly data is crap for Production and Exports, but is very solid for refinery inputs.
Second, the weekly tables reflect the seasonality as they show YTD data, comparable to last year.
Third, the PSM data is only Jan-Mar, and it shows +200kbpd.
2023 Jan-Mar: 15,190 kbpd
https://www.eia.gov/petroleum/supply/monthly/archive/2023/2023_05/pdf/psmall.pdf
2024 Jan-Mar: 15,393 kbpd
https://www.eia.gov/petroleum/supply/monthly/pdf/psmall.pdf
Since March things only accelerated with some weekly reports printing 17,000kbpd+
The STEO is not data it is a projection. It is a bit puzzling, since to get to +20kbpd the second half will have to show significant drop in throughout…. Maybe they are factoring a major hurricane season, I don’t know…
Kdimitrov,
Yes I made a mistake on Jan to March 2023 vs Jan-March 2024,
I use data from
https://www.eia.gov/dnav/pet/hist/LeafHandler.ashx?n=PET&s=M_EPC0_YIY_NUS_2&f=M
this is the data that gets corrected, the PDF reports may not. For Jan to March 2023 I get 15242 kb/d,
for Jan to March 2024 I get 15382 kb/d,
the difference is 140 kb/d.
I agree the refinery crude input data in the weekly numbers is pretty good, I hadn’t realized that, thanks.
Yes the STEO is a forecast and gets revised every month (and is often wrong), and you are correct about having the seasonal comparison, initially I thought you were looking at the change from Dec 31 to June 14 rather than the Jan 1 to June 14 comparison from 2023 to 2024, my mistake sorry.
Perhaps you are right that US refinery throughput will be up and perhaps you are right about the World as well. My guess is that increasing EV and plugin hybrid sales may put a dent in gasoline demand, the 250 kb/d guess wasbased on the thinking that it looks like World refinery throughput has been flattening (slope getting closer to zero) since 2020, but that trend may change.
Your initial point that we don’t know how things will play out (there are many different stories we could tell we can’t know in advance which will be closer to reality) I am in full agreement with. You and I have different stories that we think make sense. The most likely thing is that neither of us will be correct, in my opinion.
Interesting conversation though, thanks for your insights.
Likewise Dennis,
I enjoy the discussion, this is a great website. Kudos to you and Ovi.
Not to mention the 140 billion cc flared each year. About 3.5% of total production I guess.
Fossil fuel consumption (oil , natural gas and coal) at the World level has increased at about 4.4 EJ per year over the past decade, an annual rate of increase of 0.91% per year, we really need to do better. This is a bit better than the previous decade when the annual rate of increase was 2.3%. The previous 2 decades were 1.8% and 1.9% (1983 to 1993 and 1993 to 2003 respectively). Progress has been frustratingly slow.
Change is unlikely to be linear. The key question is price. As long as the price of the existing solution is lower, there won’t be much reason for consumers to change. If new solution appears that is clearly cheaper, change could suddenly speed up.
Another issue is existing infrastructure, which give incumbent solutions a built in advantage. One possible explanation for the quicker switch from coal to gas in America compared to Europe is that the American coal fleet is old and got comparatively little investment after the mid 1980s. China’s much younger fleet may prove more resilient. In another example, I expect a rapid decline in nuclear output in the early 2030s, because the there was no follow-up to the big building boom of the 1970s. All the plants built at the same time will reach end of life at the same time, so there won’t be a gradual fade-out.
Change comes when the time is ripe, sometimes gradually and sometimes very fast.
Alimbiquated,
In the US natural gas electic power is cheaper than coal due to low natural gas costs which is not true in China. My guess is that solar and wind may be far cheaper than coal for electric power in China, but it simply takes time to build out the capacity. China’s solar gross generation grew at about 26.8% per year over past 4 years (and at 29% over past 3 years) and wind generation grew at about 15% per year over past 3 years. If we project these rates into future with rates gradually slowing over time coal power growth (assuming no growth from other sources besides wind solar and coal) could cease in 2029 assuming recent growth trend in electricity output continues in China. By 2040 all fossil fuel electric generation could be replaced by wind and solar in China.
And as I mention elsewhere, many of the new Chinese coal plants have flexible output, so they can act as peakers, competing with batteries more than with renewables.
https://www.dailymail.co.uk/news/article-13552119/Oil-boom-Dramatic-footage-shows-12-000-ton-North-Sea-behemoth-reduced-pile-twisted-metal-seconds.html
North Sea behemoth sees its final days.
Some granularity on the basic data from the new BP/Energy Inst release above.
Argentina’s shale — oil output rose 14% to 946K bpd, consumption down 4% to 690K bpd. This is IMF default territory. Why repay the loans? There is income. Gas output was flat. Surprising.
Israel’s gas production +13% to 23 Bcm. And now you know why the war is underway. The local countries will get dependent and upheaval was needed before that happens. Iran is Shiite of course and has no great interest in Sunni Hamas, plus the distance from Qatar/Iran is too far for pipeline to Jordan and Egypt. Speaking of whom, Egypt’s gas output -11% to 57 Bcm. Egypt gas consumption flat at 60 Bcm. Yup, they need influx.
Quite the lesson in Ukraine’s paltry 204K bpd oil consumption, which has been falling for decades. Tanks burn a lot of diesel, but there aren’t many of them, and they don’t go far. Big distance is a train ride. War is not a consumption spike.
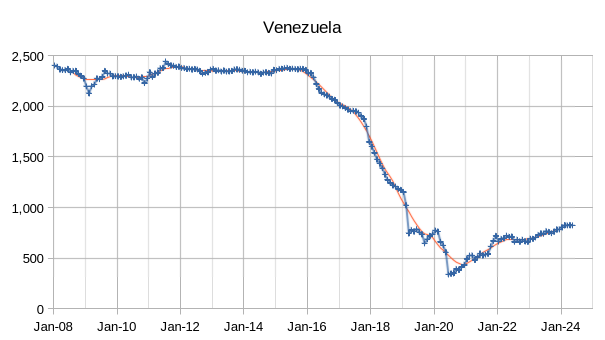
Turkey had the largest oil consumption gain in Europe — 6%. Venezuela largest consumption gain in S. America at 27% (!!!). Canada oil consumption up 1.7%. How very green of them.
Brazil’s oil consumption up to 2.6 mbpd. Their highest was 2.75 mbpd in 2014. Growth has been pretty steady, despite Covid. Brazil gas production 23.4 Bcm. Argentina’s pipeline would seem to have a customer, given Brazil gas consumption is annual 30 Bcm. (That’s oddly falling since 2015, btw)
Largest % oil production gain in the world — Guyana’s 40%. Largest % decline — Yemen’s -53%, followed by UK -11%.
The main reason for the fall in Ukrainian consumption must be the rapidly declining population. The country has lost about a quarter of its people since 1990.
Yes, the population in that part of Ukraine controlled by Kiev has fallen by 50% since 2014.
The demography for Ukraine was dire in the ’90s. It’s positively catastrophic now as most people of means have left and any able bodied males are being fed into the woodchipper right now for questionable gain.
Dead nation walking.
ALIMBIQUATED
I first heard that coal plants will become stranded assets in 2012, 12 years later China and India combined are burning 1.3 billion tonnes more coal.
Do you think the Chinese government would let billions of assets go bust and drag down the Chinese banking sector.
Go visit China you may learn how a totalitarian regime operates.
Tim,
If it costs more to run a coal power plant than the electricity can be sold for, the plant will be shut down, even in China. Wind and solar are far cheaper, that’s why China has hosen to dominate the solar market in particular. They are on the cusp of bringing a lot of wind an solar power online, the increased coal power is just to satisfy demand until wind and solar have ramped up. The oldest, least flexible coal power plants will be shut down first. By 2038 coal will only serve as backup power and by that time may be more expensive than battery and pumped hydro backup, eventually those will be shut down too. maybe by 2050. Synthetic fuels in natural gas peaker plants that may already exist can provide some emergency backup if all coal power is shut down.
Hi TIM,
Go visit China you may learn how a totalitarian regime operates.
I have been to China and even lived there. I majored in Chinese. I wrote my graduate thesis on Deng Xiaoping’s agrarian reforms, which (to everyone’s surprise) kicked off decades of unprecedented growth. I based my paper on Chinese sources.
You seem to put all your faith in Chinese leadership — your logic seems to be that if the government controls everything, then it never makes bad investment decisions. That is a fallacy. Absolute dictators tend to lack the resources to make good decisions.
Michael Gorbachov tells a story in his memoirs about his nuclear summit in Iceland with Reagan. He busted his butt to prepare, but didn’t have much support. When he got there, Reagan seemed to him to have a good idea of America’s basic strategy, but was hopeless on the details. But the American side brought fifty experts to discuss the details. Gorbachov was shocked. In the Soviet Union, decisions came from above.
The downside of having complete control is the lack of feedback and the increased complexity it brings with it. That’s why markets, for all their flaws, are so useful. They gather information autonomously.
Be that as it may, Peking doesn’t control energy investment at the level you seem to think it does. Most of the investments come from provinces. Yunnan Province, on the Burmese border, is especially overinvested in coal. There are lots of small poorly regulated coal mines there, and Peking isn’t amused.
Chinese energy investments are wildly out of sync with the Five Year Plan, the Stalinist relic that officially runs the economy. Coal plants are massively overbuilt and underutilized. Solar has gone completely wild. The grid doesn’t connect what it should, though they have done an awful lot. Nuclear is quietly tanking. Energy imports are unpredictable, being subject to heavy handed political interference. That’s how a totalitarian regime operates.
Alim
I never said they never made mistakes.
Back in 1994 if anyone would have said the Chinese economy would grow from $0.5 trillion to $17 trillion they would not have been taken seriously. The Chinese government helps and backs Chinese companies all over the world.
They fund mining, Power plants, road building etc. In return they get to buy oil, gas, minerals at a reduced price.
https://www.usip.org/publications/2023/06/challenging-chinas-grip-critical-minerals-can-be-boon-africas-future
https://thediplomat.com/2024/06/china-expands-its-oil-ties-in-iraq/
China has a trade surplus of $700 billion and use some of this wealth to subsidize coal to generate cheap electricity where no other country can compete.
They Chinese government has achieved all this in less than 30 years.
Tim,
Coal power is no longer cheap.
Even if we assume $80 per tonne which is about the lowest price in Asia for imports the price for coal powered electricity would be 12 cents per kWh just for fuel, this ignores ash dispoal, labor cost and capital cost and ongoing maintenance at the coal power plants.
?
You are missing a digit I think, 1 Kg coal is 8 cents then and contains round about 8 Kwh thermal energy. With 40% efficiency this is 2.5 cents / Kwh as fuel cost then.
Eulenspiegel,
You are correct my calculations were in error.
I came at it from 5754 TWh of elecricity production in 2023 for China which is 20.7 EJ (1 TWh is 0.0036 EJ). I assume 40% average thermal efficiency so 51.8 EJ of coal input is needed. From Statistical Review of World Energy 2024 China produced 4170 million tonnes of coal which contained 93.1 EJ of primary energy, so 50.6 million tonnes per EJ of coal produced. This implies the 51.8 EJ of coal input to coal power plants is 51.8 times 50.6 tonnes per EJ equal to 2621 million tonnes of coal times $80/tonne which is $209 billion dollars for 5754 TWh which is 3.6 cents per kWh for fuel cost. Note that Indonesion coal is 5000 kcal per kg which is 5.8 kWh per kg with 40% efficiency we get 2.32 kWh of electric output per kg, each kg costs 8 cents so we also get 3.6 cents per kg (the difference is 5.8 kWh per kg vs the 8 kwh per kg that you assumed.
Note that other costs besides fuel alone are needed to run a coal plant, labor for ongong maintenance, ash disposal, transport of coal from port to power plant, and the capital cost of the power plant. The price of electricity produced with wind or solar power is cheaper similar to the cost for fuel alone at a coal power plant.
Wind and Solar is still a highly subsidized market here, direct and indirect.
Direct by tax credits and direct money, indirect by the wind/solar first directive.
They would cannibalize themselves when there is high wind – bashing down energy prices to negative values, and not being able to deliver at high ones. So making no money on a free market. That’s ok for Europe and the USA- the energy heavy industry will just go broke or resettle, but in India and other developing countries there will be a strong base for coal for a longer time until the problem is solved to deliver a few GW to a chemical plant day and night.
Meanwhile new alternatives emerge, as deep Geo Energy being able to deliver round the clock without storages as coal.
Here in Germany Industry starts disappearing – the energy heavy leave because they make red ink on everything they produce. The things are only saleable when protected by tax walls. But then it’s only the local market, and the export capacities need to be shut down.
But at least this is good for our CO2 budget when the plants go to India where they produce with coal then…
Addition:
The current price of wind energy on land is 7.35 cents/Kwh guranteed here at the moment, on sea it is more. And at this price the demand from investors is somewhat low.
And this price is a guarantee price, even when the real price is negative at this moment. That’s what I mean with indirect subventions.
Eulenspiegel,
There is no negative price for electricity, if there is excess it is either stored (when available in batteries or pumped hydro) or sent to ground. Power to grid could be set up near facilities that are expected to see excess electricity supply and produce either hydrogen or synthetic natural gas (whichever is cheaper to produce and store) to be used in flexible peaker gas turbines when demand is higher than supply. After the OECD works out how to set up such a system (China may be the leader on this rather than the OECD as they lead on solar and HVDC transmission grid) then this cheaper system spreads to India and the rest of the non-OECD less China.
@Dennis
Just google it for Europe.
Storing and making hydrogen is still Sci Fi. It’s just not there in the needed quantity.
Beside that is that big installations creating hydrogen should run near at 24/7 since they are too expensive to run only for hours. So even more storage needed.
Not only coal power plants cost money, all these installations to make sun and wind 24/7 viable will cost a LOT of money, too.
That’s how it is.
Eulenspeigel,
Yes I realize these are not in place, they are a future possibility that might compete with batteries, vehicle to grid, fuel cells or pumped hydro as an energy storage mechanism, seems hydrogen is a better approach as the need for CO2 to produce methane would be eliminated.
Strange to me that the grid operators don’t forecast supply and demand and let commercial fossil fuel producers know what will be needed, this seems to be a matter of poor planning by the European grid operators.
Biggest economy on the planet that raised more people out of poverty and in less time than any nation has in history, but also they’ll collapse any day now. Just you wait.
No, do not buy those much cheaper, better built Chinese products that we’re putting 100% tariffs on. It’s communism and should be illegal.
Genuinely don’t get it. The one nation making massive strides in the energy transition and fighting climate, and everyone hates them (everyone = idiot Westoids) because they’re not mindless liberal brained electoralists. It’s pretty funny, actually. “Oh, but they don’t pretend to have a sham democracy like the US and Europe!” Okay. Cool. But they can build more high speed rail, housing, RE plants and high tech business parks than all other nations together could and execute corrupt business executives. That’s a win to me.
Oh, but muh markets! Yeah, market economy doing well for the rentier class, I can see why it has appeal in the West. Love a captive market me. Hey, how’s Boeing doing these days?
Anyway, can’t wait for America to start a world war with China because they outdid them on everything. Or they could just let the market method play out and the USA disappears into obsolescence as everyone buys Chinese goods.
The Rig report for the week ending June 21
– US Hz oil rigs decreased by 2 to 438. This is the seventh consecutive weekly drop, down 20 from 7 weeks ago. In January 2022, the rig count was 434 and rising after the Xmas break.
– The Texas rig count dropped by 2 to 241 rigs and is down 85 from January 2023
– Texas Permian dropped 1 to 192 while New the Mexico Permian was unchanged at 103. The Texas Permian is down 52 rigs from May 2023 high of 244.
– In Texas, both Martin and Midland counties dropped by 2 to 30 and 18 respectively.
– Eagle Ford dropped 1 to 46. EF has had 46 ± 2 operational rigs for the last 5 months
– In New Mexico both Lea and Eddy counties were unchanged at 50 and 52 respectively.
– NG Hz rigs were unchanged at 86. (Not shown).
Frac Spread report for the week ending June 21
The frac spread count dropped by 4 to 246 and is down by 31 from one year ago. It is also down by 26 spreads since March 8. The overall trend in frac spreads appears to be down.
Texas electricity demand could nearly double in six years, grid operator predicts-
“More than a third of the forecast growth is coming from the Permian Basin, where oil and gas operators are converting operations to run on electricity instead of gas or diesel. Much is also coming from large users such as data centers that are powering artificial intelligence and crypto currency mining. Some are requesting several times more power than what the city of Lubbock now uses, according to ERCOT….“There’s no question there’s going to be additional need for generation,” said Michael Lozano, a communications and government affairs officer for the Permian Basin Petroleum Association. “But I think the most important thing right now that we’re trying to address is the lack of transmission.””
“Demand on the power grid hit a record of 85 gigawatts last year, which was the hottest ever recorded in the state. ERCOT experts now say demand could reach around 150 gigawatts by 2030.”
https://www.renewableenergyworld.com/news/texas-electricity-demand-could-nearly-double-in-six-years-grid-operator-predicts/
A sneak preview of what’s coming in the US July Oil Production report.
Martin County has peaked
Martin and Midland counties are the two biggest oil producing counties in the US.
Ovi.
I am sure you have posted this before, but what Permian counties do you believe have peaked and what ones do you believe still have room to grow?
As I recall, in Texas the Permian counties that matter most are Midland, Martin and Howard on the East side, with Reeves and Loving being the big ones on the West side?
Any I’m missing?
In New Mexico it’s Lea and Eddy only? And New Mexico is still growing, surpassing 2 million? But becoming very gassy too?
Thanks for helping Dennis keep this place going. It seems complacency has really set in on this topic.
Going from 2019 to present, New Mexico is the state that has really gotten the USA back to 13 million plus BOPD. Only Utah has had significant growth during that time besides New Mexico, and Utah is very small comparatively. ND is still below 2019, as is OK and CO. Wyoming has maintained.
Texas, of course, is the biggie, but its growth seems to be slowing, and it isn’t much higher than the 2019 peak, whereas NM is more than double.
New Mexico’s legislative and finance committee predicts New Mexico production will peak in the early 2030’s. I need to see if I can find more detail on this.
Looks like USA future production growth really depends on two counties in New Mexico.
Shallow Sand
Currently I am tracking Lea, Eddy, Martin and Midland and District 8 and will report on those in the US update around July 2 or 3. I also track Loving and Reeves but do not report them. Maybe I will post those two next month without comments since you asked. I find it difficult to comment on these charts since I know nothing about what’s happening in those counties from a fundamental basis, i.e. geology in those counties, whether the counties are part of a sub-basin like Delaware in the Permian and whether the pressure is dropping across the whole basin..
Currently I am providing plots of production vs rig count with the rig count shifted forward by 7 to 8 months and assuming that production follows rig count. The underlying assumption is that no more or very few DUCs are being used. Also implicit in making this call is that the drillers and frackers are using the latest technology, i.e. 3 mile laterals, max proppant and chemicals and some refracs. I have no idea if this assumption is correct.
Looking at the data, overall I think the Permian has peaked. Specifically Midland and Eddy have peaked. Lea grew a bit in April and as you see in the Martin chart above, Martin was flat for April. So for Lea and Martin I will say that if they have not peaked in April, they will peak in May or June. The charts will be there to show the basis for making those calls. I am just trying to let the numbers and charts do the talking.
I am not tracking any counties that have increasing production. If you know of one or two, post them.
Shallow,
For the Midland Basin…. Upton, Reagan and Glasscock Counties also contribute meaningful production. Good results are also expanding into portions of Andrews, Ector, Borden and Dawson Counties.
For the Delaware… portions of Ward, Winkler, Culberson and a little from Pecos also contribute.
Gungagalonga
Attached is a table that shows the county production rankings in Texas. I don’t think the growth in the names you listed can over come the declines in the top 5.
Ovi, I didn’t say they were overcoming declines in other counties. However, they do contribute meaningful production and are growing in some cases. Collectively, they make a difference and need to be included in the mix as the boundaries of the shale targets are expanded.
Upton County is making around 8,500,000 BO/month looking back to more reliable 6 month lag numbers vs around 7,500,000 BO/month the year before.
Ward County went from around 3,500,000 BO/month to 4,500,000 BO/month for the same general time period.
Individually, they may not move the needle of the big picture, but collectively they represent significant production and need to be included for monitoring growth/decline trends in the overall Permian volumes.
I think at least.
Do you see any of these counties growing production significantly?
Andrews, Ward, Winkler and Ector have a lot of shallower conventional production. I assume those counties (and maybe others) are getting a boost from shallower horizontal wells which are targeting residual oil zone?
Shallow, some of these edge counties are showing early growth signs like Dawson, Borden and potentially Ector if the Barnett continues to develop… the Barnett has also shown success in Andrews County. These are early plays and extensions that have unknown limits, so will be interesting to track to see if they contribute enough to offset decline elsewhere.
For example, EOG just completed the Panther C Unit D 2H well in Dawson and it made ~39,000 BO for both March and April. They also completed the offsetting Panther M Unit with similar results. Both of these wells are about 8-10 miles north of the Martin/Dawson county line.
https://www.hartenergy.com/exclusives/northern-midland-eog-brings-dean-oil-well-se-dawson-stepout-209530
SM, EOG, Ike and others have been accelerating permits/spuds and leasing activity in Dawson targeting the Dean and various Spraberry/Wolfcamp zones. Will probably be later this year before more reliable RRC numbers start to show this growth, but the signs are there now.
Borden has operators continuing to push the Wolfcamp and Spraberry edge north and east with stepouts. Someday the party will end when it defines the uneconomic edge, but not yet.
As I said before, individually they aren’t going to change much but collectively they are helping to offset more mature areas and may delay overall Permian peak a bit.
You are correct about the noise from the legacy conventional production.
Just got an idea, possibly slightly OT but maybe not, I have been watching the Gold Rush show on Discovery for many years, perhaps they could have a new show centered at LTO?
I would certainly watch, endless possibilities and both entertaining and educating.
(but perhaps a bit too scary though)
Shallow Sand/ Gungagalonga
By fluke I have back data for Upton. Upton has been in decline since January 2024. Look closely at the March green marker. Underneath is a blue marker. That is the production at the end of March in the March report. The production at the end of April in the April report is much lower, 226 kb/d. This is a sign of falling production. Upton had a second peak in November 2023. The previous one was September 2022.
I have reduced the number of red markers showing so you can see the green and blue. The projection just covers the green markers. This is also an indication the Upton drillers get their data in on time since there is very little difference between months when the updates are posted.
Ovi,
What lag have you assumed for rigs in your chart? Looks like maybe 5 months forward shift for rigs?
Chart for Martin County with Horizontal oil rigs shifted forward by 25 weeks ~ roughly 6 months. Rigs are weekly output is monthly output in kb/d from RRC.
Dennis
Lea 7 mths
Eddy 8 mths
Midland 7 mths
Martin 5 mths
In the Martin chart above and the other ones I posted last month I try to line up the rig and production trend as best I can with more emphasis on the last 6 to 8 months since the use of DUCs has dropped over the last year.
You see why I used 5 months for Martin County instead of six.
Ovi,
Thanks, 6 months looks pretty good to me, but I can see 5 could work, seems keeping a consistent lag from county to county makes sense, I doubt operators would change their timing when moving from one county to another so I would expect the lag should be the same in all 4 counties. So based on what looks like the best fit to you for all 4 counties, it looks like the average is about 7 months, I would use that for all 4.
Dennis
I have no basis for keeping them all the same. I think the best fit might account for differences in crews and technology.
As I noted above I know very little of what is happening in the field so for me best fit is the way to go.
I think in a few months we will have a clearer picture of how close the Permian to peaking.
Ovi,
If you are to use the best fit, you might use the fit to older data where you are relying less on a projection which may be wrong, maybe focus on the output data from 18 months ago to 7 months ago as it is very easy to get the projections wrong based on the RRC data. Mike Shellman said 7 months and he knows much much more than me, so that’s where I start, that’s why I used 6 months for Martin as straying more than one month from what the oil pro says seemed a bad idea to me.
I agree we will know more in a few months, the Permian may be at a plateau through December 2024 based on rig count, possibly beyond peak which looks like it may be in the Nov to Feb time frame for CTMA.
Dennis
I am trying to use the latest rig data, < 1 yr, to stay in the recent low DUC usage period and also possibly more use of 15 k laterals. The Texas projections are still a work in progress.
Ovi,
Got it, I think getting the projections right at the county level will be a challenge.
Dennis,
I think Ovi’s approach is better. Delaware for example is a deeper formation, the vertical drilling time is longer, and there is more work to be done due to the higher pressure. Midland is a shallower basin, so you get to production faster… I think it is fascinating that Ovi has teased-out the lags from the data, on a county level…
Kdimitrov,
I respectfully disagree, Martin and Midland Counties are right next to each other as are Lea and Eddy Counties, at minimum the counties in the same sub-basin (whether Delaware or Midland) should have the same lag in my view.
This comment is for all of those who think wind and solar are a low cost source of electric.
This time yesterday the PJM system had 30 GW of coal sourced electricity and today coal is delivering 22 GW. The 5 day wind drought is over and 6 GW is being supplied to the system.
What is ignored by so many is that the coal power plants that are now offline, had to have coal that was bought and stored on site. The staff to operate the plants had to available and trained and the plant had to be maintained in good working order. This is a real cost and because wind and solar have first in line privileges and the coal plants have to taken off line. The millions of customers on the system need a dependable supply of power and those coal plants make that happen. Eventually, one way or another, sooner or later those costs will be paid. Its great that on a windy day power from the turbines will be making $0.02/ kwh electricity but please let’s not think about all of the costs of fossil fueled standby plants.
ps. At 11:00 pm it was 80 degrees and no wind and no solar.
Ervin,
PJM can import electricity from other networks when needed. Natural gas is cheaper than coal with lower carbon emissions also hydro, pumped hydro, batteries, vehicle to grid, and demand pricing are all options, in addition wind and solar will become so cheap that syn fuel can be produced with excess electricity during times of high wind or sun and the stored fuel can be burned in natural gas peaker plants which already exist.
Dennis
You keep posting comments without any links.
what syn fuel exactly?
bosch who know a little about the subject see high prices well into the furture
https://www.bennetts.co.uk/bikesocial/news-and-views/news/2017/september/synthetic-fuel-fact-and-fiction
If hydro, pumped storage, and batteries are so cheap, why are companies with the best qualified engineers and economists building gas power plants and in China so many coal fired power plants?
https://energyandcleanair.org/publication/chinas-new-coal-power-spree-continues-as-more-provinces-jump-on-the-bandwagon/
Because China is communist and they’re all about inefficiency and corruption and human rights violations, so of course they’d do that. They’re also stupid and not long for this world. I bet they haven’t even figured out how to make solar panels or nuclear plants either.
– A Smart Westerner
TIM —
China leads the world in pumped hydro and is building a lot more.
https://www.eia.gov/todayinenergy/detail.php?id=57360#:~:text=China%20is%20building%20pumped%2Dstorage,more%20than%20any%20other%20country.
The world now invests bout twice as much in clean energy as in fossil fuels.
https://www.iea.org/reports/world-energy-investment-2024/overview-and-key-findings
Alim
All that counts is the total amount of emissions.
https://ourworldindata.org/co2-emissions
https://www.unep.org/resources/emissions-gap-report-2022
China by increasing coal burning to extraordinary levels of 5 billion tonnes has ensured a worst case outcome. Scientists studying the permafrost say much of it will now melt, it is already releasing millions of tonnes of methane and Co2.
https://geographical.co.uk/climate-change/the-big-thaw-melting-permafrost-is-causing-a-global-problem
I think it funny you are now defending China
I’m not defending China, just pushing back against your cherry picked data.
You were using that data to falsely demonstrate that nobody thinks thinks storage is a good idea. As soon as anyone pushes back with real data, you change the subject to the tundra or something.
It’s the Gish Gallop. If you had an opinion worth defending, you would, but you are just throwing stuff at the wall and seeing what sticks.
Tim,
Consider carbon emissions per capita and also consider that Western nations import a lot of goods from China and are indirectly responsible for a portion of the carbon emissions in China.
China’s per capita emissions are lower than the EU without accounting for exports and imports, about 20% of China’s output is exported (measured in dollars of exports vs dollars of GDP). Much of China’s exports are to the OECD.
Tim,
There is no syn fuel produced now, I am thinking about a future where solar and wind have been built out to 3 to 5 times average power load and during times of high wind or mid day sun there will be excess power produced that will have a price of zero due to over supply during those periods, excess energy could be used to produce synthetic fuel at low cost which could be used in existing peaker power plants for backup. The price might be cheaper than battery backup or a vehicle to grid system, if not then there would be no syn fuel, simply a potential option for the future.
Your article is about synthetic liquid fuel for automobiles, for synthetic gas see
https://www.sciencedirect.com/science/article/pii/S0306261919312681
China is building coal power to serve the electricity needs of its people, they do not have a lot of cheap natural gas like the US and Canada and their electricity use is growing at 5 to 6% per year.
Natural gas power plants can be built cheaply and quickly and in the short term seem cheap, but over their lifecycle they can be cheaper than coal, especially in the US where natural gas is quite cheap, but again over the long term these are a quick replacement for coal at lower long term cost, they are not cheaper than wind and solar in areas with good wind and solar resources.
There is some inertia in the existing system which is difficult to overcome and often engineers think short term rather than long term.
See https://www.rethinkx.com/publications/rethinkingenergy2020.en
It sounds like much of the new coal power plants will become stranded assets in China based on the article you cite, some new plants may replace older less efficient power plants which will reduce emissions as older plants with higher CO2 emissions per TWh produced are shut down.
China has a lot of HVDC transmission see
https://spectrum.ieee.org/chinas-ambitious-plan-to-build-the-worlds-biggest-supergrid
and
https://en.wikipedia.org/wiki/Ultra-high-voltage_electricity_transmission_in_China
Dennis…. ” excess energy could be used to produce synthetic fuel at low cost which could be used in existing peaker power plants for backup.”
No it wont! We have the perfect example already of why this is a clear non starter in the Haru Oni plant in the South of Chile. The first commercial batch (their term!!) had a process efficiency of just 1.6%, in probably the best location in the world for renewable energy with a 70% capacity factor of the wind in their location.
That process efficiency is before taking into account the capital costs, plus the operating and maintenance costs..
I’m willing to bet that the fuel used in all the vehicles driven to the plant by the workers and visitors to the plant, from the closest town Punta Arenas (41.5km), and back, use more fuel than is made by the plant, every single year it operates.
If the best location for renewables in the world, combined with a plant set up with everything scaled to operate at the best possible efficiency, operating with 100% of energy available, has a 1.6% actual process efficiency (theoretical efficiency was something like 5.8%), isn’t enough evidence of a non starter, I’d sure like to know what evidence would convince you….
Hideaway,
The synthetic fuel I refer to is synthetic gas for a power plant. This is an estimate of future cost using excess energy from wind and solar, the paper I cited has cost as low as 4.9 cents per kWh using zero cost electric output to power the process, this is to compete with batteries, vehicle to grid, or pumped hydro for backup power (or coal or natural gas). The estimates are for 2030, real cost is likely to fall between 2024 and 2030.
Dennis, do you read the papers you link to? The assumptions in the one above are ridiculous, and of course if you use such non sensical assumptions you can attain any solution desired…
Using one aspect you continually repeat, about overbuilding solar and wind capacity 3-5 times. Why would anyone do it? Why would anyone build extra solar when there is no market for a new plant?
If solar were capable of providing 100% of energy requirements in the year 2027 in grid XXX, then why would anyone build an extra plant?
Economics 101 means no-one would, because there is no payment for when the sun shines as existing solar would be providing all the power needed. However when the sun is not shining no-one has power, but building another plant by itself makes no economic sense, because there would be zero returns..
Any new build after 100% of grid capacity and use was reached, would require batteries or pumped hydro to store all the excess energy. This would greatly increase the cost of any new plant. A 100MW new solar array would need 800MWh of batteries attached, greatly affecting the cost of the operation, as all energy would need to be stored until night time, even in summer with longer sun hours.
They would not be selling this, much more expensive power, at zero dollars, at any time.
No-one with half a brain is going to build an expensive industrial plant, based on a theoretical zero electricity price. They would want/need contracts to purchase the required electricity. No-one is going to sign a contract that guarantees they get zero dollars for the electricity they are selling..
Other ridiculous assumptions, that the cost of all the equipment needed to build these industrial scale operations, based on lots of specialised equipment like electrolysers and methanation plants, requiring mountains of specialist metals and experts, will get cheaper in the future, when the ore grades mined get lower, requiring more fossil fuel energy to mine, as the newer mines are more remote on average..
Plus the biggest weakness of the entire paper, not a cent allowed for payment of any labor or expertise in the building and operating of the plant, zero, nada… Plus there is no cost in obtaining the CO2 either, yet they claim to be buying in the CO2, not taking any out of the atmosphere, so someone else has to be burning fossil fuels, then paying for the capture of the CO2, then delivering it to site..
The fact that you cite such nonsense as these types of papers, means you just don’t understand. As I keep asking you. How about you do the numbers yourself, from real existing examples, where we can find actual real world costs. It’s the only way to prove to yourself that it’s all viable, or not, on a worldwide scale..
Hideaway,
As is obvious wind and solar are intermittent, so 100% of energy requirements can only be provided by overbuilding wind and solar capacity as it results in a system with the lowest average cost per kWh consumed. The problems are solvable, suggesting that we should only attempt to do it if we have already done it strikes me as pretty silly. Producing either synthetic gas or hydrogen using low cost electricity from excess wind and solar output needs to compete on cost with pumped hydro and batteries, fuel cells or vehicle to grid, the lowest cost solution will likely be chosen, impossible to predict which technology will become the lowest cost solution. I linked to several papers which one in particular are you talking about, do you mean the 3 to 5 times average load? I imagine you might know that demand for electric power does not remain constant but varies over time. The existing power system has much more capacity than average load, the same would be expected from a grid powered by non-fossil fuel. This is not a ridiculous assumption, it is the way the real world works.
And not as ridiculous as suggesting the price of coal should be considered to be zero, now that was ridiculous.
US electrical generation capacity for fossil fuel, conventional hydro and nuclear power in 2022 was 8657 TWh (assuming capacity was used 24/7 for the entire year) and net generation for theses same sources was 3469 TWh in 2022. So capacity was 2.5 times net generation. Why would all of this excess capacity have been built when average load was 396 GW, but capacity was 988 GW?
Data from https://www.eia.gov/electricity/annual/
US average load on June 21, 2024 fluctuated from 443 GWh to 691 GWh. So simply covering diurnal fluctuation in demand for power we see the maximum to minimum change by over 1.5 times just over a single day. If we look over longer periods we have a minimum demand on April 14, 2024 of about 340 GWh and a maximum of 742 GWh on July 26, 2023, about 2.2 times higher at maximum vs minimum over a 10 month period. Average load from June 21 2023 to June 20, 2024 was 471 GW, so the maximum hourly load of 742 GW on July 26, 2023 was about 1.6 times average load for the year. For wind and solar the capacity factor is lower so it makes perfect sense that the ratio of capacity to average load would be higher for a system with 100% wind and solar.
They assume there will be a cost for CO2 up to 2050, after that based on current policy the price is less than the CO2 price expected to be charged in European markets so only transport cost of CO2 would be relevant. Price is 50 euros per tonne before 2050.
Just skimmed the paper, to properly analyze it would require a reading of the papers referenced as well, I have not done that.
Dennis … “And not as ridiculous as suggesting the price of coal should be considered to be zero, now that was ridiculous.”
The price of coal to humanity as a whole is zero, just like solar, wind, oil and gas. We build machines to turn any of them into useful energy.
We agree to pay others for access to these resources, but energetically they are there for the cost of building the machines to take advantage of them.
This is an area that economics is totally wrong, in not understanding the world economy runs on energy, not money.
When it comes to working out what’s the cheapest form of new energy, all sorts of rules and assumptions are placed, for example the Lazard LCOE type calculations. If you apply enough assumptions, you can make anything look good..
An immediate example is the assumption that 100% of the energy from solar and wind get used while coal, gas, nuclear are all limited in their capacity, when in reality the latter can operate 90% of the time.
In this country where solar and wind are often 40%+ of the power in the grid, the utility plants have to be turned off a lot of the time in summer months, because the wholesale price of power has gone negative, so are not operating anywhere near their capacity. Likewise coal and gas plants are having a similar reduction in capacity.
We’ve ended up with a very inefficient system with lots of capacity sitting idle, but still suffering from entropy, so their is a long term cost to this idleness.
Now in the middle of winter, we have had a dearth of wind over the last couple of months, and often cloudy days, so the coal and gas plants have had to be running at pretty much maximum power, with diesel generators often added to the mix for peak times..
So tell me, in economic terms, who is going to build extra solar capacity, when we already have utility solar plants often turning off when the sun shines and prices are negative??
Adding solar does nothing for the system in times of low sunshine, while existing solar is already above what the system can cope with when the sun shines most of the year!!
Already the only new large solar plants planned for the country are those with direct contracts with an industry to supply power when the sun shines, but ‘the grid’ is expected to make up the power supply the rest of the time…
Why are solar, wind and batteries having subsidies around the world if they are cheaper?? The answer is they are NOT cheaper in the real world!!
AS I keep stating, no-one anywhere is building an off grid Aluminium smelter based on solar, wind and batteries, because it’s too expensive to do!! It’s uneconomic, would lose money compared to cheap coal fired power running Aluminium smelters around the world.
This is precisely why the new Aluminium smelters in Indonesia will be running on coal fired power!!
It’s not good or bad, it’s just reality, and lying to ourselves over and over and over that solar, wind and batteries are cheaper, doesn’t change reality at all!!
Again my question to you is how does anywhere get to 3-5 times too much solar, in an economic environment, where already there are negative prices for solar, when the sun shines most of the year???
Economics 101 is that no new utility scale solar should be built in Australia and that’s exactly what’s happening, we built too much, so negative prices prevail during most of the year when the sun shines, but we need enormous ‘other’ power for the rest of the time.
Dennis …”Just skimmed the paper, to properly analyze it would require a reading of the papers referenced as well, I have not done that.”
Exactly, which is why all these types of proposals look sound until you go into details, where they clearly are extend, pretend and distract.
The Haru Oni plant was thought to be proving synthetic fuel was ‘viable’, instead it’s clear evidence it’s not viable at all from intermittent power, despite their 70% capacity factor in the best location in the world for wind.
It was really all about having the European commission drop rules banning new ICE vehicles by 2030 or 2035 date, paid for mostly by Porshe, Exxon etc..
The entire concept of synthetic fuel, gas or just hydrogen is totally flawed by using enormous quantities of built materials (built from fossil fuels!!), in an extremely inefficient way to make some energy available when the wind isn’t blowing and the sun not shining. It’s all extend, pretend and distract…
The longer you just skim some papers that show nice answers, while not doing the full calculations on all of this yourself, the longer you will stay in the dark about the reality of our situation.
Hideaway,
In the US even without subsidies, wind and solar are cheaper than fossil fuel power in good locations. (These are roughly the Great plains and Texas for land based wind, and the southwest for solar for the best locations in the US). Power purchase agreements are typically about $30/MWh or less, there has always been excess capacity from power providers as electricity demand is not constant so the problem of idle capacity is just a real world fact.
The point is to reduce carbon emissions as much as possible, synthetic natural gas or hydrogen are one possible energy storage mechanism for excess electric power, others are batteries, pumped hydro, or vehicle to grid whichever is cheapest will be used and despite what you believe the World economy focuses on money, energy is not everything despite your illusions.
Early days for these types of processes, solar was about $240/MWh in 2010 and fell to about $40/MWh in 2022, so about 6 times cheaper in 12 years, perhaps costs for producing hydrogen or synthetic natural gas also decrease in the future.
The Haru Oni project is to produce liquid fuel, a different project from simply producing hydrogen. Producing synthetic liquid fuels is not likely to be the best approach in my view.
Excess wind and solar output can be used to either charge batteries, pump water to a reservoir to be used later in a hydro plant, or to produce hydrogen to be stored and used in a power plant when needed. Often there are stranded assets as there is technological progress or investments that do not pan out. Coal and natural gas power plants will eventually become stranded assets as wind, solar, hydro, nuclear, pumped hydro, batteries, and perhaps hydrogen (produced with excess power from other energy sources) replace fossil fuel as an energy source.
Dennis
You never touched on the economic cost of this new low carbon system. Take away all of the financial and legal benefits to solar and wind and none would be built. Just explain your understanding of the cost for all of the standby dispatch-able power. At what cost of electricity do you feel is too high for us to bear? Did you know that in July 1911 the temperature in Bangor, Maine reached 106? And carbon dioxide was in the middle low 300s ppm. How???
Ervin,
Weather is variable. The economic cost of a low carbon system will be lower, especially when external costs are accounted for. Temperature records at a single location for a single day don’t tell us much.
Chart below has average inflation adjusted elctricity prices for the US from 1960 to 2024. The general linear trend over this 64 year period has been lower electricity prices at about 0.13 cents per year.
Despite what you believe electricity prices are likely to decrease as we move away from fossil fuel.
https://www.eia.gov/outlooks/steo/realprices/
Was it cheap NG contributing to lower prices?
Dan,
That may be part of the story during some periods. The Chart below looks at real prices for residential electricity and natural gas in 2023$. There is more to it than just the price of natural gas. I can only find data for the price of natural gas sold to electric power producers back to 1997.
The percentage of US net electricity generation from fossil fuel has generally been decreasing from 1960 to 2023.
Data from
https://www.eia.gov/totalenergy/data/annual/
Dennis
Can you explain why the countries with the highest amount of solar and wind as a percentage, have the highest electricity prices?
Tim can you cite some examples of where you have in mind?
Some of the nations with highest proportion of wind and solar generation in Europe are Denmark, Greece and Spain and they have among the lowest prices in Europe, except those nations with large hydro resources such as Norway and Sweden whose prices may be lower. Some of the differences between nations are due to different tax policies so I looked at electricity prices excluding taxes.
https://countryeconomy.com/energy-and-environment/electricity-price-household
Prices are higher than the US due to higher prices for coal and natural gas in Europe relative to the US.
If one looks at the US, some of the sates with the highest proportion of wind and solar net generation (Iowa and Texas for example) have very low electricity rates.
If you are talking about small island nations, you need to look at the price of electricity over time, prices for electicity in those places has always been high as the energy must be imported in many cases and they are usually not connected to a larger grid.
Texas percentage of non-hydro renewable electricity net generation on right hand vertical axis and real electricity price in 2023 $ (cents per kWh) on left vertical axis.
I hope Ervin et al can see the correlation here, for me it´s quite simple but since we have plentiful of both hydro and wind in the north of Sweden I´m a bit biased. However I think there are several regions in North America with the same or even better conditions.
All of which will of course reduce the need for NG electric generation. Possibly also the offshore market for LNG.
Dennis,
If solar, wind and batteries are such a good energy system, could you show me a steel mill that operates with just solar, wind and batteries? or how about Concrete plant? Or a city?
If they are as good as you think somebody somewhere should have done this.
Why hasn’t Hawaii gone all solar and wind ? They have a lot of solar and wind and they have to import fossil fuels so they should be a prime candidate for an all renewable system. Same for Taiwan.
“ It gets 33 percent of its electricity from rooftop solar and has 60 utility-scale renewable energy projects feeding power into its grids. The state Legislature wants to reach 100 percent renewable energy by 2045.”
One third from renewables is not shabby. The number is likely higher. Many homes have solar hot water that doesn’t ever register on a meter.
https://www.scientificamerican.com/article/as-hawaii-aims-for-100-renewable-energy-other-states-watching-closely/
Just remind me how many heavy industries does Hawaii have, that use large amounts of electricity?
None but we’ve had this discussion before. Geothermal, hydro and nuclear can all be used for heavy industry. See the Alcoa aluminum plant in Iceland as an example.
Electricity prices are high in Hawaii, part of this is just the cost to import fuel for electricity production, as the cost of oil and natural gas increased from 2001 to 2010 electricity cost increased making wind and solar more attractive. Hawaii’s industry is tourism and retirement living basically a service economy.
Dobbs,
Just because some thing does not exist now, does not mean it won’t in the future. You have set the bar high, with wind, solar, and batteries only. The system as a whole will use non-fossil fuel (hydro, solar, wind, geothermal, nuclear, pumped hydro, batteries, fuel cells, and synthetic gas or hydrogen produced with excess electricity produced during the middle of sunny days or during times of high wind and used in peaker electric power plants when needed.)
Many of the things we take for granted today would have been considered science fiction only 60 years ago. These are problems that can be solved, just a matter of getting to work to solve them.
https://www.prnewswire.com/news-releases/new-book-brighter-explores-the-future-of-environmentalism-amidst-the-greatest-technological-transformation-in-over-a-century-301705853.html
Dennis
You go on and on about how solar and wind are the cheapest forms of energy, but when you look for big energy users actually going with wind or solar you don’t see it anywhere.
Seems to me that is a big red flag that there is something very wrong with the analysis that says wind and solar are the cheapest forms of energy.
Dobbs,
There is a lot of utility scale wind and solar power that has been built in the US, in Texas 27.2% of electric power was from wind and solar in 2023 (mostly wind power). Texas has some of the cheapest electricity prices in the US and the wind and solar has to compete with very cheap natural gas prices in Texas.
Data from EIA
https://www.eia.gov/electricity/data/browser/#/topic/0?agg=2,0,1&fuel=vtvv&geo=0000000002&sec=g&linechart=ELEC.GEN.ALL-TX-99.A&columnchart=ELEC.GEN.ALL-TX-99.A&map=ELEC.GEN.ALL-TX-99.A&freq=A&ctype=linechart<ype=pin&rtype=s&pin=&rse=0&maptype=0
Dobbs,
Some information on solar costs as of 2022 (report from 2023)
https://emp.lbl.gov/sites/default/files/emp-files/utility_scale_solar_2023_edition_slides.pdf
This year nearly 600 GW of new solar is expected to be installed worldwide. For context, the United States has a total of about 1,300 GW of electricity generation capacity.
When it comes to new tech, there are two naïve arguments. The optimists say “It’s growing fast” and the pessimists say “It isn’t there now so it never will be”. You belong to the second camp.
New technologies enter the market through niches. Groups of early adopters find it useful for their niche and buy it. That creates enough demand to increase production runs and drive down prices, which opens new opportunities. If you see a new product filling more and more niches, chances are it will do big things in the future. An example of this is battery technology.
Portable phones started life as “yuppie toys” that people enjoyed finding annoying. Now there are billions of them, and land lines seem almost quaint.
That is why the argument that “it won’t work in this niche” isn’t very reliable.
The other issue is rollout time. As mentioned already, solar is now rolling out at an insane rate. “It isn’t there yet” may not have a very long shelf life as a viable argument.
I recommend “The Innovator’s Dilemma”, a classic book on high tech marketing.
Dennis
If you look at this energy price map and compare the percentage of electricity produced from coal you will see a strong correlation, obviously there will be some exceptions but on the whole the more coal used as a percentage the cheaper the electricity.
https://www.cable.co.uk/energy/worldwide-pricing/
https://ourworldindata.org/electricity-mix
Electricity prices in China and India are far cheaper than Germany, Denmark, United Kingdom, which have very high levels of wind and solar. Poland right next door to Germany has much cheaper electricity and burns a great deal more coal.
India has stated that it intends to burn 1.4 billion tonnes of coal by 2028. They are not stupid they are simply putting the ecomony and security of supply ahead of environmental considerations.
The booming economy is good for the wealthy, the environmental consequences will hit those who cannot afford the higher food prices.
https://frontline.thehindu.com/columns/india-heatwave-2024-deaths-crop-failures-economic-impact-climate-change/article68320074.ece
Tim,
The average price of electricity in China in 2021 based on your link was 8.4 cents per kWh, in Texas with about 24% of electric power from non-hydro renewable power the average price was about 9 cents per kWh similar to India’s price. Also note that India has both a higher proportion of coal power than China and a higher price for electricity. Europe has high electricity costs in part due to high taxes and also due to higher cost for natural gas and coal. Many of the low electricity cost nations are oil and/or natural gas producers in Africa and the Middle East. Russia also has low prices and uses only a small amount of coal (16%) for electricity. US also uses only about 15% coal for electric power and has relatively low prices (10.9 cents per kWh).
Interesting stuff thank you.
Dennis
It is a complex task to compare all the factors, coal, gas, hydro etc.
One factor in the U.S. is the huge amount of very cheap gas produced in several states which obviously pushes all costs down.
We also have to look at subsidies, I believe China subsidises coal in various ways to the tune of $100 billion something that India cannot afford.
In Europe there indeed are taxes, but a good share of these go pay for the expansion of the grid which is paid not by the wind power companies but by the governments.
I guess I should have included gas in the equation. U.S. wind and solar is small, over 60% comes from coal and gas and the U S is in a very small minority of having vast amounts of cheap gas. The only other countries so lucky are Russia, Iran, Qatar and a couple of others.
You rightly say a good number of countries with cheap electricity are big producers of oil and gas.
Cheap coal, cheap gas and oil exports make cheap electricity. It’s still all based on what is buried in the ground.
Tim,
I agree the problem is complex. Although the claim is often made that wind and solar make electricity expensive, China (15%) and Texas(25%) are examples of relatively high wind and solar generation and relatively low electricity prices. Many other places where electricity prices are high have higher taxes boosting the price of electricity or other constraints such as policies to increase fossil fuel prices or high fossil fuel prices due to lack of supply. Like most cases the answer cannot be boiled down to one thing and the answer varies from place to place.
Dennis
Texas wind and solar production is not high, look at the global data.
https://www.eia.gov/todayinenergy/detail.php?id=61783#:~:text=
Texas is burning vast amounts of gas that makes electricity cheap. The gas sold in Texas is a fifth of the price in Europe. Cheap gas burnt in power stations makes cheap electricity.
When you look at countries that do have high wind and solar ( above 40%) they all have electricity prices that are in the top 10% in the international table.
It is not complex, economics dictates that the cheapest resources with the best returns are exploited first. That is why China burns 5 billion tonnes and India intends to increase coal production to 1.4 billion tonnes.
If wind and solar are so cheap why is the E.U. Supporting a scheme that will pay wind and solar €28 billion over and above market prices?
https://www.euronews.com/green/2022/12/22/the-eu-has-approved-a-28-billion-german-renewable-energy-scheme-but-is-it-fair
Tim,
You said it was complex, I agree. Now you say it is not complex, I don’t agree with that.
China is using coal because it can be ramped more quickly to meet current power needs.
From an environmental perspective and an economic perspective that takes account of both internal and external costs wind and solar are far cheaper. That is why gross generation of wind(20.7%) and solar(26.8%) power are expanding at much higher annual growth rates in China than the rate of growth of coal power (5%) since 2020. If these rates of growth for wind and solar continue the rate of growth in coal power will slow down to zero and then wind and solar will replace coal power as wind and solar continue to grow. Look at prices over time for electricity in Texas
https://peakoilbarrel.com/opec-update-june-2024/#comment-777453
For link to average annual output data for Texas see
https://peakoilbarrel.com/opec-update-june-2024/#comment-777504
The Germans are subsidizing wind and solar to reduce carbon emissions more quickly.
Note that the cost of wind and solar varies from place to place, solar is better in southern Europe in most cases, wind may be better further north.
Greece and Spain both have high wind and solar at 40% or more and their prices before taxes, much of the high price in Europe is due to high taxes.
see
https://thingler.io/map
without taxes, Poland’s price is 12.75 eurocents per kWh, Spain’s price is 9.72 eurocents per kWh and Greece’s price is 12.52 eurocents per kWh.
I agree Texas wind and solar output is not as high as in some European nations, it has increased by 19% over the past 10 years, with the recent rate at roughly 2% per year. Texas is doing much better than the rest of the US (except Iowa).
Iowa had 60% of net generation from wind and solar in 2023, the average price of electricity was 9.43 cents per kWh and the average for all of the US was 12.72 cents per kWh.
Texas has tapped into less than 1% of its solar energy reserve, thus far.
Dennis … “then wind and solar will replace coal power as wind and solar continue to grow.”
Just remind us how cheap and how much solar we need to produce solar power between 8pm at night and 6am the following morning, for any of the continuous industrial operations you want us to build, to produce more solar, more wind, more batteries, more EVs, more, more, more…Remember to add all the solar at night for the new mines, for all the new minerals with this constant expansion.
We’ve been having a wind drought, easily seen in wholesale price of electricity in this country (and proclaimed by AEMO no less!!), so wind is not necessarily a good back up for solar at night….
Hideaway,
The entire nation is seeing a wind drought? That is where stored hydrogen would be used, though typically for such a large land mass widely dispersed highly interconnected wind and solar resources would require very little backup. Also batteries can be used for backup at night. Aren’t different areas of Australia interconnected? Lots of coal power use in some states which I would think could be sent elsewhere when needed.
Industrial operations do not have to be continuous.
Dennis, as per usual it’s one hand wave after another….
“That is where stored hydrogen would be used,”
OK, so do the calculations on that, how much hydrogen would be needed to be stored, plus all the extra equipment that needs to be mined to build it all, plus all the extra workers in both construction and O&M.
None of it is a hand wave, it’s extremely expensive, and if ‘everyone’ around the world needs to do it we run into shortages of all sorts, like molybdenum that we mine in the ppm range but is needed in the 2.5-3% range in all the stainless steel pipes needed in all the stages of hydrogen production and piping to storage.
The other ‘alternative’ is lots of long distance HVDC transmission lines in the many GW range and lots of batteries elsewhere in the country to send the solar from outback Queensland South for maybe only 5%-10% of the time…
All the hand wave solutions you offer are extremely inefficient when it comes to material use, with all these materials (mostly metals) having an extremely high energy cost to produce, which is mostly from fossil fuels…
YOU are advocating the burning of a lot more fossil fuels as your solution to burning too many fossil fuels, because you refuse to look at the details of your suggestions, preferring the hand wave as it sounds easy…..
Another example of the hand wave…
Dennis …”Industrial operations do not have to be continuous.”
Anything using high, which is most heavy industry, would be wildly inefficient if they had to wait for everything to heat up again before commencing, only for the power to go out again soon after resumption, plus there is a lot of equipment that must be heated slowly and cooled slowly so the machinery is not damaged. It’s often not something that can just be stopped because the power is suddenly low..
It’s interesting that both Carnot and myself totally destroyed the argument about using stored hydrogen from ‘excess power’ a month or 2 ago, but you didn’t learn anything, and just repeat the same rubbish.
The water used for electrolysis is heated to a nominal temperature, needs to be very pure and often is a weak alkaline solution, with no energy allowance for the huge quantity of water used (the pure water magics itself to the electrolysis plant for free). Like most things it’s most efficient when in a continuous operation, so having these giant electrolysis factories sitting idle most of the time waiting for excess electricity from the grid, is a non starter economically and another waste of resources in building it.
So when do the workers turn up at these giant electrolysis plants waiting for electricity to become available?? Do they sit there twiddling their thumbs getting paid to do nothing when there is no power??
The world can only be this nice bright green future providing you don’t look at any details of it, hand wave every aspect into existence, then year after year wonder why it’s not really happening, and we are only tinkering at the edges. It’s because reality gets in the way of ill thought through dreams.
BTW after 2 years of back to back 25-30% power price increases, while the percentage of renewables in the grid has gone up, we now find we need a whole lot more transmission lines that will add another 22%-30% in real terms to prices over the next few years, for this power that is meant to be cheaper…
Its all going to cost a hell of lot of money, and the most costly will to be doing nothing…just keep using fossil fuels as if they are unlimited and that that there is no economic cost to global warming.
And every attempt to offset depletion will cost a lot of money. At some point it will be more than humanity can afford, and population will fall. The hard way via wars and poverty.
More and more of available capital and debt will have to go to the energy sector, just to keep up the attempt to run in place.
Some people seem to be under the illusion that we have a viable choice of just doing nothing new. Illusion can be pleasant for a while.
Hickory,
The other problem is that people think the answer is to stop doing what we are doing, and although this is right, the answer of what should be done instead is wrong. The answer many point to is degrowth and less technology. I agree with less growth in population, but I think the change we should make is to different technology and looking closely at the lifecycle assessment of newer technology compared to what it replaces. We can create a better future with appropriate policy, planning, and forethought, but we must think long term.
Hickory, …. “Its all going to cost a hell of lot of money”…
This is the criteria that economists use, thinking that there is no limit on money, yet in reality, energy, materials and expertise is what’s needed. We use money to represent all of these things and economists have convinced most of the world to think this way (as in it’s all unlimited).
It has worked in a world of continuing growth of all the resources necessary, especially energy that makes both materials and expertise available. The energy has been in the form of fossil fuels over the last 200 years, with everyone alive, their parents and grandparents all existing in a world of ‘more’ on average for everyone..
In the future, once past peak oil, for real, no matter what the spend, then the price to build everything goes through the roof. None of the electric world survives without constant input of plastics and polymers, every new electrical wire, solar panel and wind turbine totally relies upon plastics and polymers, every mine relies upon chemical ingredients from fossil fuels as well as the fossil energy to run it…
Fossil fuels are not just energy, though that’s how everyone counts it in terms of XYZ TWh… It’s useful energy AND products all wrapped up together that we ‘ refine’ (one word for a huge variety of processes), to separate all the products gasoline, plastics, diesel, fertilizers, bunker fuel, polymers, kerosine, tar, explosives, coke etc.
We need to mine 100% of it to get all the fractions for the necessary purposes we’ve put them to, in the world we’ve built. We haven’t built a different world and if we tried to now, it would take a lot of new materials to do it..
We can’t just mine plastics and polymers, fertilizers, explosives, chemicals for mines, farms, industry etc. We need high grade coke to make Aluminium and steel, both coking coal and pet coke, likewise for thousands of products.
Trying to swap, one energy form for another that doesn’t produce the products we need for modernity, doesn’t work and can’t work. Sure in the short term while we continue to use MORE fossil fuels to make all the ‘alternatives’ it all looks possible, but take the fossil fuels out of any part of system of renewables production and deployment and the concept instantly becomes unviable.
Every single paper written about the ‘renewable’ future looks at bits in isolation, never ever the entire system, because it only looks doable if we treat everything as separate, like the rest of the system acts normally as we multiply solar by magnitudes or batteries by magnitudes etc, then look at current prices of all the components, extended into the future as cheaper… ( A simple example of the absurdity of the ‘research’ ; if we used 600% of world silver production for the silver paste in magnitudes more solar production, then solar and silver will get cheaper because of economies of scale). Ask any ‘hydrogen future’ expert, about Molybdenum and the reply will probably be “what’s that got to do with it”….
We can’t do the mining, the processing, the transport, the refining of materials, nor the manufacturing of any of them without using fossil fuels at every step. What’s worse, is that despite all the talk of transition for several decades now, no-one anywhere is trying to build any of it without fossil fuels. Why not??
If a future of modernity was possible without fossil fuels, then why aren’t we building any of it without them?? Why aren’t new mines and factories built to operate on only renewable energy using only materials gathered by, using, and made from electricity?
Why isn’t there at least one demonstration plant somewhere in the world showing it’s possible??
If it was at all possible, and having solar panels for over 5 decades and wind turbines longer, then we’d be doing it. We’d be building the future with electricity and multiplying up everything from the huge excess energy from this electricity.
The plan is not working, and cannot work, so we need a better plan. So far all we are getting is extend, pretend and distract.
If we can’t work out a better plan then the best thing to do is power down, reduce population and degrow as fast as possible before we turn the planet into having an unlivable climate, with huge starving populations destroying the remainder of the natural world.
Go and read the paper Dennis provided above, the one he didn’t read in detail. It makes all sort of assumptions about how improvements in technology will make doing A, B and C much cheaper in today’s dollars (2017 dollars to be precise), and somehow assumes all the materials to build it also become cheaper and less energy intensive, all because of the magic of technology…
The current system of fossil fuel use can’t last, because of pollution, climate change and depletion, it has never been an answer, as it was always a temporary short term way to produce modernity. As we haven’t worked out how to maintain modernity without them, let alone ‘grow’, the extend, pretend and distract model just guarantees we continue on the same path we’ve been on, until it all collapses.
Hideaway,
The assumption that something that has never been done cannot be done is a poor one. There are many counterexamples throughout history.
Fossil fuel use can be reduced as less of it is used for energy, the fossil fuel needed for material inputs can continue to be extracted as needed. As energy from solar and wind become abundant in the future, more and more processes will find it cheaper to eliminate the use of fossil fuel, where this is impractical fossil fuel will continue to be used.
Economics is all about the allocation of scarce resources to meet human needs. Scarcity is how economics is defined.
Dennis, usual error in your thinking…
“As energy from solar and wind become abundant in the future,”
Over the last 2 decades fossil fuel use, in total TWh, has grown by an order of magnitude more that solar and wind. They have not replaced any fossil fuel use on a world wide scale, they have been added on top of fossil fuel use as part of all energy use, which is going up in TWh use per year faster than the added solar and wind..
Look at the numbers yourself, it’s obvious!!
Abundant is a relative term, not a factual one. In another 10 years, unless we run into real peak oil that is, that most expect, fossil fuel use will still be growing faster, as in more TWh added every year than solar and wind, with the barrier further and further away, just like it’s been for the last 20 years.
Once we are several years past real peak oil, with an accelerating decline in production, solar and wind will stop growing as the world will not be able to afford them. Only then will you understand how wrong were your assumptions and how renewables are just derivatives of fossil fuels.
You want mountains more solar, wind and batteries, then you get mountains more fossil fuel use building it all, from the new mines, processing plants, transport, smelters , refineries, factories etc etc etc. In other words the entire industrial system has to grow to build it..
You are obviously in favor of tearing up more rainforests, sending more species extinct and making the climate unlivable for humans and most other life, by this insatiable desire to continually build more and more. Renewables are not going to save anything, it’s just a continuation of the industrial civilization that turns the natural world into goods, then into waste to be replaced by more, more, more!!
Hideaway,
Let’s look at electricity generation as we won’t have to get into the fact that 60% of fossil fuel used to produce electric power is just wast heat so counting that waste heat as TWh as if they are useful is silly, the exergy is what is important unless the fuel is being used as a heat source only.
From 2019 to 2023 Electricity generation from fossil fuel increased from 17103 TWh to 17957 TWh (an increase of 854 TWh). For wind and solar electricity generation from 2019 to 2023 the increase was from 2127 TWh to 3967 TWh (an increase of 1840 TWh).
It is correct that fossil fuel use has continued to grow, but the rate of growth of fossil fuel exergy from 2019 to 2023 has been about 1.2% per year while wind and solar consumption have grown at about 15.8% per year. In a few years fossil fuel consumption will decrease as EV transition continues and replaces oil and as wind and solar continue to grow replacing coal and natural gas power plants and as heat pumps replace boilers and furnaces and water heaters.
If wind(12.6%) and solar(21.2%) annual growth rates of the past 4 years continue in the future, fossil fuel exergy consumption is replaced by 2041 by non-fossil fuel in that scenario.
We will run into a peak in fossil fuel use, but it will be lack of demand rather than lack of supply that causes the peak.
I expect the demographic transition will expand to the entire World and population will peak and then decline, I also expect there will be more recycling of materials reducing the need for mining and less fossil fuel use will also reduce environmental destruction. As population declines output will also decline relative to the population peak. Building more well made durable goods designed with recycling and repair in mind will reduce waste. Many changes are possible. The future may be much different than today, how it plays out depends on our choices.
Dennis, you don’t get it at all…
“Let’s look at electricity generation as we won’t have to get into the fact that 60% of fossil fuel used to produce electric power is just wast heat so counting that waste heat as TWh as if they are useful is silly, the exergy is what is important unless the fuel is being used as a heat source only.”
Dennis that ‘waste heat’ is not part of the EROEI calculations at all, which is the important aspect to run a modern civilization. It never comes into it..
The EROEI calculations look at the energy used in the construction and O&M of the operation.
We built the system of modern civilization by placing the power stations next to the coal pits, those closest to cities to start with, then transmission lines to those cities. The amount of coal burnt was irrelevant, only the power output was counted.
The cost of building the power plants and transmission lines was relatively cheap, and through time we had efficiency gains at these plants by using bigger machines to mine the coal fed into the plants via conveyor belts etc, using less labor in the processes..
This cheap power allowed us to build all sorts of machines cheaply. We thought it could go on forever, so as we grew, we built the power plants further away, using less desirable coal, then even further away buying coal from elsewhere if the close by coal ran out.
It became less efficient in some ways while overall efficiency in other ways improved, by using more efficient generators, more automation, larger machines at all the coal pits, larger machines transporting it all etc. All the extra materials and machines being provided by other fuel mostly cheap oil and gas and operated by them..
The system of civilization we set up, relies upon power at night, so while coal and gas have waste heat, they provide electricity when needed and used by the civilization we have.
Can you for once work out the actual material and energy cost of providing batteries and hydrogen or whatever backup for the times when the sun isn’t shining in winter and the wind isn’t blowing, instead of the wave of the hand you usually do..
It’s only going into this detail, that you see the ‘hand wave’ of solutions don’t work, unless most people are slaves and very few get to enjoy modernity.
I keep telling you it’s an entire system we have, not lots of separate bits that can only grow massively if the rest of the system operates normally. When you want to massively increase A and B it comes at a cost to C, D, and E.
We do not have the unlimited resources to build it all, and by trying are in the process of making the planet unlivable, destroying most of the ecosystem in the process, while we only have a 2-3% penetration of renewables.
Dennis …. “If wind(12.6%) and solar(21.2%) annual growth rates of the past 4 years continue in the future,”
OK do the calculations on this, how many more Adaro type of Aluminium smelters running on coal are needed to produce the Aluminium for the frames of all these new solar panels? Plus of course the EV panels, plus of course all the new transmission lines, plus more, plus more, more, more….
How many new factories are needed to be built to keep up this growth rate? Do these new factories need power ,water, roads, gas, coking coal? Or do they just magic into existence? Do they use concrete in these new factories buildings? Do all the new workers, mostly in developing countries use the new higher wages to power their homes, buy appliances. Do you think we need more of these? Or is all from slave labor?
You never think through the entire argument of building MORE, of growing anything.. It’s all just more of the same that we’ve had for over 200 years, more growth leading to more environment destruction, and getting closer to the point of collapse where oil production declines at an accelerating rate…
The only choice we ever had was to go down the path of industrialization, guaranteeing collapse when the major energy went into depletion, or not building an Industrial civilization in the first place.
Your method of making statements of we can do this, that, and all sorts of other things, while never doing the exact calculations on the energy and materials to build it, is just a belief system to help you sleep at night. It’s not a part of our reality…
The simple reality is we have added fossil fuel use by 10 times more energy in the last 20 years as we have added from renewables. Plus renewables are not replacing anything, they are being added to all existing energy use, all to the detriment of the ecosphere.
Advocating for more just means more fossil fuel use to build it, because we can’t build it with just electricity from renewables, as it’s uneconomic to do so. The EROEI is too low (and probably negative when ALL energy building them is taken into consideration)!!
Dennis
You do appear to ignore any uncomfortable facts that would tear down your rosey view of the future. This report and others, tell us that we are heading towards the very highest range of global climate predictions.
https://wedocs.unep.org/bitstream/handle/20.500.11822/43922/EGR2023.pdf?sequence=3&isAllowed=y
Fact; global emissions needed to be over 10 billion tonnes less for each of the last 20 years.
It has been over 30 years since I first saw a programe highlighting what would happen if we continued to deforest the planet, destroy the topsoil and burn the oil and coal as we were.The things that scientists feared are now happening, this is now.
https://www.france24.com/en/asia-pacific/20230620-himalayan-glaciers-melting-faster-than-ever-endangering-critical-water-source-scientists-warn
The time for maybes, hopefully and we could are gone, those times were wasted away in the past 30 years.
https://ourworldindata.org/greenhouse-gas-emissions
Looking at soil erosion, water loss increased droughts a team of scientists have calculated that global deaths rates will increase from 60 million per year to around 150 million per year. This would just leave enough food and water for those alive to exist.
This is grim and no wonder people concentrate on the maybes
Tim,
Climate change is a big problem, I agree. Much time has been wasted not doing enough to solve the problem, I agree with that as well. I do not picture a rosy future, that is your imagination. There is a problem, I am looking for solutions, I believe increasing wind and solar, EVs, heat pumps, education, empowerment of women, better efficiency in the use of energy, more recycling, better urban design, more vegan diets (helped by meat substitutes). The first step is to eliminate fossil fuel use for energy, then we work on methods to remove CO2 from the atmosphere though these projects can we worked on simultaneously. The work will be difficult and the road will be long, time to get to work.
We cannot turn back the clock as far as I know, worrying about what should have been done is of little use. Only the road ahead matters.
Hideaway,
Population will peak in 15 to 20 years, at roughly 9 billion then population starts to decline. A lot of the human footprint on the environment is agriculture, this foot print can be reduced massively with the elimination of meat production, damage to the atmosphere can be minimized with the elimination of fossil fuel use for energy.
Energy return on energy invested is Energy out divided by energy in as far as I know it includes all the energy not just the net energy so waste heat is included in the calculations.
Dennis,
Or, direct air carbon capture tech accelerates and thrives as an industry to completely reverse the apparent fossil fuel inspired climate change… It’s currently happening now too and is also potentially as viable as renewables. Swings both ways for something that has never been done…
Perhaps the solar and wind industry growth stalls for decades due to humanity being able to exist with fossil fuels/carbon capture balance as long as the price and supply are supported by the solar/wind vs. fossil fuel pricing market.
The future is so fun.
Gungagalonga,
No point in using fossil fuel as an energy source if non-carbon sources are cheaper. Direct air capyure is quite expensive at present, there may be better methods for reducing carbon in the atmosphere, once zero carbon emissions is reached, more carbon will need to be removed from the atmosphere to achieve a stable climate. Continued use of fossil fuel for energy long term is not a viable option.
Anything is possible I suppose, hopefully humans are smarter than you imagine.
Dennis,
If carbon in the atmosphere is under control and reduced, additional fossil fuel burning, under what would raise atmospheric carbon, would be immaterial. Fossil fuel would then still compete with wind and solar, etc for the lowest price wins.
By reducing fossil fuel burning to a point that in combination with carbon capture that the atmospheric carbon density gets below the government set target, we are free to burn that fuel. So, a coexistence of fossil fuel and carbon capture and renewables could coexist. As long as it’s in balance.
Then, of course, the next topic starts… did humans overshoot the reduction in atmospheric carbon and now we kicked off a new ice age…. then burning fossil fuel may be required as an offset to balance global temps to the upside so we don’t freeze to death and stop sea level drops. This is certainly a possibility. In the mid 20th century, global cooling was a concern for many in the scientific community.
Dennis, meant to also add that… underscoring your point that the wind and solar cost per unit of energy produced has dropped significantly over the past 10 or so years as the learning curve ramped up…. so may also happen with direct air carbon capture. What happens if direct air CC economics and capacity ramps up to directly control carbon percentage in the atmosphere to acceptable levels? Fossil fuel burning may then be enjoyed and harmless.
You have to admit the possibility.
Gungalonga,
I am optimistic, but not delusional (though many might disagree). Currently burning fossil fuel with CCS is far far more expensive than wind, solar and batteries. Direct air capture of CO2 with sequestration is far far more expensive than CCS with combustion.
Global cooling was a concern because of high levels of pollution and was eliminated as a concern with the clean air act in the US and similar measures elsewhere. Once we get atmospheric CO2 to 350 ppm, we just stop doing anything extra to stop reducing atmospheric CO2 and as long as we don’t start emitting other greenhouse gases than climate may stabilize (though it is no doubt more complex than this, I am not an expert).
If burning fossil fuels with carbon capture and sequestration in power plants becomes cheaper than wind and solar power then it might be chosen, I just am very skeptical this will ever be the case.
Gunga…
I haven’t yet seen any man-made CO2 sequestration mechanism that isn’t an energy hog.
Have you?
Its takes energy to grab and hide it away.
Photosynthesis does the job if you take the wood and hide it from combustion or fungal catabolism, however it would take millions upon millions of years for photosynthesis to grab back what we have unleashed in the past century.
And it looks to me like we are just about 1/3 rd through with this big combustion experiment.
correction- should say 2/3rds rather than 1/3rd
Absolutely it’s an energy hog. But it works and will get better over time, just as you and Dennis push the renewable cost per KWH decline over the past decade so may carbon capture cost per ton sequestered come down to a level that manages it well. Hell, I may be burning gas in my suburban freely for the rest of my life it works. I may also have to burn gas in cold climate cycle periods to push the ice sheets back.
I’m kidding a little here, but the concept is clear and for some mildly entertaining exploratory debate… Solar and wind may not ultimately displace all fossil fuel for electric generation if the apparent carbon density issue is resolved a different way than simply stopping the burn.
I suppose that if fusion power was developed and had a very positive EROEI then CO2 sequestration might become viable at scale.
In the meantime its going to get very messy.
Hideaway. Of course there is a limit. On money, on energy, on materials, on how much damage the biosphere can absorb.
But to my point, the global energy sector will require more capital to accomplish continued energy supply as fossil fuel peaks and then declines. Its not complicated. Its something to acknowledge and plan for and deal with. Spending will have to be diverted from other sectors, beyond what we have become accustomed to. Its going to be a lot of hard work even to simply run in place.
I am disappointed that humanity has squandered so much bounty on frivolous and destructive endeavors, and been so slow to see whats before us. And so we have much lesser prospects at making relatively smooth transitions than could have otherwise been the case.
There should be no illusion of some rosy path for the rest of the century and beyond, with infinite growth. We’ll simply have to try to make do with what can be mustered. Global combustion (all sources) will be peaking in just about 10 years. Population will be peaking in about 25 years.
Have no illusion that humanity is going to grow on forever, or is about to simply standstill.
Hickory… “the global energy sector will require more capital”
It’s not money we are short of, it’s materials and energy we are short of. When we ‘work out’ how much something is going to cost to build on a really large scale, an assumption is made that the materials are…
A/ available
B/ at current prices, or assumed cheaper because of ‘economies of scale’ and
C/ All ‘other’ costs remain the same (or get cheaper)..
This is despite the simple reality that as EROEI of all energy sources reduces, and ore grades get lower on average, we need more energy that costs more to gain the same quantity of ‘materials’.
The paper Dennis referred to that he hadn’t read in detail, made these type of assumptions for Hydrogen, electrolysers the tanks and all other equipment needed.
Take any large project anywhere near you, that’s taken many years to build and I’ll bet the cost has blown out and most people blame regulations or something like that for the increased costs. The Vogtle reactors in the US, or Hinkley in the UK, or a new giant mine, or hospital or railway station complex, or large Airport, etc, etc.
They all end up costing way more than was ever planned for and the real reason is the falling EROEI of all energy, increased cost of specialist equipment and expertise.
Any world wide implementation of renewables, multiple of times larger than we now have will suffer from the same, especially because it’s very materials intensive. We have reached economies of scale in building solar panels, wind turbines, and batteries, massive factories with as much automated as possible. We built them in cheap labor countries, again offering massive savings on cost, which also had massive quantities of cheap energy to do so. plus those built in the last decade had low costs of money with near zero interest rates
We can’t move to cheaper labor countries that have massive quantities of cheap energy. (Then again maybe building new massive factories in Indonesia based on cheap coal might be a bit cheaper than China), but interest rates around the world are no longer cheap, nor are the raw materials getting cheaper (again unless all the aluminium and glass etc comes from new Indonesian factories run on coal).
I’m sure you understand the point though, if we start doing the mining, processing and running the factories on renewables, where the energy costs are higher, the materials costs are higher, the workers cost the same or more (as in reasonable wages), the interest rates are higher, then why would any of the future expectations of lower costs be true?
They wouldn’t be and can’t be. Future projections of costs are based on the past where we went from small inefficient factories mainly in Western economies to massive sized ones, in a period of low money costs, using lower priced wages overseas and dirty cheap energy to build and operate it all.
Then in a relatively short period of time, 10 years or less for some batteries, it all has to be rebuilt. The hand wave Dennis uses is we’ll recycle everything, yet we’d have to build a lot of large factories with more new materials, and fill them with equipment also built form new materials in new factories, then use a lot of fossil fuel based chemicals to separate the metals if using hydrometallurgy , or a lot of coke if using pyrometallurgy. These uses are on top of what currently is used so requires more mining of fossil fuels to provide these products..
Meanwhile the planet becomes more unlivable, more species go extinct, the human population continues to grow for another decade or 2 until we hit the wall.
Assuming we use all the fossil fuels we can mine to build this renewable future, over the next couple of years without running into shortages of anything and we get to 2060-70 unscathed with a population that has declined to 7 billion, with a much hotter world, worse storms, floods and droughts, a lot more extinctions etc… Then what??
We no longer have the fuels or products from fossil fuels to do the recycling nor the mining of ‘new’ materials. Fertilizers are gone from farm use, explosives from mines, herbicides and pesticides can no longer be made, no more cement for new buildings, wind turbine foundations, no more new steel, nor new Aluminium..
Then what does humanity do, with 7 billion people and a ruined environment unable to feed itself, and all the renewables rapidly ageing and failing all over the place. Congratulations, we have stalled the day of reckoning by a couple of decades by believing in miracles and fairy tales.
Of course we’ll never make it that far as we will get into the accelerating decline phase of oil long before we build enough renewables to replace all fossil fuel energy use, as total energy use continue to grow every year..
You should go and read the “Do the Math” blog of professor Tom Murphy, he sees the big picture. Or perhaps a lot of the online work of professor Bill Rees, another learned person with the same thoughts as mine.
Hideaway,
The World is using less and less fossil fuel per unit of real GDP produced, this is a fact and is likely to continue in the future.
Hideaway. It is indeed likely that in 2050 humanity will find itself in a huge pickle with population peaking at north of 9.5 billion, short of energy (and capital) for critical projects, and finding many materials too expensive for general use.
Sure there are a few dramatic innovative surprises to come between now and then, perhaps even on the energy front. But these things are unlikely to bend the trajectory of overall constraint.
Nonetheless you/we would be foolish to think that humanity won’t try to optimize their individual and collective economic capacity between now and then. Just as you have done throughout your adult life. That attempt at optimization certainly includes a massive shift from extreme over reliance on a depleting fossil fuels.
We could use half as much fossil fuel today and still have a viable civilization if there was effective prioritization of use along with deployment of current improved efficiency measures. Unfortunately, we are not a well organized species and not collectively wise. And so we will continue to waste most of the fuel and continue to grow thousands of miles beyond our sustainable means
Where are the tractors and heavy trucks running on electricity? I still haven’t seen any.
Hillside
Where are the tractors and heavy trucks running on electricity? I still haven’t seen any.
Maybe you just weren’t looking.
Here are some electric mining vehicles:
https://www.epiroc.com/en-hk/products/loaders-and-trucks/electric-trucks
https://www.komatsu.com/en/products/trucks/electric-drive-mining-trucks/
https://www.safescape.com/vehicles/bortana-ev
https://www.cat.com/en_US/by-industry/mining/mining-responsibly/electrification.html
And then there’s Bagger 288m, the world’s largest land vehicle.
https://www.wikiwand.com/en/Bagger_288
Or is Bagger 293 bigger?
https://www.wikiwand.com/en/Bagger_293
Delivery vans are also increasingly electric.
https://about.ups.com/sg/en/our-stories/innovation-driven/new-ups-electric-vehicles-hit-the-streets-of-europe.html
https://logistics-manager.com/tops-teams-up-with-dhl-supply-chain-thailand-to-roll-out-clean-energy-electric-trucks/
https://www.iodynamics.de/blog/the-6-best-electric-commercial-vehicles-for-the-last-mile/
https://medium.com/lifes-a-picnic/the-epv-cute-clean-and-electric-b840e0c00b1
Picnic delivers in my street.
Also garbage truck
https://www.scania.com/group/en/home/electrification/e-mobility-hub/the-scania-electric-waste-truck-that-does-not-waste-energy.html
And many many more.
I can see it clearly now, it’s not an energy cliff.
Something entirely different.
If it were a cliff, there would have to be some force or reason to be pushed off, into the abyss.
Anyone with the most basic understanding of physics will get it. The western world has been lifted up and is riding an energy tsunami the likes of which has never been seen before, a mega civilization fed by ‘endless’ supplies of energies, really a smorgasbord; coal, gas, oil, shale, wind, solar, hydro, nuclear, tidal, geothermal, hydrogen, lithium…
The crash is coming, despite the wildest imaginations, the future is bleak. What does the hopium get us, one more night of restful sleep?
The true future is this, someone at some point may pick up the pieces…they will likely say, “what the fuck happened here?”
Kengeo,
Keep in mind that a signifcant portion of fossil fuel energy simply produces waste heat, nearly all of petroleum use and a significant portion of natural gas and coal use (the portion used to produce electric power). Roughly 50% of the primary energy from fossil fuel becomes waste heat, this is part of the reason the non-fossil fuel energy is cheaper. There is a lot of energy supplied by a fusion reaction that occurs at a safe distance from the planet, we will utilize this source of energy in the form of wind and solar power and we will continue to use this energy to replace fossil fuel energy use over the next 25 years.
From like your kitchen window?
https://grist.org/fix/food-farming/future-farming-artificial-intelligence-robots-drones-precision-agriculture/
Is an all Vegetable Diet in our future
Denmark is going to start charging farmers €100 a cow in a new tax on livestock emissions – a world-first CO2 levy on agriculture.
https://www.tortoisemedia.com/2024/06/26/denmark-charges-farmers-per-cow-to-reduce-emissions/
Ovi,
As the artificial meat industry scales up and reduces cost, it may become a reality and the large portion of agricultural land dedicated to meat production (including crops grown for feedlots) could be reduced, this could provide a lot of land that might be reforested in an environmentally responsible way helping to preserve the planet and may absorb some CO2 in the process.
“Volvo has so far delivered more than 3,500 electric trucks to customers in 45 countries on six continents.”
https://cleantechnica.com/2024/06/26/volvos-electric-trucks-reach-80-million-kilometers-in-5-years/
Its what people do/will do when petrol gets expensive or your country needs to import it.
In the US and Canada we haven’t had scarcity yet, so we don’t see as much electrification as some other places.
We’ll catch up in the next decade or two.
I see the links from Alimbiquated and Hickory.
These will do little to stem the tide of fossil fuel depletion and worsening EROI. Our civilization is dependent on massive use of energy and only fossil fuels can enable it. The technology is impressive but it can’t be scaled up sufficiently.
Hillside spring,
No particular reason the energy can’t be supplied with wind, solar, hydro, geothermal, and nuclear energy, just a matter of gradually replacing investment in fossil fuel with investment in other forms of energy. Why can’t these other forms of energy be scaled up?
Dennis,
I respectfully disagree with most of your premise, that renewables are cheaper. That is such a blanket statement. In my view it completely depends from place to place, the world is not a static place.
For example. In Iceland geothermal might be the cheapest form of energy to utilise. The same cannot be said for Australia. A country sitting on mountains of accessible coal and gas. Making a ridiculous claim that renewables is cheaper in Australia is asinine. Whoever makes that statement is spouting propaganda. Yes both those sources contribute to GHG emissions, but don’t sit there and tell me renewables are cheaper.
Also, everything you say might apply to the U.S i don’t know what goes on in your country, but extrapolating what happens in the U.S to other countries is a fallacy, and ruins your arguments. The energy prices in Australia have gone nowhere other than up since the transition to renewables (also neoliberal woke policies of selling our fossil fuels to other countries so we can look better in terms of our CO2 emissions). There is a cost of living crisis in the country. So stop making blanket statements. Be more specific about the geographical locations you are claiming renewables are cheaper.
Also from my limited viewpoint, the world is heading more and more towards right-wing politics and populism. In Europe, possibly Australia is next, and soon to be your election will dictate how quickly the transition to right-wing policies will be. Obviously the reasons for this is multifactorial, but it seems like the majority are sick of the system that is no longer working for them. Especially the younger generation.
So your utopian dream of a renewable future will have major resistances if populism and right-wing politics come into the picture. Not to mention resource constraints, further decimation of the natural environment and other unseen issues.
So again your worldview and mine differ hugely. As you and I have discussed many times the chances are we are both wrong. I am only writing this to be a yin to your yang.
Iron Mike,
I agree wind and solar are cheaper in the US, perhaps not true in Australia. I am not omniscient. My guess is that for favourable locations in Australia that have good solar or wind resources that wind or solar would be cheaper. We have pretty good coal and natural gas resources in the US and the best locations for wind and the best locations for solar have cheaper prices for electric power output. In the US coal power is no longer competitive with natural gas and most new utility scale power projects are either wind or solar power in the US, some of this is due to tax subsidies which tend to accelerate this transition.
I appreciate your feedback, thanks.
The utopian dream is based on historical trends in fossil fuel electric power generation and wind and solar power generation at the World level, without any price information for the World, I do not have information on World average prices for wind, solar, coal, and natural gas generation.
VW is going to invest $5 billion in Rivian, announced on 6/25th.
At first I thought it was to get access to hardware,
but one commentator said it was rather to get access to Rivian superior electric management software.
Apparently VW has had some shortcomings on that front with their efforts to date.
VW owns the International Harvester brand, which is in mothballs.
But they announced to plans to build a new IH Scout…EV, to be built in the US in a few years.
The last one was built in 1980 (petrol of course).
I Imagine it will share some attributes of the Rivian.
from Feb-
https://www.motor1.com/features/659901/scout-electric-suv-range-price-details/
I had mentioned that Utah oil production has grown rapidly. SM Energy and Northern Oil & Gas just made a large production and acreage purchase from a private company for over $2 billion.
New posts up
https://peakoilbarrel.com/short-term-energy-outlook-june-2024/
and
https://peakoilbarrel.com/open-thread-non-petroleum-june-27-2024/