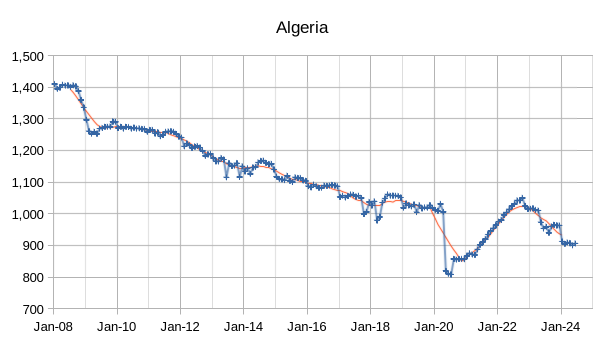
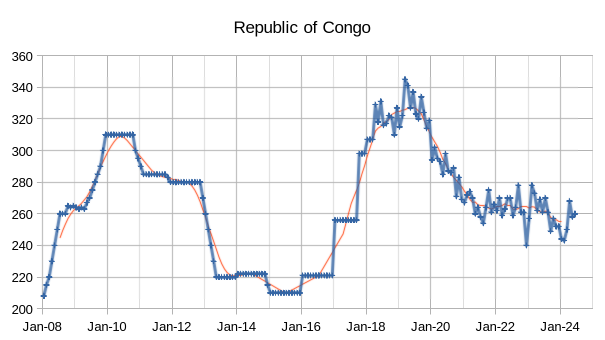
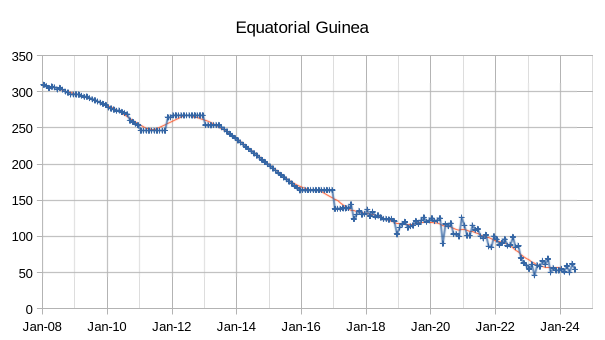
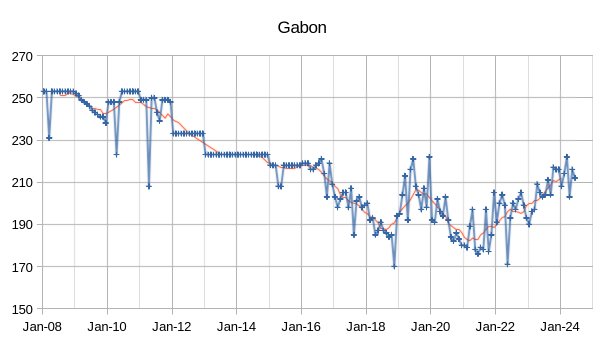
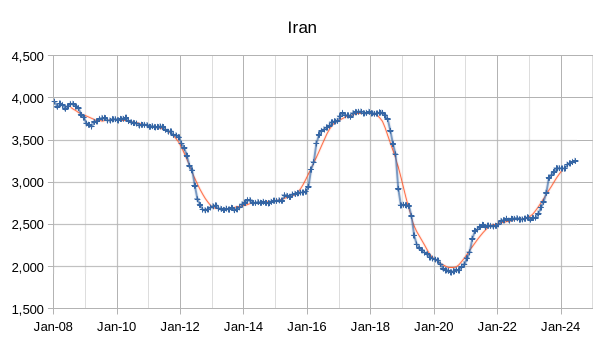
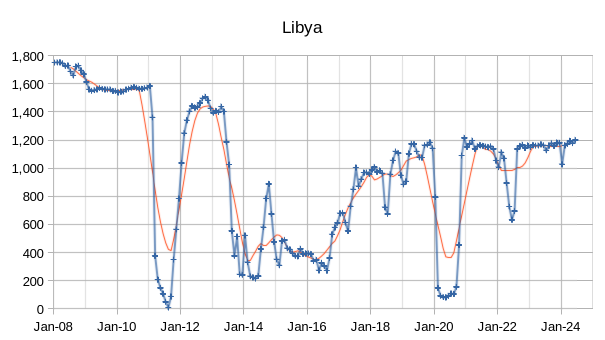
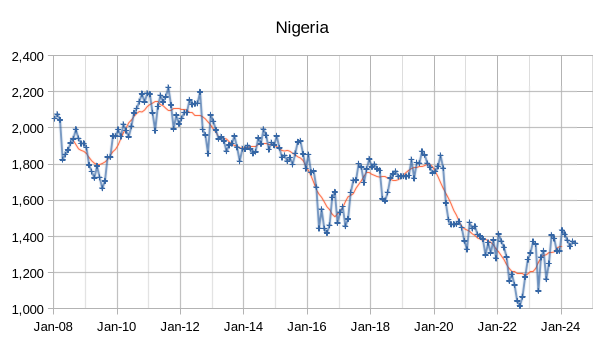
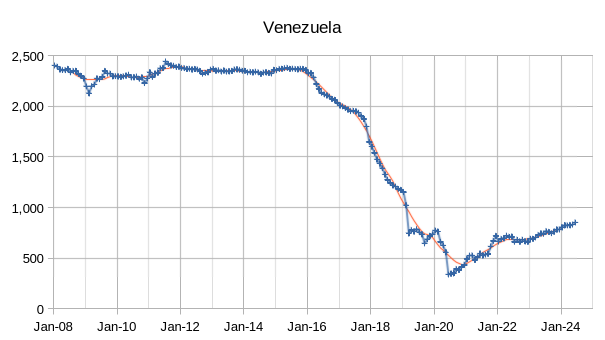
The OPEC Monthly Oil Market Report (MOMR) for July 2024 was published recently. The last month reported in most of the OPEC charts that follow is June 2024 and output reported for OPEC nations is crude oil output in thousands of barrels per day (kb/d). In the OPEC charts below the blue line with markers is monthly output and the thin red line is the centered twelve month average (CTMA) output.
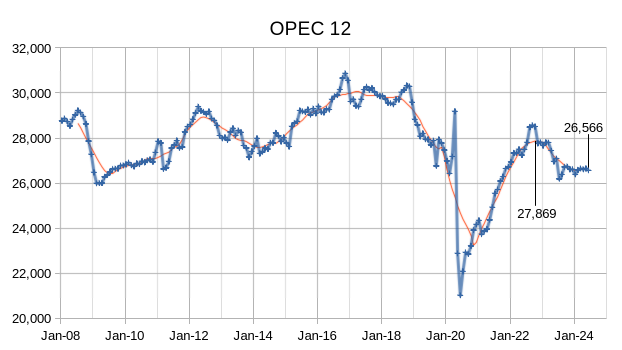
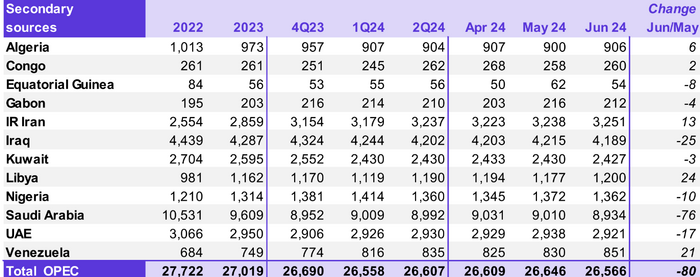
Output for April 2024 was revised up by 9 kb/d and May 2024 output was also revised higher by 17 kb/d compared to last month’s report. OPEC 12 output decreased by 80 kb/d with most of the decrease from Saudi Arabia’s output (-76 kb/d.) OPEC output has been relatively flat for the past 8 months.
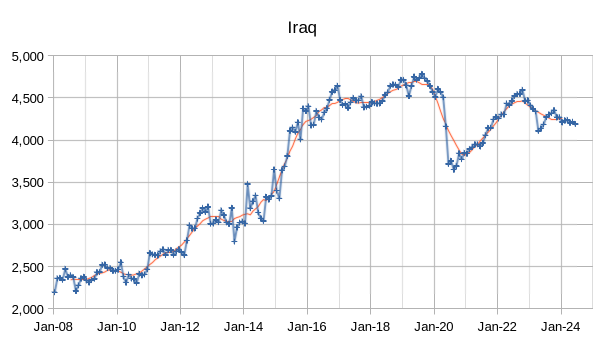
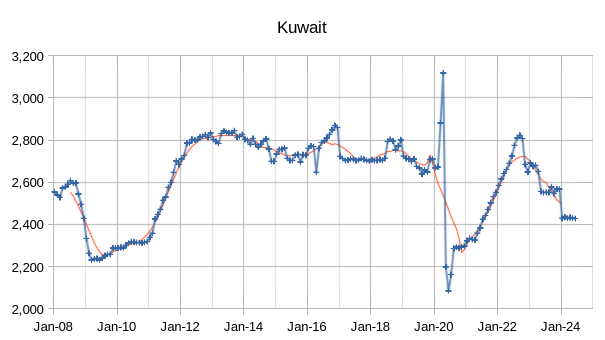
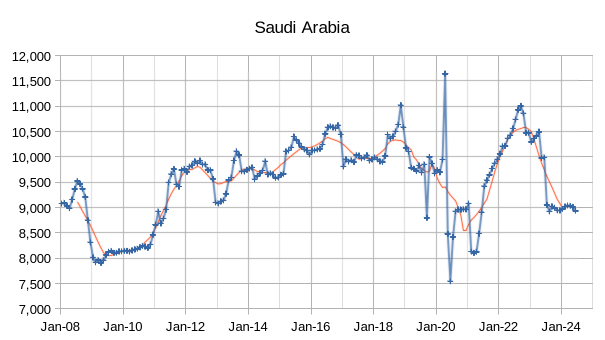
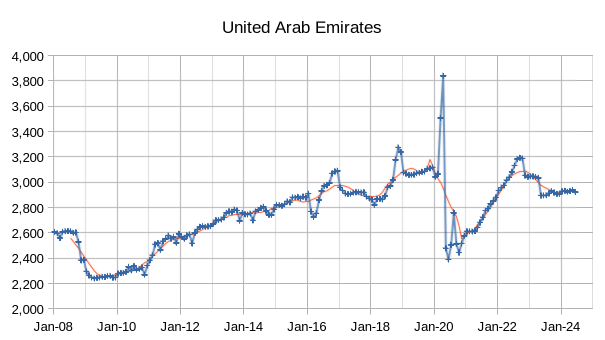
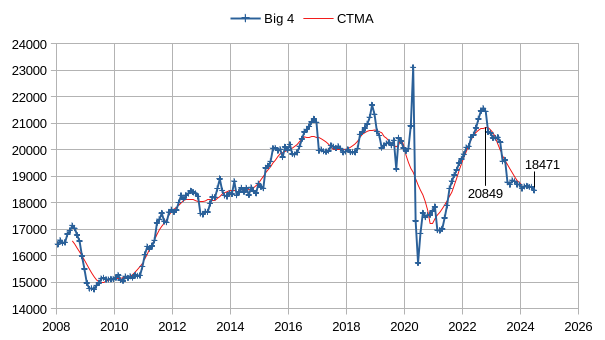
The chart above shows output from the Big 4 OPEC producers that are subject to output quotas (Saudi Arabia, UAE, Iraq, and Kuwait), since the post pandemic peak in 2022 where centered 12 month average (CTMA) output from the Big 4 reached 20849 kb/d, in June 2024 output had been cut by 2378 kb/d relative to the 2022 CTMA peak to 18471 kb/d.
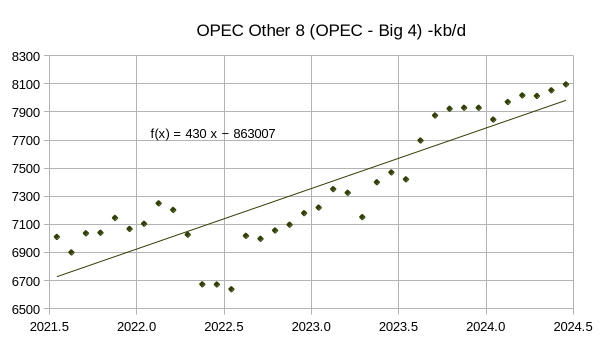
Output from the other 8 OPEC producers (OPEC 12 minus Big 4) has been increasing at an average annual rate of 430 kb/d from July 2021 to June 2024. Most of this increase in Other 8 OPEC output came from Iran, Venezuela, and Nigeria over this 3 year period.
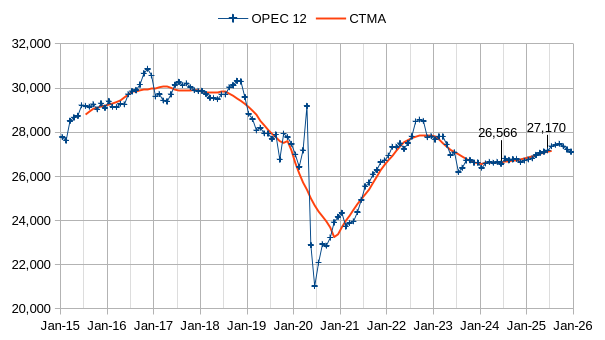
The chart above attaches the EIA’s STEO outlook to the secondary source data for OPEC crude oil output reported in past MOMRs up to June 2024. The output in June 2024 (latest data from OPEC) and the June 2025 STEO forecast are shown on the chart. The chart presents crude only output.
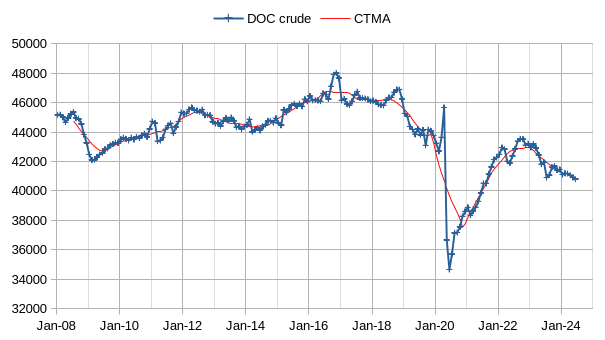
DOC crude output was at a CTMA peak in December 2016 (46696 kb/d) and output has decreased by 5895 kb/d by June 2024 (40801 kb/d).
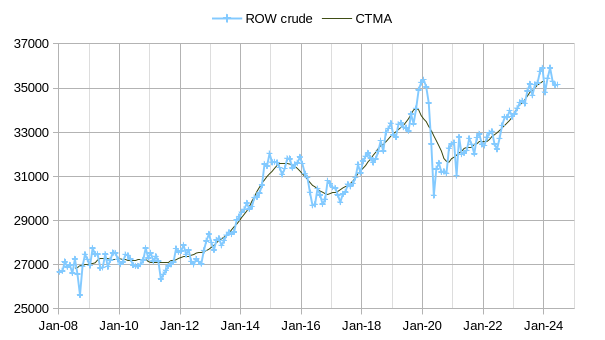
For the Rest of World (ROW) which is World Crude minus DOC Crude, output increased from the December 2016 CTMA level by 4931 kb/d through June 2024. Thus World output of crude only dropped by 963 kb/d since the DOC peak in 2016/2017. More importantly, the World CTMA peak for crude only output occurred in August 2018 at 78573 kb/d and has fallen by 2623 kb/d in June 2024 (75950 kb/d). The OPEC Big 4 have cut output by 2378 kb/d since the 2022 CTMA peak, so only 245 kb/d of increased output from nations besides the OPEC Big 4 would be needed to reach a new crude only peak assuming the Big 4 are able to restore the cuts in output they have made since the 2022 peak .
Note that the annual rate of increase for the ROW crude only output for the past 24 months (using OLS linear regression) is about 1299 kb/d. Longer term from July 2013 to June 2024 the average annual rate of increase in crude only output for ROW has been 467 kb/d. It seems likely that if World demand for crude increases over the 2024 to 2028 period (which is very likely in my view) that a new peak will be reached for World crude output.
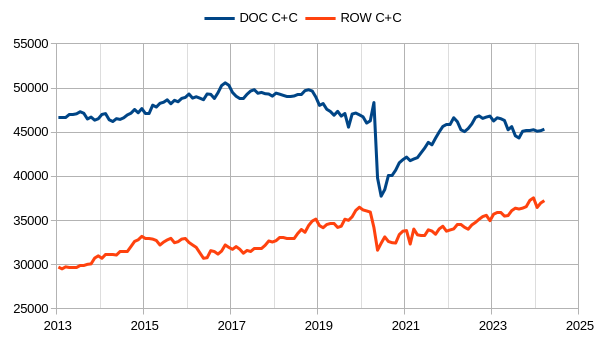
The chart above considers C+C output for the DOC (aka OPEC+) and ROW (different from the crude only charts already presented). For the OPEC Big 4 C+C output dropped from the CTMA peak in November 2022 by 1690 kb/d through March 2024 (most recent data point from US EIA for International C+C data). At the World C+C CTMA peak (82958 kb/d) in September 2018, the DOC nations CTMA for C+C was 49107 kb/d (about 486 kb/d below the April 2017 CTMA peak of 49593 kb/d) and ROW C+C CTMA was 33851 kb/d. World C+C output had dropped to 82585 kb/d in March 2024, about 373 kb/d less than the 12 month average peak.
OPEC likely has at least 1690 kb/d of spare capacity which can be ramped up as demand for C+C increases in the future. The long term trend for ROW (nations not part of DOC) from April 2013 to March 2024 (OLS linear regression) is an annual rate of increase of 487 kb/d. I conclude that it is likely a new World C+C peak will be reached in the future, perhaps as high as 84.5 Mb/d in 2028 or so, this will depend in part on the growth in World demand for C+C.
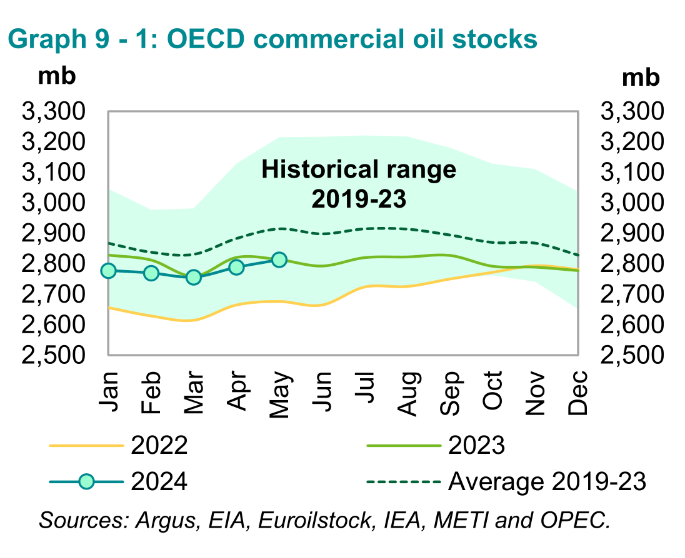
OECD Stocks remain below the 5 year average, but World Oil markets seem fairly balanced when considering the price of oil. The real Brent Oil price (monthly average prices) in 2024 US$ averaged about $101/b from July 2007 to June 2024 and in June 2024 the average price for Brent was $82/b, the World is currently well supplied with C+C.


The OPEC estimate for supply and demand balance remains very similar to last month’s estimate and the demand estimate is higher than both the US EIA and IEA, my guess is the OPEC demand estimate is too high.

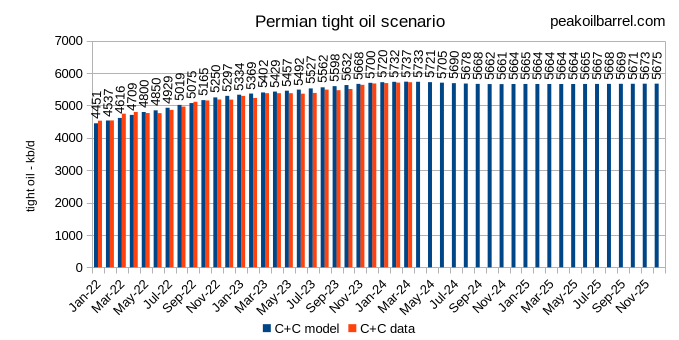
The estimates for US tight oil have been revised a bit higher for 2023 to 2025 compared to last month by 0.01 Mb/d for each year. The revisions for individual basins are larger, for the Permian basin 2023 output has been revised higher by 0.08 Mb/d and for 2024 and 2025 the revision is 0.15 Mb/d higher than last month’s estimate. I expect Permian tight oil output will increase by about 0.26 Mb/d in 2024 and be flat from 2024 to 2025, this assumes rig counts in the Permian basin remain at the current level for the next 10 months and that DUC inventory remains steady. The labels on the chart below are for the model scenario. The correlation coefficient between model and data from Jan 2022 to March 2024 is 0.9875, R squared for model vs data is about 0.975 over this period.
World C plus C in March was about 373 kb/d below 12 month average peak in 2018. We might see a new World C plus C 12 month average peak by 2025. The long term trend using OLS linear regression on data from Jan 1983 to March 2024 is an average annual increase in World C plus C output of 757 kb/d,
World C plus C long term.
I think just looking at that chart ought to make those calling the peak think twice. You can see how previous peak calls in the mid 2000s were wrong. And even after that, on here, we had the wrong Ron call of 2015 as the peak.
Now we have the Ron 2018 call. But note the convenience of that before Covid, OPEC quotas, and the shift in US oil policy with the Trump/Biden change (and I’m not saying Biden shut the industry down…but there were more constraints). But all of those are reversible issues. Are not like “just running out of oil” in a Deffeyes, Hubbert sense.
In particular, it is interesting to look at when slowdowns have been OPEC related. Now. And previously. OPEC is very important and has an economic incentive to raise prices by constraining production. But that means that there is reserve capacity. It means that the scarcity is a market phenomenon, not just a geological one. And history has shown that OPEC does not always maintain discipline. And that non-OPEC can destabilize it. This happened in the 1980s and then later in 2014. So, Danger, Will Robinson.
Don’t be to quick too make peak calls. It’s one thing to say “oh, we all make mistakes”. But if you don’t learn from them and just make mistake after mistake, with new goalposts, but no review of your failed methods, themselves, you aren’t being a thoughtful analyst. Are advocates, not analysts.
Nony,
What I was trying to convey is the 2018 peak is likely to be surpassed by 2028, difficult to know when the final peak will be, it depends in part on the price of oil which will be determined by both supply and demand in the World oil market.
My expectation is that demand will play an important role after 2030 and that oil supply may fall due to lack of demand and low oil prices.
Biden’s policies have affected oil output in the US very little, and foreign policy which kept sanctions on Iraq and Venezuela in place would tend to increase oil prices ceteris paribus (rather than a policy where sanctions were eased) and would tend to increase US output. The policy of not allowing new permits on Federal land was telegraphed and producers got more permits than they would require in advance of the policy being implemented, the effect on actual output on Federal land has been pretty much zero.
Drilling in the US has slowed because profits are low. Trump’s claimed future policy is nonsense, more drilling and lower oil prices, the two do not go hand in hand unless handouts to the oil industry are planned.
Yeah, I get it that you disagree with Ron about his 2018 peak call. We are in agreement on that. In disagreement with Ron.
I think the OPEC barrels off market are the biggest factor constraining supply.
I’m not sure how huge the JenniG policy impacts are, but they are non-zero. Not trying to say they are end all and be all, but they are non zero. Market reacts to political risk. Who wants to invest long term capital in a seismic shoot or pipeline or the like, if the government is aligned against you? Oil companies routinely deal with risk from governments (e.g. expropriation). Doesn’t stop development. But affects it. On the margin. As an extreme example, look at companies that paid lease bonuses for shale gas in New York and then were unable to develop it. Look at how many billions were lost on the Constitution Pipeline. That’s risk, which limits future investment. Oil and gas is not a faucet you can turn on/off…as JenniG has learned.
And yes, of course, oil price is the more important factor, for US production. I never said otherwise. I was listing factors reducing production. And price (for free competitors), in an OPEC constraining situation, is actually a positive US supply factor. If OPEC+ dumped barrels (as in 2014), we’d have increased global supply (and consumption), but reduced US supply as the US reacted too the price crash.
Nony,
No doubt wind speed also has a non-zero affect on oil output, I am talking about statistically significant effects. New York laws will obviously affect development of natural gas in New York, Biden cannot be rationally blamed for that so lets forgo the gish gallop.
Generally World output is the more important factor and I agree OPEC plus will have a significant affect on World output.
In fact the spare capacity of the DOC (at least 1690 kb/d, probably more if the Ukrainian situation is ever resolved) is an important fact which points to a new peak in the future. Only guesses could be made about when that peak might occur and when it might be with odds of zero of being correct.
Of course one can never make any guess and just point out how others have been incorrect in the past.
Here’s a tip, you will be right every time because nobody knows the future. You are obviously much smarter than everyone else, maybe you could let us know what the future peak will be and when it will occur.
JenniG, no clue what you are on about?
It was not a gish gallop, it was an analogy. I’m trying to help you understand that companies look at risk. This is regardless if it is a pipeline, NYS gas, US oil and gas, or foreign development. That’s why I also mentioned expropriation. I’m not saying that Biden is doing that, either. (Duh.) I’m saying that companies consider governmental risk when doing bidding rounds with sketchy countries. And it doesn’t even stop all development. It just means they won’t bid as high, since they risk adjust for expropriation danger.
Similarly in the US, it affects investment when governments say they want to transition away from FF. It doesn’t shut it off. But it affects stock valuations and long term investments and raises the hurdle rate.
See also, this chart, of price versus rig count, with 2021 abnormally low.
https://x.com/RobertClarke_WM/status/1416055407194296322/photo/1
Hmmm.
Nony,
I think the affect of the government announcing policy is pretty limited. If oil companies are not planning for a transition to non-fossil fuel they are not very smart. This is a bit like the folks at AT&T and Kodak not seeing their business decline. The smart money is moving away from oil and gas, this is to be expected as the World is moving in another direction in my view. I think you overestimate how much subtle changes in government policy affect oil and gas investment. There is always risk in the oil and gas business, changes in US policy is one of the minor risks.
Nony,
The chart is easily explained, fewer rigs were needed because there was an over supply of DUCs so rig count decreased while DUC inventory adjusted to normal levels. Surprised you didn’t see this, fairly obvious.
Dennis,
1. that’s just an assertion. It might even be correct, but it’s not “obvious”. Just your assertion.
2. Also, rigs are deployed on a forward looking basis. There’s no reason, why companies couldn’t have completed DUCs (reducing inventory) AND drilled more also. But they did not. And there was plenty of frac capacity available, for increased activity. this would have led to faster growth.
3. Look at 2015 and 2016. Significant DUC bulge then, also. But rig activity was in the blue band. (Not displaced way low.) Duh.
4. In any case, if DUC inventory drives rig deployment, then it isn’t ONLY price that matter, but at least one more (significant) factor exists. So, your previous price is all that matters was wrong.
Nony,
Did I say that only oil price matters? Can you produce such a quote? Rigs deployed will be affected by many variables, with the price of oil, NGL, and natural gas being amongst those variables. My assertion is very likely correct, anyone paying attention would be well aware of this.
Note that companies are not in business to produce oil, they are in business to make money, in 2021 costs were high and oil prices were relatively low, a business decision was made by oil producers to minimize costs by reducing drilling in order to reduce DUC inventory in order to increase profits.
Chart below for DUC inventory and DUCs per completion in Permian, Bakken and Eagle Ford based on DPR data from July STEO, the data may not be accurate past 24 months as I expect DUC count is higher than estimated by EIA, probably a 6 month inventory of DUCs at minimum. Though it is possible operators are planning on lower future rates of completion. Experienced operators have suggested about a 7 month lag between start of drilling and first flow.
Checked most recent Novilabs update from Permian and in June 2023 (probably last accurate data point) The DUC count divided by completion ratio was about 7.37, in line with the estimate by an oil pro.
Dennis:
You said, “Drilling in the US has slowed because profits are low.” Now you are citing a non-price factor, DUCs.
Note, that if you really believe that companies drill wells to make money (and I agree), then you wouldn’t cite DUCs as explaining the blue band chart. How does the prescense of completeable wells explain the failure to invest in new drilling? Why not accelerate if the outlook is favorable?
In addition, if DUCs explain the poor 2021 performance, why are 2015, 2016 within the blue band, instead of displaced much lower?
JenniG is DOE Secy. She put in place an immediate freeze on new permits and leasing. (And yes, companies stockpiled permits ahead…but I never said the temporary freeze was the main issue, and I agree that it was not…the main issue was the clear signal to the energy industry that the left wing of the Democratic party does not like them. Remember how Biden said fracking would stop if he were elected (within the Dem debates)? And it didn’t. And he walked the statement back. But it still sent a shiver through the industry, even the threat of it.
Imagine someone temporarily shutting your city water off (even if you have a cistern filled). Imagine someone talking about stopping the water supply, even if they don’t do it. You might look into a well then…
Companies look at governmental risk and adjust the risk premium. If the WACC (hurdle rate) goes from 10% to 15%, less development will take place. This is finance 101.
This is whether it is an expropriation risk in a Third World country. Or exploration in states like IL that have quasi bans on fracking (MD and NY have installed actual bans…and companies lost billions in NYS…they also lost billions on Borked pipeline projects) or even just an on/off Democratic president who doesn’t like high gas prices at election time, but who also has wings of his party that want much harsher shutdowns. Again, look at Dem-controlled NY or MD. And again, it doesn’t have to be a 100% shutdown to reduce risk taking. It just means projects on the margin, don’t get done.
Seen the exact same thing in biotech. Why should I invest hundreds of millions on a project with less than 50% chance of success (and well under a third ever have clinical success), when I start hearing whispers of price controls. Even if they haven’t happened yet, it affects investment.
Finally, you seem Dunning Kruger confident about statments like political risk is non-significant and DUC bulge is. And I’d remind you that nothing stops a rig from drilling, just because the overall industry has DUCs to work down…they are separate projects and separate machines…and there was not a bottleneck in terms of frac fleets unavailable, either.
But in any case, you need to be open to alternate explanations. And should be able to prove one versus the other, if it is “obvious”. And it’s not trivially obvious. Just no way is it. Or you would have demonstrated it. Clearly decisions are multifactorial and it is difficult to prove factor weightings. I’m not even arguing a strong contrary. I’m saying it’s a possibility.
Nony,
Note that there are many factors that determine profits, oil price is one, CAPEX, OPEX, taxes, natural gas price, and NGL price are some of the others. Decisions about how much idle DUC inventory to hold affects overall costs of operations, this seems pretty obvious to me, perhaps oil pros could comment as I am not an expert.
There is never a single explanation for things, nor is it easy to prove which factor is most important, this is simply the obvious difference over the period in question (2021). DUC inventory was being used up over this period at a much higher rate than most other periods. There was also a change in investor sentiment and credit available to tight oil producers, investors were demanding higher dividends over this period allowing less cash flow to be plowed back into drilling new wells. Part of the explanation for this is that tight oil producers had been piling up debt for years (2015 to 2020) and investors lost patience over time. Producers responded by reducing overall production costs by depleting DUC inventory in order to satisfy the investment community.
The story is pretty well known and has been discussed extensively both in this blog and in many other places, I would have thought you were aware of this, seems quite obvious from my perspective.
In 2015 and 2016 there was not such an excess of DUCs as in 2020 also investor sentiment was different at that time.
Longer term chart for DUC and DUCs per completion (right vertical axis), as is obvious the effect of excess DUC inventory was minor in 2015/2015 relative to 2020. Also the World wide disruption of trade evident in 2021 did not occur in 2015/2016 which drove up costs for oil operators and investment sentiment for tight oil producers was more positive in 2015-2016, after 5 years of very low profits (or negative earnings) and mounting debt burdens from 2015 to 2020 things were much different for tight oil producers in 2021 compared to 2015 or 2016.
Lot of word salad there, Dennis. I actually agree with you that it is difficult to make strong proofs about multifactorial business dynamics. And of course that means you have to walk back from “obvious”. Glad to see you do that.
Other than that, a lot of word salad. If you really want to disaggregate DUCs and price, that’s not the right sort of chart to do it. Even just looking at 2024 rigs versus 2019, you see higher rig activity in a lower price environment. So, I don’t see how your it’s the DUCs excuse works there.
If anything, I think the standard peak oiler “running out of sweet spot” is a much better Biden-saver excuse. Use that one…it might even be right. 😉 See…I help you!
Nony,
The dominant factor was using a lot of DUCs, it is very clear that was happening after 2020, a much larger change than 2015 and 2016. Possible high costs from shiiping problems during 2021 leading to high commodity costs, this might also have lead to fewer new wells drilled and lower rig activity. In fact it might have been the reason for DUC inventory dropping over the 2020 to 2023 period.
Changes in DUC inventory are a big part of the story explaining the change in 2021, a chart suggesting rigs and price are the most important factors, is very poor analysis.
Note that it is you that seems to believe oil prices will correlate with profits, I think it is more complex than that. An analysis focusing only on rigs will also fall short.
How do you know it was dominant? How do you prove that? Proof by assertion?
Nony,
There is very little that can be proven.
There was a major change in the DUCs per well completed in the major tight oil basins, it wa the only measurable factor where there was a major change in the industry from June 2020 to July 2021. The chart you showed had 2021 data through June 2021. In my view this is the likely explanation. Care to offer an alternative explanation with data to back it up?
The argument is based on logic and data.
1. If there’s little that can be proven, then it is at a minimum, not “obvious”.
2. You cite one example of DUCs supposedly retarding rig employment, but don’t assess the overall record. E.g. Somehow DUCs were high after the 2015 price crash, yet price explains the story, fine, sans DUCs. I am a little busy now, but will slog through and do the multiple regression, to look at DUCs and price as independent variables versus rig count. If you are right, I will give you credit.
Nony,
Note that price does not determine activity, profits do. Price is not tha same as profits, one needs to take account of cost.
A higher ratio of DUC inventory to completion rate means higher costs. Think in terms of Just in time inventory levels which keeps a business lean, the same holds true in the oil business. Simply put higher DUCs per completion is equal to higher cost, a profitable business wants to minimize this number.
Also note that DUC inventory is equal to past DUC inventory plus wells drilled minus wells completed. The oil firm determines the optimum number of completions to maximize profits and then works out the optimum DUC inventory needed to meet their completion goals, the rate that wells are drilled are adjusted to meet those goals and the number of operating rigs are adjusted to meet the drilling rate required.
Price is always a part of the story, but is not the only story, there can be changes in technology and investor sentiment which can change how firms operate. DUC inventory is also a part of the story as it impacts the cost side of the profit equation.
Nony,
Did a regression on monthly data for Horizontal US Rigs as dependent variable vs DUCs Inventory per completion and Oil futures price (contract 4) for independent variables. You have pointed out correctly in the past that business decisions are made based on expected future prices.
The data period used was Jan 2014 to December 2023 (to avoid seasonality problems I wanted to use entire years of data). The multiple Regression has an R squared of 41.6% while the regression on DUC per completion vs horizontal rigs has an R squared of 38.4%, future oil prices add little information and the error level for that variable is 0.013 (t-stat about 2.5) where for the DUCs per completion it is 9.4E-9 (t-stat about 6.2).
Chart below has horizontal rigs vs futures price with data from Jan 2014 to Dec 2023.
Nony,
I also did a Chow test to evaluate for a structural break in the multivariate linear model at March/April 2020, with entire dataset set at April 2014 to March 2024, the null hypothesis (that there is no structural break) is rejected at a P value of 8.285E-10.
So the data is better modeled with 2 linear regressions on data from April 2014 to March 2020 for the first and April 2020 to March 2024 for the second regression. For the first regression most of the model variance is accounted for by DUCs per completion, and for the second regression (after March 2020) the oil futures price explains most of the model variance.
Nony,
Some further analysis shows a second structural break in the data from April 2020 to March 2024 where the null hypothesis of no structural break in the data is rejected with p=4.8E-5.
For data from April 2021 to March 2024 the null hypothesis (no structural break) is not rejected (p=0.11).
The data from April 2020 to March 2021 shows very little relationship between horizontal rig count and DUCs per completion or the futures price. In this case the null hypothesis that there is no relationship between these variables is not rejected with p=0.41 for the regression (R^2 = 0.18).
Nony,
This is the best I can do on “proof” of my assertion.
I will note you offer little i the way of “proof” of your assertions. And you make a lot of unproven assertions.
Here is the crude-only production from the 22 nations that comprise OPEC Plus. This is about 54% of world production.
The data is through June 2024.
Click on graph to enlarge.
Ron,
That chart is already in the post, only difference is that I use a centered 12 month average rather than a trailing 12 month average.
The Rig report for the Week Ending July 19
– US Hz oil rigs dropped by 1 to 427. They are down 32 rigs from April 19 and are at the lowest count since January 2022 when the count was 434 and rising after the Xmas break.
– The Texas rig count was down 1 to 233 rigs and is down 93 from January 2023.
– Texas Permian decreased by 1 to 188 while the New Mexico Permian held steady at 101. The Texas Permian is down 56 rigs from the 2023 high of 244 in April 2023.
– In New Mexico, Lea and Eddy were both unchanged at 50 rigs each.
– In Texas, Midland and Martin counties were unchanged at 18 and 31 respectively
– Eagle Ford was unchanged at 43.
– NG Hz rigs added 4 to 891. (Not shown).
Frac Spread report for the Week Ending July 19
The frac spread count dropped by 10 to 228 and is down 46 from one year ago. It is also down by 44 spreads since March 8 and is lower than the low of 234 in December 2021. The overall trend in frac spreads appears to be slowly down.
For how long Can rising production defy gravity?
Thanks Ovi, for providing these!
Kdimitrov
Thanks. Much appreciated.
For how long Can rising production defy gravity?
Ovi, May will be the month US production turns down. North Dakota was down 48,558 bpd in May and the STOE has US production down 100,000 bpd in May but turning up almost every month after that. I believe they are close for May, but wrong after that.
Ron
Attached is a preview of what will be posted in the US May update.
Last month after looking at the Lea County data I stated “Lea County has peaked. May production will be flat or slightly down” Took a bit of flak for saying that but the attached shows what happened in May. Lea production has dropped from 1,169 kb/d to 1,106 kb/d, a drop of 63 kb/d, raw data, more than ND. The projected data, red graph, also show a drop of 63 kb/d. Note that the NM data is almost up to date. The projected production only adds 9 kb/d to the 1,106. Lea data is pretty much up to date.
Production is following the rig graph. The interesting question is what happens in October when the rig count begins to increase?
Thanks, Dennis.
The Permian model is your model of rigs x 1.4 x average well production profile, right?
Question: which data do you plot for Permian LTO?
EIA used to provide a number, but that was only for the main formations: Wolfcamp, Bonespring and Sparberry. Recently most of the growth is coming from minor benches, like Dean, JoMill etc… I don’t know what the story is now when this report is part of the STEO
DPR on the other hand doesn’t break down LTO from conventional.
Kdimitrov,
Yes that is correct for my model through Feb 2025, after that I assume rigs remain at June 2024 level through April 2024 (determines completions until 2025 with 8 month lag. I assume new well EUR starts to decrease in Jan 2023 at about 2% per year. The data estimate is based on a comparison of a state and EIA estimates with Novi labs data for the Permian, the conventional is about 500 kb/d for Permian region in the Jan 2023 to June 2023 period, I simply assume this remains constant (it seems more likely it would decrease at current oil price level). The completion rate for my scenario from Jan 2024 to December 2025 is below.
489 479 469 454 445 435 435 435 433 438 441 444 438 437 437 437 437 437 437 437 437 437 437 437
The odds this scenario will be correct is approximately zero.
Slight revision to Permian scenario with New well EUR assumed to start decreasing in Jan 2025 rather than in Jan 2023 as presented in the post. Otherwise the scenario is unchanged (completion rates are the same).
Dennis, I deleted my OPEC+ post. I had no idea that DOC meant OPEC+. Had I known that I would have never posted it.
What does DOC stand for anyway?
Hi Ron,
Sorry, I should have been clearer. I got the idea for the chart from your comment last month.
DOC stands for Declaration of Cooperation which is the agreement between OPEC and the rest of OPEC plus, if you look at OPEC MOMR they now often reference the DOC.
I think you should just call it OPEC+ or OPEC Plus. No one but you knows what the hell DOC stands for.
I would refer to it as “The 22 nations of OPEC+”, that way everyone knows what you are talking about.
Russia is in decline and will continue to decline. They are the major producer of the Plus part of OPED+. And they, along with Saudi Arabia are the two major producers of OPEC+.
Click on chart to enlarge.
Ron,
Probably right that OPEC plus would be better than DOC.
At some point the war in Ukraine will end and at that point sanctions on the Russians might end, depending on how the war is resolved. currently they may be trying to meet their promised cut in output, we will know more if OPEC Plus starts producing all out (currently this only applies to the Big 4 plus Russia) most other nations are already producing at capacity.
Both Coyne and Anonymous are batsh*t crazy. Neither the remaining resources, nor iron, nor testosterone remain in sufficient quantities to exceed November 2018. Furthermore, all liquids C C production continue on a progressively downward slope since that time. Self righteous ideologies frequently espoused on this site – of whatever form they present – ranging from feminism right across the board to ESG – won’t of course do the slightest to replace any of those waning inputs noted in the second sentence, and in fact hasten the already quick decline of T. That one is incredibly important, BTW, and is dropping faster than the downslope line on any crude chart. The last time I was on a rig drill floor, all drilling personnel were men and the youngest were in their mid-forties. Many were in their late 50s, and a couple of them in their sixties.
Peak oil isn’t just a resource problem, it is a ‘peak men’ problem as well. Only a very small segment of men ever had the gumption to work on those rigs, and they aren’t being replaced. Feminists certainly aren’t reporting for work on those rigs, nor are the LGBTQ’ers.
I owned a one seventh interest in an oil rig. Rated to 5,000′ Yes it is great to be on the rig floor and in the mud shack.
Depletion of reserves is a predictable response to over drilling. Would have been better to string out the domestic oil production over a much longer time.
Depletion of testosterone in Texas…look no further than obesity. The strongest factor affecting testosterone levels besides age is obesity.
I suffer from the same downside of testosterone that all men do…compared to women we generally have cloudy minds that are not as good at important decision making.
In fact, just about any women can tell you that a premature peak is much less desirable than a long sustained level of production.
“ Only a very small segment of men ever had the gumption to work on those rigs, and they aren’t being replaced. Feminists certainly aren’t reporting for work on those rigs, nor are the LGBTQ’ers.”
No, because they know that’s a dying field. But you’ll find them in spades working for solar firms, on organic farms, and natural building sites, busting their asses as hard as anyone on any oil rig anywhere, and free from the repression of toxic masculinity you revel in. You are not nearly as awesome as you think you are bro.
Crazed self-delusion and a wretched spinner of a ludicrous, depraved narrative. Not only have I worked extensively on the rigs, milquetoast, I just completed a support structure construction job for the power conversion modules at a large PV facility in Alberta. You want to guess how many “hard working feminists” there were at site, jackass? EXACTLY ZERO, I also completed a couple of engineering jobs at a COGEN facility (effluent produced nat gas to power) located at a wastewater treatment plant. Guess how many “hardworking feminists” there were (and are) at the WWTP? EXACTLY ZERO. WOMEN DON’T COME NEAR PLACES WHERE DIRTY, DANGEROUS WORK IS DONE, Go choke yourself, a-hole, and spare us all the twisted woke narrative. I’ve actually worked at those places and have completed tough mechanical, piping, and structural engineering jobs at those ‘forward looking ESG’ facilities, you haven’t even come within eyeshot of those places.
We know a female pumper. Granted, she just pumps very shallow stripper wells, but she is out there 24/7/365. She does a decent job. She pumped a few wells for us for a few years, but we sold them last year and the young guy who bought them is pumping them himself. She still pumps some of the wells she and her husband own, as well as a few contract wells for others. She’s one of four female pumpers in our field that I’m aware of.
I’m also aware of women who work on rigs. Granted they are in business with their husbands, but they do know how to operate single drum pulling rigs, wrench rods, etc.
I think Mike’s better half has worked with him in the field.
I agree it’s not common, but it does happen in the stripper fields. Honestly, sometimes out of sheer necessity. A lot of the young men would rather smoke or shoot up meth than work anywhere, let alone in our field. It’s a damn shame.
“does happen in the stripper fields”
:)))))))))
Ha! I guess I never think about that angle when I discuss our low volume wells.
Seriously, pumping (no pun intended again) 900’-1,000’ wells is something women can do. Few strive to do it, but it is possible.
One thing I might discuss, we have installed some variable speed controls for our pumpjack motors. This has allowed us to optimize the speed each well is pumping.
Another thing we have done is went to continuous treatment with chemicals, as opposed to batch treatment. We haven’t seen a reduction in production, in fact we have seen an increase.
On these wells the first six months of 2023 we produced net barrels of 9,655 barrels. The first six months of 2024 we produced 10,562 net barrels.
During the same six months in 2023 we spent $28,500 on contract pulling v $15,778 in 2024.
Chemical expense is up. $60,168 in 2023 v $65,801 in 2024.
But repairs & maintenance has dropped even more, $146,984 in 2023 v $121,342 in 2024. Keep in mind, however, these expenses aren’t just down hole, and include repairs to surface equipment including pumping units, motors, injection pumps, etc.
A 6 month timeframe isn’t enough, of course. But just goes to show even in a field that will turn 119 years old next month, you can still try new things.
Inflation in the field has subsided and we have had a stable price. It’s been as calm as I can recall for awhile. Sure hope the volatility doesn’t come back for us.
We are doing two workovers soon, one is supposed to start today. We hope those work out, as they won’t be cheap. But if you can pick up a barrel net for $4-5k, it’s worth it at current prices.
Our LOE on the above wells has dropped from $53.11 first 6 months of 2023 to $43.74 first six months of 2024. I’d say that is a huge deal, and was worth the roughly $50k we spent on variable speed controls and chemical pumps last year. Now we need to see if this is going to hold.
FYI, the above isn’t our best production. It’s our second tier, but it got a lot closer to the first tier just by making these little changes, again, if they hold.
Shallow,
Thank you for your informative postings! I was just being juvenile, a bit of comic relief.
Cheers!
Thank you Shallow sand,
Great stuff!
hehe
Woke doesn’t actually have anything to do with LGBTQ. That’s a lie invented by Fox News.
As you might guess from the non-standard verb form, woke is something that African American community organizers came up with in the nineties. Fox propagandists apparently think white university professors talk like that, but that’s because they are uneducated. And of course, even left wing African Americans aren’t big on LGBTQ. A lot of them are socially conservative preachers.
Woke refers to people black people who realize that they have been screwed and are getting screwed by America’s disastrous city planning, by being systematically disenfranchised, by police harassment etc. It has nothing to do with the politics of sex.
Gotta hand it to Fox for spreading the lie so well though. Lack of media literacy helps. Protip: Don’t believe everything you read on the internet. And throw away your TV. TV rots the mind.
Mike Sutherland
It sounds like you are primarily talking about a lack of women in the physical sides of construction and resource extraction, and probably within the US in particular. Is that right?
However, it also sounds like you may be confused as to the difference between engineering and construction when you refer to your personal work doing “engineering jobs at a COGEN facility” and “…mechanical, piping and engineering jobs at those ‘forward looking ESG facilities’…”. That’s quite a multi-disciplinary set of engineering skills.
We’ll go with the simple route and look at WikiPedia. “Engineering is the practice of using natural science, mathematics, and the engineering design process[1] to solve technical problems, increase efficiency and productivity, and improve systems.”
So, were you indeed performing engineering on these projects and other projects where you report no women? Were there no women in the university engineering programs where you got your engineering degree?
Skilled construction talent is indeed critical, and women are typically a minority on the physical labor side of completing a construction project in the US.
Engineering is a different story entirely and extends well beyond traditional physical infrastructure.
In my 60 years of doing manual labor in oilfields around the world I have seen horrible things happen to good sons, fathers, husbands and brothers. I’ve stictched people up, set broken bones, pulled the arms off burned, charred men trying to put them in body bags. My best friends were burned to death to such an extent there was nothing we could find to send back home to their families. I have 300 stitches in my head, a screw in my back and two in each one of my shoulders doing work I felt like my country appreciated me doing, looking for, finding, and producing oil and natural gas. There was nothing “toxic” about any of that and I deeply resent this utterly stupid statement, and others like it, from urbanites who don’t know what a blister is, who now think they are home free with solar panels, wind turbines and Flintstone cars and no longer need hyrdrocabons.
By the by, the political rhetoric here, the hate, devisiveness and name calling on POB reminds me of the brown ring stains in the toilet bowls of bus stops in South America. A lot of people here are, simply put… vile human beings. And all annonymous, hiding behind a keyboard. Imagine that! Imagine being from German, or the UK, for God’s sake, and criticizing America. Phfttttt.
To be so angry over a single politician running for office, or different political idealism in this great nation of ours, the comparions to Hitler, who is responsible for the brutal death of millions and millions of innocent people, suggests to me people whom are deeply angry about the failure of their own lives.
Angst over politics is for the weak, the fearful; for people who have lost control of their own destiny.
Mike Shellman
Texas
Mike, I hear your anguish, But there is something you so obviously misunderstand. A quote from your post:
To be so angry over a single politician, or different political idealism in this great nation of ours, the comparions to Hitler, who is responsible for the brutal death of millions and millions of innocent people, suggests to me people whom are deeply angry about the failure of their own lives.
Need I remind you that Hitler was a single politician. And he was responsible for the deaths of millions of people. But why in the goddamn hell does this suggest to you that we are that because we see this quality in Trump that we are deeply angry about the failure of our own lives? I do not consider my life a failure. I was born the son of a dirt farmer sharecropper. I have succeeded in life far more than my dad ever dreamed I would. I am 86 years old and will die soon. But I will die a happy man knowing that I have succeeded in life, That does not change the fact that Donald Trump is a wannabe Hitler. He is a selfish psychopath that craves power and worship from his blind followers. That is so goddamn obvious the one has to be stone ass blind not to see such an obvious fact.
Perhaps you should try looking the mirror and psychoanalyze yourself before trying to analyze people who have a different opinion of a wannabe Hitler than yourself.
I have worked in solar and natural building construction for over three decades. I stand by my comment.
What is so glorious and honorable about working on an oil rig? Let’s be honest – nothing. Take a step back and look at the arc of humanity. Oil has only increased our overshoot and made a sustainable civilization more unlikely, thus ensuring billions of humans live in misery and untold destruction of the environment. I recommend reading The Golden Thread, a history of solar energy in human development. Before coal and then oil came along, human population was progressing at a reasonable rate and technologies to harvest naturally available energy sources such as sunlight and geothermal were advancing. Fossil fuels disrupted this process and created massive human overshoot and irreparable damage to our ecology. Participating in this exploitation by working on an oil rig only adds to the problem. It sucks to hear I know but it’s as plain as the nose on your face. Fossil fuels, including oil, are the worst thing to happen to the earth since the asteroid 65 million years ago, and the worst thing ever to happen to humanity. As the extra billions die off over the next few generations, many of them prematurely, oil will be the primary cause of this misery. Without it, the overshoot never would have happened on this level. That said, it’s also perfectly natural for this resource to be exploited and it was inevitable that it would happen, if not by humans than some other reasonable dexterous and intelligent evolution of some other mammal (most likely).
So, it is what it is. The only path forward is to use our remaining resources to mitigate the inevitable misery that is already in the pipeline and create a path to a hopefully sustainable civilization in the next century or two. Oil will have no place in that ultimate civilization (should it even be possible). So get over it.
Mr. Patterson, you, like many others here on Anti-oil Barrel, are deathly afraid of one, single politican and an idealism that differs from yours. Some of your community have, feeling “protected” by using annonymous names, wished horrible things on this man, his family, even to the point of feeling regret a would-be assassin were not better shot. Its some sick shit. Those comments are on the internet, man, and big brother is watching.
Fear is a horrible thing to live with. You and some of your squad can insult me all you want, or my industry, and the risks we take so you can peck away at your keyboards…I ask you respectfully to go back the 10 years I have commented on your blog and interjected politics, and hate, into a desire to teach people about oil and natural gas and a better understanding of decline, depletion and real life experiences with well economics. You can’t do it.
Your blog, or whomever’s blog it is, has become totally irrelevant because its moderators have allowed so much hate and political differences to stink up the joint. You folks can’t seem to breathe without blaming Trump, or Republicans, or a simple different value system…for your fear. I am sorry, truly. Democracy? After what’s happened the past four days? Phftttttt.
I survived 9 different presidents, self-employed, all of them fucked up one way or another, and never had the time to whine like a little girl about any of them.
MIKE SHELLMAN
You don’t have time to whine like a little girl about the president, but you do seem to find time to whine like a little girl about other people whining like a little girl about the non-president! xD
Mike, you are the real whiner. I am an old man near my checking out time, so I don’t fear a goddamn thing. But I do fear for my children and my grandchildren. I do not want them to live in a dictatorship. We have a real wannabe dictator running for president. He loves other dictators, and has said so. He wants revenge for what he says was an election that was stolen from him. The only problem is that is a goddamn lie, and he knows it. And Mike, you know it too. You know he tried to overthrow the US Government on January 6th, 2021. I think you are a very smart man Mike. That’s how I know you know that. Because anyone who actually believe Trump’s big lie, that the election was stolen, is duma as a fucking rock. You are not dumb Mike, you are a very smart man.
So, my question to you Mike, is how in holy hell can you support a man whom you know deliberately tried to overthrow the US Government and the US Constitution?
Mr Shellman, it was Mr Sutherland’s misogynistic anti-gay screed that injected hatred into this blog post. Surely you can’t be blaming Ron for this. If the blog is so irrelevant, then why do you continuously come back to post here? The same reason I do, and the same reason I read your blog, because it’s damn interesting and there are lots of intelligent people discussing the matters of the day, in a mostly civilized manner.
I myself am bisexual and a feminist, am I not allowed to be insulted by hatred directed at me from bigots? I’m just supposed to take it? Fuck that noise.
The joke here is that Mr Sutherland would not have any idea that I’m part of that community. I’ve worked in construction my entire life, appear “normal” with jeans and tattooed forearms and often drive a truck (when I need to). So when I show up at a construction site, or when someone just like me shows up at an oil rig, y’all have no idea that an LGBTQ is even there. And omg, they might also be a feminist. LOL
Jesus man how about taking this bile to the non-oil section.
Speaking of labor in the energy industry over the next couple decades there is going to be huge labor demand in the nuclear, geothermal, electrical infrastructure and energy manufacture support sectors… in addition to the labor requirements in the oil and gas production sectors.
While I agree that each country needs to have control over their border and immigrant selection,
the US will need to work hard to train up a large new force of energy workers drawn from local and migrant populations. Who is motivated to work?
Flatonia
You’ve got John Wayne stances
You’ve got Erroll Flynn advances
And it doesn’t mean a doggone thing
Huntington Beach
California
Mike Sutherland,
Maybe robots will do the jobs that the men do. In any case, we will see what happens, World C+C output has been rising since the pandemic and will probably continue until roughly 2030, though I expect close to flat output over the 2028 to 2032 period so the new peak (and perhaps the final peak) may be in that 5 year period maybe at 85 Mb/d (plus or minus 1%). Time will tell.
Mike Sutherland,
Well said. The same problem exists inn the refining and petchem business. I am still working at 67 trying to figure out what is going to happen. Not much is happening re the green revolution. Refineries are not investing because they cannot see a return, and young people are not willing to get their hands dirty. The transport fuel demand is supposed to decline but their is precious little evidence of that happening. Good luck with the electrification of transport. A few cornies will buy an EV but the masses are not interested. Hydrogen and e-fuels are still a concept. A very expensive concept at that. Some shysters are making a shed load of money talking up the boondoggle.
Carnot —
At the risk of repeating myself, there isn’t much reason to expect renewables to “save the world” or even replace fossil fuel.
But there is plenty of reason to expect solar in particular to drain the profit out of the fossil fuel industry. The business model of making the whole investment up front and have near zero marginal costs for energy production is pure poison to anyone selling fuel for a living. It doesn’t matter if it’s “really cheaper” or not.
Good luck with him. He is about 50 years behind the times on reality.
“A few cornies will buy EVs”
Reality check
EV sales since 2017 from 0 to 14 million annually
ICE car sales over same period – down from 82 to 62 million
https://www.iea.org/reports/global-ev-outlook-2024/trends-in-electric-cars
You have some issues worth taking to the non-oil section.
Tim Morgan brings reality to the predicament.
A few here may need to read it more than once.
https://surplusenergyeconomics.wordpress.com/2024/07/22/284-maybe-later/#respond
https://surplusenergyeconomics.wordpress.com/
“Argentina’s biggest oil and gas producer, state-run YPF SA, is moving ahead with plans to build a US$2.5-billion cross-country pipeline that’s key to unlocking exports of crude from the vast Vaca Muerta shale patch in Patagonia.”
https://www.batimes.com.ar/news/economy/ypfs-us25-billion-shale-oil-pipeline-moves-ahead-after-approval.phtml
“With a target to export around 500,000 barrels per day (bpd) of shale oil by the end of the decade, the Vaca Muerta Sur pipeline could be transformative. “
btw- the terminus for the pipeline will be a crude oil bulk cargo dock. No plan for refining as as as I have seen.
South America is starting to shape up as a Peak Oil decine hot spot
Venezuela, Guyana, Brazil and Argentina.
“Kuwait has revealed ambitions to nearly double its oil output over the next decade.”
https://oilprice.com/Energy/Crude-Oil/Kuwait-Looks-To-Nearly-Double-Production-After-Major-Oil-Find.html
That new find is equal to about 900 days of Kuwaiti oil production. The 100 billion barrel reserve number is just pure fiction. Burgan is their supergiant. Burgan was badly abused by Saddam when all the wellhead were destroyed. According to Hook, the field was completely swept by the water flood by around 2012.
If so, it supports the observation that information from that ‘news’ source is often inaccurate industry hype. Its a challenge to sort out good news from eyebait.
From Matt in Australia…part 1 of a series-
Peak oil update 2023 – part 1 NGLs
http://crudeoilpeak.info/peak-oil-update-2023-part-1-ngls
Global recoverable oil reserves hold steady at 1,536 billion barrels; insufficient to meet demand without swift electrification
Rystad Energy’s latest research shows global recoverable oil reserves held largely steady at around 1,500 billion barrels, down some 52 billion barrels from our 2023 analysis. Of this year-over-year decrease, 30 billion barrels are due to one year of production, and 22 billion barrels are mostly due to downward adjustments of contingent resources in discoveries.
The largest downward revisions are seen in Saudi Arabia, where development priorities have shifted from offshore capacity expansions to onshore infill drilling. The only country with any significant increase in 2024 is Argentina, with a gain of 4 billion barrels thanks to the derisking of shale projects in the Vaca Muerta formation.
https://www.rystadenergy.com/news/global-recoverable-oil-barrels-demand-electrification
This report believes Saudi Arabia has 247 billion barrels recoverable oil, which seems optimistic to me. This would mean the upper limit of 1,500 billion barrels for the world’s recoverable oil is also optimistic.
Of course, this upper limit is only realistic and economical if oil demand is not impacted by the energy transition, meaning oil prices would rise far above $100 per barrel. In this theoretical “high case,” total oil production would peak around 2035 at 120 million barrels per day (bpd), then decline steeply to 85 million bpd in 2050.
From the Rystad article above.
So 120mbpd, is that all liquids or what. Why would they not specify
as to what is going on here.
It is all liquids, that is the metric often used, real oil is about 80% of that currently and the ratio has been decreasing over time.
Looks like there were a series of earthquakes near Hermleigh, Texas 2 to 5 miles deep. Hermleigh appears to be on the eastern edge of Scurry County. Is this oil related?
Possible the frac fluids are injected and may lead to earthquakes.
Dennis,
It’s not the fracking fluids thats causing earthquakes, but the lubrication of the geology deep in the ground due to massive oil-wastewater injection.
Thought you knew this.
steve
Steve,
Thanks, I was trying to be concise. The waste water that results from fracking (the amounts are huge) gets injected into wastewater wells and this may be leading to earthquakes. I am not a geologist or geophysicist, I will leave it to experts (which you are not) to enlighten us.
The Rig report for the Week Ending July 26
– US Hz oil rigs increased by 5 to 432. They are down 27 rigs from April 19 and are at the lowest count since January 2022 when the count was 434 and rising after the Xmas break. Of the 5 increase, 2 were in Oklahoma and 1 in each Colorado and North Dakota. The fifth was in Texas.
– The Texas rig count was up 1 to 234 rigs and is down 92 from January 2023. .
– The Texas Permian and New Mexico Permian both held steady at 188 and 101 respectively. The Texas Permian is down 56 rigs from the 2023 high of 244 in April 2023.
– In New Mexico, Lea and Eddy were both unchanged at 50 rigs each.
– In Texas, Midland and Martin counties were unchanged at 18 and 31 respectively.
– Eagle Ford added 1 to 44.
– NG Hz rigs dropped 2 to 89. (Not shown).
Frac Spread report for the Week Ending July 26
The frac spread count rose by 9 to 237 and is down 31 from one year ago. It is also down by 35 spreads since March 8. The overall trend in frac spreads appears to be slowly down but could be entering a lower plateau reflecting the drop in the rig count.
New posts are up
https://peakoilbarrel.com/short-term-energy-outlook-july-2024/
and
https://peakoilbarrel.com/open-thread-non-petroleum-july-27-2024/