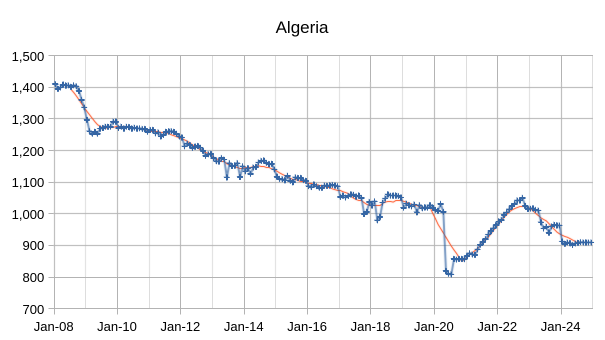
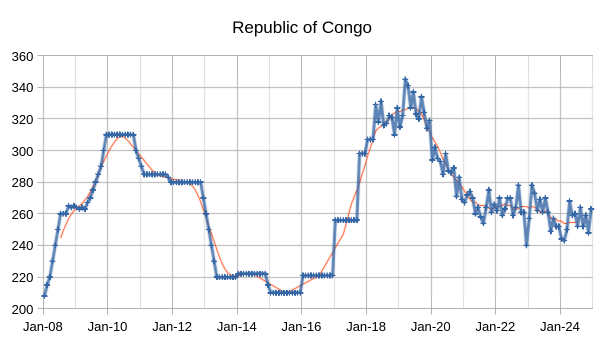
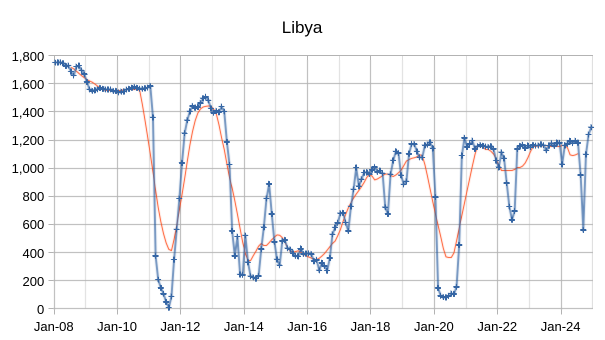
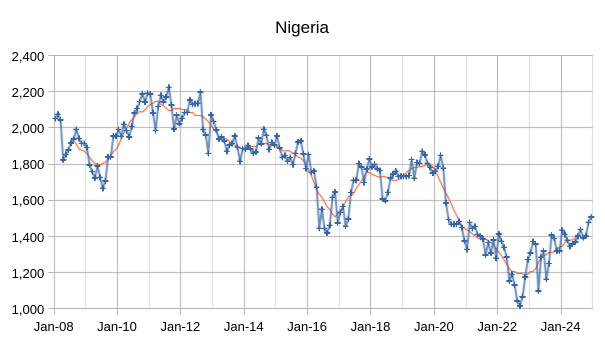
The OPEC Monthly Oil Market Report (MOMR) for January 2025 was published recently. The last month reported in most of the OPEC charts that follow is December 2024 and output reported for OPEC nations is crude oil output in thousands of barrels per day (kb/d). In the OPEC charts below the blue line with markers is monthly output and the thin red line is the centered twelve month average (CTMA) output.
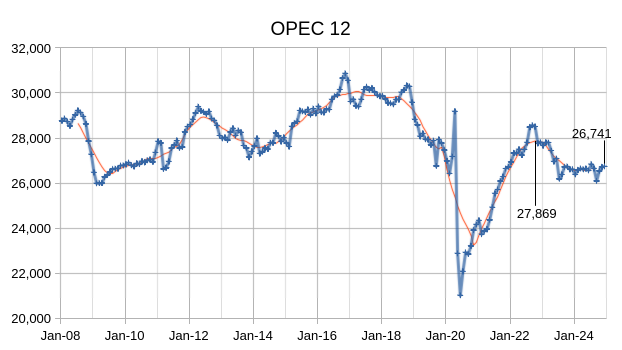
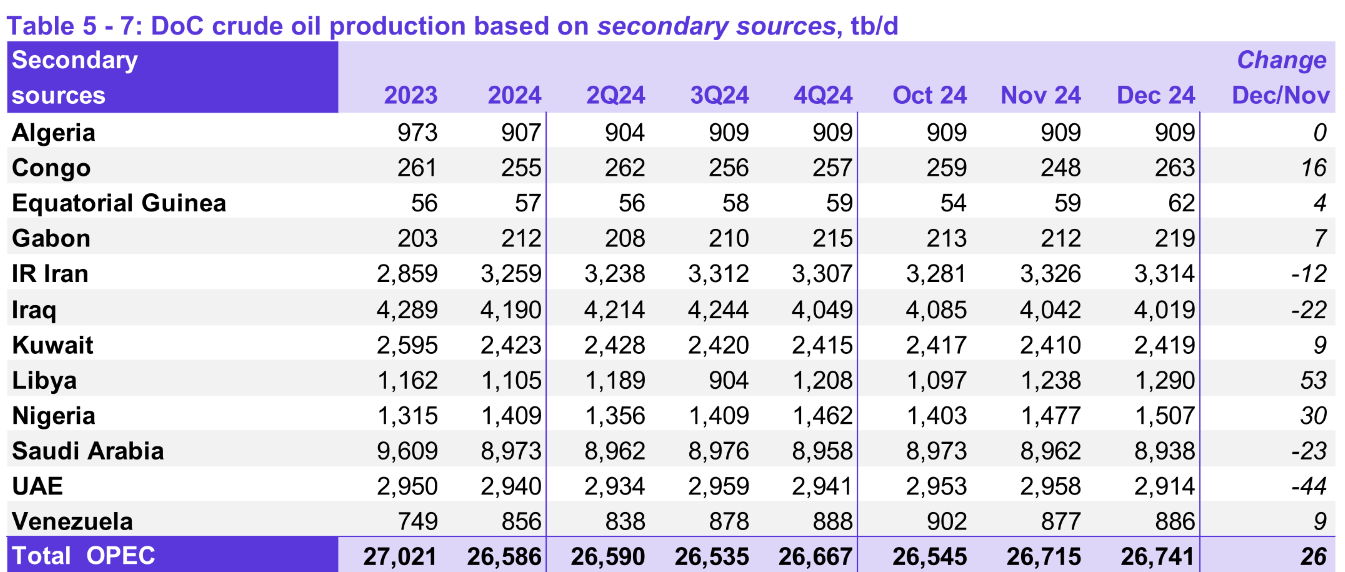
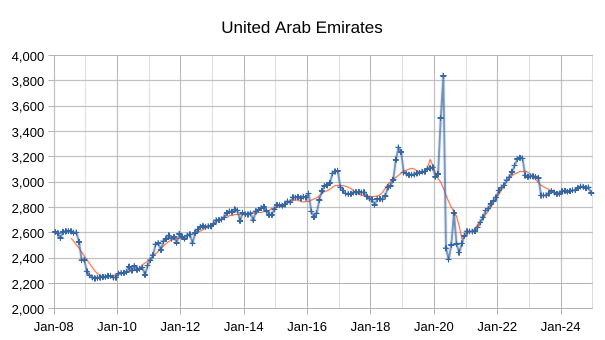
Output for October 2024 was revised lower by 9kb/d and November 2024 output was revised higher by 58 kb/d compared to last month’s report. OPEC 12 output increased by 26 kb/d with most of the increase from Libya (53 kb/d.) Nigeria also increased by 30 kb/d while UAE saw a decrease of 44 kb/d. Other OPEC members had small increases or decreases of 23 kb/d or less.
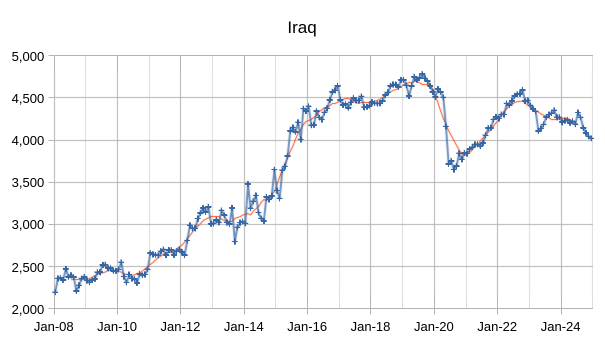
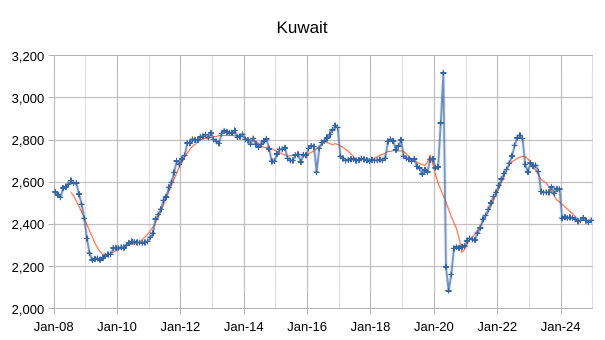
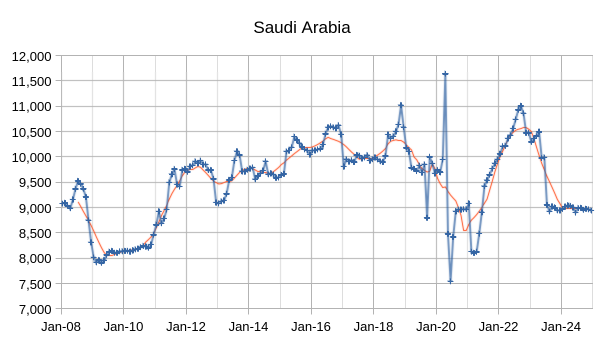
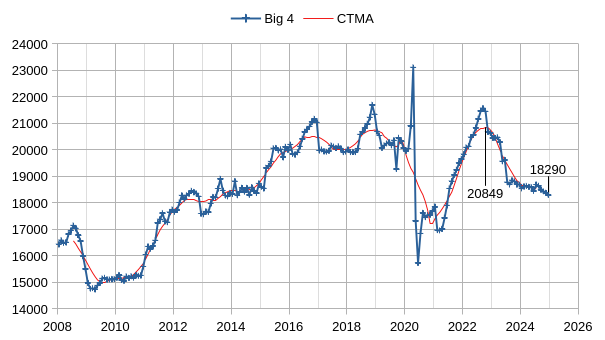
The chart above shows output from the Big 4 OPEC producers that are subject to output quotas (Saudi Arabia, UAE, Iraq, and Kuwait.) After the pandemic, Big 4 average output peaked in 2022 at a centered 12 month average (CTMA) of 20849 kb/d, crude output has been cut by 2599 kb/d relative to the 2022 CTMA peak to 18290 kb/d in December 2024. The Big 4 may have roughly 2599 kb/d of spare capacity when World demand calls for an increase in output.
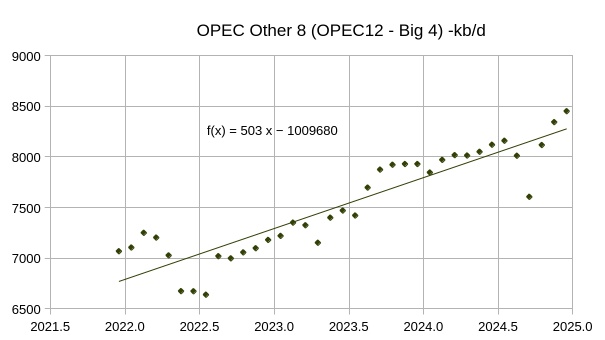
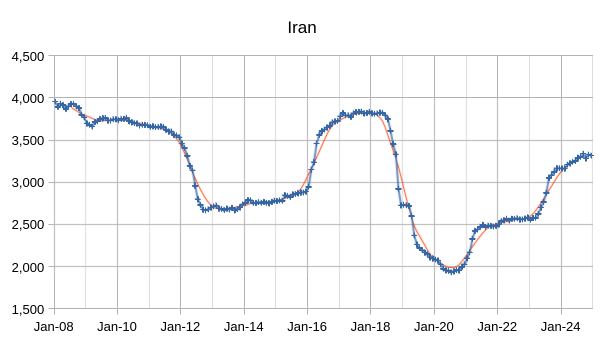
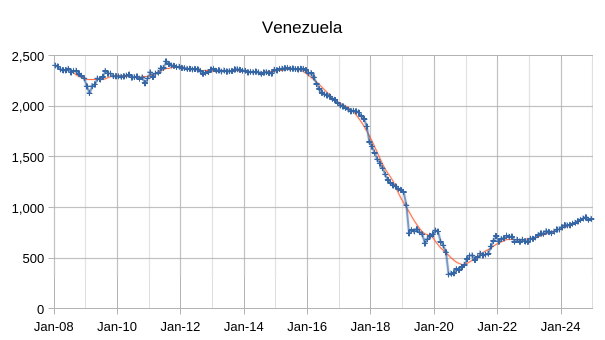
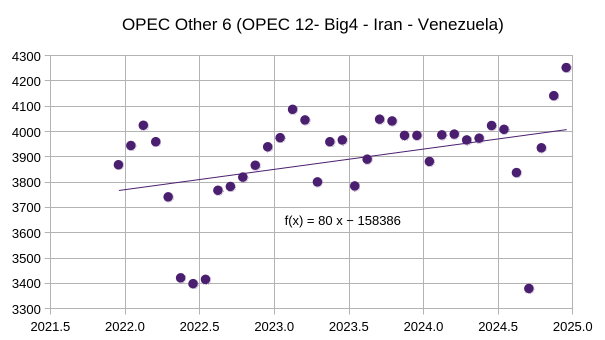
Most of the increase in the Other 8 OPEC nations (those OPEC 12 nations that are not part of the Big 4) came from Iran and Venezuela (about 423 of the 503 kb/d average annual increase), with the remaining 6 nations that were subject to quotas having relatively flat output over the 37 month period covered in the chart above (December 2021 to December 2024) . See chart below for OPEC Other 6 (OPEC 12 minus Big 4 minus Iran minus Venezuela) with an average annual increase of only 80 kb/d over past 3 years.
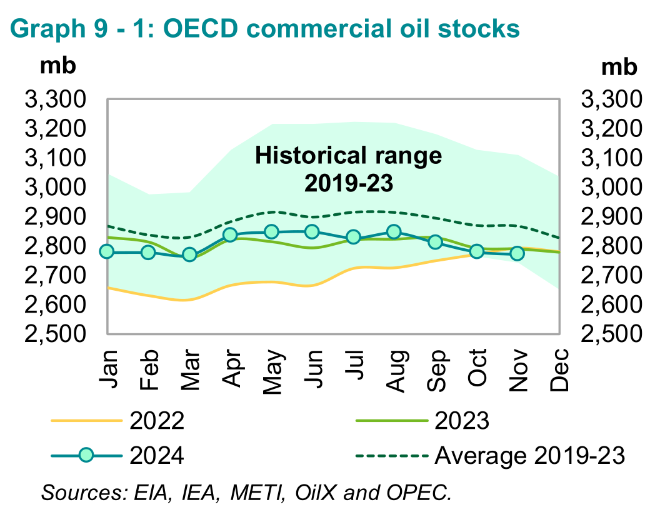
OECD Commercial petroleum stocks remain near the bottom of the 5 year range from 2019 to 2023, so far the market seems to need less oil than earlier periods as oil prices remain relatively low.
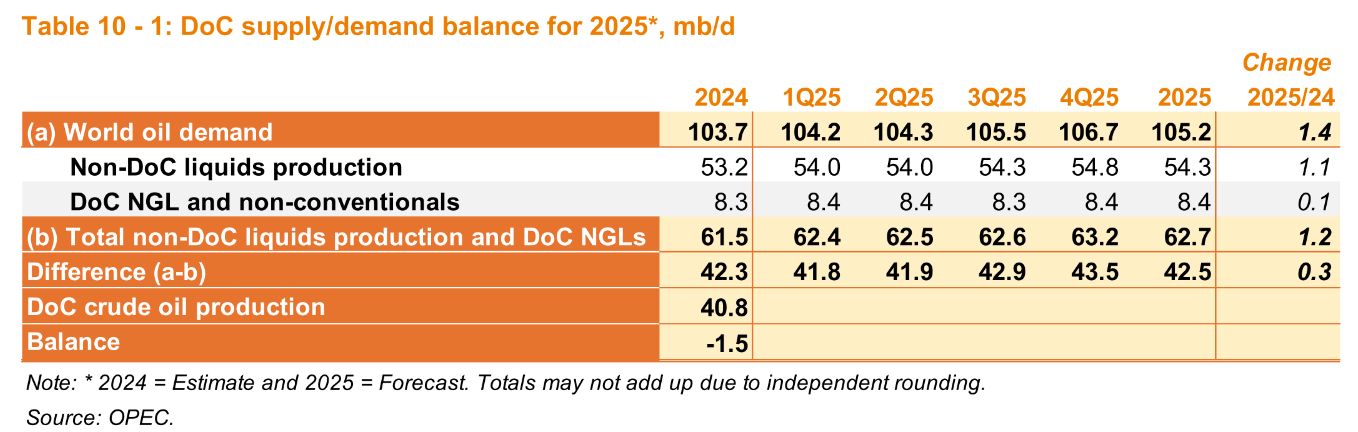
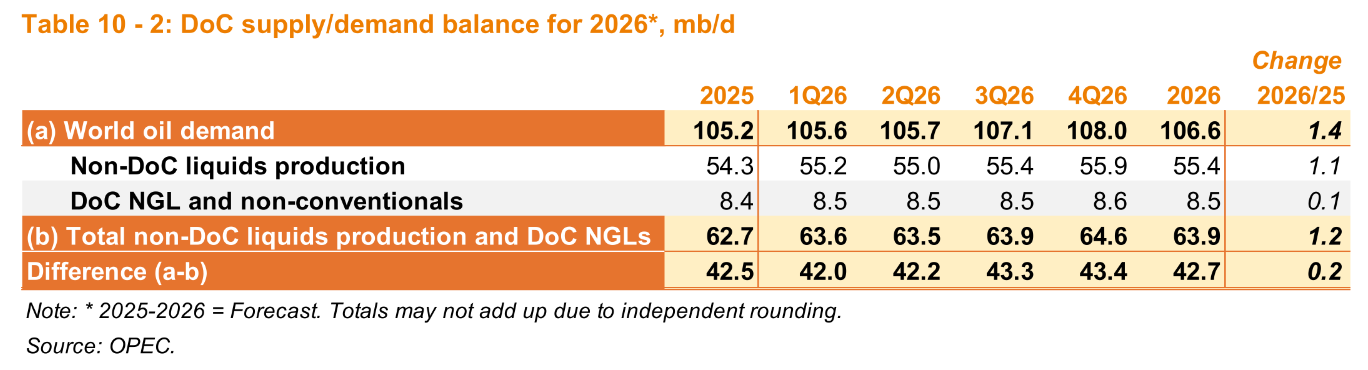
OPEC expected growth in 2025 is unchanged from last month’s report and the 2026 estimate for World liquids growth is the same as the 2025 estimate at 1.4 Mb/d, this month is the first estimate for 2026 demand growth and non-DOC supply growth.
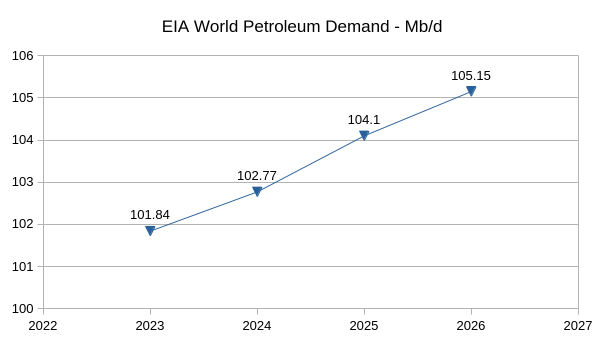
Chart above shows the significant difference between EIA STEO forecast for World Oil demand from 2024 to 2026 compared with the OPEC forecast which is 1.5 Mb/d higher in 2026 and 1.1 Mb/d higher in 2025. Much of the difference in 2025 and 2026 is accounted for by the higher demand estimate by OPEC for 2024 (about 930 kb/d higher than the EIA estimate).
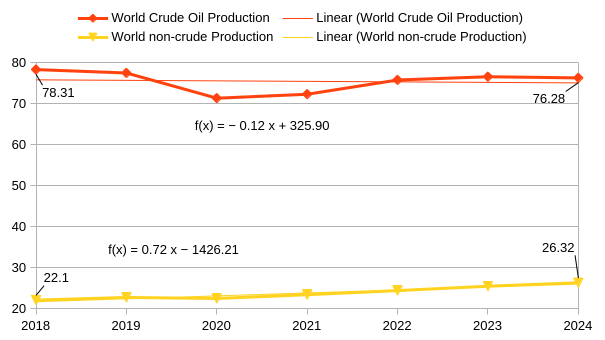
The chart above is based on the EIA’s Jan 2025 STEO estimates for World liquids and World crude, with non-crude Production equal to World liquids minus World crude. From 2018 to 2024 World crude output decreased by about 2 Mb/d while non-crude liquids output increased by 4.2 Mb/d. A significant portion of the non-crude output is ethanol (lower energy density than crude) and bottled gas such as ethane, propane and butane which are useful, but less so as transportation fuels compared to crude oil and the products refined from crude oil.
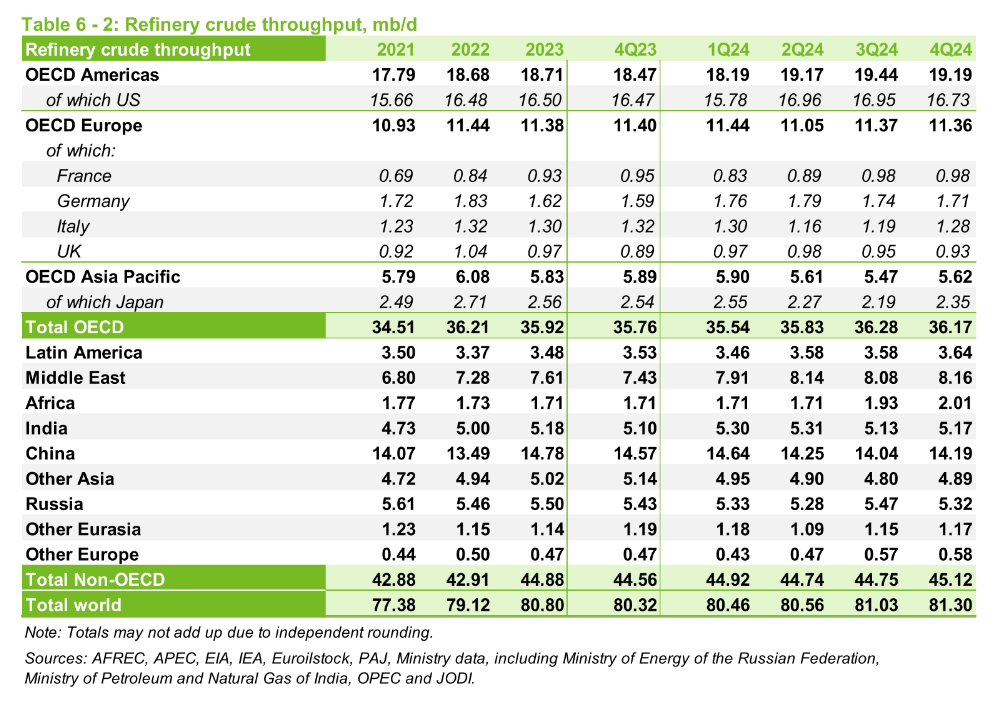
The chart above is included to show that demand for crude oil (input of crude to refineries constitutes most of crude oil demand) has increased from 80.8 Mb/d in 2023 to 80.84 Mb/d in 2024, an increase of only 40 kb/d.
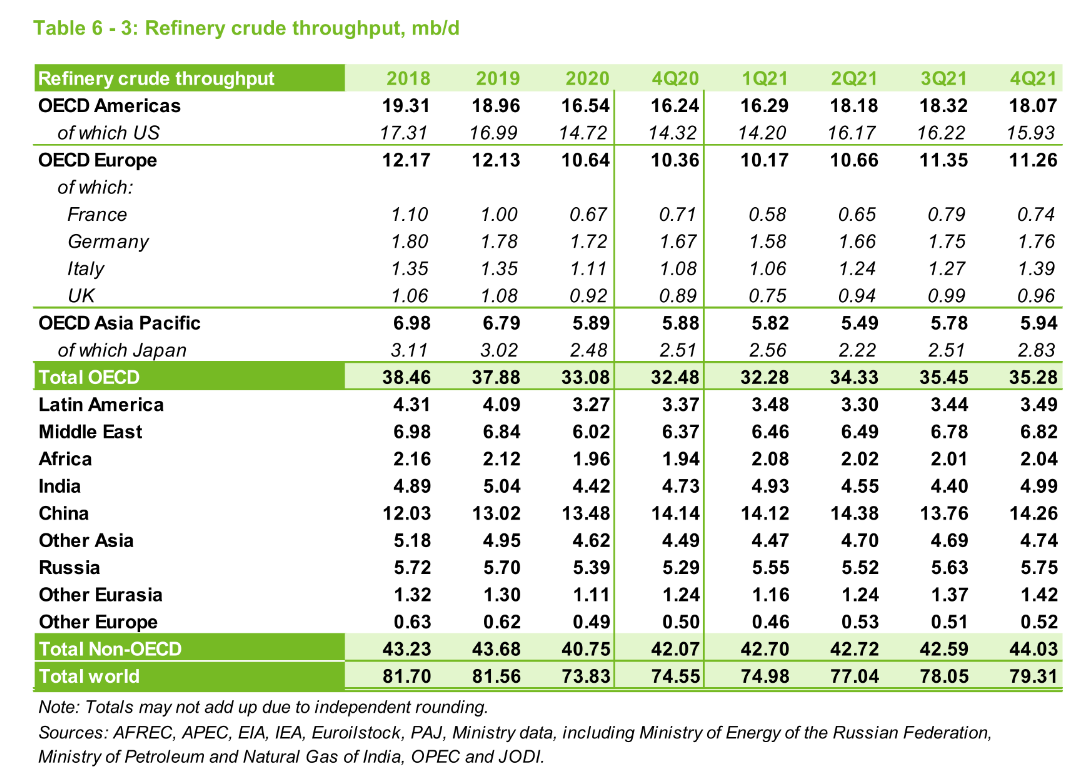
The chart above is from the January 2022 MOMR and shows that World crude refinery throughput averaged 81.7 Mb/d in 2018. World demand for crude has decreased by roughly 860 kb/d from 2018 to 2024, though the estimate may change a bit over time.
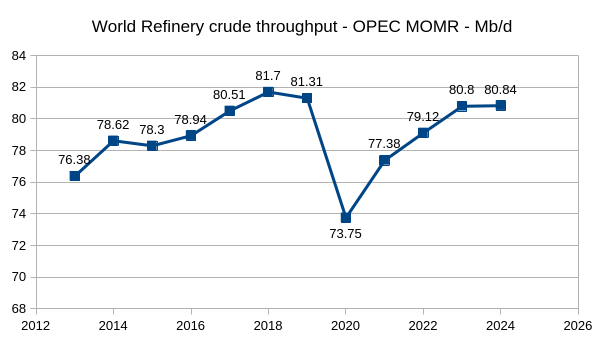
Chart above uses data from OPEC MOMR Jan 2016 to Jan 2025, World refinery crude throughput has not yet returned to the 2018 peak.
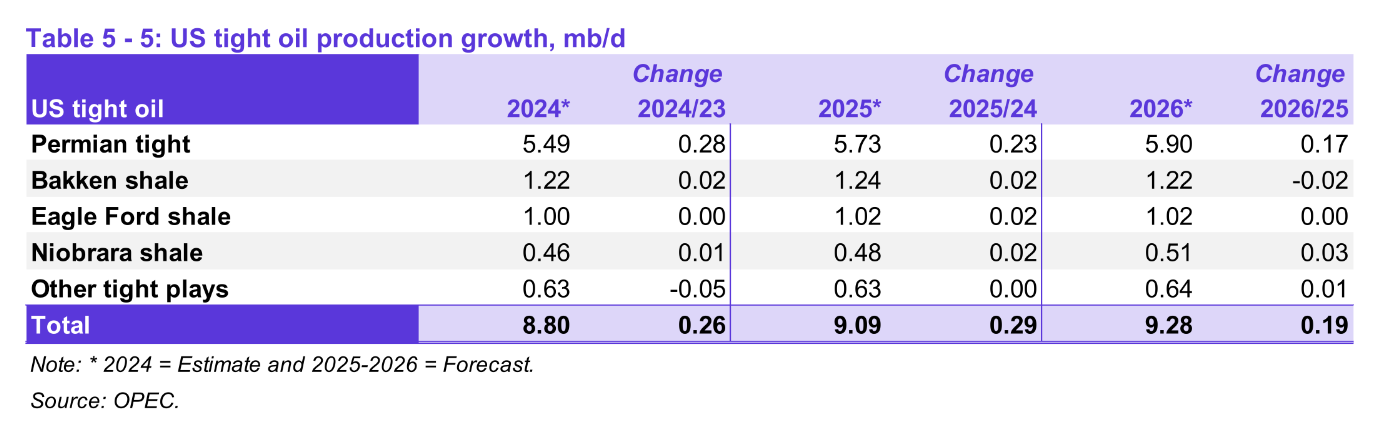
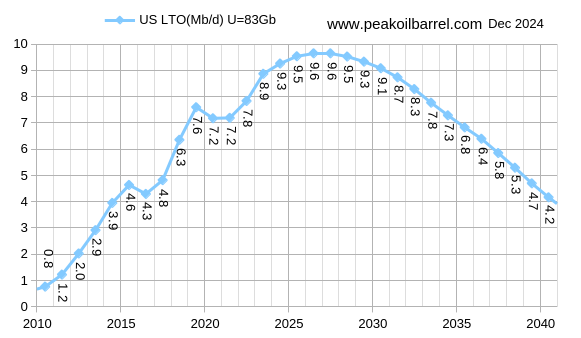
The tight oil estimate for 2024 was revised higher by 60 kb/d compared to last month’s report, the 2025 tight oil output estimate was also increased by 60 kb/d, this is the initial estimate for 2026 tight oil output at 190 kb/d higher than 2025 output. In the chart that follows is my estimate and forecast for US tight oil output, for 2024 I have tight oil output at 9.3 Mb/d, about 500 kb/d higher than the OPEC estimate, for 2025 I have 9.5 Mb/d and for 2026, 9.6 Mb/d. The increases in tight oil in my forecast are about 100 kb/d smaller in both 2025 and 2026 than the OPEC forecast.
The next 3 charts all use the same vertical and horizontal scale so they can be more easily compared (16000 kb/d on vertical scale from minimum to maximum and 9 years on the horizontal scale.)
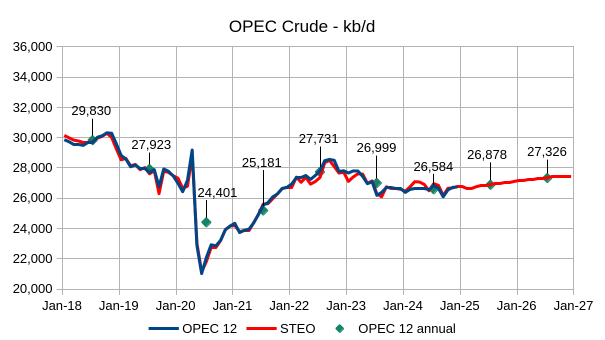
The chart above compares the OPEC 12 monthly crude output estimates from the MOMR secondary sources charts with the EIA’s Jan 2025 STEO estimates from Jan 2018 to Dec 2024. The annual average estimates are based on the MOMR data up to 2024 and for 2025 and 2026 use the EIA STEO forecast. Note the small increase of only 294 kb/d in 2025 and somewhat larger increase of 448 kb/d in 2026, OPEC has spare capacity for further increases after 2026 if the STEO forecast is accurate.
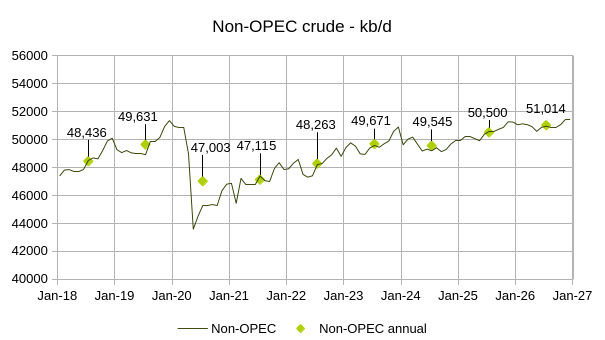
The chart above is based on the EIA STEO from Jan 2025, non-OPEC crude output increases by 955 kb/d in 2025 and by 514 kb/d in 2026 according the the EIA.
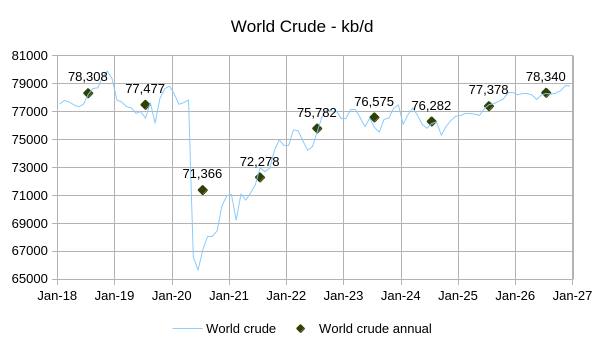
This World crude estimate and forecast also comes from the Jan 2025 STEO. World crude output increases by 2058 kb/d from 2024 to 2026 according to the EIA. Given how slowly crude demand has grown since 2018 (demand has actually decreased by about 860 kb/d based on refinery throughput) this forecast seems quite optimistic.
117 responses to “OPEC Update, January 2025”
Thanks, Dennis!
One note on non-crude production: a major portion of it is Condensate, which is close to crude and is often lumped with Crude. Condensate production has grown in recent years, because of the growth in natural gas production.
Kdmitrov,
Yes condensate output is forecast to increase by about 1400 kb/d from 2020 to 2026 and increased by about 896 kb/d from 2020 to 2024, I agree much of this is due to increasing natural gas production, but the percentage increase in condensate output was an annual rate of about 4.4% per year from 2020 to 2024, while World natural gas output increasd by about 1% per year from 2019 to 2023 so it seems the natural gas is getting wetter over this period.
From 2018 to 2026 condensate increases by about 1460 kb/d while non-crude liquids increases by 4200 kb/d, so the condensate increase is about 35% of the total non-crude liquids increase ( a significant portion indeed ).
gas from Quatar’s North Dome, the world largest gas field, is a condensate field which has Gas to Oil ratio at about 2~3:1, according to my isotope model,
https://youtu.be/BAb6-m0UX9c
whereas other reservoir simulation gives 3~5:1, which significantly lower the condensate production for certain amount of gas produced.
Perhaps if DJT also annexes Venezuela some heavy crude could be extracted from Orinoco, to be blended with the lighter blends from up a bit north? Not to give any ideas but it´s kind of an obvious business deal.
(If the Canadians with their tar sands get non-agreement capable, or such)
Just below the last graph:
“This World crude estimate and forecast also comes from the Jan 2015 STEO. World crude output”
Typo… should read Jan 2025 STEO
Thx for the correction
So OPEC is claiming 1.5MM bpd draws in 2024? Seems dubious….
Kdimitrov,
Yes that is what they claim in their balance of supply and demand and I agree this seems very dubious, I expect it will be revised. The EIA estimate for World demand is probably more accurate and would suggest a draw of 0.5 mmb/d in 2024.
“From 2018 to 2024 World crude output decreased by about 2 Mb/d while non-crude liquids output increased by 4.2 Mb/d. A significant portion of the non-crude output is ethanol”
Ethanol production requires crude oil input. In the US corn ethanol production is only weakly net energy positive.
Its more of an Ag sector jobs program/constituent subsidy than an independent energy source.
Including ethanol in the liquids production tally is an exercise double counting, to a considerable extent.
When it comes to oil production it seems that the World Refinery Crude Throughput is a more important aspect to track.
Hickory,
I agree, ethanol is not really an energy product from a net energy perspective. World consumption of biofuel was about 4.7 EJ in 2023 (includes biodiesel and ethanol) and total petroleum liquids consumption (excluding biofuel) was 196.4 EJ in 2023, so biofuel consumption was only 2.3% of the liquids total and ethanol consumption was about 2.48 EJ or about 1.2% of the total liquids energy consumption. Data from Energy Institute’s Statistical Review of World Energy.
Ethanol production requires crude oil input. In the US corn ethanol production is only weakly net energy positive.
Ethanol doesn’t really “require” oil input. Farms use diesel to operate – that could change (electrification, CNG, ethanol, methanol, syndiesel, ammonia, etc., etc). More importantly, diesel is only about 1/4 of the energy input of ethanol. Ethanol is about 5:1 liquid fuel ROI. The Liquid fuel ratio is a far more important metric than joules.
Don’t get me wrong: ethanol definitely started as an agricultural subsidy program, designed to soak up surplus corn. But it’s worth being realistic about the actual contribution to liquid fuel production.
Nick G,
Volume is a very poor way to look at things, a barrel of diesel has 50% more energy per barrel than a barrel of ethanol. So claiming that a barrel of ethanol is no different than a barrel of diesel is a mistake in my view.
Dennis,
Some thoughts:
1st, I didn’t say the ROI was based on volume. IIRC, these calculations are based on energy. If it’s based on volume, the ratio would indeed be 59% (76,100/129,500). Even if the energy ratio is 3:1, that could still provide the liquid fuel needed by a farm.
Finally, ethanol is one product of a process that also produces cattle feed, so a simple energy ratio isn’t complete.
Is ethanol an optimal use of farm resources? On the whole, I’d agree it’s probably not. OTOH, it’s one of many reasons that suggesting that agriculture is going to collapse due to lack of fuel (or that the farm population will have to greatly increase to compensate) is highly unrealistic.
Nick, please explain the energy content embedded in and used through out the year in tractors, farm equipment, fertilizers, seed, tractor mechanics, trucks, roads, the ethanol processing plants and all the workers from farmers, truck drivers to ethanol plant workers is included in your calculations…
If you can’t, then like every other EROEI calculation it is bunk…
In a fully free market, without any subsidies on ethanol, or taxes on oil, or official mandates on ethanol use, would ethanol production for fuel be happening at all??
This might be useful. Not exactly what you asked for, but relevant to the point I was trying to make.
Corn takes about 3.5 gallons of diesel per acre, year round, to produce (a range of 2 to 5, with no-till at the low end). An acre of corn can produce the equivalent of about 320 gallons diesel (160 bushels per acre, 2.8 gallons of ethanol per bushel and .7 gallons of diesel per gallon of ethanol), so that’s roughly 1% of corn production needed to power tractors.
Corn ethanol would make a lot more sense for tractors than for light passenger vehicles.
At 160 bushels per acre, 2.8 gallons of ethanol per bushel and .7 gallons of diesel per gallon of ethanol, that’s about .8% of corn production needed to power tractors.
This data was at the following link, but it seems broken. Seems like something that you could find from other sources.
https://pubs.ext.vt.edu/content/dam/pubs_ext_vt_edu/442/442-073/442-073_pdf.pdf
you are again using just the diesel component and not the embedded energy in the tractor, driver, the trucks roads, truck driver, ethanol processing plant workers etc.
You have just highlighted everything wrong with EROEI studies concentrating on just the fuel use and nothing else. It’s all the other stuff that’s important and missed out on.
If all the farmer does is produce corn for ethanol throughout the year, then all the fuel he/she uses for all other purposes in ‘living’ so they can produce the corn at the correct time counts in the overall numbers, including driving everywhere, heating the house, heating hot water, all the embedded energy in everything they use etc.
If you want to argue it doesn’t count, then where does the energy for all this come from when doing EROEI numbers?? If the farmer is unable to heat his home in winter then the corn wont be planted as he will have frozen.
There is just too little thinking of the entirety of the situation.
The only mechanism we have to measure all the energy is the money cost of all these things, and as ethanol has tax credits, subsidies, grants and mandates to keep it going, the EROEI must be very low. A high EROEI would not require any subsidies or mandates as it would be cheap…
Hideaway,
You’ve highlighted the problems with drawing boundaries for such studies. In particular, a fundamental rule is that some things are inputs, and some are not. The purpose of a society is to take care of its citizens: they are not feedstock for the society, or inputs. Oligarchs may think that way, but it’s inhumane and inhuman. So, basic food for people is not an input. Daily transportation, whether to work or whatever, is not an input. Notably, the IRS agrees: you can’t deduct travel to work or volunteer organizations or wherever. Put another way, people need to live, regardless of what kind of work they’re doing. Whatever source of energy you use, people need to not freeze to death, so it makes no sense to include it as an input in a comparison. People don’t live to produce energy, they produce energy to live. And remember: the purpose of EROI analysis is to do a useful comparison: if an input is identical in every energy source, it wouldn’t add meaning (even assuming it was a valid input, which it is not).
Work tools are an input, which includes work vehicles, tractors, etc. OTOH, such things are a second order input: they are long lived, so the amortized embedded energy is very small relative to daily fuel consumption (commercial vehicles are often used for 30 years). They are also manufactured items, which require very little oil: there is little combustion on assembly lines – electricity dominates. There is some process heat, but that’s not oil. There’s plastic, but that can come from non-oil sources (ethane, etc), and more importantly that’s relatively small, especially after the amortization discussed above (not to mention that plastic can be recycled or substituted with other materials).
Nick………..” And remember: the purpose of EROI analysis is to do a useful comparison:”
The problem is they are not useful comparisons at all..
We know that fossil fuels can build and operate a modern civilization, at least in the growing phase, simply because modern civilization exists built and operated by fossil fuels. They can and have created all the excess energy for the rest of society to live and operate including all the workers in the fossil fuel industries.
After accounting for all the energy uses, including heating, driving from A to B throughout the year, hot water, cooking, etc, etc for all fossil fuel workers, there has been plenty of left over energy for the rest of civilization to build and operate the system we have.
So why should all these used energy sources be ignored for ethanol, solar, wind and nuclear?? Is the assumption all these background energy uses will continue to be supplied by excess energy from fossil fuels?? It has to come from somewhere!!
If we do not account for the full energy use in EROEI calculations, then we are just lying to ourselves. Just because everyone likes the numbers that come out when we lie to ourselves, does not mean they are accurate, nor are they a basis to build a future upon.
Setting boundaries to exclude energy use in such studies is just nonsense, as lots of people believe the numbers to be ‘real’ when they are clearly not…
The only possible way to do like for like comparisons is to include all costs of building and operating any energy production system, with the returns over the life of the energy system using a constant of the value of energy.
We know from research, that I’ve done myself and anyone else can do, that the wholesale cost of energy over the last decade has been around $US40/MWh, no matter what the form of energy, on average, over that period of time. The actual number doesn’t matter as it’s the ratio that counts..
At a $US40/MWh is what the factories and machines that produce solar panels have been built with, likewise for the modern drill rigs, plus it accounts in dollar terms, for all the energy used by all the workers throughout the system. It accounts for the mines built and machines there, the metal processing plants and metal refineries etc, etc..
All industrial purposes happen at wholesale rates of energy costs, not retail, so the building and operating of everything should be done at wholesale costs, but it really doesn’t matter as any random number can be chosen provided it’s used on all energy provision systems..
At $40/MWh something like 1 MWh of solar will return $40 X 4hrs/d X 365d X 25 yrs = $US1.46M. At a building, maintenance and operating cost over it’s life of well over $US1M the EROEI of solar, before any backup is too low to sustain the rest of civilization, yet we have ridiculous studies with huge ‘boundaries’ showing returns of 20/1-40/1, because they miss out on most of the energy used to build them..
I don’t have the numbers for Ethanol production, but it’s very easy to understand that anything that requires, subsidies, grants and mandates has a much lower EROEI than the existing system based on fossil fuels, that pays royalties, taxes and has huge profits.
This has nothing to do with the damage of fossil fuels use, it’s just the reality of energy return. I’m well aware of the damage to climate, the environment, other species and the world ecosystem, plus the increasing energy cost of obtaining the necessary fossil fuels to run modern civilization.
We know that fossil fuels can build and operate a modern civilization, at least in the growing phase, simply because modern civilization exists built and operated by fossil fuels.
Modern civilization depended on horses until about 1900. Does that mean we should have stuck with horses?
Get a horse!!
—————————-
After accounting for all the energy uses, including heating, driving from A to B throughout the year, hot water, cooking, etc, etc for all fossil fuel workers, there has been plenty of left over energy for the rest of civilization to build and operate the system we have.
FF workers are included in any E-ROI analysis. That’s fundamental. They’re about 3% of the population, and 100% of the population is included in any analysis. That’s really basic.
——————————-
We know from research, that I’ve done myself and anyone else can do, that the wholesale cost of energy over the last decade has been around $US40/MWh, no matter what the form of energy, on average, over that period of time.
Please present that analysis.
———————————
At $40/MWh something like 1 MWh of solar will return $40 X 4hrs/d X 365d X 25 yrs = $US1.46M. At a building, maintenance and operating cost over it’s life of well over $US1M the EROEI of solar, before any backup is too low to sustain the rest of civilization, yet we have ridiculous studies with huge ‘boundaries’ showing returns of 20/1-40/1
That confuses cost analysis with E-ROI: the two are completely different.
Your analysis simply suggests that a solar system with a capacity factor of 16% can produce power for less than 4 cents per kWh ($40/MWh). That is a very competitive cost. New US utility scale PV typically has a CF of about twice that. Cost is directly inversely proportional to CF, so according to your analysis US PV should have a per kWh cost of about 2 cents!!
Can’t be beat.
Nick, please give a link to any EROEI research paper that includes the energy used by all the workers involved in that energy industry. For fossil fuel workers, it would include a component for all the drill rig manufacturers workers, the mine workers where the drill pipe and casings came from, etc.
I’ve read hundreds if not thousands of EROEI type papers, often following references in them then references of references etc, to find exactly what they include. When I get get back far enough and the references of references of references are often over a decade old or more, I get numbers from steel, glass and aluminium industries that only include the energy used, in the processes, for example around 14MWh/tonne of electricity for Aluminium, which is just the power used, with no allowance for the smelter, the workers, accountants, management etc..
I’ll gladly read any link you can show that truely includes all the energy used by the people.
Using dollars paid for the product is easily the best representation of the energy taken to produce any/every mass produced commoditised good, as it’s a competitive marketplace for all these things. We are not talking poets and artists…
In regard to average energy prices, just take the average of oil prices over the last decade divide by 10, then divide by 1.7 to get energy content back to $/MWh. Likewise for metallurgical coal, and gas (I used price in East Asia, the manufacturing hub of the world, as we are talking manufactured products).
The part you missed is that the actual number is irrelevant, as it’s the variation in ratio of the different forms of energy to each other over their life that counts. A higher initial cost of energy will give a better EROEI for everything, a lower one a worse EROEI for everything, it’s the ratio between each that counts.
Some of the Saudi oil (not all) only cost $US2.50/bbl to produce (after accounting for all capital, O&M costs!!) and refine into products. At $US70/bbl, that’s $41/MWh of energy product. In a world where the average energy wholesale cost has been around $40/MWh for a decade (with variations), it means it has an energy return of around 28 to 1. It cost 1MWh of energy to build, maintain and operate while returning 28MWh of energy content. It’s why the operation is so wildly profitable. The oil comes out of the ground for free to the Saudi’s, just like gas, coal, wind and solar are all free. We just make up this thing called money to exchange to each other to gain access to the energy, while spending materials and energy building the machines that make the energy useful.
Using exactly the same type of metrics, solar and wind have a return of less than 2 over their life, before interest costs or disposal costs at end of life, or allowing for any backup to overcome intermittency, like pumped hydro, batteries or extra transmission lines from afar. Nuclear is barely break even.
Anything that is less than 2/1 or breakeven is useless to modernity, we need EROEI of over 10/1 to run all the industries and services, that use most of the energy provided from the energy sources. Plus of course modern civilization has to grow or collapse, which is impossible in the long term because of thermodynamic issues of overheating the planet.
Because of entropy and dissipation, we are required to mine lower and lower ore grades, so energy use must increase, it’s a physical certainty that ‘efficiency gains’ cannot overcome. Already it takes nearly 5 times as much energy to mine a tonne of copper as it did 50 years ago, despite efficiency gains in mining, which are suffering from diminishing returns on efficiency gains…
Hideaway
“…hundreds if not thousands of EROEI type papers”. Sure.
Hideaway seems to not be familiar with lifecycle analysis.
Dennis, …Same for you…. “please give a link to any EROEI research paper that includes the energy used by all the workers involved in that energy industry and lead up industries.”
A lot of papers refer to Scholten et al for their numbers, yet Scholten only refers to processes, nothing to do with capital equipment or the people involved. It’s all the people where all the energy is embedded/used in wages to them, but is excluded..
I keep telling you this, you can look it up yourself, yet you insist on just stating useless papers produced by people like Murphy that have no real world numbers in them at all!!
It is you that do not understand the reality of how useless all the lifecycle papers really are, nor are prepared to do the work to find out for yourself..
T Hill, I’ve been researching everything about our energy future for decades. Why would you make such a statement as you did above?? I never came to my findings lightly, in fact I spent years trying to make the numbers for solar and wind work, in modern remote mines, where the diesel cost is very high due to remoteness.
None of it works economically, nor can it on a civilization wide basis. It’s just too material intensive, coming from ore grades that are falling, requiring an increase in energy just to stand still in production.
If solar and wind were the cheapest form of power, cheaper than coal, then in remote mine sites they should be way cheaper than using diesel to run all machines, yet the capital cost to run effectively off just solar, wind and batteries are prohibitive. Can they be used to save a bit of diesel, sure, but replace diesel no, and no-one is trying to do that..
For years I’ve been trying to find why the narrative of cheapness/high EROEI for renewables, doesn’t match reality on the ground. This has involved in going down the rabbit holes of references of references to find the actual methods used to come up with the generally accepted EROEI on everything used so often. Only going back to original sources, can you find the information, which always sets boundaries of what is included and excluded.
Here is an example of the chains of references used…. from Scholten MJ that was published in 2005, referenced by Weissbach et al in 2013, which referenced by the World Nuclear Industry in 2024, to prove their point…
https://world-nuclear.org/information-library/energy-and-the-environment/energy-return-on-investment#:~:text=Energy%20Return%20on%20(energy)%20Investment,different%20methods%20of%20electricity%20generation.
“For the production of high-purity polycrystalline silicon from metallurgical-grade silicon, we only considered processes that are specifically dedicated to production of silicon for PV applications.”
It’s just the energy in the processes they use, zero counted for the wages of all the people involved, as if that energy was free. Yet no-one in our modern era wants to look at the true reality of our situation, so yes hundreds if not into the thousands of papers that are mostly bunk, which is why I spent time to came up with my own method to compare like for like…
Hideaway,
EROEI studies are comparative, the goal is not a perfect study which would take an infinite amount of time to accomplish. As for as going back many generations to find all energy we can look at past energy use and realize that the energy embedded in workers etc only goes back so far in time as workers do not live forever and built assets also do not.
The intermittent nature of wind and solar are a problem for the use case you keep returning to (aluminum smelting in Indonesia), but for the general case where solar and wind are integrated into a modern grid they are cheaper when compared to fossil fuel using the same underlying LCA to compare. This is the part you fail to understand.
Hideaway,
My apologies for the sarcasm. The sarcasm was prompted by the hyperbolic and inaccurate nature of your statement. “…hundreds if not thousands of EROEI type papers”. So which is it, hundreds or thousands? No, don’t answer, it doesn’t matter. I know that you have read many such references, as your comments sometimes cite pertinent details. I’ve backtracked those comments of yours through the references enough to see this much.
However, this type of comment in your posts does little to support the general aim of your argument(s). Your main underlying theme is generally very important and consistent with the thoughts of many on this board.
However, it seems like you drew your conclusions many years ago and are resistant to newer information or data/analysis which contradicts any aspect of your position. You typically just seem to ignore any such inconsistencies.
You’re not alone, and a site like this regularly proves the truth of one of Upton Sinclair’s famous quotes that “It is difficult to get a man to understand something when his salary depends upon his not understanding it.”
I come here for the authors (like Dennis) that can take a cold, impartial look at an argument, or others that have some particular technical expertise or insight to add that I lack or have missed. Suggest you focus more on this and less on unsupported rhetoric.
Dennis …. “but for the general case where solar and wind are integrated into a modern grid they are cheaper when compared to fossil fuel using the same underlying LCA to compare. This is the part you fail to understand.”
No Dennis it’s the bit you fail to understand. Take the AEMO grid in Australia that has had an increased proportion of solar and wind over the last 15-20 years, with the highest penetration of solar in any major grid. The cost/price of electricity during this period has gone up way in excess of real terms, because the coal has to be throttled back a lot of the time and many gas generators need to be on standby a lot of the time. Heavier industry has been leaving the country during this period as well, to where the power is cheaper.
Look anywhere in the world where renewables make up a decent proportion of the power grid, like Germany or Denmark where the price of power to the consumer is now among the highest in the world.
The whole aspect of new Aluminium smelters being powered by coal in Indonesia, is about the actual cheapest form of electricity, plus if renewables can only run as add-ons to existing grids and not from grids by themselves, then there is no long term future for them anyway.
All the existing grids have to have enough standby generation capacity, to operate when the sun doesn’t shine and wind doesn’t blow for days or weeks at a time. All this extra generation capacity of coal, gas, diesel generator, etc is being used way below it’s actual potential capacity, while still suffering from entropy over time. Even large transmission interconnectors are extra costs not required unless renewables are a large part of the system, so they are also extra cost and entropy of the entire grid..
By having to have all the backup anyway, then the grid is way less efficient and therefore has a greater cost, as it could easily run on just the back-up without any solar and wind costs at all, until we deplete the resources..
If you understand any economics at all, then you would know that anything requiring tax breaks, subsidies, grants and mandates is uneconomic compared to a system that paid royalties and taxes…
EROEI research is all bunk because they set inappropriate boundaries, and because some academics have ponied up on them to show irrelevant returns from irrelevant accounting, which politicians buy as ‘real’, is not helping anything. It’s just another lie that humans tell themselves about the future, like we have been lying to ourselves about many things, placing humans and our ingenuity at the centre of everything for millennia..
Money is a claim on energy, you can go and spend your cash buying energy to use (or just waste) today. The more expensive any item, the more embedded energy is involved in making it.
Using money and cost of energy as inputs to EROEI research is very valid, but academia does not want to use it, as it gives very poor results to renewables and nuclear, which means we cannot run a modern civilization off these forms of energy. Meanwhile the EROEI of fossil fuels is falling anyway, plus all the damage they do to climate, environment etc. As they also deplete, the costs in energy terms will become too much to sustain civilization anyway.
What it really means is that modern civilization is a one time, short term affair, which is not sustainable in any way. I don’t favor one type of energy over another, I’m trying to look at the big picture of what’s possible and what’s not, without gilding the Lily.
As someone that has set up 4 solar systems, including batteries to run off grid applications over the last few decades, it’s pretty easy to think my preference was that solar was way better, than the numbers suggest. The only reason I’ve done mountains of research on the topic of energy is because the numbers just never added up for industrial applications.
Industrial applications are required to run 24/7 as that is the most efficient way to operate. Intermittency wont work for industrial applications, which requires renewables to have 100% backup (coal, gas, hydro, nuclear, pumped hydro, batteries etc) for when they don’t produce.
Not one of the EROEI studies takes the full backup required into consideration, yet we didn’t need ‘backup’ when running off a fossil fuel generating system that had 90%+ capacity factor, with some generation that could be cycled up or down like diesel, gas and hydro for peak use times..
Dennis,
Hideaway is right about Australia and our electricity market.
Your argument regarding renewables being cheaper is weak. Because it is too generalised. The earth has a dynamic environment and climate.
A country sitting on vast amounts of coal and gas reserves would have the cheapest electricity if they build coal and gas power plants. Rather than importing solar panels from China. It is a no brainer.
Likewise there are places in the world were renewables may be cheaper. And others were geothermals are cheaper etc.
Australia is run by retards in the pockets of corporations. For e.g. we export large amounts of coal and gas to China, and they burn it. And the politicians here are like look we have brought down our GHGs emissions. While we end up having the highest power prices in the world. It is ridiculous. U.S has been doing the same, exporting vast amounts of coal to China. Let’s all bury our heads in the sand because apparently exporting FF overseas for another country to burn doesn’t count towards our emissions. Absolute ridiculousness.
All the bureaucracy regarding climate change is nauseating. The truth is, humanity as a whole hasn’t take one serious bloody step towards reducing emissions. Not one. All the Paris agreements and all the other bullshit meetings they have is just pure window dressing.
Reminds me of the WEF meetings claiming they are “concerned” about wealth inequality.
The data on both are clear, with all these meetings GHGs have done nothing but increase. Likewise wealth inequality has done nothing but increase too. What does that tell you about these globalist meetings ? For me just a bunch of rich corporate representatives, big governments and rich individuals meeting to make backdoor business deals, indulge in fine food and fine escorts.
Nothing but the proverbial pigs from animal farm.
Iron Mike,
Climate change is a real problem which needs to be addressed. agree it has not been done adequately, but that does not change the first fact, nor the fact that fossil fuel resources will deplete.
Hideaway’s complaint that 100% backup is needed is not correct, that is only true in isolated cases, for the developed World where there are highly interconnected grids wind and solar are in fact cheaper even without subsidies. As to the claim that places that have high wind and solar generation being most expensive, this is not true in Texas and Iowa in the US that have the highest proportion of electricity generation from wind and/or solar and the lowest electricity costs in the US.
“Ethanol doesn’t really “require” oil input.”
I was talking about the conditions in this world.
Net energy production from corn ethanol is marginal, and a very poor use of prime farmland/wildlife habitat.
And also a very poor use of the oil/nat gas input.
In general, I agree. But, you didn’t address the difference between generic joules, and liquid fuel joules. Plus, the opportunities to replace farm diesel are indeed a part of “conditions in this world.”
Things change. E.g., EVs eliminating passenger and mass transit ICEs in China would have seemed unthinkable 10 years ago. Now, it’s in sight.
Judging by today’s expectations, utilising agriculture for energy is not good enough for living standards as it stands in most developed countries.
Still, as long as you only devote let us say one third of agricultural production for energy production it can be some possible routes; that is the maximum amount to play around with without jeopardising food security severely.
In these calculations there are several ways to cut energy expense no matter what energy source is utilised. Whether it is fertiliser, machinery or ways of getting rid of stones or weeds.
In the future I expect it to be useful to have many more jobs available for routine work in the country side that cities can not supply. Of course that could be a “pay cut”. Call it going backwards a few steps, but I can tell you that if enough services are provided – a lot of people would say it is a fair deal to move to the country side with the freedom it provides anyway.
If income disparities become to large however, that is setting up for unstability one way or another. And that is a growing problem (one of them).
In a comment in earlier post there was some discussion about US Shale Gas.
Below is a Hubbert Linearization using annual production and cumulatiive production.
Note that I think this estimate is likely far too low as the resource is likely to be 1400 TCF with a URR of roughly 1700 TCF with peak occurring at perhaps 850 TCF. The problem with a Hubbert Linearization at this early stage is the plot will be a curve rather than a line until annual production divided by cumulative production is under 4% or so.
Took a quick look at USGS continuous assessments and for my tight oil model the best guess URR is about 67% of USGS mean TRR, if we use this same number (67% of TRR for URR) for shale gas this would suggest a URR for US shale gas of 1090 TCF and if we assume peak occurs at 50% of URR (this is often a bad assumption) it would suggest about 545 TCF of cumulative production at the peak. Currently (end of 2024) US shale gas is at about 317 TCF for cumulative production, suggesting perhaps 228 TCF of production until the peak. Recently shale gas output has been about 31 TCF per year, so maybe 6 to 7 years until peak if we are near an undulating plateau in output for shale gas. So this suggests a peak around maybe 34 TCF per year in 2030 to 2032 for US shale gas.
Chart below has a very rough shale gas model for the US with very little detailed modelling behind it, unlike my tight oil scenario which has a great deal of underlying analysis for individual tight oil basins.
Up to 2023 is based on EIA data, 2024 is based on the STEO forecast for 2024, 2025 to 2052 is a WAG assuming 500 BCF per year increases to 2031 followed by similar decreases for 7 years from 2032 to 2039 and then 1800 BCF per year decreases mirroring the rate of increase from 2008 to 2022.
It goes without saying that this scenario/model is certain to be incorrect.
slightly modified shale gas scenario, URR=1100 TCF.
Dennis, this comes to 87 bcf/d at the peak. If conventional gas continues on its decline trajectory, these 87 bcf/d won’t be enough to supply the LNG complex, data centers, etc…
Kdimitrov,
Many believe that all of the mean TRR estimated by the USGS will be produced and there are other estimates by the potential gas committee that are even larger, much will depend on the price of natural gas.
My scenario is undoubtedly wrong, it is based on the assumption that 67% of the USGS mean TRR for US shale gas will be produced, the assumption may not be a good one. Note that in 2023 shale gas output was 83 BCF/d and total dry natural gas was 103.6 BCF/d in 2023 (including conventional gas) and is expected to increase to 107.2 BCF/d in 2026, my guess is that all of this increase would be shale gas (3.6 BCF/d) which suggests 86.6 BCF/d for 2026 based on STEO forecast (if there is no decline in conventional natural gas).
This is the reason that many of the LNG export facilities in the US may prove to be bad investments as there may not be enough natural gas to supply them unless the gas can be imported to the US from Canada by pipeline and then converted to LNG to ship to Europe and Asia. In addition expanded wind, solar, and nuclear power may reduce World natural gas demand in the future.
As has often been said there are many moving parts to this puzzle, correct forecasts are highly unlikely.
I came across this piece
https://www.energypolicy.columbia.edu/chinas-slowing-oil-demand-growth-is-likely-to-persist-and-could-impact-markets/
Excerpt:
During January–June 2024, China’s gasoline consumption grew by just 0.32 percent over January-June 2023, while diesel consumption decreased by 3.52 percent over January–June 2023.[11] Gasoline and diesel could cease to drive China’s oil demand growth in the next few years, if they have not done so already. A PetroChina research institute said that demand for both fuels peaked in 2023 (see Table 1). Other analysts expect gasoline and diesel demand to peak before 2030. Even if demand for liquefied petroleum gas and other products such as jet fuel and petrochemicals continues to grow for several years, China’s total oil demand may still peak before the end of the decade.
This Mornings Weekly Petroleum Status Report
Attached is a clip from this morning’s report which may be showing the effects of the falling Rig and Frac Spread counts that started in April and November 2024 respectively.
Domestic oil production was 13,240 kb/d down 237 kb/d from last week. In the week ending December 6, production was 13,631 kb/d. This week’s production is lower by 391 kb/d or 3%.
On the last line note NGPLs, 6,279 kb/d, down 328 kb/d from last week. For the week ending November 29th, production was 7,063 kb/d. This week’s production is lower by 784 kb/d, or 11%.
There could be a weather effect in this week’s numbers.
Ha ha. They still have this adjustment. Art Berman and me did this post a while ago:
8/10/2016
U.S. Storage Filling Up with Unaccounted-For Oil
http://crudeoilpeak.info/u-s-storage-filling-up-with-unaccounted-for-oil
Dennis,
Thanks for this. Interesting stuff.
I got a couple of questions, excuse the ignorance on the topic. If we drew a Venn diagram with condensate in one circle and NG in another. Do they overlap on some isomers ? Basically when does condensate end and NG begin ?
And is it safe to assume that the vast majority of hydrocarbons in earths crust is natural gas ? Is there any guesstimates on what percentage of hydrocarbons in earths crust is oil, coal and natural gas ?
Iron Mike,
There are many different categories for Natural Gas, but typically the dry gas that is used for heating and cooking (which is called natural gas rather than propane or other LPG) is primarily methane (call this C1 for a single carbon atom per molecule in CH4), NGLs consist of ethane and isomers (C2), propane and isomers (C3), and butane and isomers (C4). Condensate condenses out of the natural gas at STP (25 C and 1 atmosphere of pressure) and consists of C5 and larger molecules often called C5plus for shorthand. This is my understanding, but I am not a chemist or chemical engineer, they can correct my mistakes if they read this or you can if you have a different understanding. I do not know if there is an estimate of the proportion of oil, natural gas, and coal in the earth’s crust.
Note that wet gas is the natural gas as it comes out of the ground and is allowed to cool to 25 C or less so condensate at the lease is removed. The NGLs are removed from the wet gas at NGPL plants and a small proportion of the NGL is C5 plus that comes from the NG processing plants. Most nations include this in their C plus C output numbers as there is no chemical distinction between lease condensate and NGL that is C5 plus, but the US does not and may be unique in this regard. The amount is small though, in 2023 for the US C5 plus output from NG processing plants was about 763 kb/d and in the most recent 12 months the average increased to 826 kb/d. If the US included this C5 plus form the NGPL output in their C plus C output estimates then output for the most recent 12 months would increase from 13193 kb/d to 14019 kb/d.
Dennis,
“in 2023 for the US C5 plus output from NG processing plants was about 763 kb/d and in the most recent 12 months the average increased to 826 kb/d.”
— this is a 8% increase almost, and at the same time oil increased only 5%, clearly shows that the light oil in the reservoir separates into lighter part (NGL Condensate) and heavier oil.
https://youtu.be/2hxyNIhxmnQ
Sheng wu,
The NGPL is a function of natural gas output and the wetness of the natural gas produced, not all US natural gas is associated gas though a fairly large proportion of the natural gas produced in the US is associated gas from the Permian Basin.
thanks, Dennis!
May I ask where do you get the numbers here — “in 2023 for the US C5 plus output from NG processing plants was about 763 kb/d and in the most recent 12 months the average increased to 826 kb/d.” ?
Sheng wu,
Try
https://www.eia.gov/dnav/pet/pet_pnp_gp_dc_nus_mbblpd_m.htm
thanks, Dennis!
This is actually the same link as a year ago where I visited and got the data to make the youtube video above.
with the updated 2024 data, if one calculates the 12-mon moving average increase % of Natural Gasoline in NGPL, one could easily see it is increasing at astonishing ~13% and ~10% in 2023 and 2024; while propane and ethane are increasing at only 7~8% in last 2 years!
This unmatched/inhomogeneous increase in NGPL components, i.e., favoring the heavier natural gasoline, which should be smaller than C234 if wet gas is produced, is a unique result of the phase separation after bubble point.
Shengwu,
Looking at the chart it looks like its a function of drilling rate for horizonatal wells which changes in response to changes in the price of oil and natural gas.
Dennis,
Thanks for the clarification. I found a blog regarding this, ill leave the link just incase anyone wants to get a better idea:
https://petroleumsystem.blogspot.com/2015/06/dry-gas-wet-gas-condensate-and.html
Iron Mike,
Thank you, that blog post covered much I didn’t know, a great read.
Dennis,
In the US a lot of condensate from the lease is blended with the oil until desired API gravity and RVP, and only the rest is marketed separately as “natural gasoline”. This blending ratio has strong seasonality to it.
Separately, EIA in recent years has found that some of the natural gasoline is added to crude post-sale, mostly for export markets, and this is now a separate entry in the PSM.
Most OPEC nations do NOT count condensate in their quotas. This is very pronounced for Russia, which is a big producer of both a oil AND gas, and produces substantial quantities of condensate.
Kdimitrov,
Not sure you are correct about that, I think all of the condsensate is blended with crude at the lease and the rest of the natural gasoline comes from NG processing plants and is not included as part of C plus C in the US.
In the US all of the reported natural gasoline comes from NGPL plants so if there is any marketed natural gasoline from the lease the numbers are so small they are not reported by the EIA.
Is crude from tar sands under appreciated or flying under the Radar?
” What really saved the US was the oil sands in the north. Here’s why : The history of what changed. ”
https://www.moonofalabama.org/2025/01/matt-taibbi-on-tucker-carlsons-show.html?cid=6a00d8341c640e53ef02e860f81e12200d#comment-6a00d8341c640e53ef02e860f81e12200d
We know lots about fracking. How about recovery of the super heavy? Anyone know the Volume or Tonnage (mass) of Canadian crude in southbound pipelines?
Longtimber,
According to the EIA about 3984 kb/d of crude was imported from Canada in October 2024, my guess is that most of this would have been from Alberta’s oil sands.
More information on Canadian exports at link below
https://www.cer-rec.gc.ca/en/data-analysis/energy-markets/market-snapshots/2024/market-snapshot-almost-all-canadian-crude-oil-exports-went-to-the-united-states-in-2023.html
Dennis/Longtimber
Canada produces a full range of products from the heavy crude. Canada also has some tight oil. In the link below one can download a spreadsheet that shows the breakdown oil of by province and type.
To save the trouble of working your way through a very detailed breakdown spreadsheet, attached is a summary of the bigger production numbers.
Canada produces close to 5,000 kb/d. Around 1,000 is used in Canada and 4,000 go to the US as Western Canada Select (WCS), Sweet Synthetic Crude (SCO) and light/tight oil. WCS is a mixture of heavy crude and a diluent to make it flow through the pipelines. SCO is an upgraded crude with a bias toward making diesel and occasionally sells at a premium over WTI.
Units are kb/d. AB = Alberta SK = Saskatchewan BC = British Columbia
https://www.cer-rec.gc.ca/en/data-analysis/energy-commodities/crude-oil-petroleum-products/statistics/estimated-production-canadian-crude-oil-equivalent.html
Thanks Ovi,
So about 3400 of 4500 or around 75% comes from oil sands in Alberta. Not clear what the export numbers are though, it may be that the lighter stuff is refined in Canada and the heavier crude from Alberta is exported, but just a guess.
Screenshot from cer on exports, about 78% of crude exports were heavy oil in November 2025. Click on image for larger view.
Dennis
Some of the lighter stuff could be used as a diluent. Even synthetic crude is used as a diluent. Not sure how much. Seems a waste.
Ovi,
Yes for the Bitumen often condensate is used as a diluent as it is cheaper to move it by pipeline than by rail. Perhaps the condensate has little other use, I am not that familiar with refining, it may be there is more condensate available than needed in the refining process and this is considered the best use. Canada could install more upgraders to produce more syncrude, but perhaps the ROI on such an investment makes it unattractive. Again there is much I do not know so I may be incorrect. I agree using syncrude as a diluent seems a big waste, hopefully the amounts are very small.
Dennis
My understanding is that we import diluent from the US to mix with refined bitumen because we don’t have enough.
Attached is an old article that mentions that. It states: “Those pipelines are mostly supplied with diluent sourced from the Gulf Coast.”
I wonder if some of the diluent comes from the Permian.
https://rbnenergy.com/parallel-lines-the-diluent-trail-across-canada-part-2-u-s-supplies#:~:text=Diluent supplies required to supplement,sourced from the Gulf Coast.
Thanks Ovi,
I had forgotten that Canada imports condensate to help move the bitumen by pipeline, perhaps it gets reused if not needed in the refining process.
Dennis
Part of it may be going in circles. Diluent added to Cdn refined bitumen to make WCS. WCS arrives at US refinery and diluent components removed and sent back to where it is put into diluent pipeline and then back to Canada.
Ovi,
Exactly what I was thinking, but don’t know for sure.
Pricing Squeeze in Oil Patch
Top U.S. oilfield services firms are facing weaker pricing and revenue this year as oil producers become increasingly efficient and keep a cap on spending, according to oilfield executives and analysts
The number of active frac fleets totaled 183 in the week to Jan. 23, its lowest since March 2021, according to data from consultancy Primary Vision.
This year, the oilfield services sector is set to be squeezed again as operators eye weaker crude price forecasts due to oversupply.
Roughly half the Texas and New Mexico-based oil executives surveyed by the Dallas Fed in December said they were using $70-$75 a barrel for capital planning.
Rivals are also feeling the pinch. JP Morgan expects Liberty Energy will see its EBITDA per frac fleet decline to $19.9 million in 2025, from $24.7 million in 2024 as pricing pressures hit margins.
“The combination of significant improvements in shale completion efficiency and a softer macro picture is leading to further weakness in the frac market,” the analysts said.
https://boereport.com/2025/01/28/us-oilfield-firms-face-pricing-squeeze-as-fracking-demand-slumps/
I was looking for an analysis of ethanol, and ran across a detailed article comparing synthetic fuels, with conversion efficiencies, etc.
Seemed interesting…
Abstract
Synthetic fuels produced with renewable surplus electricity depict an interesting solution for the decarbonization of mobility and transportation applications which are not suited for electrification. With the objective to compare various synthetic fuels, an analysis of all the energy conversion steps is conducted from the electricity source, i.e., wind-, solar-, or hydro-power, to the final application, i.e., a vehicle driving a certain number of miles. The investigated fuels are hydrogen, methane, methanol, dimethyl ether and Diesel. While their production process is analyzed based on literature, the usage of these fuels is analyzed based on chassis dynanometer measurement data of various EURO-6b passenger vehicles.
Conventional and hybrid power-trains as well as various carbon dioxide sources are investigated in two scenarios. The first reference scenario considers market-ready technology only, while the second future scenario considers technology which is currently being developed in industry and assumed to be market-ready in near future. With the results derived in this study and with consideration of boundary conditions, i.e., availability of infrastructure, storage technology of gaseous fuels, energy density requirements, etc., the most energy efficient of the corresponding suitable synthetic fuels can be chosen.
https://www.sciencedirect.com/science/article/pii/S235248471830266X
This is from the guy that the US selected to be president-
‘The president added that he would decide as soon as tonight on whether the tariffs would apply to Canadian oil imports.’-
“We don’t need the products that they have. We have all the oil that you need. We have all the trees you need,” said Trump, referring to major imports from Canada.
A big F..you! to our best neighbor.
As usual, Trump is insane: where will he find 4000 kb/d to replace Canadian oil?
Jean-Francois,
Trump is a moron and doesn’t understand that the crude oil needs to be refined to be useful and that US refineries are unable to process about 4000 kb/d of tight oil that is produced in the US. Eventually he may realize his error and then will blame it on Biden and Obama because they didn’t require oil companies to refit their refineries to process more tight oil.
Then he will exempt oil from the tariffs when he fully understands the situation, if he is smart (he isn’t so this may take some time.)
Perhaps some other underlying motivations here too?
https://www.vox.com/2019/12/4/20995038/trump-trudeau-video-nato-summit
T Hill,
The US will be hurt due to Trump’s thin skin I guess, we can hope people will wake up before it is too late, generally people are not very smart.
“Trump is a moron”
Lets not degrade morons by comparing them to Trump
Some predictions:
1. 10% tariff is not going to affect the flow of CDN oil by a single barrel.
2. The WCS price diff in Hardisty, ALB will see a very minimal change, once things settle. This diff reflects the limited uptake capacity from the WCSB. The Hardisty price is not what US refiners pay, they add for transport too. We don’t have price data for PADD 2 (Midwest), but we do have data for WCS @Cushing and @HSC, and it is $8-10 higher than in Hardisty. It doesnt cost $8-10 per bbl to transport via pipeline, there is a lot of fat there, which will get squeezed somewhat by the tariffs. The rest will be absorbed by final product (consumers), refinery margins, and very little by widening the Hardisty diff.
3. PADD 3 will all of a sudden have to replace 600 kbpd of Mexican oil, which becomes quite expensive with the 25% tariff. That’s not trivial. Canadian WCS barrels, with tariffs and all, will all of a sudden be very competitive in PADD3.
Kdimitrov,
The number of barrels might not change, but the average price of crude in the US will increase. Note that the tariff is expected to be 25% on imports from Canada, it will be 10% on Chinese imports.
Now Canada has chosen to respond in kind so the trade wars begin.
https://www.canada.ca/en/department-finance/news/2025/02/canada-announces-155b-tariff-package-in-response-to-unjustified-us-tariffs.html
Mexico also claims it will impose tariffs on US exports to Mexico
https://www.reuters.com/world/americas/mexican-president-orders-retaliatory-tariffs-against-us-2025-02-02/
China is considering a WTO lawsuit in response to the tariffs, a fairly weak response compared with Canada and Mexico.
An analysis of the potential impact of Trump’s tariffs and the potential retaliation by Canada and Mexico.
https://www.forbes.com/sites/kenroberts/2025/02/01/new-tariff-war-canada-mexico-top-market-for-72-of-export-categories/
Those tariffs come with an automatic clause that if they respond with retaliatory tariffs then the tariffs will be ratcheted up.
We don’t know what the ultimate level of tariffs will be.
And with the uncertainty surrounding that, banks are going to avoid making as many loans. They will absolutely tighten lending standards. Not only banks but foreign capital flows will think twice before investing. Money might even start leaving.
Watch the peso and Canadian dollar. Worst case scenario isn’t already priced in.
Let’s not forget that 80% of Mexico’s electricity generation comes from natural gas. And 90% of their natural gas comes from Texas via pipelines.
That could be redirected to elsewhere within US borders. The automotive plants that moved to Mexico would be shutdown.
And the silver that is needed for the manufacturing of green tech. Those silver mines shutdown while Mexico figures out how they are going to keep the lights on.
HHH,
Not sure that has been stated, it would be stupid to keep ratcheting up the tariffs, but Trump is pretty damn stupid, so perhaps you are correct. If so there is no end in sight to tariffs and the US economy is toast and probably the World economy as well.
The economics that Trump points to as being smart was relagated to the dustbin long ago by economists. Classical economics was moronic and remains so.
Dennis wrote:
Not sure that has been stated, it would be stupid to keep ratcheting up the tariffs, but Trump is pretty damn stupid.
Truer words were never spoken.
There was also a whole lot of front running these tariffs before they were implemented. A lot of orders were placed, filled and delivered in order to get product before tariffs. That otherwise wouldn’t have been ordered.
So demand will likely be really soft. Which will lead to layoffs and less demand for those who are out of work.
Kdimitrov,
I see you re correct on Canadian oil tariffs being 10% rather than 25%, just saw that this morning.
https://finance.yahoo.com/news/canadian-energy-dodges-cataclysm-lower-215537397.html
The lighter grades of crude imported to the US may see greater impact unless they simply pass through the US and are exported from the Gulf coast, in that case they may be exempt from tariffs. Note that without the oil imported to the US from Canada there would actually be a trade surplus with Canada buying more goods from the US than are imported to the US from Canada. Trump has not done this simple math, he is such a clown.
Here is TD Banks analysis
https://economics.td.com/ca-canada-us-trade-balance
Trumps behaviors/policies accelerates the longer trend of the loss of the US Dollar as the worlds reserve currency. All very shortsighted.
Shouldn’t be at all surprising from the man who has a lifelong history of failing to abide by contracts. He has been an expert at squirming out of responsibility for his failures. I don’t think that will apply to the US at large.
Eurodollar is the global reserve currency not the US dollar. Most of the dollars are created by banks that reside outside of the US. So if the world moves away from the dollar it will crush all other currencies. It’s simply too painful to leave.
If say China defaults on their dollar denominated debts they are defaulting on Japanese and European banks that lent them money.
While I agree that the movement to move away from the dollar will continue. The stark reality is the value of the dollar goes through the roof under such a scenario. Because the amount of dollars contracts while the debt remains and ultimately is defaulted on.
And since everything is priced in dollars. As a country loses purchasing power in dollar terms because their currency is in free fall. The pain their citizens feel goes through the roof.
Global cost of living crisis in the making.
“Global cost of living crisis in the making.”
Well, its already here for billions. But yes spreading to just about everyone.
Its exactly what we should all expect in an overpopulated world
reliant on finite resources.
Even faster pace of onset and severity to be expected when so much of the worlds capital wealth is concentrated among such a very few.
The wealth has to be concentrated in the hands of a few. If you redistribute the wealth then the rate we use up finite resources accelerates drastically. There is no getting around that fact.
Keep an eye on the dollar here. As it continues higher. It’s going to squeeze global liquidity. I can’t tell you the exact level where markets and prices start to breakdown. But the higher it goes the closer we get to whatever that level is.
If had to guess it would start on the dollar index around 112.00 Maybe a little lower or a little higher.
But when it does break. Dollar becomes super expensive to obtain and other countries have to go into printing mode of their local currencies to obtain the necessary amount of dollars they need. So it will exacerbate dollar strength.
And contrary to popular belief you won’t be able to hide in gold or bitcoin here. They are both part of the liquidity bubble we are in and will be sold.
And yes treasuries that are dollar denominated assets will get sold to obtain dollars by governments outside the US. As will other dollar denominated reserve assets that they hold.
US November Production Down by 122 kb/d
Drops in Texas, NM and GOM offset by gains in ND and Colorado.
Wonder what the cause was. Unlikely to be cold (in NOV). Could see a GOM storm, but then that should not have affected NM.
Nony
I think that NM is on a plateau and close to entering its declining phase. Fuller explanation in February 4 US update.
Ovi,
Again the STEO estimate for November was very close 13330 kb/d vs 13314. Also Sept and Oct 2024 data was revised lower by 13 and 21 kb/d respectively from last Month’s PSM.
Dennis
I think the STEO is getting much better at predicting one month ahead.
Ovi,
Looking back at STEO from Jan 2024 and comparing with PSM, the monthly data is not great, but the 12 month average is very close from Dec 2023 to Nov 2024 (13207 kb/d for STEO 12 month average vs 13193 kb/d for PSM 12 month average). Not that bad.
Ovi,
Just took a look back at the January 2023 STEO and compared December 2022 to November 2024 for that STEO with the recent PSM and that forecast was not so close, for Dec 2022 to Nov 2023 the 12 month average for the STEO was 488 kb/d too low and for the 12 month average from Dec 2023 to November 2024 the STEO was 431 kb/d too low.
It may be that the January 2024 STEO was unusually accurate for the most recent 12 month average. It will be interesting to check in a year at how accurate the Jan 2025 STEO proves to be.
Ovi,
It should be 13,436 for the previous month, down to 13,314.
Ovi,
It should be 13,436 for the previous month.
Dan
Thanks
Corrected chart
Rigs Rebound for the Week Ending Jan 31
– US Hz oil rigs increased by 9 to 438. The count is also down 21 rigs from April 19 and is up 11 relative to the recent lowest count of 427 on July 24th. The rig count has remained in a very tight range between 427 and 442 since July. Will it get back up to 50?
– The New Mexico Permian rigs were up 4 to 96 while the Texas ones were up by 2 to 190.
– In New Mexico, Lea added 1 to 49 while Eddy added 3 to 47
– In Texas, Midland was unchanged at 26 while Martin dropped 1 rig to 25
– Eagle Ford added 1 to 41
– NG Hz rigs dropped 1 to 80
Frac Spreads Rebound for the Week Ending Jan 31
The frac spread count rose by 7 to 190. It is also down 60 from one year ago and down by 51 spreads since October 11.
Thanks for the update Ovi.
Perhaps this is a Trump effect, though often rigs and frack spreads drop in December and rebound in January so this may simply be the normal course of seasonal variation.
Dennis
It could also be a double bounce. End of January effect plus freezing weather the previous week.
Since Permian is the dominant factor presently, in fact worldwide oilwise, I think a breakdown of fracs working there compared to elsewhere would be interesting. It might be somewhere in the post but I could not see any, perhaps due to the saturday scotch though…
Laplander,
We don’t have a breakdown of frac spreads by basin only horizontal drilling rigs.
Laplander
Attached is the September US update. It attempts to correlate the rig count with oil production for a few of the main Permian counties. Since not many DUCs are being completed these days rig count, delayed by 6 to 8 months, may be a reasonable proxy.
I will provide an updated US November Production post on February 4.
I have attempted to extract frac spread data but with great difficulty and not 100% confident in the results.
https://peakoilbarrel.com/september-non-opec-and-world-oil-production-drops/#more-53186
On the 914, just some small states that interest me:
MT is up to 86 (better than LA at 82, which sort of has a legacy slot in your top 10/11).
OH is at 120. Leaving LA further in the dust.
Nony
I have added MT to my list. It will show up in the Feb 4 US update because they passed LA.
Yeah!
https://www.youtube.com/watch?v=GxBSyx85Kp8
😉
Go little state, go!
I think it makes sense to keep states for a while as sometimes they dance back and forth. OH and LA did (and may again as LA has much more “base production” verus high decline curve shale). For sure, MT and LA are very neck and neck and MT could fall behind it in future (e.g. if there is still some storm recovery for LA or less shale drilling because of prices).
Of course, you could say OH has passed them both. But it would still be fun for brave little MT to show up for at least a month. 😉
Ovi, maybe states that fall out ouf the top 10 should be dropped from the analysis, otherwise the list may expand to 50 states, which seems a lot.
Dennis
I am at a dozen which is my limit. The next closest is Kansas at 75 kb/d and it is in decline.
Ovi,
Fair enough, it seems LA has been declining for some time (and faster than Kansas since 2015) so it may be ok to drop LA at some point maybe if they stay under 80 kb/d for a couple of months or perhaps fall below Kansas, your call. I think you had 11 for quite a while after starting with 10, but I may not remember correctly
To me what is more interesting is the obvious split that is occurring on the American right wing. They like to keep up appearances and project an image to the world that they are unified and perfect, but they are anything but. And the reason is: the corporate and nationalist wings are now splitting.
See, for the longest time, they could pretend they were on the same page. But, alas, time has passed, and it’s no longer the 1980s. Huge amount of immigrants and their descendants are in America, and huge amounts want to come in. In addition, the rest of the world has developed economically, and the resources are running out. America is no longer the only big dog.
So now…money is conflicting with national identity. As it was always going to do in the long run. What the moneyed, corporate interests want: continued mass immigration and free trade. What the nationalist, identitarians want: restrictions on immigration, and tariffs.
Get your popcorn, it’s going to be entertaining to watch the hand wringing and blame that goes around as the Republicans split up. But of course, it’s also entirely predictable that the useless Democrats will not seize upon this in any way.
Trump has delayed tariffs on Mexico after reaching deal with Sheinbaum, no deal has yet been reached with Canada, but I imagine this increases pressure on Trudeau to reach some deal with Trump.
Seems this is a negotiating tactic which is likely to become less and less effective over time.
Maybe Canada will call his bluff?
Dennis
You said wind and solar do not need 100% backup.
Name us a country which does not have at least 90% fossil fuel hydro and nuclear capacity.
Wind and solar in Germany capacity is over 160% of its peak consumption.
https://www.energy-charts.info/charts/power/chart.htm?l=en&c=DE&week=52&year=2024
On the 27 to 28 December for 14 hours wind and solar produced less than 1Gigawatt while demand exceeded 56.
Please provide your examples and we can check installed capacity and output.
Loads of oil there is always excess capacity. Nations can import and export energy so we would not look at individual nations we would consider interconnected regions such as Europe or even Eurasia or North America.
Currently wind and solar are a small part of the overall grid. See https://www.sciencedaily.com/releases/2012/12/121210133507.htm for what might be possible in the future.
In the future maybe 5 to 10% backup will be needed to supplement non-fossil fuel electricity output.
Dennis
I am not surprised you can’t answer my simple question.
The reason you can’t is because your claim is false.
Germany installed wind and solar is not small as you claim it is triple the amount of installed coal and gas.
https://www.energy-charts.info/charts/installed_power/chart.htm?l=en&c=DE
Fact is often Germany must rely on coal and gas for up to 95% of its demand.
It is obvious that countries have spare capacity, that is not what we are talking about as you well know. We are talking about the intermittent nature of wind and solar and it’s output fluctuations not by 10% as you claim but 95% as the data shows.
Fact is often Germany must rely on coal and gas for up to 95% of its demand.
True. But for how many hours a month?
Not true, Germany doesn’t have that much coal and gas capacity. He’s just making stuff up.
Alim
I have posted the charts above which show exactly how much electricity is produced by each source.
If you can’t understand simple graphs you should really play in the toddler pen.
John
This study shows the scale of backup required over an extended period of time.
https://iopscience.iop.org/article/10.1088/1748-9326/ac4dc8
Dennis, from your post:
In the future maybe 5 to 10% backup will be needed to supplement non-fossil fuel electricity output.
But, from your linked article:
During the hours when there was not enough renewable electricity to meet power needs, the model drew from storage and, on the rare hours with neither renewable electricity or stored power, then fossil fuel.
This implies 100% FF backup, no? (albeit for very short periods of time)
An update on US November Oil Production has been posted.
https://peakoilbarrel.com/u-s-november-oil-production-drops-to-year-ago-level/
A new Open Thread Non-Petroleum has been posted.
https://peakoilbarrel.com/open-thread-non-petroleum-february-4-2025/