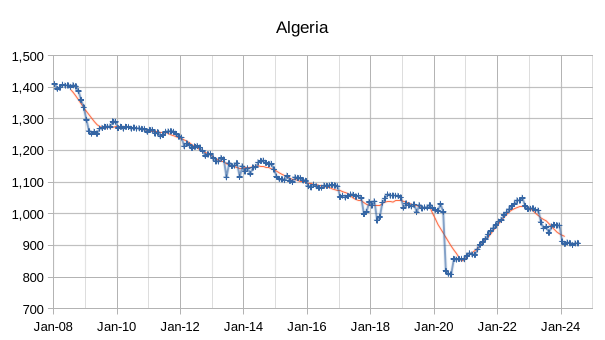
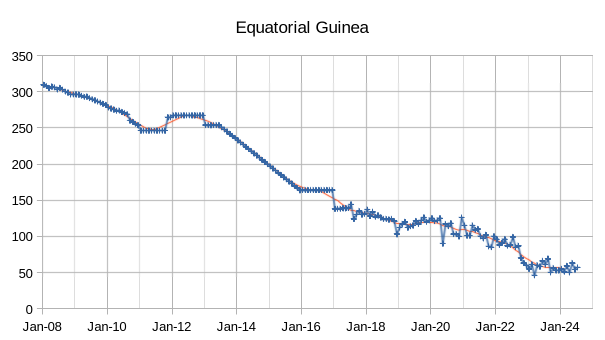
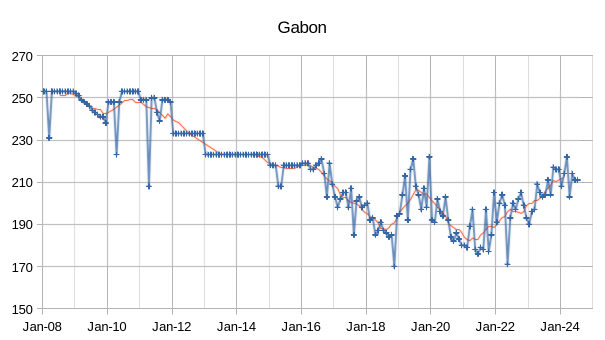
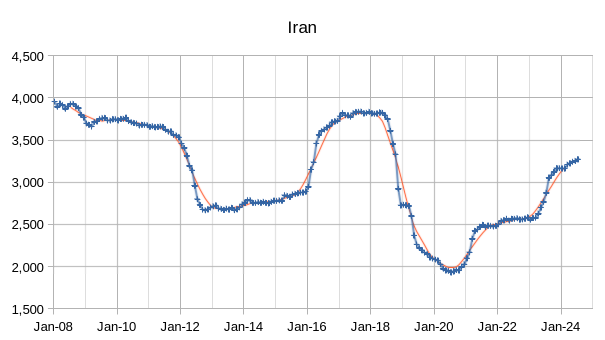
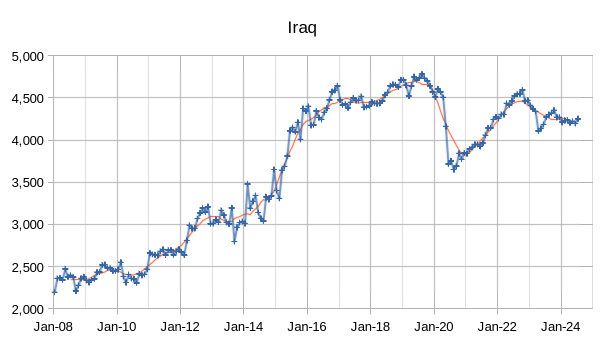
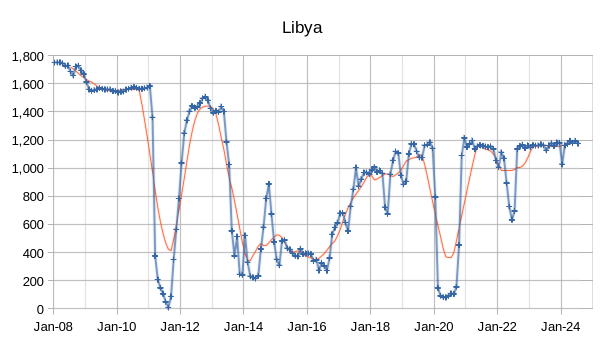
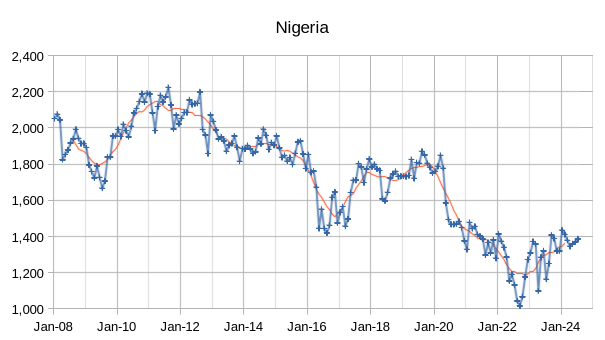
The OPEC Monthly Oil Market Report (MOMR) for August 2024 was published recently. The last month reported in most of the OPEC charts that follow is July 2024 and output reported for OPEC nations is crude oil output in thousands of barrels per day (kb/d). In the OPEC charts below the blue line with markers is monthly output and the thin red line is the centered twelve month average (CTMA) output.
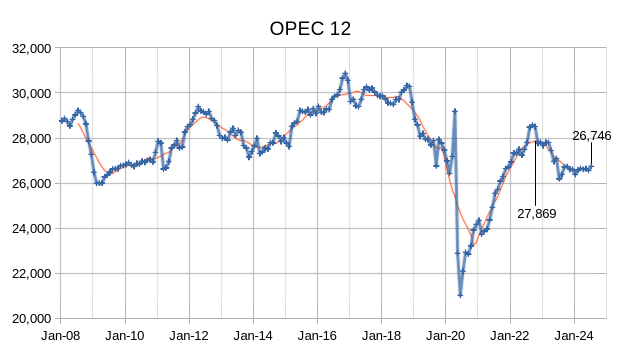
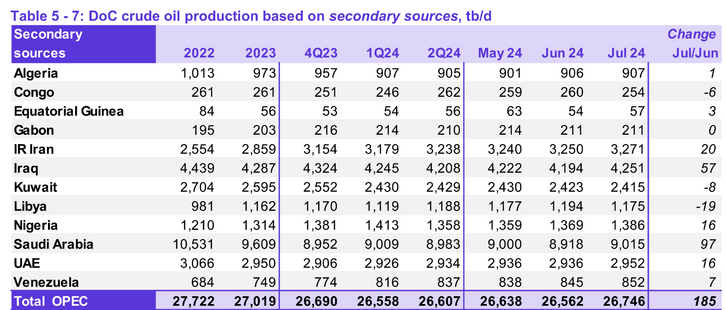
Output for June 2024 was revised lower by 4 kb/d and May 2024 output was revised higher by 8 kb/d compared to last month’s report. OPEC 12 output increased by 185 kb/d with most of the increase from Saudi Arabia’s output (97 kb/d.) Iraq (57 kb/d), Iran (20 kb/d), Nigeria and UAE both increased crude output by 16 kb/d, Libya saw a decrease of 19 kb/d.

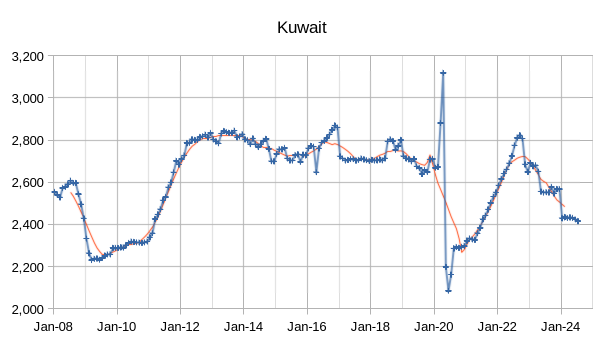
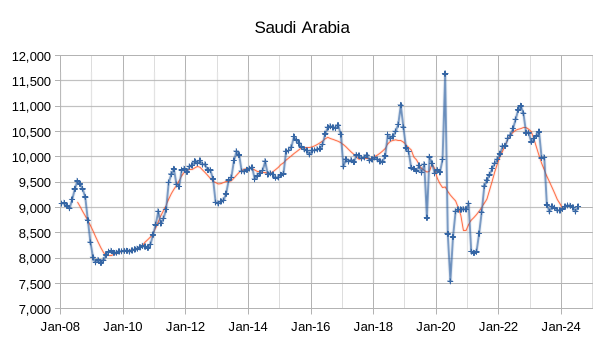
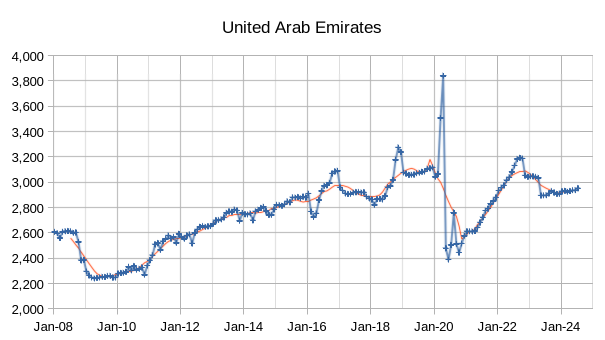
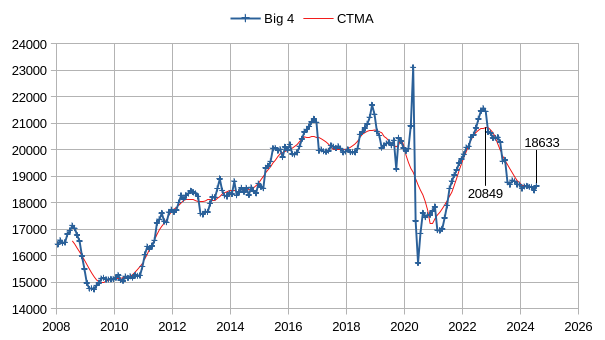
The chart above shows output from the Big 4 OPEC producers that are subject to output quotas (Saudi Arabia, UAE, Iraq, and Kuwait), since the post pandemic peak in 2022 where centered 12 month average (CTMA) output from the Big 4 reached 20849 kb/d, crude output had been cut by 2216 kb/d relative to the 2022 CTMA peak to 18633 kb/d. Potentially the Big 4 may have roughly 2200 kb/d of spare capacity when World demand calls for an increase in output.,
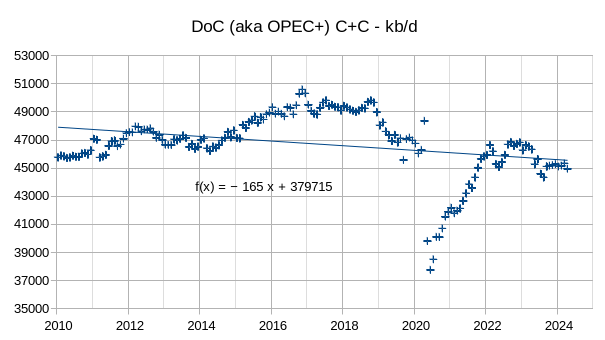
In OPEC Monthly Oil Market Reports for the past few months they have focused more on the OPEC+ group of nations which they refer to as the DoC which refers to the Declaration of Cooperation which led to the creation of OPEC+. The chart above shows the DoC C+C output as reported by the EIA, this is different from the numbers reported in the MOMR which are crude only. Since 2010 the long term trend for DoC output has been an annual decrease of 165 kb/d. The last month reported on this chart and several of the charts that follow is April 2024, which is the most recent EIA international data. For roughly the past 7 months DoC output has stabilized around 45000 kb/d. Much of the decrease since 2016 has been due to US sanctions on Iran and Venezuela.
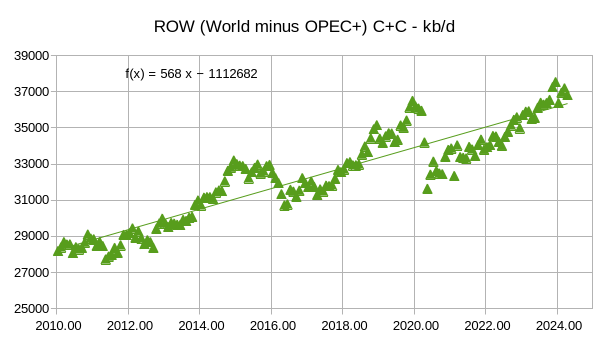
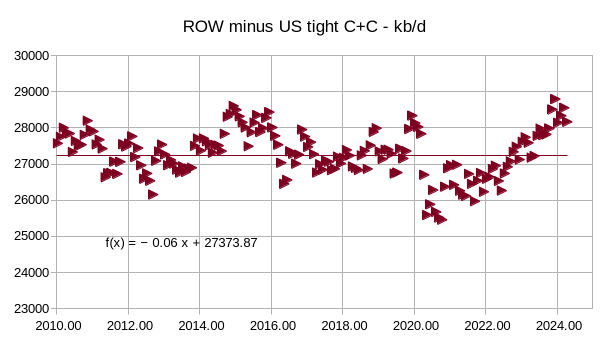
The chart above shows the trend for the rest of the world (ROW), that is those nations that are not part of OPEC+, average annual C+C output increased by about 568 kb/d over the 2010 to 2024 period. How much of this increase came from US tight oil output?
All of the increase in the ROW C+C output over the 2010-2024 period was from US tight oil output as can be seen in the chart above for ROW C+C minus US tight oil.
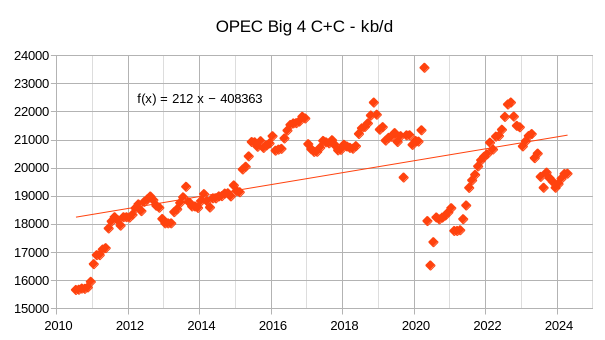
This chart shows the OPEC Big 4 C+C output over the 2010 to 2024 period (the earlier chart was crude only). Output fluctuates a lot due to OPEC trying to balance World markets, but the long term trend is and annual increase of about 200 kb/d with a few brief periods where output increased by as much as 2000 kb/d in a year. Of some concern is the likely slowing of future US tight oil output where most of any increase will need to come from OPEC+. I expect either a plateau or very slow increase (100 kb/d of less) in future US tight oil output.
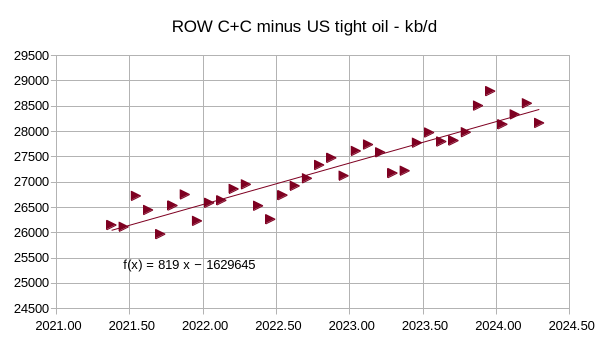
The recent trend for ROW minus tight oil C+C from May 2021 to April 2024 is an annual increase of 819 kb/d, this may be due to increases in C+C output in Canada, Brazil, Norway, Guyana, and Argentina.
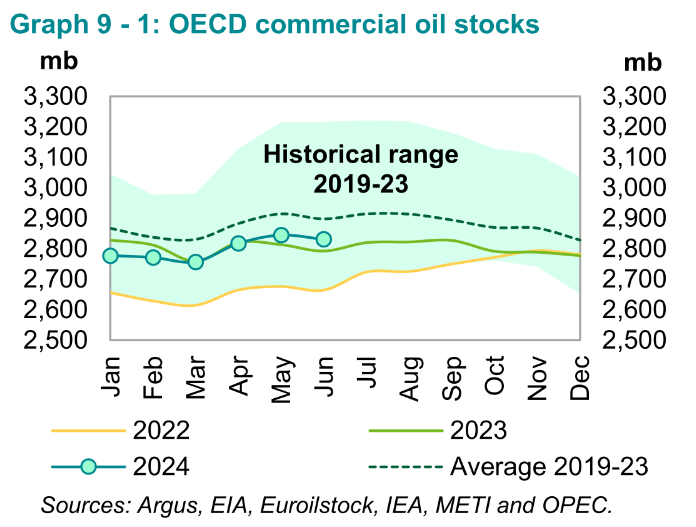
OECD Stocks remain below the 5 year average, World Oil markets seem fairly balanced an oil prices remain at reasonable levels with the Brent futures price currently under $80/b.
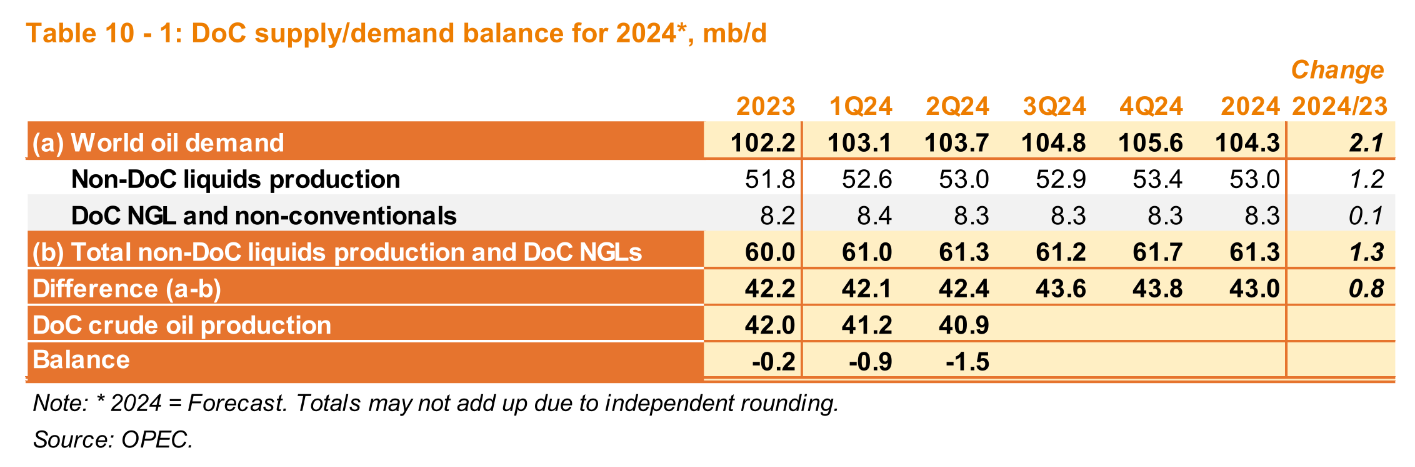

The World demand estimates for 2024 and 2025 were revised lower by 200 kb/d compared to last month, estimates are significantly higher than EIA estimates for World demand in 2024 and 2025. The supply estimates from the non-DOC remain the same as last month. If World oil demand is as high as OPEC forecasts, the World may struggle to meet demand in 2025, though it seems likely that the 2025 World liquids demand estimate by OPEC is at least 1 Mb/d too high. If I am correct then the World will have adequate oil supply in 2025.
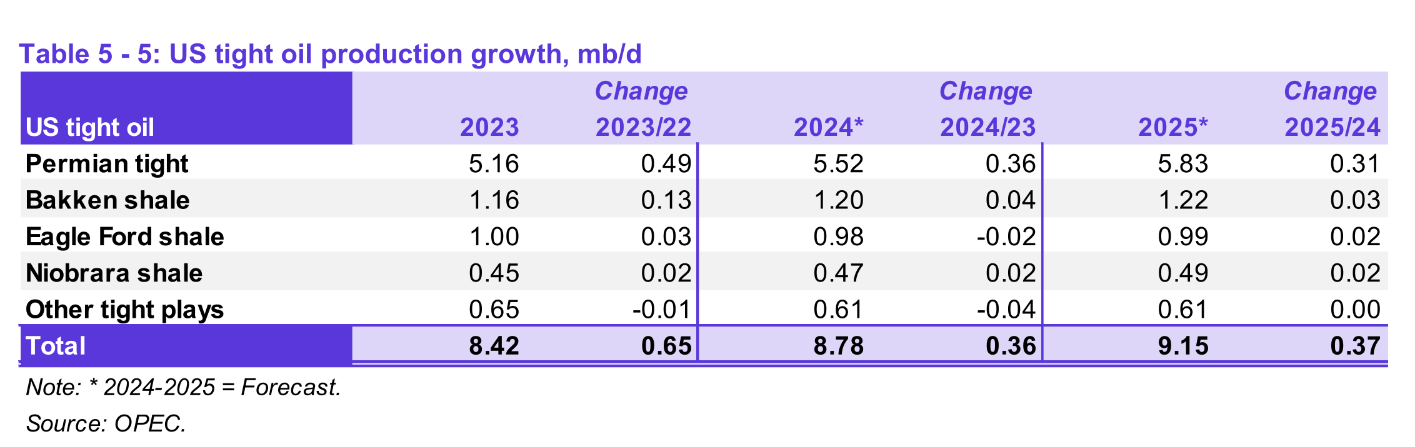
The OPEC forecast for US tight oil increases in 2024 and 2025 are likely too high, my expectation is that US total tight oil increases from 2023 to 2025 will be about half of the OPEC forecast and perhaps less if the EIA oil price forecasts and natural gas price forecasts for 2024 and 2025 are correct.
113 responses to “OPEC Update, August 2024”
Exxon Joins OPEC in Warning of Looming Oil Supply Crisis
According to the supermajor, global oil production is facing a natural decline at a rate of some 15% annually over the next 25 years. For context, the IEA sees the rate of natural decline at 8% annually. Exxon points out, however, that the faster decline rate is a result of the shift towards shale and other unconventional oil production, where depletion happens faster than it does in conventional formations.
Oh, apparently you haven’t heard the news. Peak oil supply is a myth.
Great article. Thanks, Frugal. Everyone should read this one. You will be seeing a lot more such articles in the near future.
This article is not what I thought it was: It touts a fairy dust called “investment”.
Fortunately for all of us, investment in oil and gas will not cease, despite the activist calls and threats by governments to force them to cease. The threats will remain just threats. Energy security always trumps ideology.
Energy security always trumps ideology.
Yes, energy security may often trump ideology but never geology.
https://au.finance.yahoo.com/news/guyana-permian-basin-exxon-mobil-140003920.html
From Guyana to the Permian. How Exxon is preparing for the future.
Please remain calm folks, nothing to see here!
Oil is abiotic and forms out of thin air, we will never runout in 1,000 million years…move along!
The Current trailing 12 month average for World C plus C as of April 2024 (EIA data) is 81.7 Mb/d, OPEC spare capacity is at least 1.7 Mb/d which suggests even if the increases in output from Guyana, Canada, and Brazil just offset decrease output in the rest of the World and US tight oil is on plateau from now until 2028 that a new World peak could be achieved just by OPEC increasing output to current capacity. In addition, the Big 4 and perhaps Iran may have the potential to expand capacity if needed. I believe the chances are better than 50/50 that a new 12 month average peak for World C plus C output will be reached before 2030. After that I expect a slow decline in output (1% per year up to 2040 and then gradually increasing to 3% per year by 2075).
Dennis, I don’t buy this bit at all…
” OPEC spare capacity is at least 1.7 Mb/d “. It makes absolutely no sense whatsoever to build capacity that you don’t use, in a business sense, especially if not having it means the price of what you are selling will go higher if you don’t have it…
Whereas this bit “the Big 4 and perhaps Iran may have the potential to expand capacity if needed”, makes far more sense on how I’d ‘play’ it if I was in charge of the oil fields of whichever country. Keep doing exploration and find some new areas that can be developed when needed, but why develop anything, spending millions or billions on it, to have it sitting there unused and suffering from entropy. The whole concept is comforting for those in the west, but defies logic..
Far more likely I’d produce to the maximum necessary/possible and fill any spare storage while telling the world I have XXX spare capacity, while the truth is a lot less. The extra production would come out of storage and ‘look’ like an increase for a few months, then when the storage is low, make something up about not being happy with price or field needs resting or whatever..
Hideaway,
Production measures production, the Big 4 produced 21.48 Mb/d of C plus C in 2022 (highest 12 month average that year), in the most recent month reported by the EIA (April 2024) C plus C output from the Big 4 was 19.80 Mb/d, my estimate assumes the production capacity the existed in 2022 still exists today and that the Big 4 has chosen to reduce output temporarily to support oil prices as they have done many times in the past. My assumption could be wrong, or yours might be, we will know more in the future.
Hideaway,
Note that for crude oil (rather than C plus C) the indicated spare capacity is about 2.2 Mb/d, the average of the two estimates (crude and C plus C) is 1.95 Mb/d of spare capacity from Saudi Arabia, UAE, Iraq, and Kuwait (aka Big 4). I used the more conservative 1.68 Mb/d estimate which is likely on the low side.
Your speculation about filling storage and then emptying would be easily verified with satellite images of the Middle East where storage tanks or pipelines leading to hidden underground storage (if it exists) could easily be found.
So let’s say there was a 2 Mb/d increase in “output” which comes from storage tanks for a year. That is roughly 730 million barrels of stored oil, I am not buying it. It is expensive to build the facilities to store that much extra oil, cheaper to leave it in the ground and extract oil when there is demand for it and sell it.
If Exxon is indeed correct about a 15% yearly decline rate, this would mean the world would have to add 12 million barrels/day per year of new oil production to stay even. This is a tall order that no combination of Brazil, Guyana, Canada, or anybody else could achieve. This is equivalent to adding a new US per year for the next 25 years.
Frugal, Exxon is wrong the decline rate is more like 9.7% per year from July 2024 to December 2030, with zero investment.
A 9.7% yearly natural decline rate works out to an 8 million barrels/day per year decline, which is close to what Saudi Arabia is producing today.
Frugal,
Note this is with zero investment which is not all that realistic a scenario. A more reasonable scenario has lower decline rates.
Your graph shows that the current decline rate between now and 2030 is zero, which means that the current production will be maintained until 2030. So 8 million barrels/day per year of new or enhanced recovery production is currently taking place, or a Saudi Arabia per year.
Frugal,
Yes roughly that, if the decline estimate is correct. We have been on roughly a plateau for about 10 years (2015 to 2024) at around 81 Mb/d, so this has been the case for a while, though in the earlier years when tight oil output was lower, the decline rate may have been closer to 8 or 9% as the tight oil decline rate is much higher than conventional oil. Currently the 8 Mb/d decline (with no new wells started) estimate may be about right.
Looking at this projection depicted one could almost imagine that electrification transport can match the decline in oil production, with the large majority of residual oil production being used for other more difficult to replace applications.
Assuming people had the foresight and incentive to get the job done.
Throwing dollars at something doesn’t mean that more of the thing will be discovered. It may even mean that nothing gets discovered at all. Correlation, as is obvious, does not mean causation.
The XOM estimate for 2030 output with no new investment is incorrect. With no new investment, output would fall to about 57 Mb/d, not 30 Mb/d. Keep in mind that tight oil is only about 9% of World output, it declines very quickly (about 27% per year on average over 5.5 years with no new wells completed in the future), but the bulk of World output declines at about 8% per year on average with no new investment. Using those decline rates output falls to about 56.7 Mb/d in 2030, not the 30 Mb/d that is claimed by Exxon.
Investment will be needed, just not quite as much as is claimed by Exxon.
Which is good news, because Exxon is more interested in spending its money on share buybacks to sweeten the CEO’s pay deal than in the dirty business of drilling holes in the ground to get oil.
https://ycharts.com/companies/XOM/stock_buyback
Shock Model with higher assumed URR for extra heavy (XH) oil (oil sands in Canada and Venezuela) of 200 Gb ( XH URR was about 120 Gb in recent earlier scenarios). Peak in 2029 at 83.2 Mb/d.
While the OPEC 12 was up, Russia was down… again. This is not just Russia trying to meet its quota, there is something else involved here.
Click on graph to enlarge.
Russia was down by 26 kb/d in March and is down by 159 kb/d over the past two months combined while OPEC 12 was up by 108 kb/d over the past 2 months. For the DoC (or Opec plus) overall output of crude oil was up by 13 kb/d over the past two months (May to July 2024).
Ron/Dennis
I think over the next two to three months we will see if Russia is in decline or holding back production. Argus has Russian crude down by 450 kb/d. From the looks of the chart, it looks like decline is taking over. The other possibility is that Russia is having difficulty bringing on new wells due to lack of US expertise and availability of equipment due to sanctions. Either way it is heading down.
And the Russian oil fields are in physical decline for underground reasons as most of them are 50% depleted or more, not only because of aboveground reasons. That’s something which has been forecasted since several years.
Ovi,
I think we will know more when OPEC plus starts increasing output.
https://www.youtube.com/watch?v=FGBU-AkI714
6 minutes
70% of Libyan oil shut down
Oil Prices Set for Monthly Decline as Demand Concerns Grow
Oil Prices Set for Monthly Decline as Demand Concerns Grow.
It’s been a volatile week for oil markets, with Libya’s oil blockade sending a supply shock through markets before traders refocused on concerns around Chinese demand. At the same time, Iraq has been ratcheting up pressure on Kurdish producers to cut output, and the US has released some constructive macroeconomic data. Early on Friday morning, oil prices had swung back into the red, with Brent trading at $78.54 and WTI below $75.
Previously, the news has been all about demand. Now supply problems are starting to creep into the petroleum news. I think the word “supply” will soon become the dominant concern, replacing “demand” as the primary concern in the oil market.
Low demand is good,
especially when you are talking about a finite resource at peak.
That is when tshtf. Until then, we’ll have to chew on many many charts that ‘prove’ otherwise. Thank you Ron for your insights, your honesty. Your cold hard work and your comments and effort through all the years.
Ron,
It has always been about supply relative to demand, this will continue. Nobody knows which blade of the scissors does the cutting, or it is both. Asking whether demand or supply is more important in determining market prices is much the same.
Nope, I cannot buy that Dennis. Demand knows no limits, but supply is finite. Demand cannot create oil that does not exist. They are related of course, but they are two entirely different things. In the end supply will determine the future path of energy regardless of what the demand is. We will eventually power all transportation with something other than petroleum. We cannot demand something that does not exist.
Ron,
The price will be determined by both supply and demand, regardless of what you believe. I agree supply is limited and demand is not. However demand is dynamic, in 1915 there was a significant demand for buggy whips and saddles on a per capita basis, today the per capita demand for those items is much smaller. In 2015 there was a significant demand for ICE vehicles on a percapita basis, the per capita demand in in 2115 will probably be far lower for ICE vehicles. Suppy of C plus C will fall because oil prices will be low due to lack of demand for oil so that it will no longer be profitable to produce much of the existing oil resource.
“Since these mysteries are beyond us, let us pretend we are the hands behind them”.
Politicians would like to distort reality with their tax policy and prohibitions, which mask the peak. But reality is inevitable in the end.
The end of abundant access to oil is a physical reality – not a financial one.
No politician will be able to deal with it.
And this will become evident very soon.
The price will be determined by both supply and demand, regardless of what you believe.
Jesus H. Christ Dennis, I never even remotely indicated that the price was not determined by supply and demand. If you must put words in my mouth, then please don’t make it something so stupid as to indicate that i believe that price is not determined by supply and demand. Price was mentioned in the OilPrice.com article, but I did not mention price even once.
Dennis, over the life of this blog I have preached over and over and over again that the price of oil is determined by supply and demand. You know that Dennis, you know that. Back in the early days when someone, I believe it was Watcher, kept stating that the price was not determined by supply and demand, I vigorously rebutted his argument. Surely you remember that.
I am unable to continue this post in fear that you may indicate that I said something else so blatantly stupid as to indicate that I believe that price is not determined by supply and demand.
My point was fairly straightforward, both supply and demand are equally important.
Here as what you said:
I think the word “supply” will soon become the dominant concern, replacing “demand” as the primary concern in the oil market.
Supply is not important than demand and demand is not more important than supply, in my view.
Supply is not more important than demand and demand is not more important than supply, in my view.
Nonsense. Just because the price depends on supply and demand does not mean they are both equally important. Supply is always paramount in determining the price. If there is an overabundant supply the price will drop. If there is a scarcity of supply the price will go sky high. Demand, at a reasonable price, is pretty static. But a severe shortage of supply of an absolute necessary product will create a panic and a run on the product. And if the supply runs totally dry, then all the demand in the world will not create more supply. The peak oil debate was, and still is, all about the coming decline in supply. We are trying to mitigate a crisis by lowering demand with renewables as the supply declines. You seem to think we can do that, but I am highly doubtful. A demand decline cannot create a crisis but a supply decline sure as hell can.
But Dennis, the thing that you got horribly wrong was insinuating that I did not believe the price was determined by supply and demand. Regardless of the importance of either, you should have known that I was not that stupid. You said “regardless of what you believe”, insinuating that I did not believe supply and demand determined price. That upset me, Dennis. You could have replied to my post without saying that because nothing in my post even remotely suggested that price was not determined by supply and demand.
Ron,
You seem to think supply is more important than demand in determining the price of a good, as in this:
Nonsense. Just because the price depends on supply and demand does not mean they are both equally important. Supply is always paramount in determining the price.
I disagree, just as on cannot tell which blade of the scissors does the cutting, the importance of supply or demand cannot be determined. That was my point, you ascribe particular importance to supply, I do not. Note that this also does not assume the are equally important, only that we don’t know.
It is the supply relative to demand that matters at any market price, one is not more or less important than the other.
Dennis, supply is what it’s all about. He who has the supply wants a certain price and he who wants the supply knows what price he is willing to pay. Of course they are equally at play in determining the price. But the price of what? The price of the supply! I repeat, the supply is what it is all about.
I just traveled, twelve days ago from Huntsville, Al to Denver, CO, then back two days ago. I traveled by jet plane both ways. Fifty years from now there will be no jet planes. And I am very doubtful that there will be any type of commercial air travel. That is because the petroleum fuel supply will be gone. I know you believe there will be battery powered planes, but I am doubtful. But my point is the is supply, or the lack of supply, that will kill the airline industry. The price will play no part whatsoever in saving the commercial airline industry. Of course there will be demand. There will be demand like a starving man demands food. But if supply is not forthcoming, then the man will die. So will the airline industry.
I rest my case.
And you still have not addressed the fact that you wrongfully accused me of not believing that supply and demand determines price. Since that had nothing to do with my argument, it would seem you simply stated that in an attempt to poison the well.
@Ron
Yes, planes fly on Kerosin.
But perhaps in 50 years they fly on batteries.
or on Hydrogen.
or on Moonshine (some synthfuel be it organic or synthesized).
If you took the Brasilian and other agrifuel and use it in planes instead of cars as now you could already power a forth or a third of all planes.
Ron,
The headline of the initial piece you linked got me thinking in terms of oil prices so I guess I misinterpreted you a bit and I am sorry about that.
You do still seem to think that supply is more important than demand and I still disagree.
I don’t think there will be batter powered airplanes, but I also think there will be less air travel, only the very wealthy will be able to afford it in the future perhaps (though when this will become the case depends on future supply and demand for oil).
Consider that jet fuel demand is a small piece of total oil demand (7.3% of petroleum product consumption in 2023), demand for oil may fall faster than supply in the future and there may be adequate oil supply to meet future demand for several decades. Beyond 2050 I don’t think we can predict the technological changes that might occur, I certainly did not anticipate the changes that have occurred over the past 50 years or so and I expect guesses about 50 years from today would be even more incorrect than my guesses 50 years ago.
Perhaps in 20 years I will be as wise as you and will know what the future will be. 🙂
I do not think that you believe that supply and demand don’t determine price, I think that you have said that demand is less important than supply. Note that demand is not what someone wants, it is what they are willing and able to pay for a good that a buyer is willing to sell them for a given price.
In regard to the comment that planes could fly on biofuels
most people would be shocked to learn how much farmland annual output it would take to fuel one flight.
For example Berlin to Madrid is 2300 km [1440 miles]. How many hectares of German or Spanish farmland devoted to one round trip flight would be acceptable? Or affordable?
I had done a prelim calculation on this about a decade ago (and found the results to be jaw dropping).
An updated accurate analysis of this is warranted, considering all the interest in aviation biofuel. To be accurate there are many parts of the equation including net yield of liquid fuel energy content per acre. My calculation was based on the best determination of that particular factor that I could find published by US…specifically for USA prime corn ethanol production
[10.57 mill btu/acre/yr which is roughly equal to the energy content of 3 barrels of oil, only a portion of which is useful as aviation fuel].
What if the answer for the Berlin-Madrid flight was 90 hectares [220 acres] of highly productive farmland? Would that be acceptable to the populations of these countries? How much displacement of food or fiber production is tolerable?
For short hop small plane flights it looks likely that electric plane travel will be viable…cost to be determined. Likely to be used by the wealthy or security services to move about a metropolitan zone.
For example- https://www.archer.com/
In reply to Eulenspiegel. No doubt some planes will be developed that run on batteries. But their weight will likely prevent them from ever powering commercial passenger aircraft. And they would have to be propeller driven, no more jets.
As for hydrogen, no, no, no, that is pure nonsense. Presently we get hydrogen from natural gas. But in the future, after the gas is all gone, all hydrogen will have to come from water via electrolysis. When you burn hydrogen, you get water. Water is like spent hydrogen fuel. You must, with massive amounts of electricity, unspend it to get hydrogen. And the efficiency of that process, for fuel cells, is about 20%. That is you get about 20% of the electricity back out of the fuel cell as the electricity took to create the hydrogen.
Then you suggest biofuels. With the massive population we have, and it is still growing, you are going to use the land now used to grow food, to grow airline fuel instead. Well…. lots of luck with that one.
Dennis, I think I am finished with this debate. I will only say, again, that supply is what it is all about. The supply of fossil fuels run the world. The supply of coal started the industrial revolution. Without that supply, and later the supply of petroleum fuel, there would have been no industrial revolution. The supply of fuel created the population growth and thereby created the demand for more supply. Massive amounts of fuel supply created more people and thereby more demand.
Again, supply is what it is all about. You may have the last word. I am finished.
At some point, the oil supply will fall much faster, than imagined here.
And the economy will fall faster too.
The actual economy is built on abundant energy and will die without oil.
Ron,
Without demand for a product there is no supply as the supply is only produced if there is a profit and without demand there is no profit. Now I am not going to be so foolish as to suggest that only supply matters, I remain convinced that both supply and demand are important.
Samy,
Lots of people have predicted the rapid decline in oil supply, if supply falls faster that I have predicted, then oil prices will rise and make a higher percentage of discovered resources profitable produce and boost oil production relative to a low oil price scenario, in addition the higher prices will make alternatives to oil more competitive and will reduce the quantity of oil consumed.
Since 2018 the amount of oil produced has been lower, while the World economy has expanded, so the economy will die argument seems to be incorrect, we are using less oil per unit of GDP and the trend continues lower over time.
@ Dennis
I appreciate your works, but I am more pessimistic than you are.
If oil prices rise rapidly, the economy will immediately enter a severe recession. And it will cause debt crisis at the global level.
I see no quiet economic solution to a decline in oil production with our global debt.
It’s going to end with a crash and an abrupt shutdown of the economy.
That’s why the slow “quiet” decline of production are not realistic scenarios in my eyes.
Because the current economy will not withstand an oil shock.
Current economic situation is much worse than in 2008.
So big economic actors will do their best to keep oil prices low for as long as possible. But this is impossible in the long term. So at some point, it will crack.
When? In a few weeks or in a few months? 1-2 years?
Your graphs projections for the future seem also optimistic to me, because they do not take into account the Covid crisis, which causes a small margin of global oil overproduction (delay). This margin no longer exists in 2024.
Are we on the verge of a crash?
https://www.macrotrends.net/1334/gold-prices-vs-oil-prices-historical-correlation
Samy,
Thanks.
Note that from 2011 to 2014 oil prices were over $100 per barrel in nominal terms and well over $140/b in real 2023 US$ the average annual real Brent Oil Price in 2023 US$ from 2011 to 2014 was $142/bo. World real GDP grew by roughly 3% per year on average over that period.
As to the concern over debt, keep in mind that at the World level assets minus liabilities are zero as long as we are not borrowing money from other planets. Debt is money that we owe ourselves as a Global community.
In 2023 the average Brent oil price in 2023 $ was $82.49 per barrel, I don’t see oil prices approaching $140/bo in 2023 US$ before 2030 and may never reach that level for annual oil prices as demand for oil is not growing very rapidly over the past 6 years at least.
Perhaps after 2030 this becomes a problem, but the transition to electric transport will tend to alleviate any supply shortages.
” World level assets minus liabilities are zero”
Dennis, this is the second time recently I have noticed you stating this. I don’t think you’re expressing your message correctly on this. I think your trying to say on a ledger for every liability someone has, there is a ledger asset someone else’s has.
Example, you buy a home(your asset) in 2007 and pay $100,000 for it and borrow $80,000. Then, 2008 comes along and the value of the home is now worth $50,000(market value). But the liability is still $80,000. In this case the liability remains the same but the world asset has declined in value by $50,000.
I think what your trying to say is for anyone’s paper liability there is someone else with an opposing paper asset. Every world asset does not have a liability. People own assets out right without a liability.
Huntingtonbeach,
Yes I agree it was indeed poorly expressed. I was talking about debt, for every debt there is a lender (where the money owed to them would be a paper asset) and a borrower (where the money owed to the lender is a liability). At the World level (assuming no interplanetary lending or borrowing) the two numbers will balance and the net systemwide is zero. Total assets (money lent) minus total liabilities (money borrowed) is zero.
There are many assets which have no debt associated with them and were meant to be implicitly excluded from the analysis, but this should have been explicit to be clear.
@ Dennis
The entire financial system is built on trust.
And no one wants to lend at a loss.
If the economic system experiences a real contraction or/and a real instability, excessive debt will become very problematic. Excessive debt means excessive money.
This is not secondary.
Fiat money is an arbitrary sign between people who trust each other.
Fiat money cannot experience contraction so easily.
With low supply of oil (peak oil), do you think that there will be no contraction of real economy?
Supply and demand determine price in the long run when the market “clears”, but economic theory doesn’t say when that will happen.
In a market where there is a wide gap between cost and the maximum price customers are willing to pay, which is the case in oil markets, prices can fluctuate wildly and be driven by psychology.
For example, when Iraq invaded Kuwait, it had no short-term effect on supply, but prices more than doubled overnight. The cause was nervous traders anticipating a supply shortage. An even more striking example were the riots in Tunisia that led to the Arab Spring. Tunisia in not a major oil producer, so the riots had no effect on supply. But prices shot up to $120.
As Leadbelly put it, “Cocaine’s for horses and it’s not for men, the doctors say it’ll kill you but they don’t say when”.
To predict the price of oil, it’s a better better look at the psychology of the traders than the volumes produced an consumed, because in the short term that’s all that matters, and in the long term, as Keynes put it, we’ll all be dead.
Samy,
No I do not expect that peak oil will be a problem, my expectation is that oil supply will be able to meet demand at moderate oil prices ($100/b or less in 2023 $), in fact after 2035 I expect there will be excess oil supply relative to oil demand unless oil prices fall to reduce the available supply.
So no I do not expect economic contraction long term until human population starts to fall at 1.5% per year or more, probably that doesn’t occur until after 2150.
I agree the economic system is built on trust.
Alimbiquated,
Prices will be determined by market participants future expectations for supply, demand and price. You are correct there is not a realistic theory for how market clearing prices are arrived at and in fact it probably never arrives there, but may tend to move in that direction. There are usually stocks of unsold goods that can buffer the market from price volatility.
For every good there are those that are willing to pay more than the market price for a good, oil is not special in this sense, it is true of every good.
” I do not expect that peak oil will be a problem, my expectation is that oil supply will be able to meet demand at moderate oil prices ($100/b or less in 2023 $), in fact after 2035 I expect there will be excess oil supply relative to oil demand unless oil prices fall to reduce the available supply.”
I disagree. It may not be catastrophic for pockets of the world that are quick to innovate, and can afford to, but I do think there will big problems for those who are short on those two attributes.
Also, I think there is a high risk of certain regions getting boxed of access to oil products as a result of geopolitical disorder. A hot world short of fuel and water and credit makes for fragile supply lines.
Hickory,
I have a perfect batting average predicting the future. I get it wrong every single time. Maybe your guesses will be better. I remain skeptical.
Note that oil output peaked in 2018, we are 6 years down the road, with Brent oil prices at about 56% of the real term peak in 2010 to 2014 for average oil prices in 2024$ around $128/b on average for Brent over that 5 year period vs $71.70/b for Brent futures as I write this.
I think the transition to Electric transport may give us plenty of room to maneuver. Transition to heat pumps may reduce the need for natural gas and the continued build out of wind, solar and batteries may reduce the need for coal and natural gas for electric power. Precision fermentation may reduce the need for agriculture land used for producing meat.
Just as I thought I would never own a smart phone when I first saw one, the market penetration of these technologies may accelerate more quickly than many of us foresee.
“I do not expect that peak oil will be a problem”
The history of the twentieth century is marked by wars and competition for energy and suddenly, there would be no more problems with supply crisis?
With such a high level of debt?
Are you serious?
We are going to experience the most serious economic crisis ever experienced.
All the parameters are met: lack of growth, lack of long-term vision and strategy, over-indebtedness, declining energy production, declining population, politicians corrupt as never before. The only question is when all this will detonate.
SAMY —
The history of the twentieth century is marked by wars and competition for energy and suddenly, there would be no more problems with supply crisis?
Much of pre-20th century human history was driven by who had the best cavalry. This went on for thousands of years, and then the technology changed.
Dennis —
Not to go all Santa Fe Institute on you, but oil prices are an emergent property of the herd of oil traders, and inherently unpredictable. It’s like predicting the movement of a flock of starlings. You know they’ll avoid the ground and trees and falcons, but that’s not much help in the wide open sky.
https://www.youtube.com/watch?v=V4f_1_r80RY
The oil market is wide open because of the huge gap between production costs and the top price consumers are willing to pay for the product.
(In this analogy, the price is the mean position of the starling).
Alimbiquated,
Those issues are true for pretty much every commodity, my point is that there is nothing special about oil in this regard.
Samy,
Energy consumption on a per capita basis has been rising since 2006 while Fossil Energy consumption per capita has been relatively flat, oil consumption per capita has been relatively flat since 1985. The rising World debt is mostly due to developing nations getting better access to credit markets over time and again at the World level debt is money we owe to each other, less of a problem than many fear.
So yes I am serious, energy availability is rising, debt is not a big problem, and population growth is slowing. Things are not as bad as you fear in my view.
Interesting graph Dennis.
I look at it and think that if the fossil fuel/capita declines by 50% that the total energy/capita may only decline 30-40%…
If we deploy a lot more non-fossil energy capability between now and then.
@Dennis
The debt is already unsustainable.
Without growth (=without oil growth), it will be a the end of the game with money fiat.
https://www.thebalancemoney.com/national-debt-by-year-compared-to-gdp-and-major-events-3306287
@Alimbiquated
OK. But getting out of this system will not be painless.
Ron- “We will eventually power all transportation with something other than petroleum. We cannot demand something that does not exist.”
Yup. Voluntarily and ahead of schedule, or a mad scramble when forced by price.
“the fossil fuel industry is driving us off the cliff and must be stopped.”
Other views weigh in—
Dennis and Ron,
A few things.
1. Supply and Demand are market quantities, and in a free and unconstrained market the price moves to so that they instantaneously equalized (S=D).
2. It annoys me that people equate supply/demand with production/consumption. Production and Consumption are physical quantities, and are not the same as Supply and Demand.
Supply = Production + Inventory Stock Draw
Demand = Consumption + Inventory Stock Built
3. On the time scales mentioned in the article (months), oil prices are generally insensitive to Production and Consumption quantities. Shortages, such as those engineered by OPEC+, are compensated by destocking. Overages, such as the ones that are expected by economic slowdowns, are compensated by inventory stocking…
Kdimitrov,
In the short term that is correct, over the long term stock draws will be equal to stock builds, my focus is the long term and in the long trem production is equal to consumption.
K, I agree. Many years ago, I was extremely disappointed to see James Hamilton (a tenured econ prof at a tier 1.5 saltwater uni) confusing the two concepts in the press/industry manner. Then again, he is a macro weenie.
KDIMITROV
Right, demand is the quantity consumers are willing to buy at a given price. The demand curve tells us how that quantity varies with price. The idea that there is an “absolute” demand for anything independent of price is naïve economics.
Alimbiquated,
In economics supply is a curve (or schedule) that tells us how much will be supplied at a set of prices and demand is also a curve that shows how much will be consumed at a set of prices. For any given price level determined by the market the quantity of demand would be read from the demand schedule for that price and the quantity of demand would be read from the demand schedule at the given market price and difference between the two would lead to either a stock build or stock draw, but market prices would adjust to a level where stock draws or builds would be minimal as the stock levels approach the level the market considers normal.
Baker Hughes Rig Count data from August 30, 2024. Horizontal Oil Rigs Only for a selection of tight oil basins.
Permian at 289 down 1 from last week and down 6 in past 8 months. Williston Basin (aka Bakken) at 32, no change from last week or from 8 months ago. Eagle Ford at 41 rigs unchanged from last week, but down 8 rigs from 8 months ago. DJ-Niobrara at 9 rigs down 1 from last week and down 5 from 8 months ago. Woodford Formation at 22 rigs up one from last week and unchanged from 8 months ago.
914 is out:
https://www.eia.gov/petroleum/production/
Close to flat (slightly up). Not that exciting, but details:
*GOM and TEX up.
*NM and ND down.
*OH remains above LA.
*And MT still nipping at KS heels.
*Natural gas (click the other tab) up a bit less than a BCF/day (more than one if you factor out AK, which is mostly reinjection).
Frac Spreads down 7 from last week and down 22 from a year ago.
https://www.aogr.com/web-exclusives/us-frac-spread-count/2024
Average Frac Spread count for past year is 254, so most recent week is 32 fracs less than the average of past year. The OLS trend from Sept 2, 2022 to Aug 30, 2024 has been an annual decrease of about 21 frac spreads per year.
Don’t frac spreads also need to be normalized for lateral length? If longer laterals mean fewer rigs are needed to maintain production, it stands to reason that fewer frac spreads are needed, too (but with more time per lateral, perhaps). This would explain why tight oil production has been increasing while rig counts stay relatively level and frac spreads decline. Everything needs to be normalized to lateral footage. Perhaps this has been covered here before. If so, my apologies.
Joe Clarkson,
Frac Spread Count is highly imprecise predictor for future oil production. Ideally, total proppant pumped in oil wells would be a better measure, but we dont have that. The issues with gross spread counts are:
1. They gross out gas and well basins
2. They don’t account for horsepower increase.
Nowadays, a single frac spread would be pumping 2-3 wells simultaneously (Simulfrac, Trimulfrac). Proppant per day has gone up dramatically per spread, and of course, this comes with more horsepower per spread, which the gross counts dont account for.
Joe Clarkson,
Some of the increase in tight oil is due to DUC inventory drawdown with falling rig count. For frac spread count we have both oil and natural gas frack spreads included and there could be changes in frac spread efficiency, proppant levels, lateral length, number of wells per pad, and probably other factors I am unaware of. Somebody probably has the data for $1000 per month or more, not me though.
Interesting piece on DUCs.
https://www.linkedin.com/posts/ted-cross-tx_what-defines-a-drilled-but-uncompleted-activity-7234549883687297025-FjP0?utm_source=share&utm_medium=member_desktop
All that matters is the price of oil.
At a higher price companies will drill more and to a certain extent produce more oil. If the world became really desperate for more oil and prices started to get out of hand then America would invade Venezuela, just like it invaded Iraq. Perhaps there are weapons of mass destruction there also.
Fact is today the oil price is $20 less than in 2012 when the world produced 10 million barrels a day less. Clearly so far supply has more than kept up with demand.
Loadsofoil,
Currently the market is well supplied with oil relative to demand. The highest 12 month average price for Brent Crude (considered the World benchmark at present) occurred in 2011 with real prices in 2008 US$ at about $109/bo for the October 2011 centered 12 month average peak. The average real Brent Price in 2008$ for the Jan 2004 to July 2024 period was $67.66/bo and the most recent 12 month average for Brent in 2008 $ is $58.92/bo. The average real Brent Price in 2008$ from Jan 1988 to December 2003 was $28.40/b, less than half (42% of) the 2004 to 2024 average real Brent price in 2008$.
I chose 2008$ as the “real dollar” year because this was the first year that the 12 month average Brent nominal price was over $100/b, an important psychological price barrier.
Output was about 75 Mb/d in 2011 for World C plus C and the most recent 12 months about 81.7 Mb/d for average output, note that output increased by roughly 850 kb/d annually from 1983 to 2018 and since the 2018 peak (roughly 83 Mb/d) World C plus C output has been down (by 1.3 Mb/d or so), so demand growth for crude seems to have slowed during the 2018 to 2024 period relative to 1983 to 2018. As to future rates of growth in oil consumption there are only guesses ( my guess is about 300 kb/d annual growth on average from 2024 to 2029, about 1.8 Mb/d in total with a new peak of about 84 Mb/d in 2029). This may be followed with a brief plateau (2 to 5 years) followed by gradually declining output.
Dennis,
The 2018-2024 period is an interesting one. It saw a historic shock to demand from COVID, the effects of which lasted for a few years. It also saw a moderation of Chinese demand, which was the main driver for the prior period.
Going forward India and other less developed Asia will pick-up the baton from China and growth rates will resume. The energy transition to EV and other alt drives is something to monitor, as a counterweight, but is not material yet.
Kdimitrov,
What is the basis for thinking it is not material yet? What do you think accounts for reduced demand for China? It is quite possible that as China’s market becomes saturated with EVs that China might start exporting BEVs and plugin hybrids to the rest of the World (places like Australia, Africa, Latin America, and non-OECD Asia, and perhaps the Middle East. The baton may get dropped due to this effect.
For China’s gasoline consumption the average annual growth rate from 2000 to 2015 was about 7.7% per year. For 2016 to 2023 the average rate of growth has been 2.64% per year, nearly three times (2.91 times) slower lately than 2000-2015.
In July 2024 plugin vehicle sales in China were 51% of light duty vehicle sales with about 27% of the market being BEVs and the other 24% of plugin sales being plugin hybrids. The most popular plugin hybrid is the BYD Song plus with Electric range of either 31 or 62 miles, so around town driving could be mostly electric with longer trips using petrol.
Dennis.
What is the most recent data for how much BOPD that EV’s have displaced.
Apologies if this is already stated somewhere herein and I missed it?
Sorry for interjecting, but I don’t know if anyone has good data on this…its a hard thing to measure. Rather there are estimates that generally come in at roughly 1 mbpd offset, or maybe a little more by now.
Here is one perspective on it-
“Demand for road fuels peaks at 49 million barrels per day in 2027. “From then on, demand begins to decline structurally, reaching 35 million barrels per day by 2040,” BNEF said in its most recent outlook.”
https://about.bnef.com/blog/electric-cars-have-dented-fuel-demand-by-2040-theyll-slash-it/
Shallow sand,
I think Hickory is correct, there is not good data on this. The most recent data that I have seen is for 2023.
For a very rough measure there were about 40 million plugin light duty personal vehicles in the World at the end of 2023. If we assume that on average each of these plugin vehicle displaces an ICEV that drove 10k miles per year and had average fuel efficiency of 35 MPG, that ould be 6.8 barrels of gasoline per vehicle times 40 million or 272 million barrels in a year, divide by 365 days per year and that is about 746 kb/d of gasoline demand displaced. Note that there are also a few heavy duty vehicles that are EVs, some EV buses and quite a few 2 and 3 wheel EVs in Asia. There are not as good estimates for these other categories, my WAG would be 50 kb/d /-25 kb/d, but I don’t have much good data to base that guess on. Based on IEA report (link below)
https://origin.iea.org/data-and-statistics/data-tools/global-ev-data-explorer
about 100 kb/d of oil was displaced by EV Vans, Trucks, and Buses and about 700 kb/d by EV cars. Overall the IEA estimates about 1 Mb/d of oil demand was displaced by all types of EVs in 2023 (suggests about 200 kb/d displacement from 2 and 3 wheel Global EVs) and expects this to increase to 6 Mb/d by 2030. Oil demand for road transport is expected to peak in 2025 in the 2024 IEA EV report. In 2035 the IEA expects 11 to 12 Mb/d of oil demand to be displaced by EVs in Stated policies (STEPS)and Announced Pledges Scenarios (APS) respectively.
https://origin.iea.org/reports/global-ev-outlook-2024
Shallow Sand,
We did calculations for USA, based on the EIA data for electricity used for EV. It came to ~80 kbpd of motor gasoline displaced.
Dennis,
The 2016-23 gasoline math for China is obviously disingenuous, you are including the COVID years in your averages. In 2023 for example, gasoline demand grew 12.3% to an all time high.
China stats are quite opaque, but everything points to diesel/industrial being the culprit for the slowing demand. Diesel crack margins in Singapore have been weak all year and the manufacturing surveys from China have been very weak.
Kdimitrov,
The data was for gasoline only from Energy Institute, I did calculations based on total plugin vehicle estimates and also used data from IEA EV Outlook. For the US the penetration of EVs has been relatively low, so for the US I would not expect a large impact.
For the World gasoline consumption in 2018 was 24383 kb/d and in 2023 World gasoline consumption was 24616 kb/d, that is an increase of 233 kb/d over a 5 year period (47 kb/d average annual increase). In 2013 World gasoline consumption was 22092 kb/d, so the 2013 to 2018 increase was 2291 kb/d or about 458 kb/d annually on average over those 5 years. It seems that something has changed, growth in oil demand seems to have slowed compared to the years prior to 2019.
A single year change is not important in my view, I didn’t think it necessary to mention the pandemic as I thought that was fairly obvious. How long will we need to wait before that pandemic is no longer blamed for a lack of recovery in demand.
To me “the no material affect” claim seems not well supported.
Most of the plugin vehicles in the World are either in OECD nations or China, so we would expect any effect of EVs and plugin hybrids on demand to show up mostly in gasoline consumption in those nations. The chart below shows that from 2016 to 2019 in OECD plus China there was an annual increase in gasoline consumption of 175 kb/d, from 2019 to 2023 there was an annual decrease in gasoline consumption (using simple straight line endpoint estimates in each case rather than OLS) of 54 kb/d. Some of this decrease may be due to more telecommuting since the pandemic changed social behavior, difficult to tease out the differences.
The pandemic definitely had some effect, but I had expected we would see consumption rebound by 2023 to 2019 levels and so far this has not occurred for this group of nations. I also expect we will see China start to export a lot of plugin vehicles to other nations, so if there is a material effect on oil consumption we may see it spread to the non-OECD as TCO for inexpensive Chinese plugin vehicles is far lower than ICEVs except where oil consumption is subsidized (as is the case in many OPEC nations).
Dennis thanks for that information.
I’m wondering if a part of the equation not discussed could alter the conclusion one could draw from this-
Putting price in ‘Real’ terms means that it is adjusted for inflation and is an attempt to reflect purchasing power. Could this oil price trend since 2010 therefore be a reflection not only of adequate supply but also of a significant relative out performance of other components of inflation (labor, materials, etc)?
Or could this ‘real’ dollar value also be significantly affected by currency exchange rates?
These topics are far outside my scope of understanding.
Hickory,
Exchange rates are a bit tricky because there are many different currencies. I am simply giving Brent prices based on US CPI Inflation which does not reflect inflation everywhere in the World, not clear there is a Worldwide inflation index.
Yes currency exchange rates will affect the “real dollar value” in every nation. This chart applies only to the US, we would have a slightly different chart for each nation.
some of the 10 MBoPD since 2012 is a result of over investment in shale oil due to low interest rate.
Novi gives an estimate of the investment in Permian,
so far, 50,000, half of the wells drilled in Permian, with $8 million per well, that’s $400B f each well, with infrastructure and total investment is easily over $500B?
and if they could actually produce half of the 35Gb that Dennis predicted, and lifting cost each BO at ~$10, the cost of each BO will be easily over $40.
When do higher interest rates start hitting shale companies when they have to rollover their debt?
Energy intensity is defined as the amount of energy used to produce a given level of output or activity.
Interesting interactive global map display of energy intensity, with each country having a graph of change over time (hover over it). Most countries are showing a significant decline in energy intensity over time, as Dennis has pointed out many times….making better use of combustion and modernizing mechanisms towards more efficient electrification.
Also apparent is the considerable difference between countries in how energy they require per unit economic activity.
https://ourworldindata.org/grapher/energy-intensity?time=2019
you can also view it in chart form-
https://ourworldindata.org/grapher/energy-intensity?tab=chart&country=CHE~DEU~IRN~USA
Hickory
If there happens to be sources of a sudden burst of cheap energy (coal, natural gas, oil or hydro) nearby somewhere around the globe, the historical reaction would be to build more industry and use more electricity and boast all nearby consumption due to low energy prices. You will then create several layers of prosperity a lot of places more locally, that really are not that difficult to scale back on to some degree.
The efficiency of the internal combustion engine has really come to a standstill in my opinion. I witnessed how the diesel engine was made very efficient for personal usage through high pressure electronic injection. But now, the diesel is needed elsewhere since options are so good. Electric vehicles or maybe a vehicle that runs on a small gasoline engine. The last one because gasoline is a byproduct in the refining process, and it would have to find some use regardless of diesel output (In the early stages of petroleum production, they did not know what to do with gasoline. So they dumped it in the river inland in the US).
The efficiency of electricity is an ocean of possibilities provided you get enough of it. It can all be directed to mechanical energy/work very efficiently at about an 80% rate accounting for 10% loss via battery. When it comes to using electricity for heating, conservation must be a main point. Though using heat pumps are the best use of it in that regard; mechanical energy is still the best application overall (most transportation + part of industry and construction). Trying to fit in ever more of economic activity based on electricity again based on renewables makes sense. There is so much to work on (appliances, heat pumps, transportation, mechanical and low heat industry etc) if enough resources are made available to make it happen.
kolbeinih —
A sudden fall in the price of energy only leads to rapid increase in energy use if energy is the limiting factor for doing something useful. The same applies to any commodity.
For example, in recent years light bulbs have gotten ten times as efficient as they used to be, so I can light the rooms of my house for about a tenth of the energy as I used to. But my house isn’t ten times brighter than it used to be, because energy costs weren’t the limiting factor.
Hickory,
I focus on the World as in the chart linked below, but this suffers from the problem that real GDP is an imperfect measure (as you have often correctly pointed out). Though we can substitute the Human Development index (HDI is a per capita measure) for real GDP and primary energy consumption per capita as an alternative measure for energy intensity, if one prefers (though that data only starts in 1990 for HDI).
https://ourworldindata.org/grapher/energy-intensity?tab=chart&country=~OWID_WRL
Chart for World Energy intensity from our world in data
link to HDI
https://ourworldindata.org/grapher/human-development-index?tab=chart&country=~OWID_WRL
link to primary energy consumption per capita
https://ourworldindata.org/explorers/energy?tab=chart&facet=none&country=~OWID_WRL&Total or Breakdown=Total&Energy or Electricity=Primary energy&Metric=Per capita consumption
The two data sets can be downloaded at links to create an energy consumption per unit HDI chart, to use a different measure from real GDP if one prefers.
Dennis
How much of that GDP is simply debt piled on more debt? We hear about debt as a percentage of GDP but the point being debt is a major part of that GDP. Debt is starting to cripple governments ability to deliver things like schools, police, fire service. Roads are falling to pieces and taxes are rising.
https://www.imf.org/external/datamapper/GG_DEBT_GDP@GDD/SWE/JPN/CHN/MNG/FRA
It is only due to massive rising debt that enables many countries to pay for basic services. What happens when the first major country can no longer increase debt. Taxes will rise or there would be a massive cut in services. Each way a major hit to the economy would take place. Anyone who thinks simple solutions are at hand simply doesn’t understand how bad things already are and how much worse they will get.
Loads of oil,
There has always been debt, as long as it can be serviced it is not a problem. At the World level the balance is zero, for every dollar owed there is an equal paper asset for lenders. Government debt is due to either government spending that is too high or taxes that are too low.
If you want better roads and other infrastructure and lower taxes, then you are asking for higher debt.
You cannot have your cake and eat it as well.
Dennis, I agree with you about debt and the economy isn’t going to collapse after peak oil. A lot of what we use oil for is a luxury. There are alternates and efficiencies. In a free market we will sort them out with price. A recession sure, but that’s nothing new.
Chicken Little thought the sky was falling and it wasn’t.
Dennis
To think that for every dollar of debt there is a counter asset is remedial economics.
When the government debt increases by £100 billion in a year to pay for police, prisons and roads there are no assets against the increase in debt. Roads are only an asset if they are toll roads otherwise they are continually in need of costly repairs. Maybe you think prisons are an asset?
I never said taxes should not rise, I said it would impact GDP. It is actually people like yourself who are happy that taxes were cut from 80% down to 40% and kid themselves that the devastating levels of debt are not a problem.
When a government has to pay £200 billion or whatever to finance debt that comes at the expense of basic services but the rich are not effected
WTI at $70.55 today. Apparently Libya oil may be coming back online faster than expected. If we get shitty jobs data this Friday WTI will close week below $70
Jobs data probably only has to miss expectations even if it’s not totally shitty oil prices likely tank.
On the other hand if jobs data is good we will likely see an oil price rebound.
Also this Friday’s job numbers will determine if the Fed does a 25 or 50 bip rate cut in September. If the jobs data is ok only 25 but if it misses by a mile we will get 50.
Vehicles with plugs are now reported to comprise 20% of global light vehicles sales, with BYD beings the biggest seller.
My prior prediction of 90% by 2030 is likely 2 or 3 years early.
What I see in the area south of Myrtle Beach, 1000s of condos and apartments have recently been built with no charging provisions for the residents. The local power company Santee Cooper, doesn’t have the production capacity or the delivery system in place to supply the demand now. In fact they are now in court trying to get a 400MW plant built.
Monthly Energy Review from EIA US L48 C plus C output data August 2021 to July 2024. From Aug 2021 to July 2023 output increased annually at 910 kb/d based on OLS trend. For past 12 months the annual rate of increase slowed to 144 kb/d (over 6 times smaller annual rate of increase in past 12 months compared to previous 24 months.)
The last 6 months of the calendar year is usually when US production makes most of its calendar year gains.
Is that not happening this year?
Shallow sand,
Yes there is seasonality, that is why the periods I chose are 24 months and 12 months. The trends are based on the data we have through July 2024 (June and July are estimates and are likely to be revised.)
Trends often change, below is the STEO forecast for US C plus C from Feb 2024 to Jan 2025, an annual rate of increase of about 400 kb/d. With the lower rig counts we have seen over past 6 to 18 months, the STEO forecast looks optimistic, I think 250 kb/d is a more reasonable estimate for the annual rate of increase over the period in question.
Also note that the annual rate of increase for Feb 2024 to July 2024 period on the L48 chart I posted earlier is about 467 kb/d, so the STEO forecast for Feb 2024 to Jan 2025 is fairly close to that, always difficult/impossible to guess the future correctly. The period from Jan 2022 to December 2023 saw US C plus C output increase at an annual rate of 968 kb/d so 2024 average annual growth will be lower based on STEO forecast.
Is that not the same linear trend that we see in the production forecast of STEO and which is repeated again and again by the people of the EIA?
Jean-Francois,
The forecast changes monthly. Below is the forecast from the Jan 2024 STEO. To think the forecast remains the same every month is incorrect. The OLS trend for Feb 2024 to Jan 2025 for the Jan 2024 forecast was an annual decrease of 23 kb/d.
https://oilprice.com/Energy/Crude-Oil/South-America-Leads-Global-Crude-Oil-Supply-Growth.html
South America leads global oil supply growth
Another Oil Price Article
https://oilprice.com/Energy/Crude-Oil/Will-OPEC-Opt-for-This-Risky-Strategy-to-Spur-Future-Oil-Demand.html
Excerpt:
Goldman Sachs reduced last week its expected range for Brent oil prices by $5 to $70-$85 per barrel. Higher U.S. supply has been offsetting some of the seasonal demand, according to the investment bank. Efficiency gains among U.S. producers have raised shale supply by 200,000 bpd above Goldman’s expectations.
OPEC could decide to add supply on the market in a move that could be “strategically disciplining non-OPEC supply,” Goldman Sachs’s analysts wrote.
“Prices could significantly undershoot in the short term, especially if OPEC were to strategically discourage US shale growth more forcefully, or if a recession were to reduce oil demand,” the bank’s analysts noted.
Citibank is predicting $60/b for oil price.
https://oilprice.com/Latest-Energy-News/World-News/Citi-Reiterates-60-Oil-Price-Forecast-Amid-Bearish-Trend.html
Excerpt:
We could see $60-per-barrel oil prices next year if OPEC fails to implement more production cuts, Citi said in a Wednesday note to clients, citing slowing demand and strong supply coming from non-OPEC producers.
An update to US June oil production has been posted.
https://peakoilbarrel.com/us-june-oil-production-lower-than-november-2023/
A new open thread Non-Petroleum has been posted.
https://peakoilbarrel.com/open-thread-non-petroleum-september-5-2024/