By Ovi
The focus of this post is an overview of World oil production along with a more detailed review of the top 11 Non-OPEC oil producing countries. OPEC production is covered in a separate post.
Below are a number of Crude plus Condensate (C + C) production charts, usually shortened to “oil”, for oil producing countries. The charts are created from data provided by the EIA’s International Energy Statistics and are updated to October 2024. This is the latest and most detailed/complete World oil production information available. Information from other sources such as OPEC, the STEO and country specific sites such as Brazil, Norway, Mexico and China is used to provide a short term outlook.
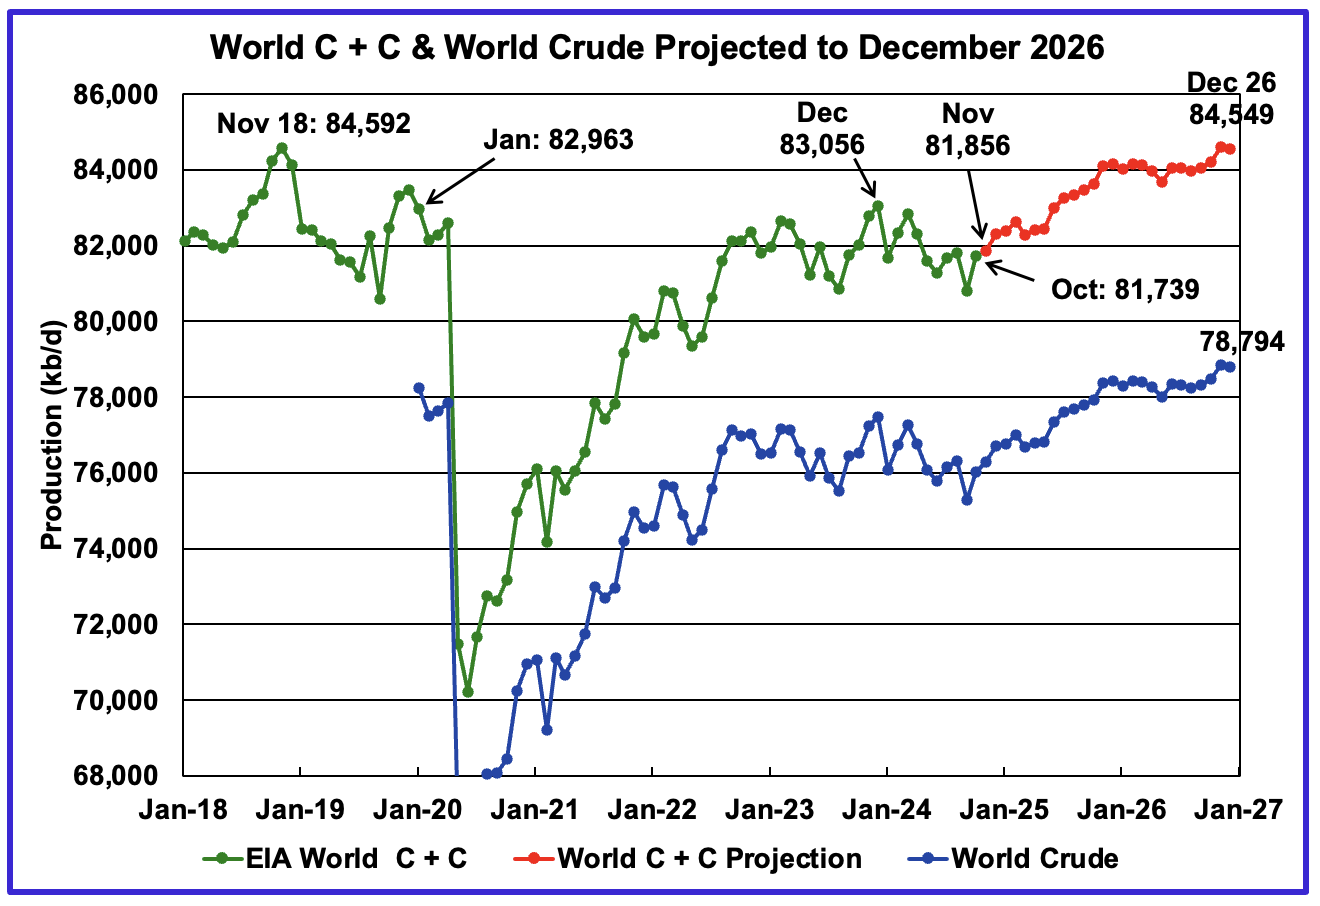
World oil production increased by 930 kb/d in October to 81,739 kb/d, green graph. The largest increases came from Libya, 500 kb/d, and Canada, 325 kb/d. These two countries last month were the two largest decliners. November’s World oil production is projected to increase by 117 kb/d to 81,856 kb/d.
This chart also projects World C + C production out to December 2026. It uses the February 2025 STEO report along with the International Energy Statistics to make the projection.
For December 2026, production is projected to be 84,549 kb/d. The December 2026 oil production is essentially flat relative to the November 2018 peak, a mere difference of 14 kb/d and well within the margin of error.
From December 2023 to December 2026, World oil production is estimated to increase by 493 kb/d.
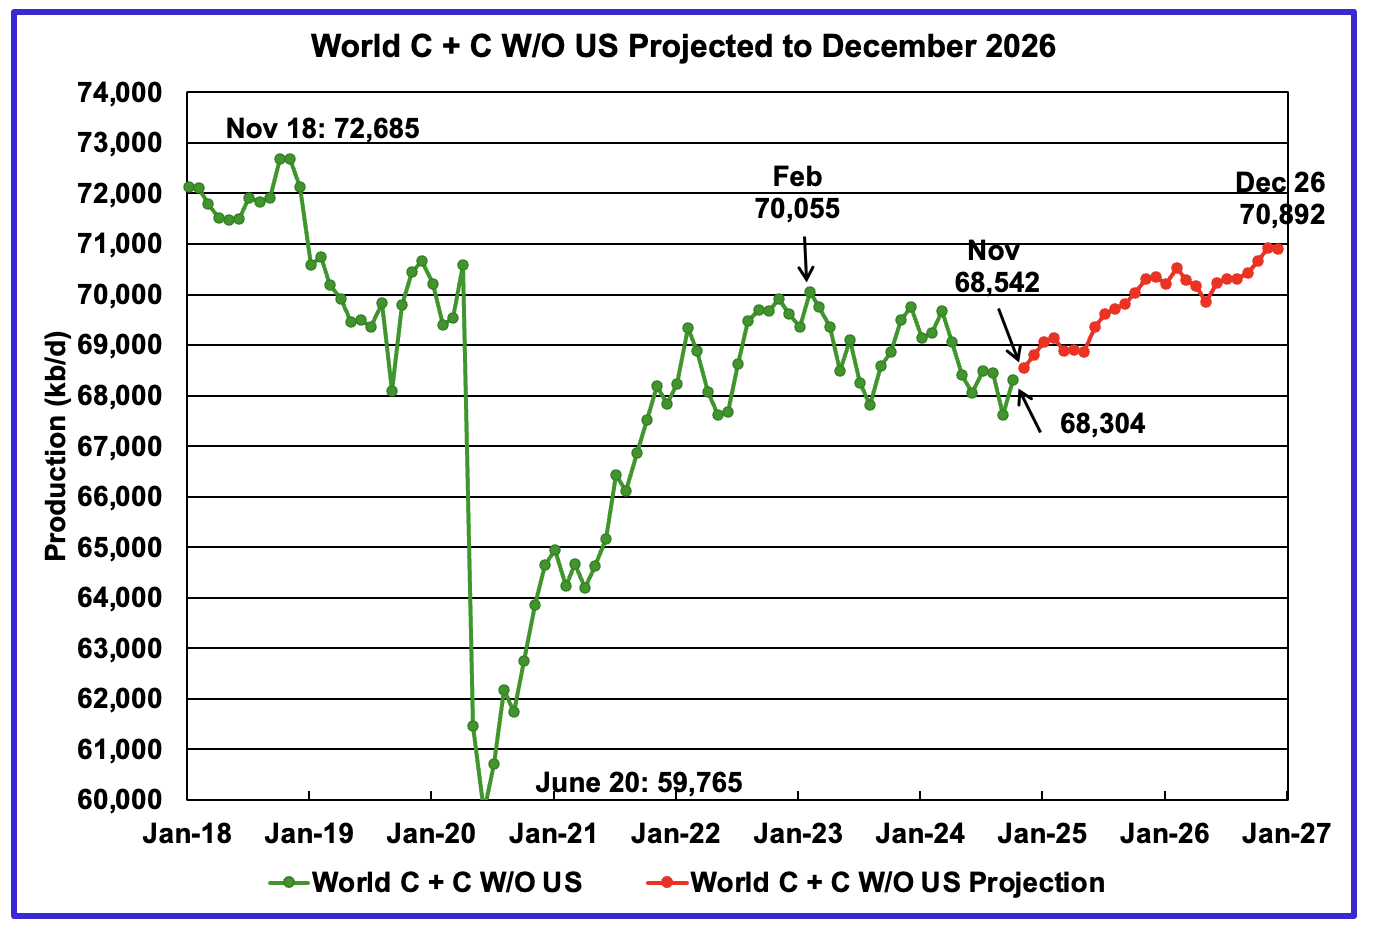
October World oil output without the US increased by 692 kb/d to 68,304 kb/d. November’s production is expected to increase by 238 kb/d to 68,542 kb/d.
The projection is forecasting that December 2026 crude output will be 70,892 kb/d. Note that the December 2026 output is 1,793 kb/d lower than the November 2018 peak of 72,685 kb/d.
World oil production W/O the U.S. from November 2024 to December 2026 is forecast to increase by a total of 2,350 kb/d.
A Different Perspective on World Oil Production
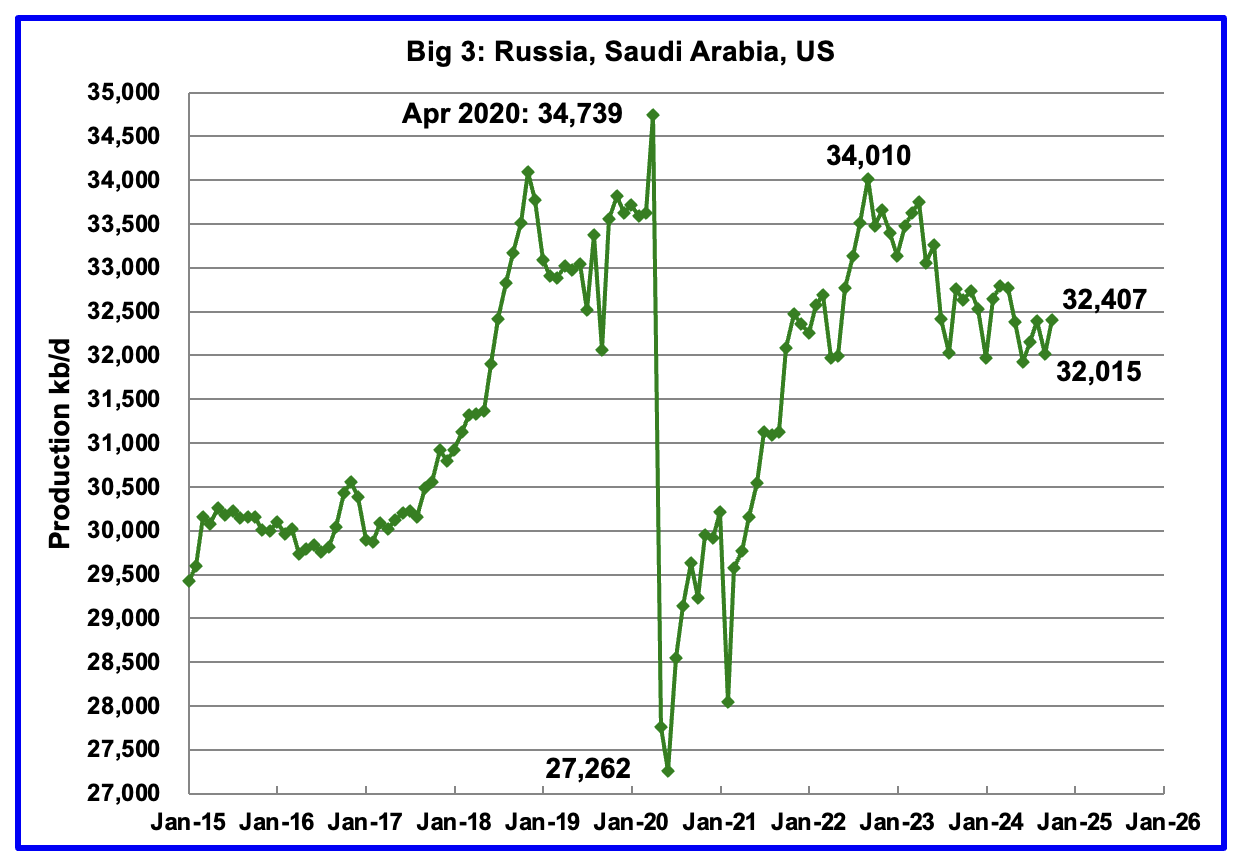
Peak production in the Big 3 occurred in April 2020 at a rate of 34,739 kb/d. The peak was associated with a large production increase from Saudi Arabia. Post covid, production peaked at 34,010 kb/d in September 2022. The production decline since then is primarily due to cutbacks by Saudi Arabia and Russia.
October’s Big 3 oil production increased by 392 kb/d to 32,407 kb/d. Production in October was 1,603 kb/d lower than the September 2022 post pandemic high of 34,010 kb/d. Of the Big 3, the country with the largest October increase was the U.S. with a rise of 259 kb/d, see Table below.
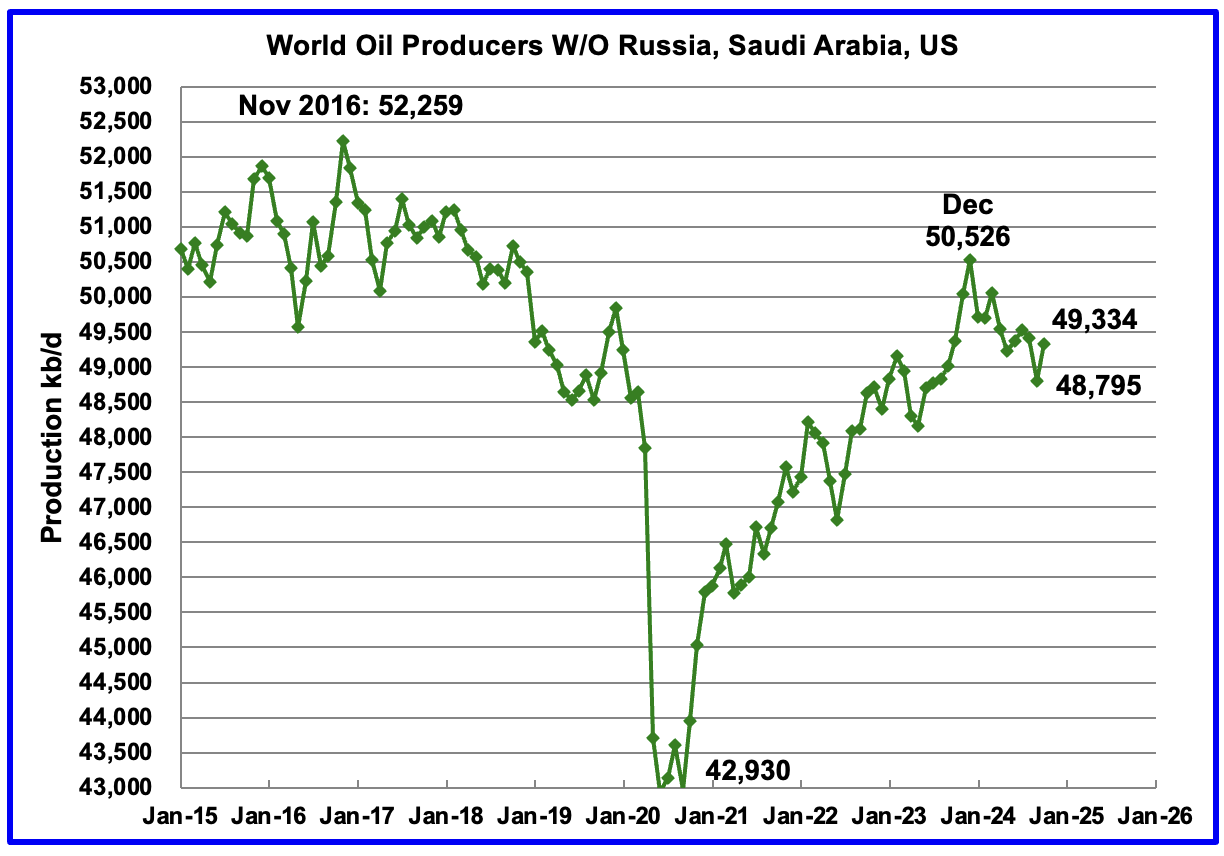
Production in the Remaining Countries had been slowly increasing since the September 2020 low of 42,930 kb/d. Output in December 2023 reached 50,526 kb/d, a new post covid high. However production began falling in January 2024. October’s production increased by 539 kb/d to 49,334 kb/d and is now down 1,192 kb/d below December 2023.
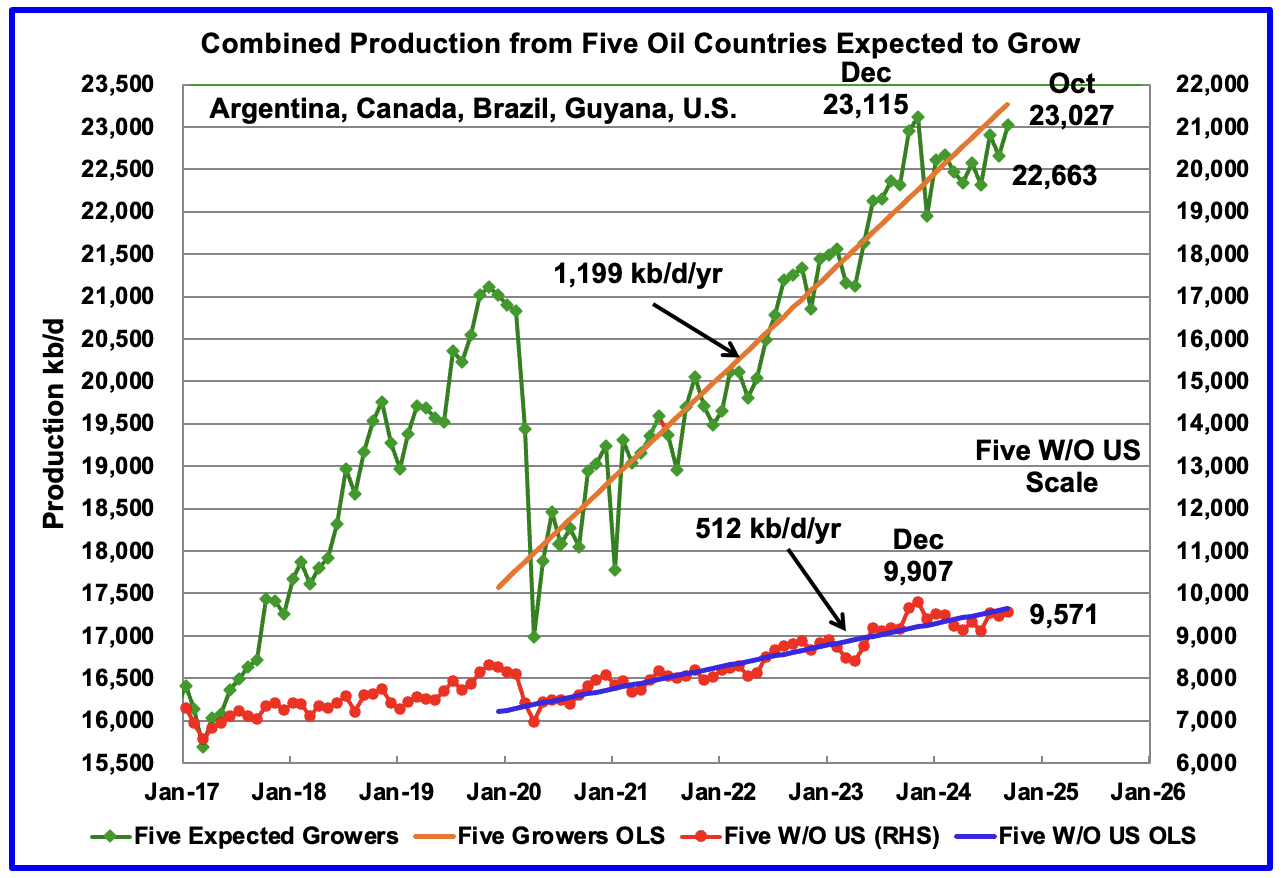
This chart was first posted a couple of months back and shows the combined oil production from five Non-OPEC countries, Argentina, Brazil, Canada, Guyana and the U.S. whose oil production is expected to grow. These five countries are often cited by OPEC and the IEA for being capable of meeting the increasing World oil demand for next year while OPEC withholds its oil from the market. For these five countries, production from April 2020 to August 2024 rose at an average rate of 1,199 kb/d/year as shown by the orange OLS line.
To show the impact of US growth over the past 5 years, U.S. production was removed from the five countries and that graph is shown in red. The production growth slope for the remaining four countries has been reduced by 687 kb/d/yr to 512 kb/d/yr.
October production has been added to the chart, up 364 kb/d to 23,027 kb/d. For the Five growers W/O U.S., October production rose by 106 kb/d to 9,571 kb/d.
The OLS lines have not been updated and will not be updated going forward unless there is a strong indication that production is rising.
Production up to December 2023 may be a situation where the past is not a good indicator of the future. In this case it may be more important to focus on what has happened to production after December 2023 rather than before. In both cases oil production has fallen since then.
Countries Ranked by Oil Production
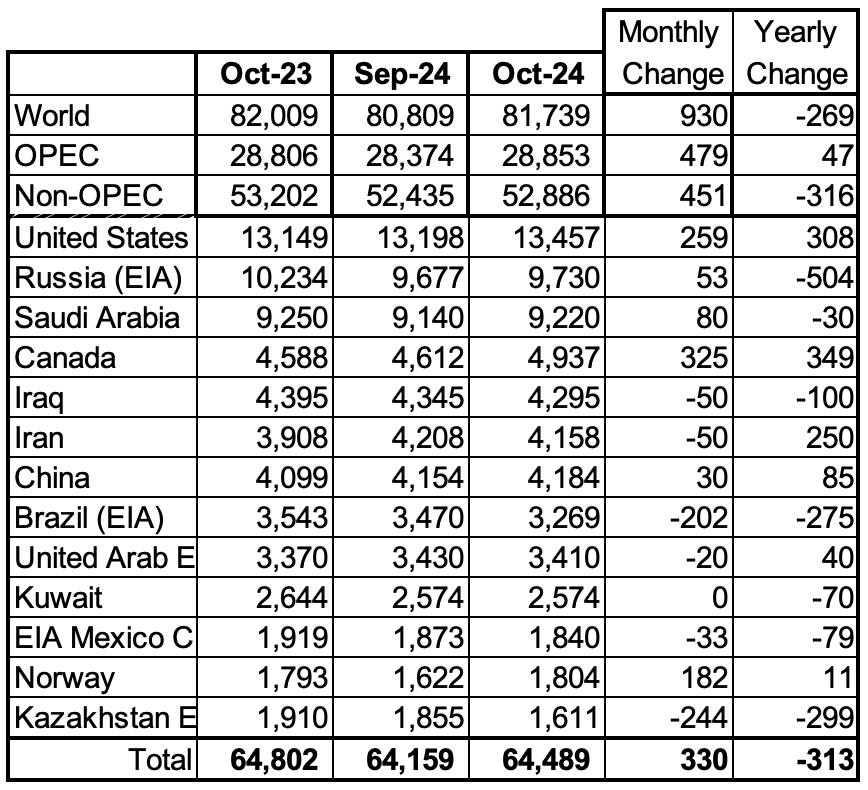
Above are listed the World’s 13th largest oil producing countries. In October 2024, these 13 countries produced 78.9% of the World’s oil. On a MoM basis, production increased by 330 kb/d in these 13 countries while on a YOY basis, production dropped by 313 kb/d. Note the large YoY production increase in Iran, U.S. and Canada and the large drop in Russia. Will the upcoming potentially stricter U.S. sanctions on Iran curb/slow that increasing trend?
October Non-OPEC Oil Production Charts

October Non-OPEC oil production increased by 451 kb/d to 52,884 kb/d. The largest increases came from the U.S., Norway and Canada. Note that Non-OPEC production now includes Angola.
Using data from the February 2025 STEO, a projection for Non-OPEC oil output was made for the period November 2024 to December 2026. (Red graph). Output is expected to reach 54,915 kb/d in December 2026, which is 943 kb/d higher than the December 2019 peak of 53,972 kb/d.
From December 2023 to December 2026, oil production in Non-OPEC countries is expected to increase by 610 kb/d.

October’s Non-OPEC W/O US oil production rose by 211 kb/d to 39,449 kb/d. November’s production is projected to rise by 213 kb/d to 39,662 kb/d.
From December 2023 to December 2026, production in Non-OPEC countries W/O the U.S. is expected to increase by 261 kb/d or 87 kb/d/yr. December 2026 production is projected to be 88 kb/d higher than December 2019, essentially no growth over seven years.
Non-OPEC Oil Countries Ranked by Production

Listed above are the World’s 11 largest Non-OPEC producers. The original criteria for inclusion in the table was that all of the countries produced more than 1,000 kb/d. Note that Angola has been added to this table and that Oman has recently fallen below 1,000 kb/d.
October’s production increased by 371 kb/d to 44,251 kb/d for these eleven Non-OPEC countries while as a whole the Non-OPEC countries saw a monthly production rise of 451 kb/d to 52,886 kb/d.
In October 2024, these 11 countries produced 83.7% of all Non-OPEC oil.
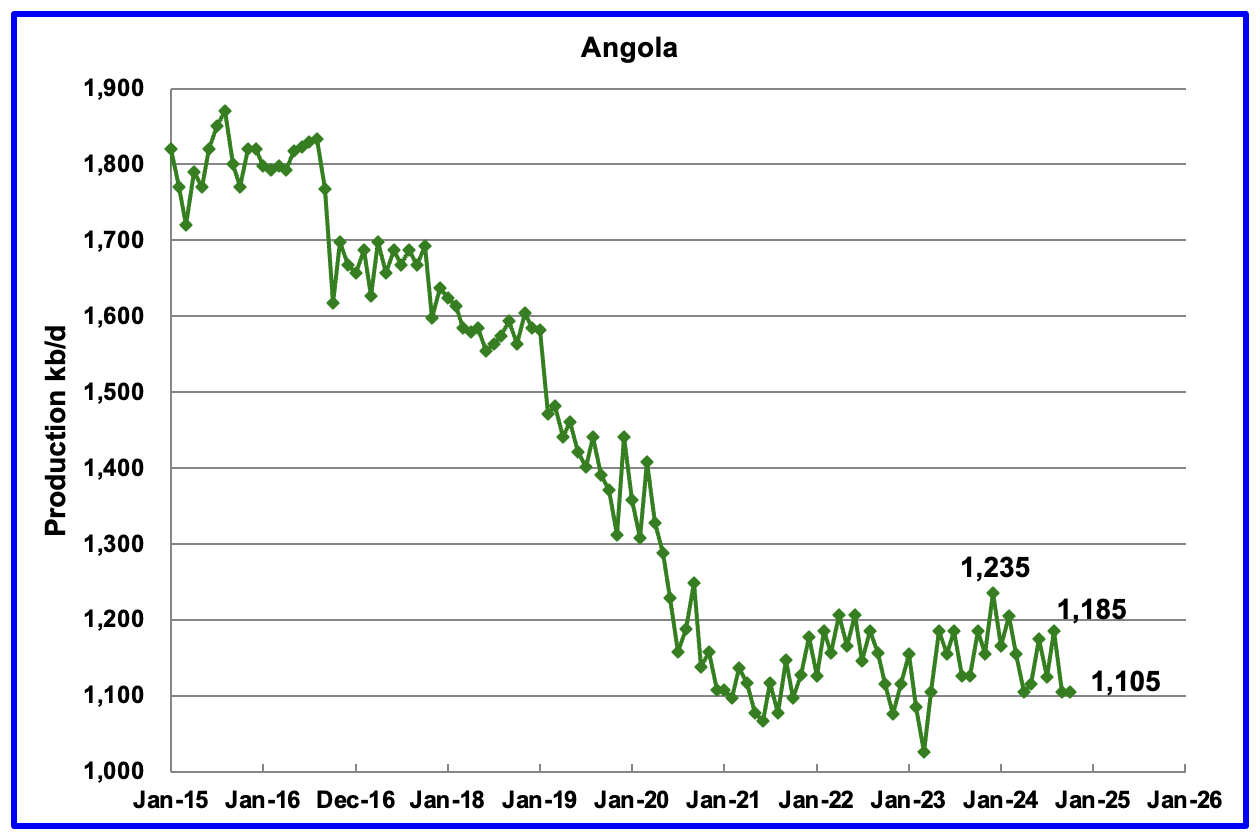
Angola’s October production was flat at 1,105 kb/d. Since early 2022 Angola’s production appears to have settled into a plateau phase between 1,100 kb/d and 1,200 kb/d.
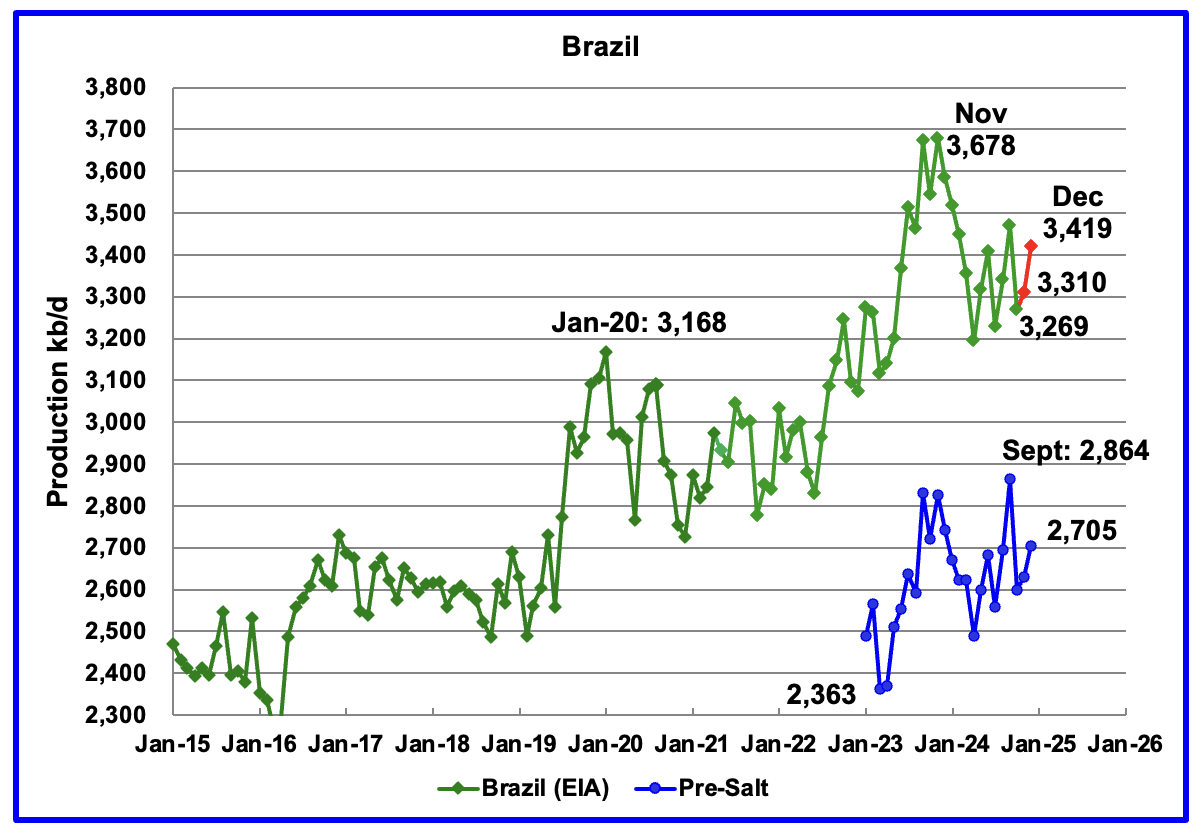
The EIA reported that Brazil’s October production dropped by 202 kb/d to 3,269 kb/d.
Brazil’s National Petroleum Association (BNPA) reported that production increased in November and again in December to 3,419 kb/d The pre-salt graph tracks Brazil’s trend in the crude oil graph. For December, pre-salt production increased by 74 kb/d to 2,705 kb/d.
Brazilian production after December 2024 has to increase by 259 kb/d to exceed the November 2023 high. However production has been very erratic since the November 2023 high. The December OPEC report states that two new floating production storage and offloading (FPSO) platforms came online in November. It also mentions operational issues and slow ramp-ups in several offshore platforms continue to be an issue. December production does show an increase of 109 kb/d, which could be associated with the addition of the two new platforms.
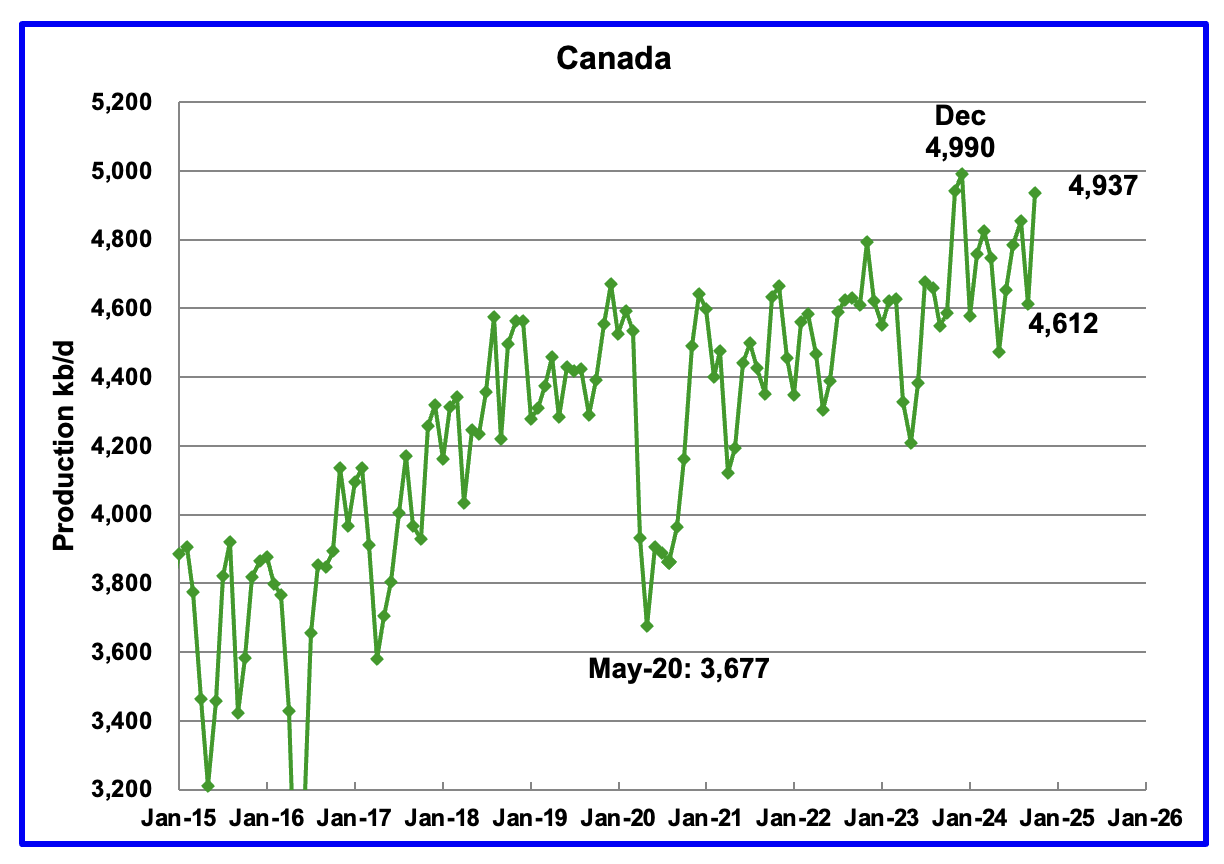
Canada’s production increased by 325 kb/d in October to 4,937 kb/d. The increase is primarily due to site restarts associated with the previous month’s wild fires in the oil sands area around Fort McMurray.
Canada has woken up to the risks associated with becoming too close to a trading neighbour. According to this Article: “The operator behind Trans Mountain’s 890,000 b/d pipeline system in western Canada is looking into increasing its capacity as export congestion looms, while threatened US tariffs may prompt the country to re-examine its broader pipeline strategy.”
Other proposed export pipelines like Enbridge’s 525,000 b/d Northern Gateway and TC Energy’s 1.1mn b/d Energy East did not get past the approval stage under a federal Liberal government. The government has now suggested that discussions need to be revived regarding these two pipelines that did not get approved.
They were blocked for Climate Change considerations. It seems that Tariff threats may now have a higher priority.
In February 2020, 412 kb/d were shipped via rail to the U.S. In November 2024, the rail shipments had dropped to 94 kb/d, largely due to the startup of the TMX pipeline.
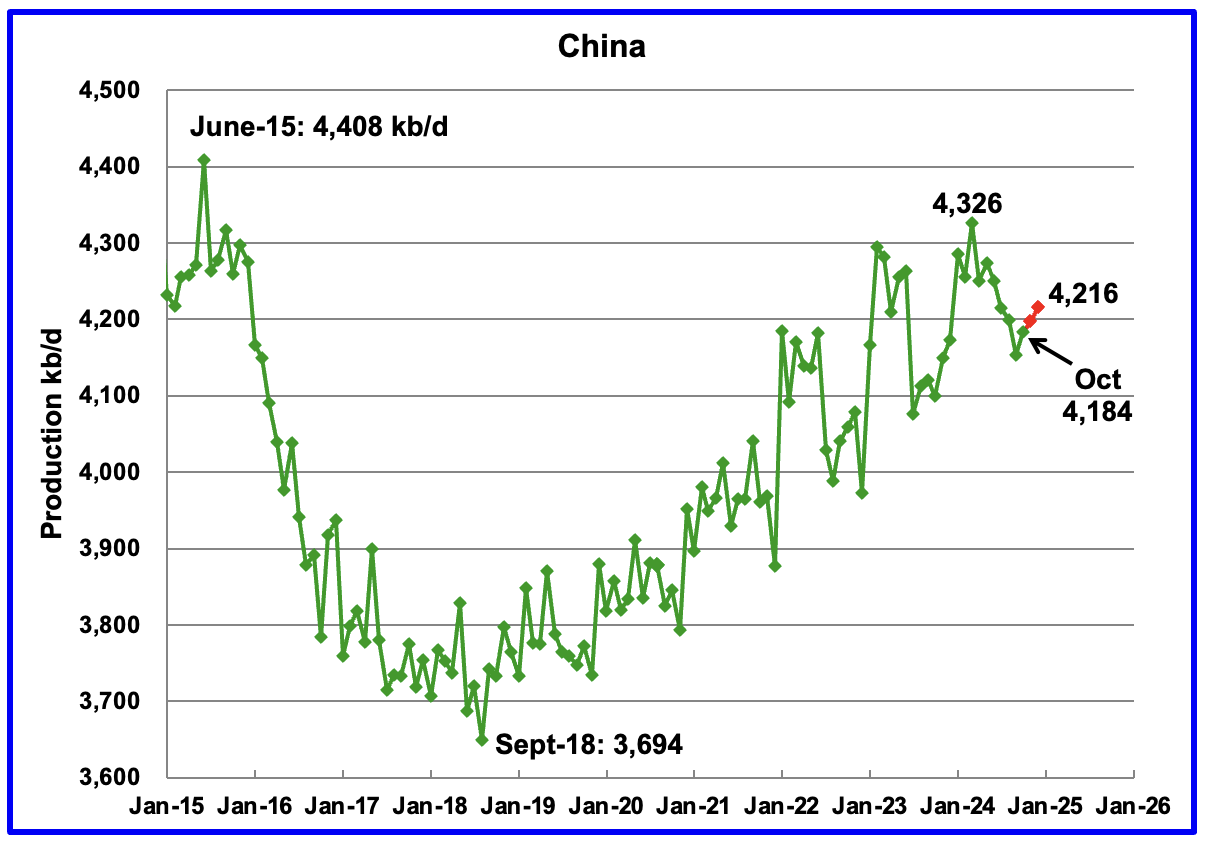
The EIA reported China’s October oil output increased by 30 kb/d to 4,184 kb/d.
The China National Bureau of Statistics reported production for November and December. Combined November and December production added 32 kb/d to 4,216 kb/d, red markers.
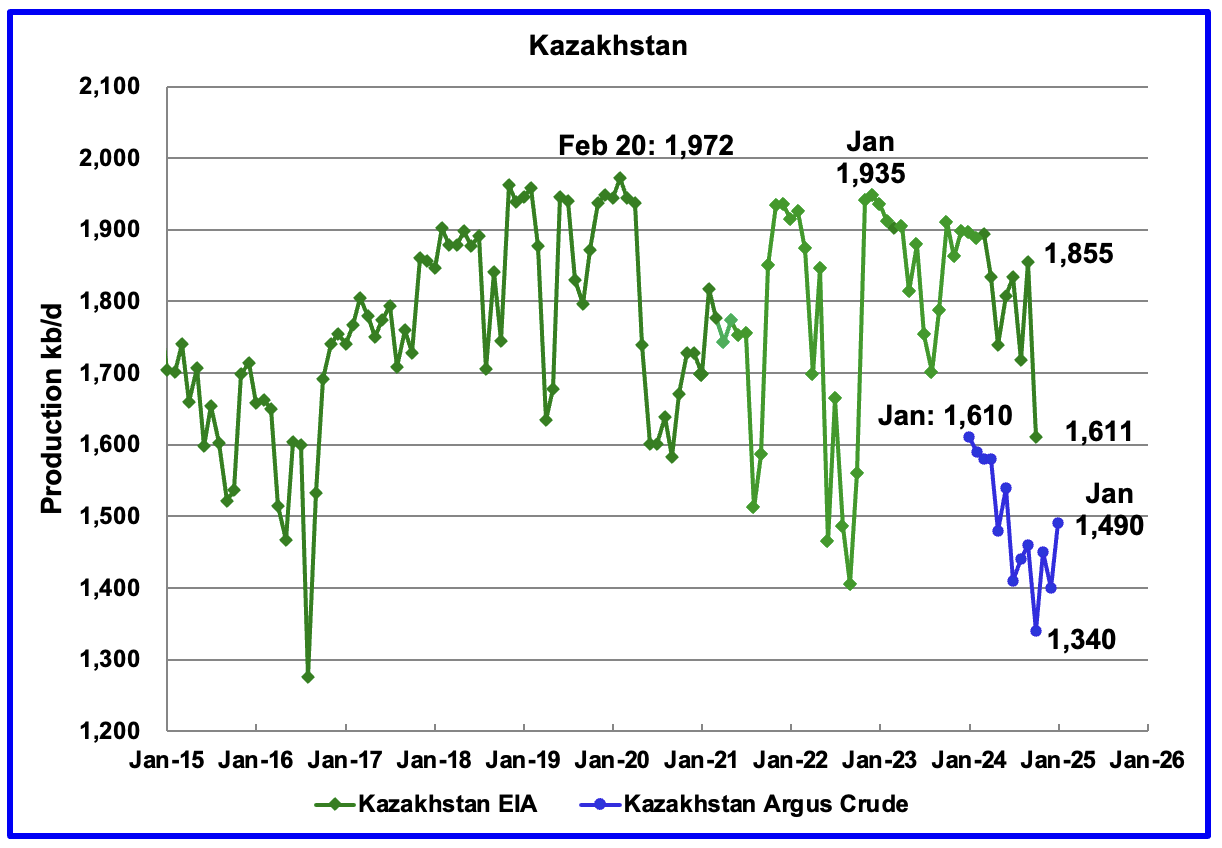
According to the EIA, Kazakhstan’s oil output decreased by 244 kb/d in October to 1,611 kb/d.
Kazakhstan’s recent pre-salt crude oil production, as reported by Argus, has been added to the chart. In October pre-salt crude production dropped by 120 kb/d to 1,340 kb/d. December production dropped to 1,400 kb/d and January added 90 kb/d to 1,490 kb/d.
Kazakhstan’s OPEC production target is 1,470 kb/d. At 1,490 kb/d, Kazakhstan is 20 kb/d over their target. According to this Article it is not clear how Kazakhstan will meet its quota target when Chevron starts increasing production at its Tengiz field.
According to this Article: “Kazakhstan’s compliance has picked up recently, but the start of a new production phase at the Tengiz oil field has raised questions over its willingness to stick to its quota this year. But the group is keeping the pressure on. “
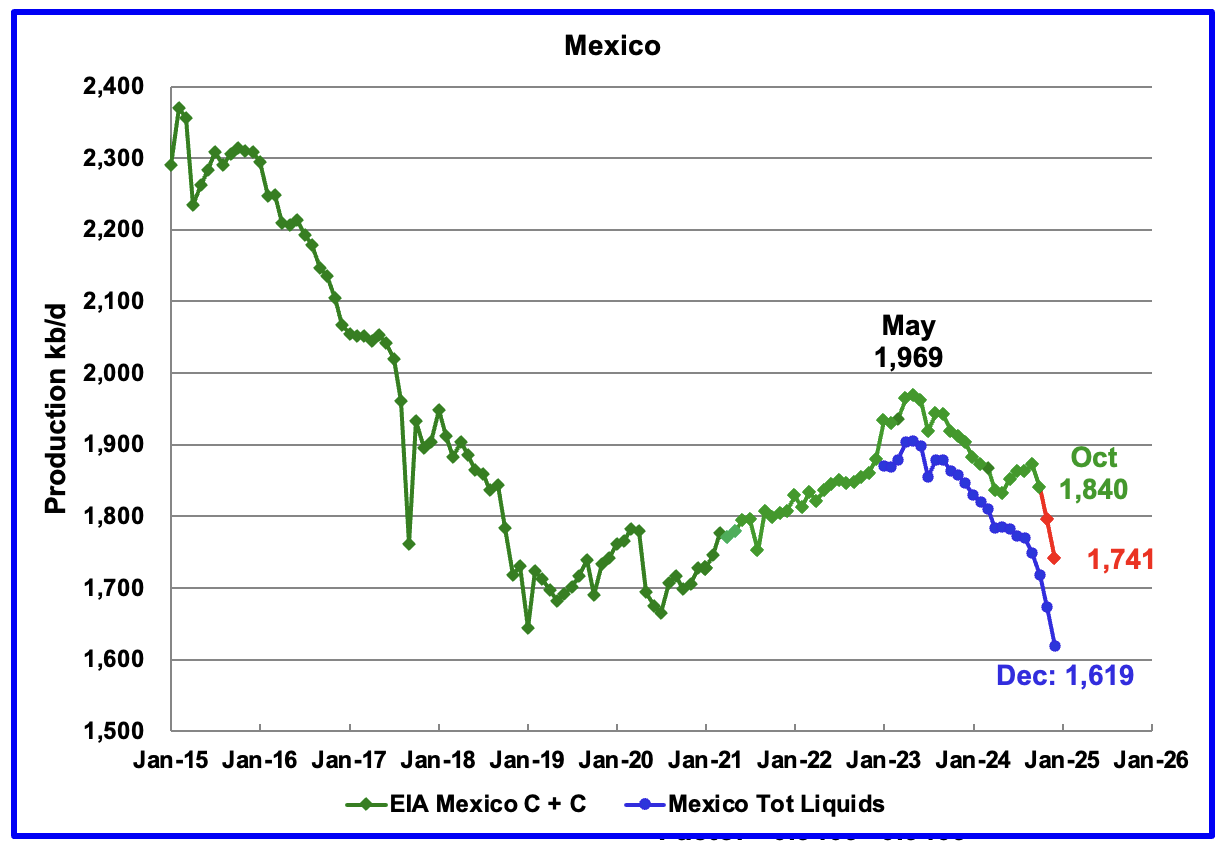
According to the EIA, Mexico’s October output dropped by 33 kb/d to at 1,840 kb/d.
In June 2024, Pemex issued a new and modified oil production report for Heavy, Light and Extra Light oil. It is shown in blue in the chart and it appears that Mexico is not reporting condensate production when compared to the EIA report.
In earlier reports, the EIA would add close to 55 kb/d of condensate to the Pemex report. However for July and August, the condensate contribution increased to 90 kb/d and for September it has increased again to 124 kb/d and 122 kb/d for October. It is not clear if this is the result of better communications with Pemex officials.
For November and December, 122 kb/d have been added to the Pemex production to estimate Mexico’s November and December C + C production, red markers. Note that Mexico’s production, according to Pemex, has continued to fall every month since May 2023, except for one month.
Since May 2023, Mexico’s total liquids production has been in a free fall and has accelerated in the past few months. Just considering Pemex production for the last five months, production has dropped by 151 kb/d or at the rate of 37.9 kb/d/mth or 453 kb/d/yr. If Mexican oil production were to continue at that rate going forward, that would be a significant reduction to World oil production growth.
According to this Article, the decline in Mexico’s crude and gas production could accelerate.
“The decline is beyond Pemex control now,” said Alma América Porres Luna, an independent analyst who formerly served as commissioner at the National Hydrocarbons Commission, or CNH, the country’s upstream oil and gas regulator.
Without any new discoveries in sight, the only two new projects that could contribute to the national production in the short term are Trion and Zama, which will not be enough to compensate for the declining production of Pemex’s main fields, Porres Luna said.
According to this Article, US oil refiners along the Gulf Coast are snubbing shipments from Mexico and instead turning to Colombia and Canada amid complaints that Petroleos Mexicanos is increasingly delivering crude that’s unfit to make gasoline and diesel.
“Flagship Maya crude is being delivered with as much as 6% of water content, or six times more than the industry standard, the people said. That means when a refiner buys a standard cargo of half a million barrels, around 30,000 barrels are water, or the equivalent to almost $2 million, according to Bloomberg calculations.”
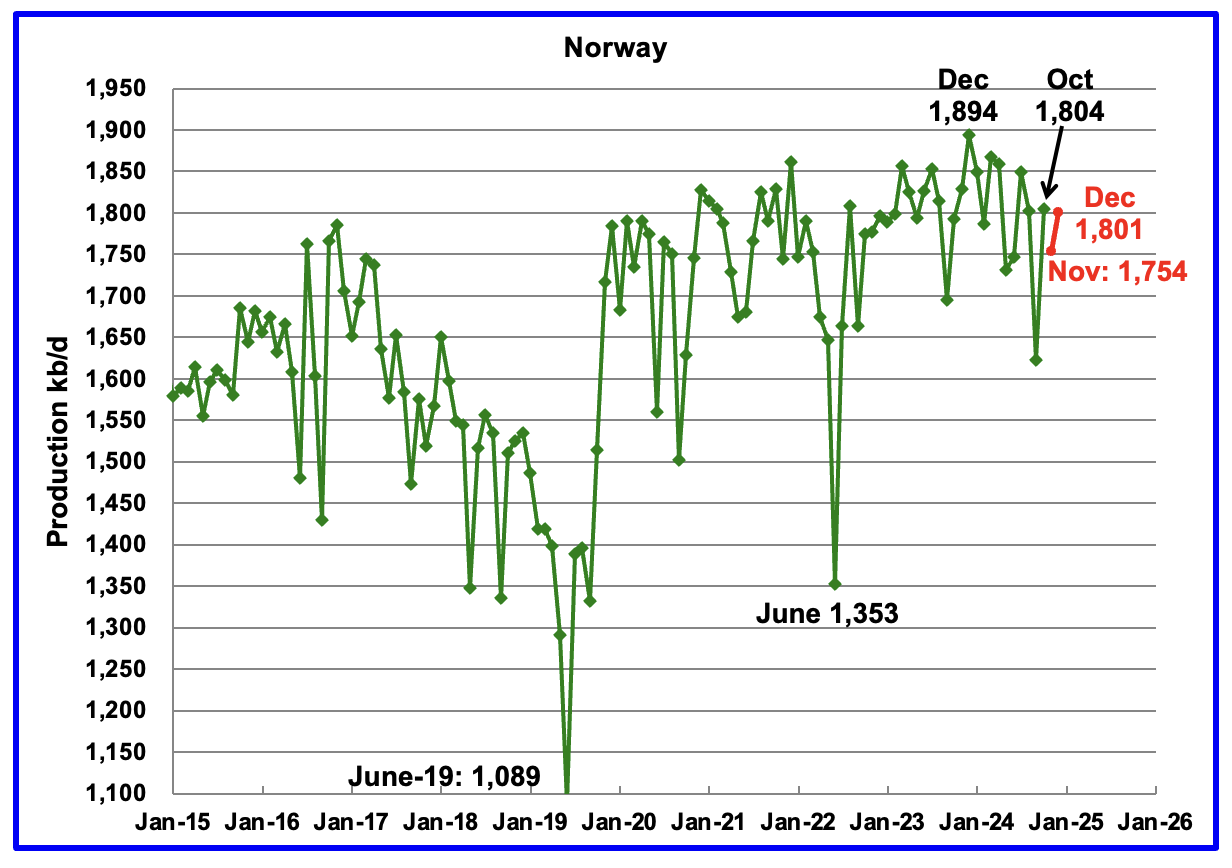
The EIA reported Norway’s October production increased by 182 kb/d to 1,804 kb/d. The increase was due the restoration of a major power failure that occurred during the previous month.
Separately, the Norway Petroleum Directorate (NPD) reported that November production dropped by 50 kb/d to 1,754 kb/d and December rose to 1,801 kb/d, red markers.
The Norway Petroleum Directorship stated that December’s oil production was 0.8% below forecast.
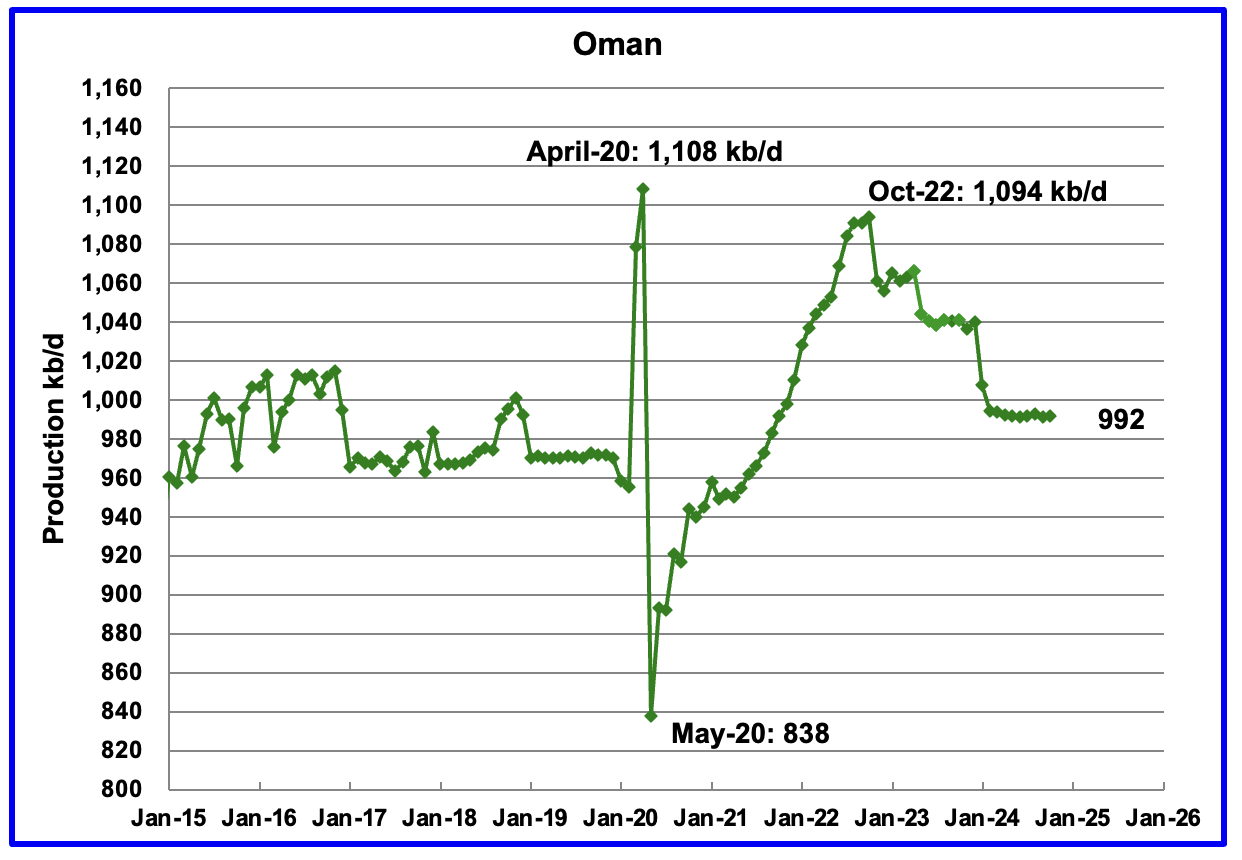
Oman’s production had risen very consistently since the low of May 2020. However production began to drop in November 2022. According to the EIA, October’s output rose by 1 kb/d to 992 kb/d.
Oman produces a lot of condensate. The OPEC MOMR reports that crude production in October was 764 kb/d, 228 kb/d lower than the EIA’s C + C.
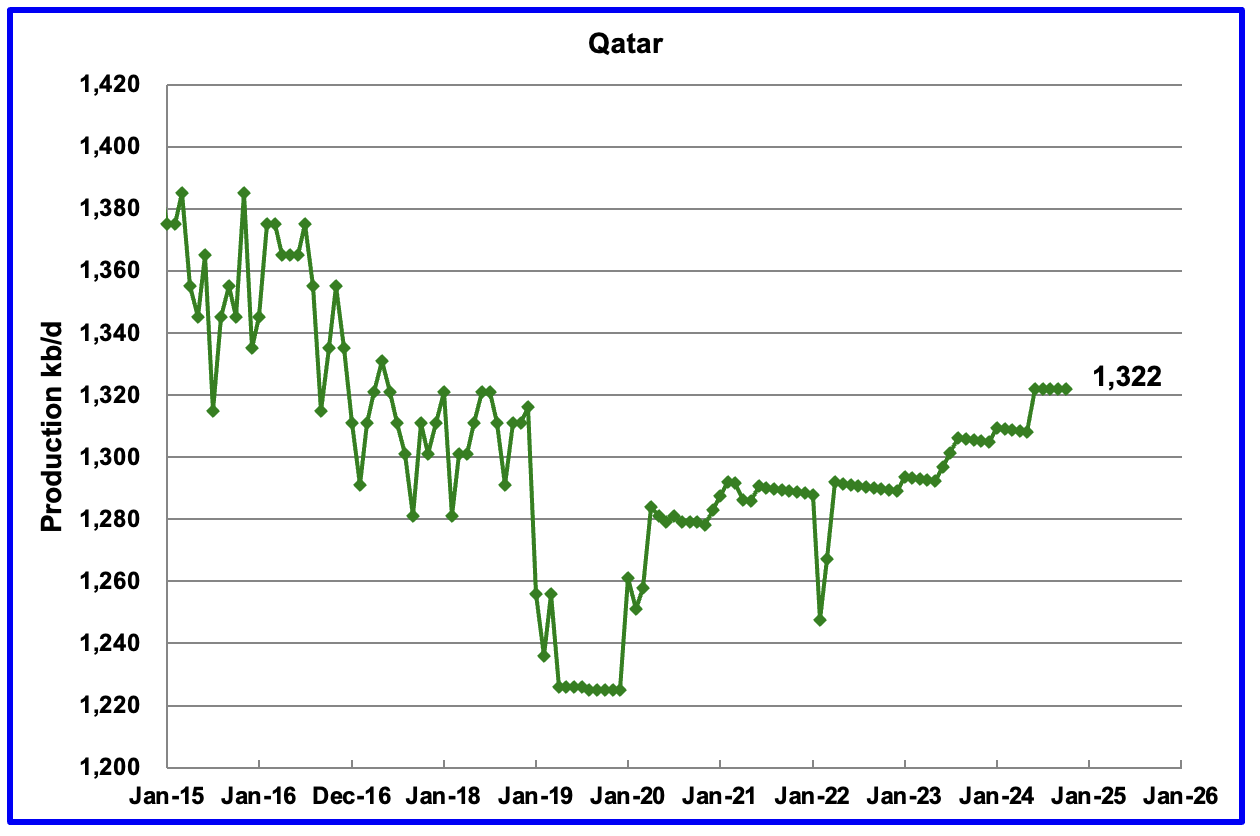
The EIA had been reporting flat output of 1,322 kb/d for Qatar since early 2022. However the current October update has revised down all of the previous production data. Qatar’s October output was reported again to be 1,322 kb/d.
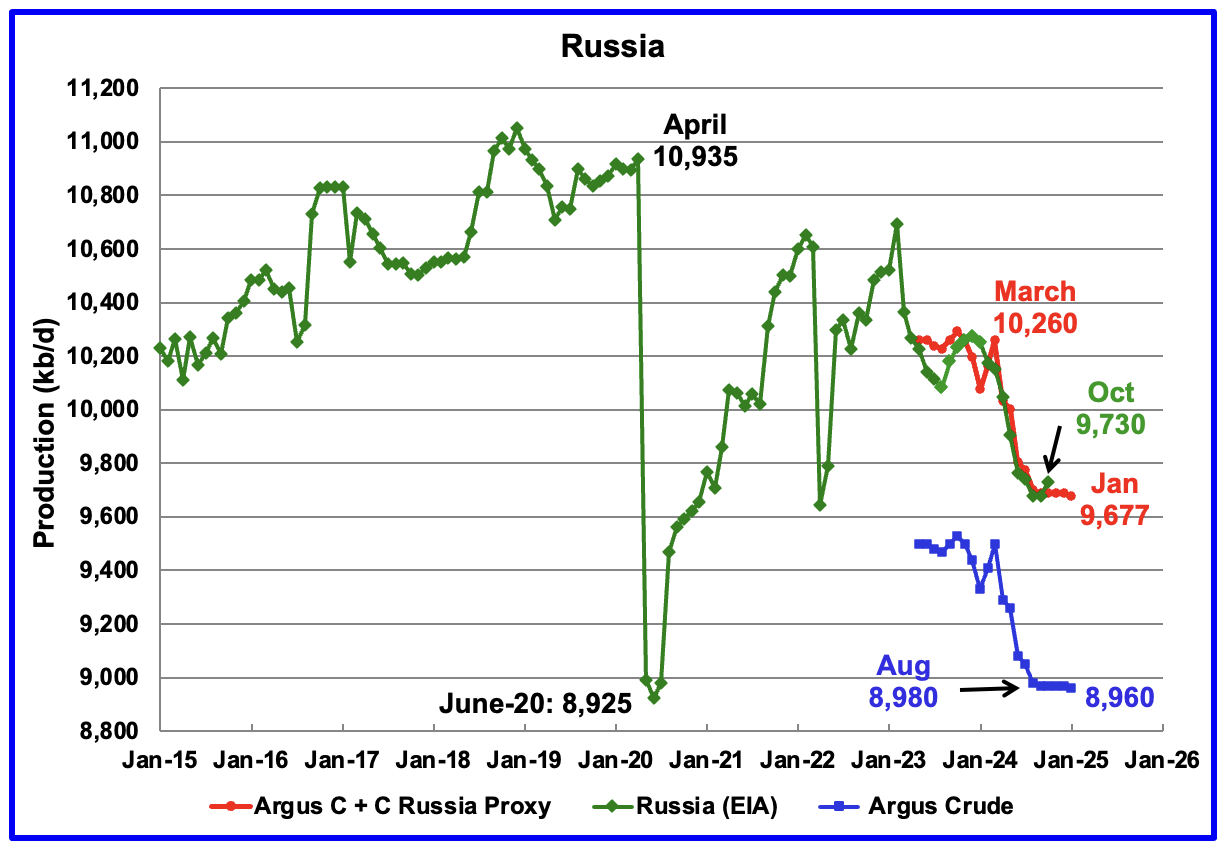
The EIA reported Russia’s October C + C production rose by 53 kb/d to 9,730 kb/d and was down 504 kb/d from last year.
Using data from Argus Media reports, Russian crude production is shown from May 2023 to January 2025. For January 2025, Argus reported Russian crude production was 8,960 kb/d, down 10 kb/d from December, blue markers. Adding 8% to Argus’ January’s crude production provides a C + C production estimate of 9,677 kb/d for Russia, which is a proxy for the Pre-War Russian Ministry estimate, red markers. This Bloomberg Article confirms the Argus estimate for Russian production.
According to Argus, Russian crude production of 8,960 kb/d is in compliance with their OPEC target of 8,980 kb/d because it is 20 kb/d lower.
In pre-war times, the Russia Energy Ministry production estimate used to be 400 kb/d higher than the EIA estimate. For October, the EIA’s C + C estimate of 9,730 is 42 Kb/d higher than the Argus proxy estimate of 9,688 kb/d.
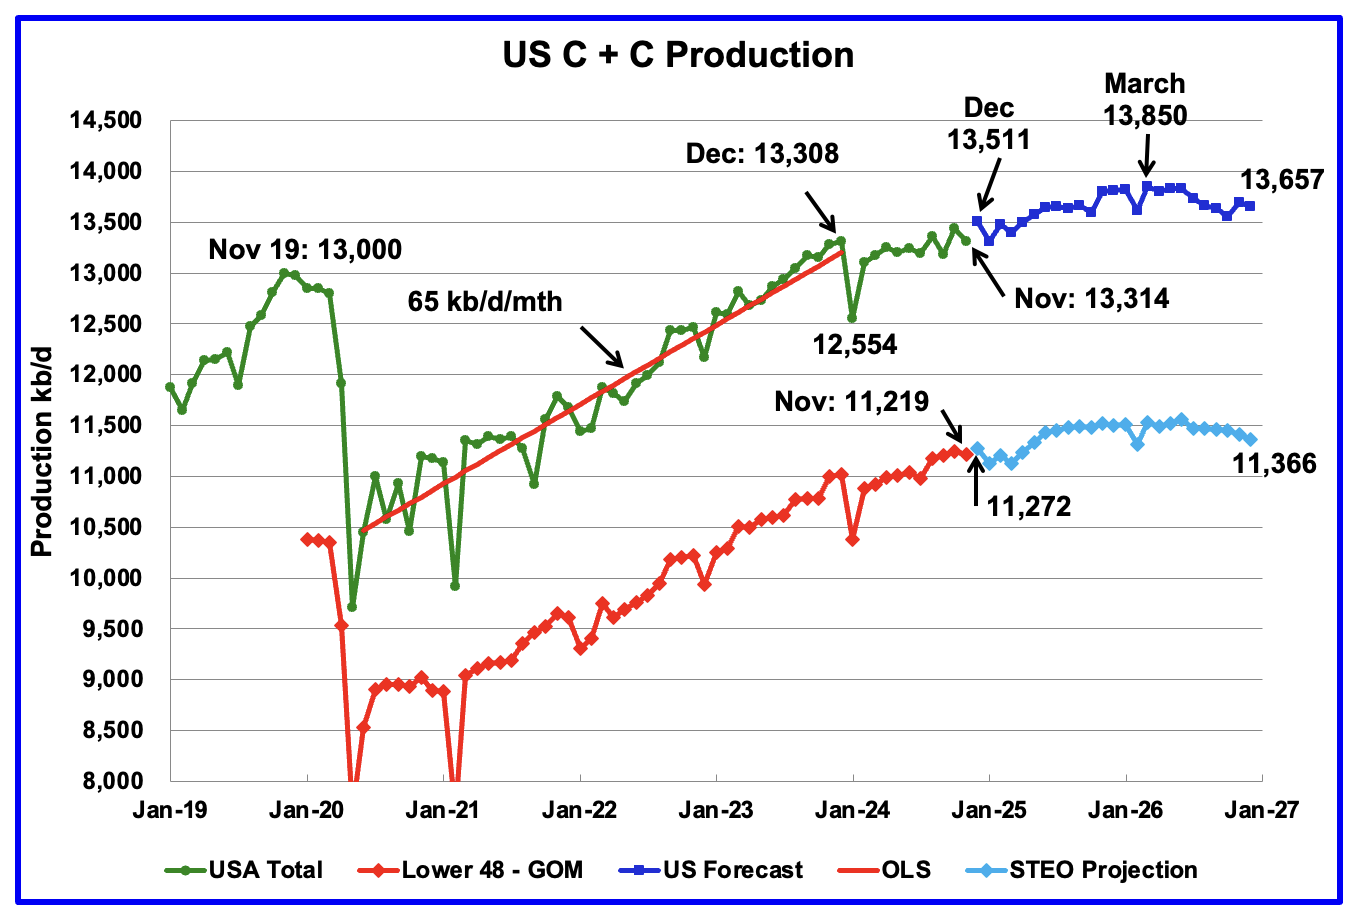
This US production chart is very similar to the one published last week in the US update post. The STEO portions of the two graphs have been updated using the February 2025 STEO.
Production in December 2026 is 193 kb/d lower than the March 2026 peak of 13,850 kb/d. For the onshore L48, oil production falls off in the latter half of 2026 to 11,366 kb/d.
74 responses to “October Non-OPEC and World Oil Production Rose”
Attached is a report from Rystad that reports that global recoverable oil is in decline
Rystad Energy’s latest research shows global recoverable oil reserves held largely steady at around 1,500 billion barrels, down some 52 billion barrels from our 2023 analysis. Of this year-over-year decrease, 30 billion barrels are due to one year of production, and 22 billion barrels are mostly due to downward adjustments of contingent resources in discoveries.
Thanks Ovi, great post.
So, world oil production is going to increase by two million barrels per day in 2025, then level off for about ten months then jump again in November and December of 2026. Onward and upward forever.
Sorry but I just ain’t buying it. Yes, I do believe in psychic phenomena, but these guys are just not that psychic. It just ain’ goanna happen. Well, that is my opinion anyway.
Ron
The production rise up to November 2025 is the unwinding of the OPEC + cuts. That little blip in November 2026 is just that. I think the plateau during most of 2026 is a sign that production is near peak. Mexico’s drop of 500 kb/d/yr, if it continues will wipe out a lot of gains from Guyana, Argentina, Brazil and Canada.
Throw in close to 300 kb/d of decline from the other countries and I think increasing production above 84,000 kb/d will be a struggle.
Ovi,
I doubt we reach 84 Mbpd in 2026 as predicted by STEO, we might get there by 2027 or 2028, after 2027 I expect World crude plus condensate output will be flat or declining, likely declining after 2028, slow at first and gradually increasing to about 3% decline per year after 2039. That’s my WAG.
Permian production growth is possibly over.
https://x.com/SheDrills/status/1889368958702330366?s=19
Lightsout,
A bunch of people are predicting this, so far regional output data does not support flat Permian output in the next year, perhaps by 2026 if EIA is correct in their price forecast. Growth may be slower, but may not stop until 2027 or 2028 in my view.
STEO Feb 2025 Permian region (includes all C plus C output)
Thank you very much OVI. You do a fantastic job.
Quark
Thanks. Much appreciated.
Looks like Mexico is in for a rough ride
Nice job Ovi, thanks.
On US production falling in 2026 according to STEO, this is due to low oil prices in 2026, WTI expected to average $62/b and Brent at $66/b in 2026.
BP surprised by ‘recharging’ US shale oil reservoirs
https://www.upstreamonline.com/field-development/bp-surprised-by-recharging-us-shale-oil-reservoirs/2-1-1778058?zephr_sso_ott=GR0RXt
??? Behind a paywall. Hype?
The guy in the picture looks honest enough……
Dennis
Thanks
In the last US post a chart of Texas District 8 was posted. It contains both Martin and Midland counties and accounts for slightly more than 50% of Texas production. Both Midland and Martin counties appear to have peaked and the GOR is rising, another indicator that production increases are becoming more difficult.
In New Mexico, Lea county appears to be on a plateau. The only county that is increasing production is Eddy county. However for November, its production did drop.
Since there was an overall drop in frac spreads in November, December and January, I think US output for December and January could be flat to down because completions should also be down even though the STEO is showing December production rising. Also we don’t know if the drop in spreads occurred in the Permian.
Attached is the District 8 chart. It looks like it is on a plateau.
Thanks Ovi,
Note that RRC says Districts 7 C, 8 and 8A make up Permian.
I use those and 4 counties in New Mexico, Chavez, Lea, Roosevelt and Eddy .
My last Permian estimate below, I will have an update next week.
Dennis
Midland and Martin are where all the action is in terms off rigs.
Ovi,
Seems to me if we want to look at Permian output, looking at all of it makes sense. From November 2022 to October 2024 the increse in Permian region output was relatively linear.
STEO estimate for Permian region, they predict flat output in 2026.
Dennis
Right now I prefer to look at the leaders of the past growth rate. In New Mexico there is a huge gap between the top two and the rest. In Texas there are the top two and then 4 in between. So I am digging into the weeds on these top counties to get a clue of when they will roll over.
New Mexico
Ovi,
For New Mexico EIA Regional Permian output only Lea, Eddy, Chavez, and Roosevelt counties are counted, for Texas Permian Districts 7C, 8 and 8A cover all Texas Permian region counties.
I think looking at total production tells us more than focusing on the top 4 or 6 counties in the Permian Basin.
Dennis
As you are aware there are different ways of attacking a problem and typically evolves over time.
Ovi,
I agree, different approaches make things interesting. Here is a chart with estimates of output from top 8 Permian counties and “the rest” of the Permian. Most of the Permian increase from Dec 2019 to October 2024 was from the 4 counties you focus on. Whether this continues in the future remains to be seen.
Ovi,
Almost all of the increase in Permian output since Dec 2019, has come from the 4 counties you focus on. Those 4 increased output by roughly 45% over the Dec 2019 to Oct 2024 period while the remaining Permian counties increased output by under 10%.
Sometimes things change over time so this might not continue in the future.
correction, the top 4 Permian counties increased output over Dec 2019 to Oct 2024 period by about 42% and the other counties that are not top 4 increased by about 8% over that period, for the Permian basin as a whole over the period cited, output increased by 26% (1705 kb/d increase with about 1465 kb/d from top 4 counties, so 86% of the total increase was from top 4 counties for the 2020-2024 period.)
It is clear your focus makes sense, but as a wise oilman often says, the future does not always look like the past, especially in the oil business.
Dennis
Interesting chart. Definitely shows the leaders.
Dennis I keep checking the Texas and New Mexico summary reports to see if any new counties are breaking into the top six in Texas. I also track Karnes in the EF. NM is only Lea and Eddy.
Looking at the latest STEO, they are showing a 300 kb/d increase from March to June. The only county increasing production close to 50 kb/d/mth is Eddy. That is the only County that is increasing production. Not sure if that is what is driving up the STEO forecast.
Between your model and my focus, we might get this right.
Ovi,
Note that my estimate for the Permian is based on RRC, OCD, and EIA data for Permian basin and Texas and New Mexico as a whole, my model for Permian output is not a part of that analysis. I find the percentage of Texas and New Mexico output from the Permian based on RRC and OCD data then multimply by the EIA estimate for the state because historically the PSM estimates for both states has been excellent. I believe this approach yields the most accurate estimates for Permian output.
This is Lea County. Looks like it is also on a plateau. A few more months of production will better define the trend.
Chevron to lay off 15% to 20% of global workforce
How will this affect Drill baby Drill?
Chevron is embroiled in a court battle with rival Exxon Mobil over its planned acquisition of oil producer Hess, which is the cornerstone of its plans for increasing oil production. At the same time, the company is facing weak margins in its refining business, which reported a loss in the fourth quarter for the first time since 2020.
The layoffs come as the company has said it is targeting $3 billion in cost cuts through 2026 from leveraging technology, asset sales and changing how and where work is performed.
https://finance.yahoo.com/news/chevron-announces-15-20-layoff-171057883.html
Valid point, and one I’ve understood for awhile.
Everything in this world comes from a combination of finance and labor, including oil. If the finance and labor isn’t there, the oil isn’t coming out of the ground, period.
The bankers managed to reflate the system, and there are lots of workers in the world. But, this also caused inflation, increased child costs, and low birth rates. Meanwhile tighter lending standards and aversion to losses might hit capital availability.
So, therefore, this idea in the world that there is always “infinite money and workers” may turn out to be false.
“there is always “infinite money and workers” may turn out to be false.”
Yes, absolutely false. The only thing infinite in this world is entropy.
Having a generous (legal) immigration policy, and strong alliances, does help hold off entropy for a while.
A bad sign when the “cornerstone of its plans for increasing oil production” is part of a court battle with a juggernaut (Exxon).
I assume this is over Guyana offshore.
Art claims Permian will peak in 2025 and hold plateau for 5 years
https://www.artberman.com/blog/what-will-energy-dominance-be-used-for/
While plenty of gas out there for US
The DoE’s LNG Export Study Is In And The Results Are Shocking
https://oilprice.com/Energy/Natural-Gas/The-DoEs-LNG-Export-Study-Is-In-And-The-Results-Are-Shocking.html
https://www.oilystuff.com/forumstuff/forum-stuff/turning-over
Mr. Shellman responds to Art Berman’s post. Be sure to read the comments section
Yes, I think Mike is emphasizing the same thing that I am trying to say here,
Permian is over drilled and the EUR predicted based on intense completions in the past 3~5 years might be over estimated. The significant phase separation resulted natural gasoline spike in gas stream is a synchronized sign of the worse than predicted decline, where the oil gets heavier and harder to produce after losing natural gasoline to the gas stream.
Sheng Wu
You are absolutely right in flagging up the phase separation issue in shale wells. The over production of of NGL’s and C5’s-C9’s dramatically increases the viscosity of the remaining liquids. The pressure drop in the fractures only magnifies the effect. In order for a well to produce there must be a pressure gradient. The faster the well produces the bigger the pressure drop and more light products are produced. Result- low recovery factor and a big pool of left behind heavier oil.
Carnot
Any idea of what happens if a well is drilled between oil wells that are on 600 ft spacing and CO2 is pumped into that well. Will the pressure build in the adjacent wells and push out more oil. Just guessing that the CO2 well would not have to be fracked. Not sure about costs and overall economics?
Ovi,
Carnot specializes in refining, so not clear he would know the details on EOR for tight oil.
For my estimates of average Permian Basin well EUR, annual decline from peak in month 2 to month 13 has been increasing from about 69% in 2016 to about 74% in 2022, I don’t have enough data to evaluate newer wells.
Chart for Permian basin average wells below has annual decline rate (from month 2 to month 13) on right hand axis and EUR in barrels on left axis, the EUR is not normalized for lateral length.
Permian basin average well EUR in kbo per 10 thousand feet of lateral for years 2013 to 2022.
https://www.youtube.com/watch?v=QPZd4qjK7_4
Israel preparing to strike Iran. Trump to turn GAZA into a vacation spot.
Andre
117 End of year; 100 avg – 2025 WTI
“Drill, Baby, Drill” is crashing into global peak oil demand: new US oil fields cannot make money.
Inside China Business report: https://youtu.be/pO-5voKt1gY
ND Dir. Cut is out. I joined the MS Teams call for first few minutes.
ND down to 1,191 thousand from 1,225 thousand, for DEC versus NOV production.
I didn’t bother listening to the call for “color” as the pdf itself wasn’t up on the website yet, which makes it hard to follow. Probably all be up in a day or two…although sometimes they get annoying near weekends.
Oil Market Report – February 2025
This is their summary report
– Global oil demand growth is projected to average 1.1 mb/d in 2025, up from 870 kb/d in 2024. China will marginally remain the largest source of growth, even as the pace of its expansion is a fraction of recent trends and driven almost entirely by its petrochemical sector. At the same time, India and other emerging Asian economies are taking up increasing shares. OECD demand is forecast to return to structural decline following a modest increase last year.
– World oil supply plunged 950 kb/d to 102.7 mb/d in January, as seasonally colder weather hit North American supply, compounding output declines in Nigeria and Libya. Supply was nevertheless 1.9 mb/d higher than a year ago, with gains led by the Americas. Global oil supply is on track to increase by 1.6 mb/d to 104.5 mb/d in 2025, with non-OPEC producers accounting for the bulk of the increase if OPEC voluntary cuts remain in place.
– Global observed oil stocks fell 17.1 mb m-o-m to 7 647 mb in December, as crude oil stocks plunged by 63.5 mb and products stocks rose by 46.4 mb. OECD industry inventories continued to decline, by 26.1 mb to 2 737.2 mb, 91.1 mb below their five-year average. Preliminary data show total global inventories falling a further 49.3 mb in January, led by a large crude stock draw in China.
In the table at the end, the IEA reports that Russia increased production by 100 kb/d in January and they are 240 kb/d above their target and 260 kb/d reported by Argus in the Russia report above and the latest February OPEC MOMR.
For those who are so inclined I offer up a very interesting podcast interview with one of the guys pioneering ‘Enhanced Geothermal’. He came out of the Oil/Gas drilling industry and the company is pushing the envelope on drilling deep for heat….and is making great strides. Put this on your radar if its not already firmly planted in your scope of energy sector developments.
Volts podcast- ‘Catching up with enhanced geothermal’
here, or wherever else you go for podcasts
https://podcasts.apple.com/us/podcast/catching-up-with-enhanced-geothermal/id1548554104?i=1000691502024
Rig Report for the Week Ending February 14
– US Hz oil rigs were unchanged at 440. The count is down 19 rigs from April 19 and is up 13 rigs relative to its recent lowest count of 427 on July 24th. The rig count has remained in a very tight range between 427 and 442 since July. Will it get back up to 450 in the coming weeks?
– The New Mexico Permian rigs were unchanged at 96 while the Texas Permian added 1 rig to 191.
– In New Mexico, Lea and Eddy were unchanged at 49 and 47 rigs respectively.
– In Texas, both Midland and Martin added 1 to 27 and 26 rigs respectively.
– Eagle Ford was unchanged at 42.
– NG Hz rigs were unchanged at 81.
Frac Spreads Increase Again for the Week Ending February 14
The frac spread count rose by 5 to 203. It is also down 61 from year ago and down by 38 spreads since October 11.
North Dakota December Production Down 34 kb/d
The low forecast for Williston ND with this cold snap is -36F. But it warms up quickly after that.
SS
Williston is in for a few cold days. Reminds me of my home town where it’s used to get to -40 to -45 for a few days every winter. The smoke coming out of chimney’s first thing in the morning would rise straight up and it was absolutely still.
-36F roughly equals -38C, so pretty cold indeed. My local record was -42C, and things, like rubber in CV joints and such break very easily at that temperature. So selling CV boots to 4x4s would likely be a business oportunity there then. Alas, for housing, frozen pipes and then thaw is not a good combination, maybe double so for mobiles.
And if your water cut is high, I would imagine much work probably ahead.
https://www.dailymail.co.uk/health/article-14398149/brutal-death-recorded-history-Deep-sea-divers.html
The most brutal death in history? Off an oil rig in the North Sea
Andre,
The Byford Dolphin tragedy has gotten a high degree of attention due – in part – to the horrific images of the divers’ remains.
There were 58 diving fatalities – including two of my friends – in the North Sea from 1971 to 1999.
The mid to late 1970s (when I worked there) were particularly precarious as there was a boom mentality and nowhere near enough experienced personnel.
The book ‘North Sea Divers … a Requiem’ depicts all 58 fatality incidents.
Diamondback Nears Permian Deal to Buy Shale Producer Double Eagle
(Bloomberg) — Diamondback Energy Inc. is closing in on a deal to acquire closely held West Texas oil producer Double Eagle in a bid to further its dominance in the world’s biggest shale patch, according to people familiar with the matter.
Once the backbone of growth in the shale patch, closely held producers are expanding output at a slower pace as private equity exits the space. Capital raised by private equity firms in energy, which averaged $21 billion a year from 2010 through 2019, has tumbled since, averaging about $6 billion annually, according to Quantum Capital Group LLC.
Will this result in fewer rigs down the road to save on capex and extend Diamond Back’s production?
https://finance.yahoo.com/news/diamondback-nears-permian-deal-buy-192903778.html
Ovi,
The answer to your question depends on the price of oil and natural gas, in part, it also depends on new well average productivity, unfortunately it costs about $10k per year for access to NoviLabs data, too rich for me. So I no longer can track what is happening to new well EUR in the Permian basin.
Dennis
That is unfortunate. Does that mean you have to run your models on the last charts that were published.
My sense with these buyouts is that companies want to give the impression they are growing or are profitable. Doesn’t seem to always workout that way.
Ovi,
For my tight oil models the last data I was able to collect was from April 2024 published by Enno Peters at Novilabs. He is no longer with Novilabs and told me he did not expect there would be further updates. I looked into the price and was told it was 10k per year and they do not do monthly subscriptions.
Also the data has been taken down from the Novilabs blog so there is now only access to data for subscribers, it is unfortunate. That is why I don’t update my tight oil models much these days as there is little hard data to estimate recent well productivity. Pulling such data from the RRC and OCD for 55,000 wells is more than I am capable of, my programming skills are not up to the task.
Yes the companies try to paint a rosy picture, I don’t really buy the hype.
Dennis
Is it possible to sort of reverse engineer the latest overall Permian well shape production curve. In other words scale your April 24 curve for November 2024. Scale the November guesstimate to match the latest production data from the EIA or whatever source you compare with.
Ovi,
We can guess at the average well EUR and assume the shape is similar to older wells, but without data it cannot be confirmed, also completion counts from the EIA are not very good, they were often very different from the Novilabs data. What I currently do is use the most recent well I have estimated (average 2022 well) and assume the average EUR is unchanged in 2023 and 2024. Starting in Jan 2025 I assume new well EUR decreases at about 1% per year at a constant completion rate of 480 wells per month (5760 wells completed annually). This completion rate is assumed to continue until December 2032, then completion rate decreases by 2 wells per month until Jan 2040 and then decrease by 5 wells per month until March 2045 when no further wells are completed. By December 2024 about 52,300 horizontal oil wells have been completed in the Permian basin, the total wells completed for the scenario is 141 thousand wells with URR=56 Gb.
I do expect the Permian will roll over, just not quite as soon as many others, for this scenario output increases up to October 2030 and then declines starting in Jan 2031. Peak is 6433 kb/d from Oct to December 2030. The scenario is likely to be optimistic as I doubt there will be this many completions, especially if Brent oil prices remain under $76/bo as there may not be many locations left that will be profitable to complete at current oil prices. Note that when 500 kb/d of conventional output is added to the tight oil to compare with the STEO regional forecast, this scenario is lower than the STEO forecast from Feb 2025, by about 78 kb/d in 2025 and by 150 kb/d in 2026.
Chart below. Click on chart for larger image.
Dennis –
Has there been meaningful growth in US/permian production over the last 12-18 months? I tried to look and couldn’t really see any clear signal…your graph seems to suggest otherwise. My feeling is that we might see 1% annual increase next 1-2 years…is there month-over-month that suggests a higher growth rate?
Kengeo,
Over the last 24 months Permian region C plus C output has increased at an annual rate of 400 kbpd.
See comment below:
https://peakoilbarrel.com/october-non-opec-and-world-oil-production-rose/#comment-785952
Kengeo,
In 2024 annual Permian tight oil growth rate was about 6.5%, but for my scenario the annual % growth rate slows to 3.6% in 2025, to 2.4% in 2026, to 1.7% in 2027, to 1.1% in 2028, to 0.6% in 2029, and to 0.3% in 2030, after 2030 output decreases for the first scenario presented. The alternative low oil price scenario below is the same through 2027, but 2028 annual increase is 0.9% with decline after 2028.
Ovi,
An alternative Permian scenario with assumed Brent oil prices remaining below $76/bo in 2025 US$ over the long term. Fewer wells completed, competion rate starts decreasing in Feb 2028 (vs Jan 2033 in previous scenario), Peak occurs in July 2028 rather than Aug 2030 and is 6368 kb/d vs 6432 kb/d in more optimistic scenario. Total wells completed in this scenario is 108k (vs 141k previously) and URR is 44 Gb (vs 56 Gb in previous scenario). This scenario looks more realistic to me. I believe it is not likely that Permian Basin tight oil URR will be more than 50 Gb (about 67% of USGS mean TRR estimates from 2016, 2017, and 2018 assessments).
wonder if AI bot could mine the open data from each state and easily outsmart human?
If this could be done easily, data services would be out of business.
For now the answer is no.
I wonder if we could do some citizen science here. Many statistical polls claim reasonable results only sampling a fraction of the population. Ovi reports rig counts down to county level. Total frac spreads are not big numbers. Could we organise enough volunteers to download enough data to generate “average well production for first x months for 2024” for one or two permian counties that Dennis, Ovi, and anyone with some extra insight thinks might be relevant to our discussion here? Maybe it could be a data mining working bee that happens on a six month or yearly basis? Does anyone here have the statistical knowledge to outline what would be required?
$4.1B, $3B in cash, makes the Double Eagle a pricey acquisition, once again attesting to the fact that there are precious few prime drilling sites left in the Permian Basin. Double Eagle has a production income stream but if you ignore that (as it’s in decline), then the price per drilling site is $10-$13.5M per site (300 to 400 new sites), which is in keeping with the Exxon acquisition of Pioneer. At that, it’s only 3/4ths the price that was being bantered about last year. With the produced water disposal, as well as a tariff on tubular steel, the cost of production is likely going up, not down. Where the price of oil goes depends largely on geopolitics and whether or not Mr. Trump partially or completely blocks exports of domestic oil. It is no accident that refineries are closing–not only on the Left Coast but along the Houston Shipping Channel and the Midwest–and new ones will probably never be built in their place. No one is sure at this point if refracturing will amount to anything in the Permian. That rock is mainly “mass” shale, as compared to the brittle, laminated shale of the Eagle Ford and Bakken (it is said that this friability is the secret sauce behind predictable results from refracking). It may be that a pivot is coming, such that LNG from the Permian becomes the money crop.
In my email box this morning from Oilprice.com Intelligence Report:
Tuesday, February 18, 2025
Ukraine’s drone strikes on Russian pipeline infrastructure, somewhat ironically carrying Kazakh crude oil to the Black Sea, have set a bullish tone for this week as the Monday settlement of ICE Brent climbed back above $75 per barrel. However, there seems to be no upside beyond that as US-Russia negotiations on a potential end to the Ukraine conflict could de-risk Russian supply over the upcoming months.
Drone Attacks Disrupt Kazakhstan Production. A Ukrainian drone attack damaged a pumping station on the CPC pipeline that carries Kazakh crude oil through the territory of Russia, with the operator suggesting some 400,000 b/d of production would need to be cut for the next 1-2 months.
We may be in for an increase in supply of oil to the market over the next year or two with Trump deciding to submit to Putin.
I hope he has advisors who will remind him every day just how critical and irreplaceable the products of the Taiwan Semiconductor Co are to the modern economy of this (and every other) country.
North Dakota sees up to 150,000 bpd hit to oil production due to cold weather
The North Dakota Pipeline Authority said oil production was estimated to be down between 120,000 and 150,000 barrels of oil per day, as of Tuesday morning, due to the recent extreme cold and related operations challenges.
North Dakota is the third-largest oil-producing state in the United States.
Associated wellhead natural gas production was also estimated to be down 0.34 to 0.42 billion cubic feet per day, Justin Kringstad, the director of the North Dakota Pipeline Authority, said in an emailed statement.
https://boereport.com/2025/02/18/north-dakota-sees-up-to-150000-bpd-hit-to-oil-production-due-to-cold-weather/#:~:text=The North Dakota Pipeline Authority,state in the United States.
An Interesting Comparion Between a Permian Basin and a Similar one in Canada
When does the valuation gap between US Permian and Canadian Montney begin to narrow?
Maybe some expert can weigh in and clarify. This discrepancy shows the damage that the current Cdn govt is doing the Cdn oil patch.
“A fun thought experiment might be to see how much prime Montney production someone could buy for that same flowing barrel price, if that someone was willing to put up with the challenges that come with producing hydrocarbons in Canada of course.”
https://boereport.com/2025/02/18/when-does-the-valuation-gap-between-us-permian-and-canadian-montney-begin-to-narrow-diamondback-ma-metrics-suggest-that-companies-could-buy-more-than-3-times-as-much-montney-production-for-the-same/
Ovi,
The Permian basin is closer to refineries which may give it an advantage, it is also not far from LNG export terminals which could make its natural gas prices better, if pipeline capacity is enough to handle all the gas (lately this hasn’t been true and WAHA gas prices are very low). Perhaps royalties and taxes are higher in Canada than the US? Those are decisions for Canadian citizens and what representatives they choose for the Parliament.
new posts are up
https://peakoilbarrel.com/short-term-energy-outlook-february-2025/
and
https://peakoilbarrel.com/open-thread-non-petroleum-feb-19-2025/