By Ovi
The focus of this post is an overview of World oil production along with a more detailed review of the top 11 Non-OPEC oil producing countries. OPEC production is covered in a separate post.
Below are a number of Crude plus Condensate (C + C) production charts, usually shortened to “oil”, for oil producing countries. The charts are created from data provided by the EIA’s International Energy Statistics and are updated to November 2024. This is the latest and most detailed/complete World oil production information available. Information from other sources such as OPEC, the STEO and country specific sites such as Brazil, Norway, Mexico and China is used to provide a short term outlook.
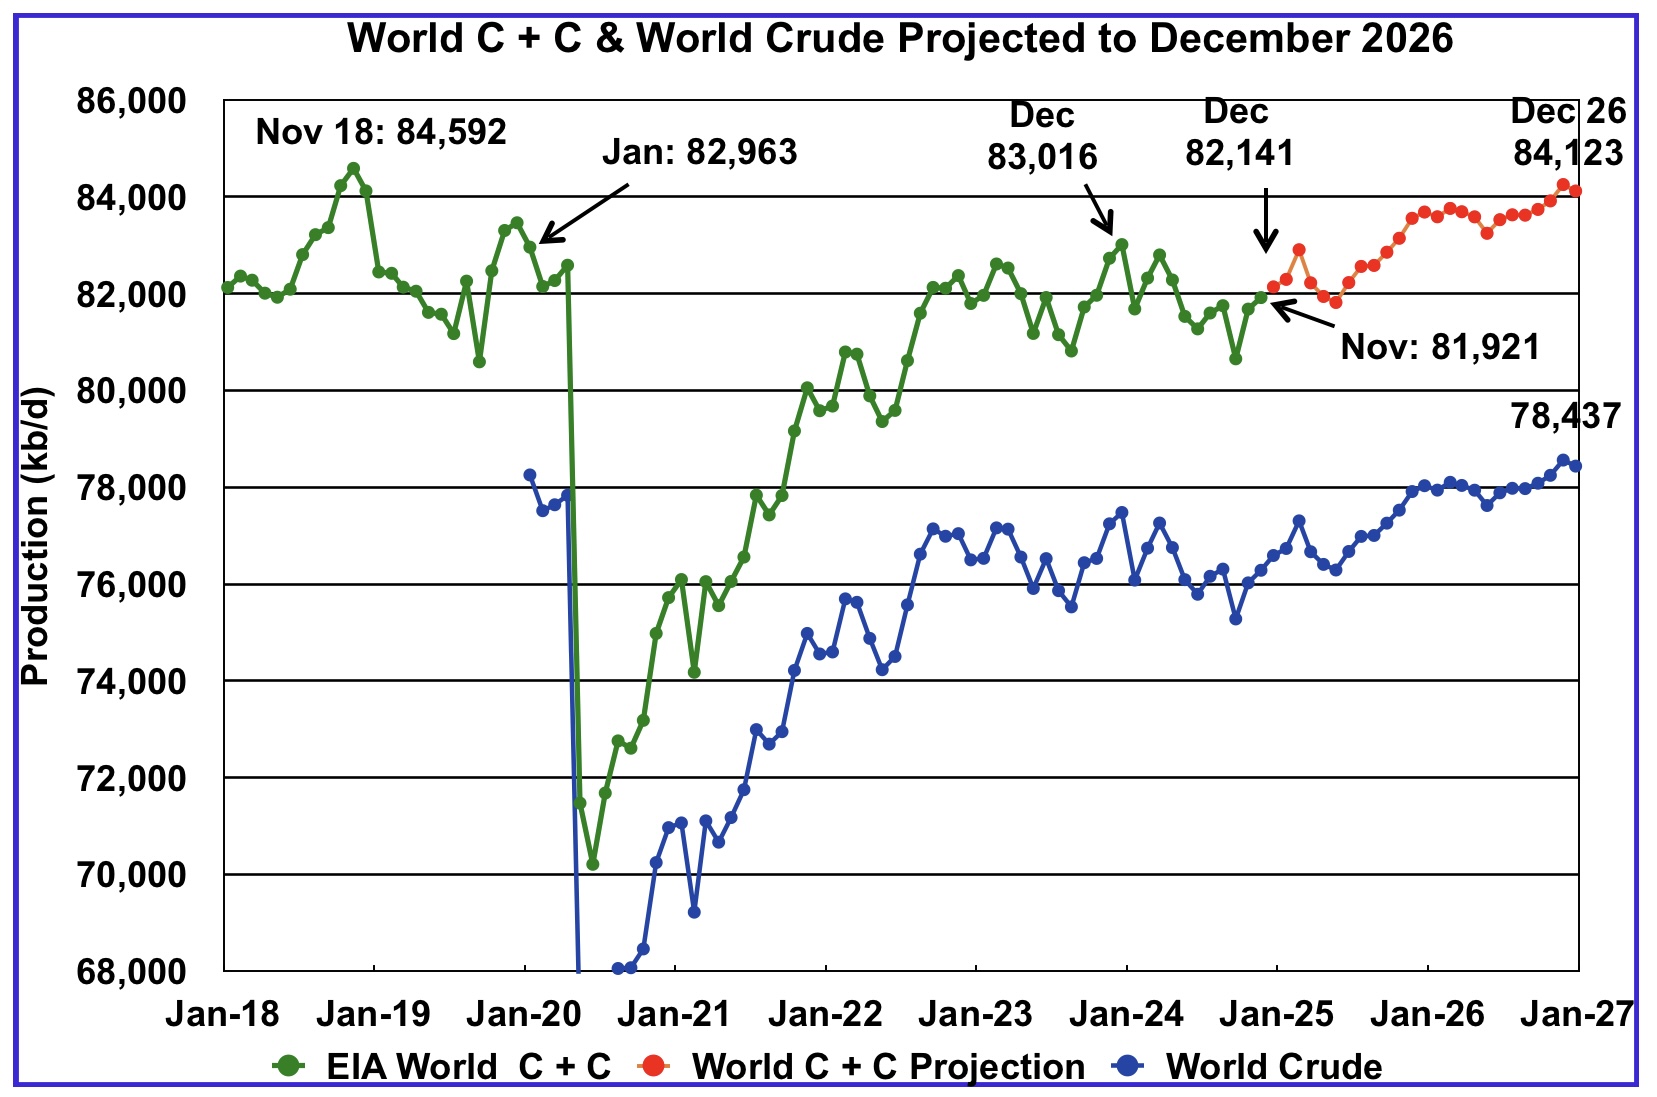
World oil production increased by 238 kb/d in November to 81,921 kb/d, green graph. The largest increases came from Libya, 110 kb/d and Kazakhstan, 164 kb/d. December’s World oil production is projected to increase by 220 kb/d to 82,141 kb/d.
This chart also projects World C + C production out to December 2026. It uses the March 2025 STEO report along with the International Energy Statistics to make the projection.
For December 2026, production is projected to be 84,123 kb/d. The December 2026 oil production is lower than the November 2018 peak by 469 kb/d. December 2026 production has been revised down by 383 kb/d from the previous report. December 2026 crude has been downwardly revised by 357 kb/d.
From December 2023 to December 2026, World oil production is estimated to increase by 1,107 kb/d.
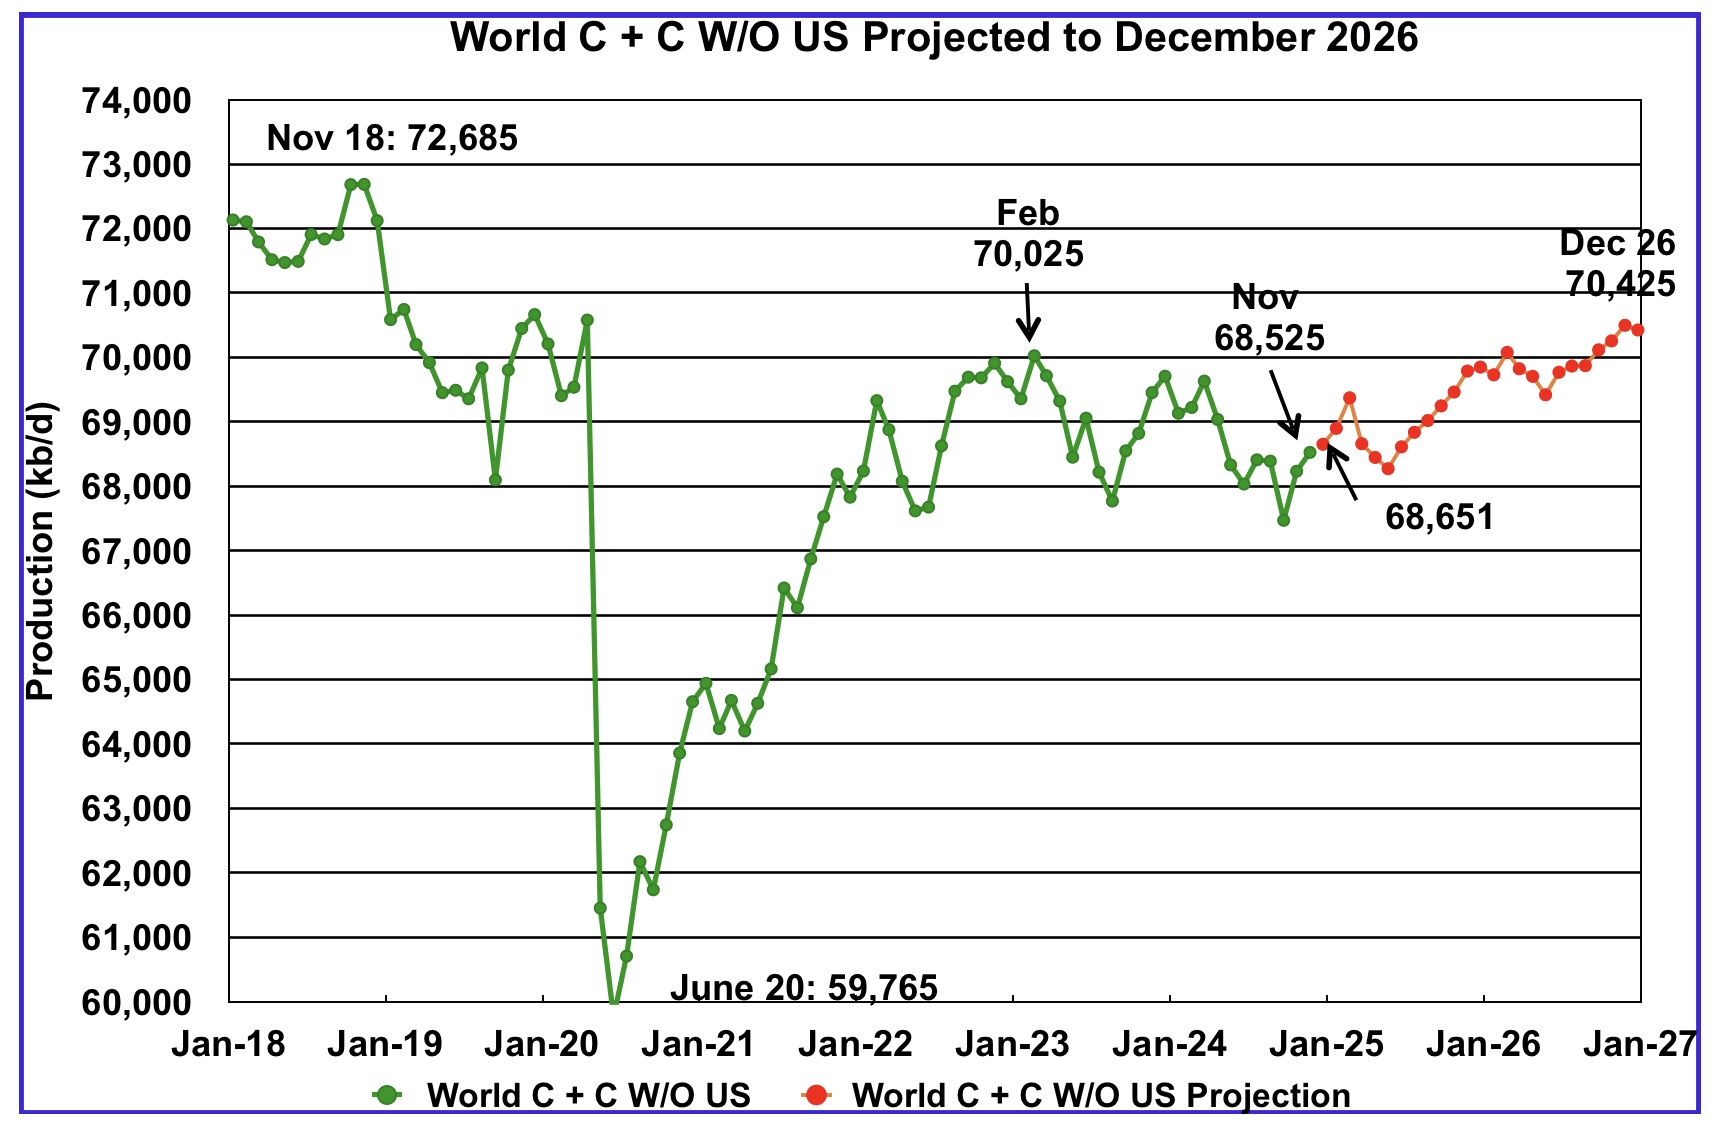
November World oil output without the US increased by 293 kb/d to 68,525 kb/d. December’s production is expected to increase by 126 kb/d to 68,651 kb/d.
The projection is forecasting that December 2026 crude output will be 70,425 kb/d. Note that the December 2026 output is 2,260 kb/d lower than the November 2018 peak of 72,685 kb/d.
World oil production W/O the U.S. from December 2024 to December 2026 is forecast to increase by a total of 1,874 kb/d.
A Different Perspective on World Oil Production
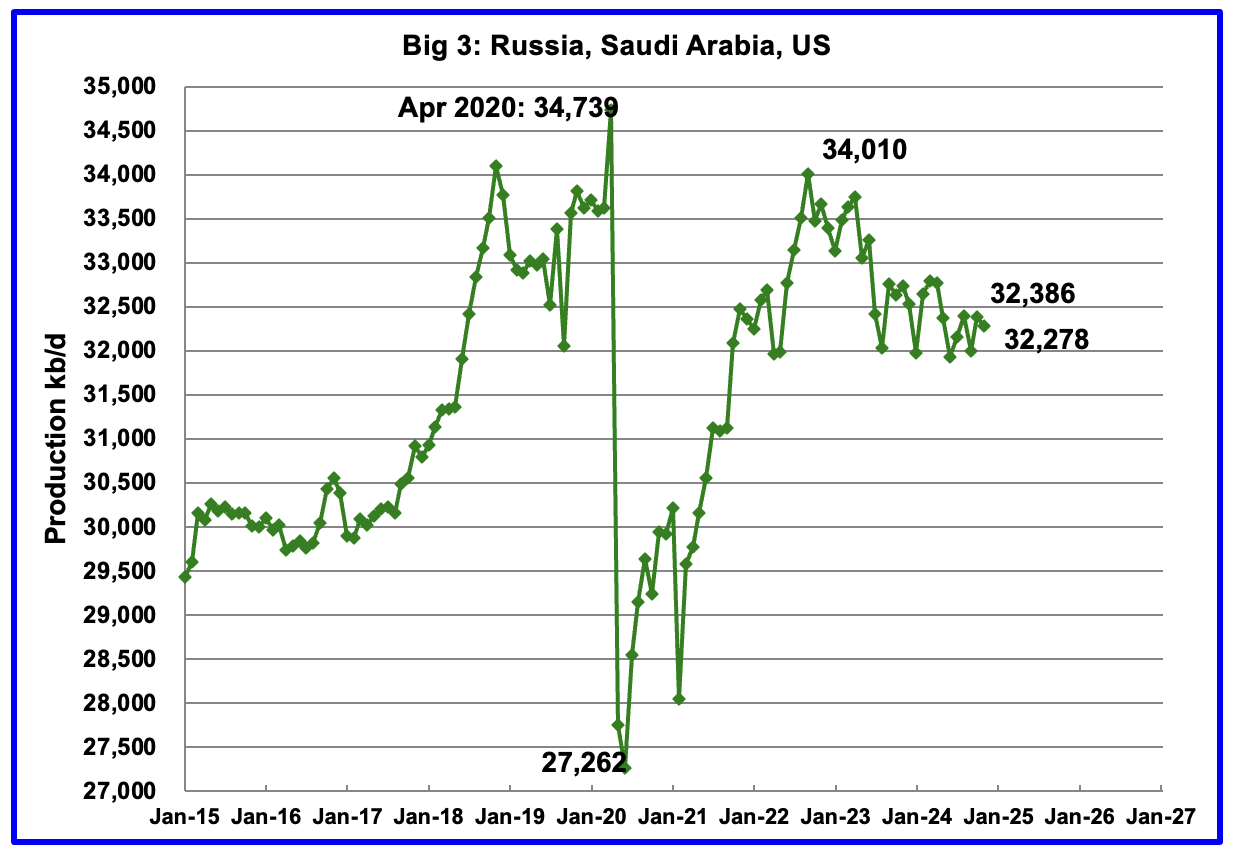
Peak production in the Big 3 occurred in April 2020 at a rate of 34,739 kb/d. The peak was associated with a large production increase from Saudi Arabia. Post covid, production peaked at 34,010 kb/d in September 2022. The production decline since then is primarily due to cutbacks by Saudi Arabia and Russia.
November’s Big 3 oil production decreased by 108 kb/d to 32,278 kb/d. Production in November was 1,732 kb/d lower than the September 2022 post pandemic high of 34,010 kb/d. Of the Big 3, the country with the largest December decrease was the U.S. with a decline of 122 kb/d, see Table below.
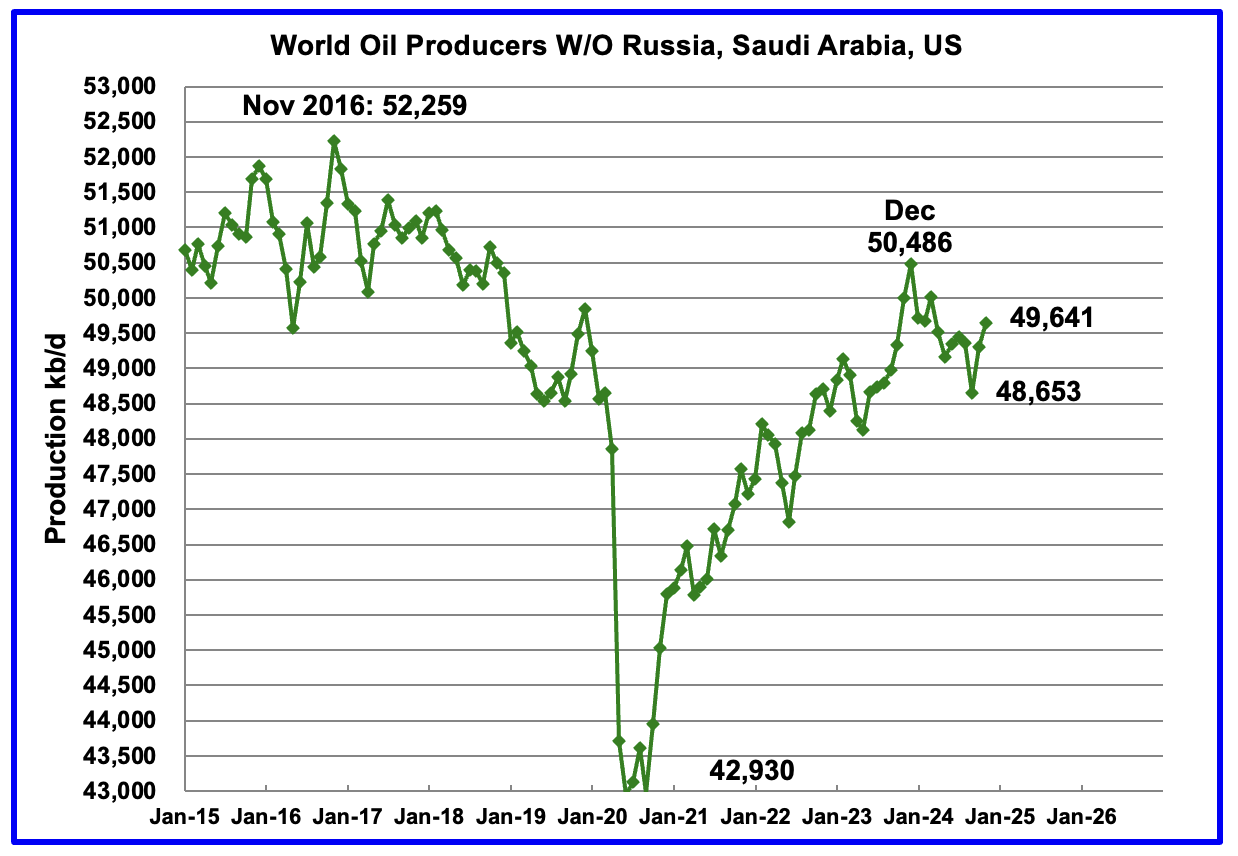
Production in the Remaining Countries had been slowly increasing since the September 2020 low of 42,930 kb/d. Output in December 2023 reached 50,486 kb/d, a new post covid high. However production began falling in January 2024 and been lower ever since. December’s production increased by 344 kb/d to 49,641 kb/d and is now 845 kb/d lower than December 2023.
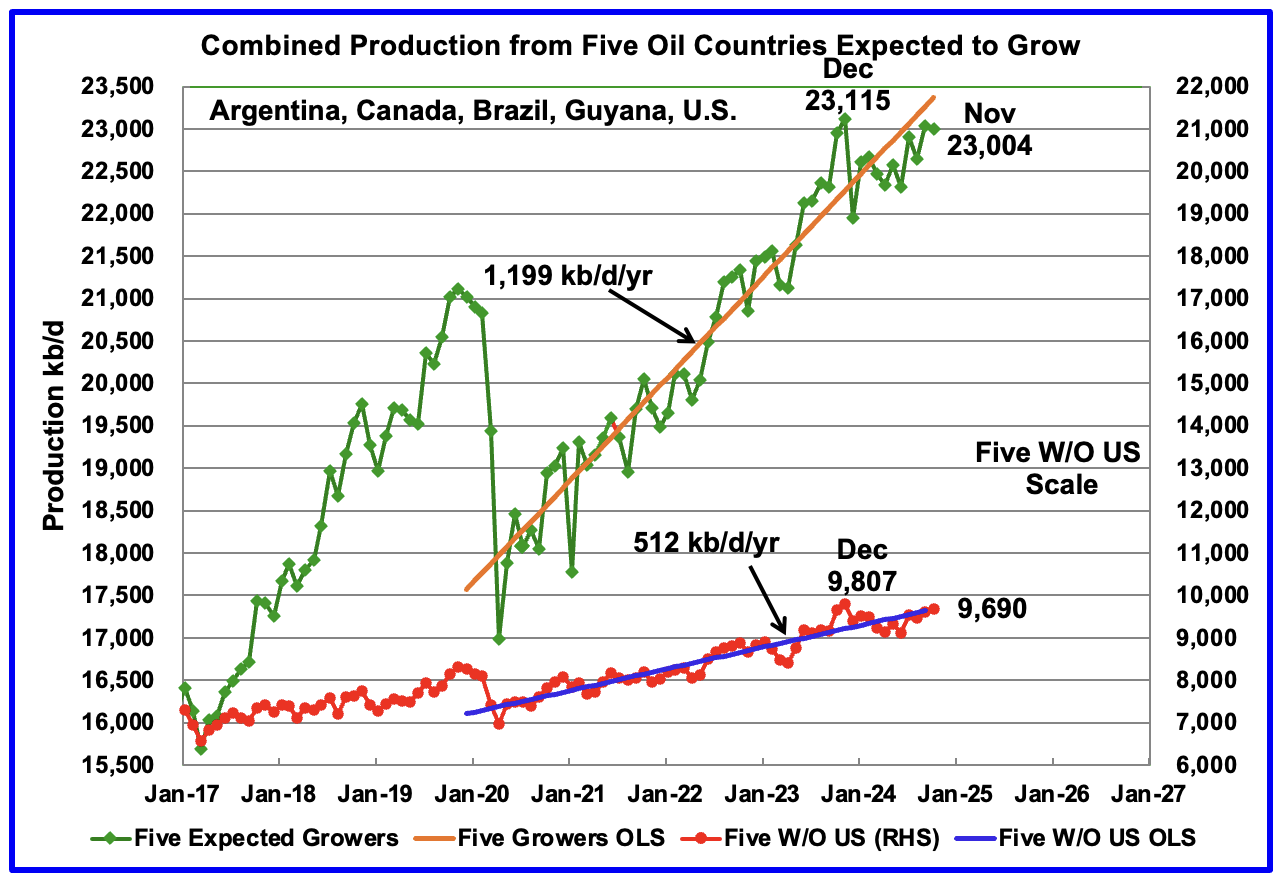
This chart was first posted a few of months back and shows the combined oil production from five Non-OPEC countries, Argentina, Brazil, Canada, Guyana and the U.S. whose oil production is expected to grow. These five countries are often cited by OPEC and the IEA for being capable of meeting the increasing World oil demand for next year while OPEC withholds its oil from the market. For these five countries, production from April 2020 to August 2024 rose at an average rate of 1,199 kb/d/year as shown by the orange OLS line.
To show the impact of US growth over the past 5 years, U.S. production was removed from the five countries and that graph is shown in red. The production growth slope for the remaining four countries has been reduced by 687 kb/d/yr to 512 kb/d/yr.
November production has been added to the five growers chart, down 34 kb/d to 23,004 kb/d. For the Five growers W/O U.S., November production rose by 89 kb/d to 9,690 kb/d.
The OLS lines have not been updated and will not be updated going forward unless there is a strong indication that production is rising.
Production up to December 2023 may be a situation where the past is not a good indicator of the future. In this case it may be more important to focus on what has happened to production after December 2023 rather than before.
Countries Ranked by Oil Production
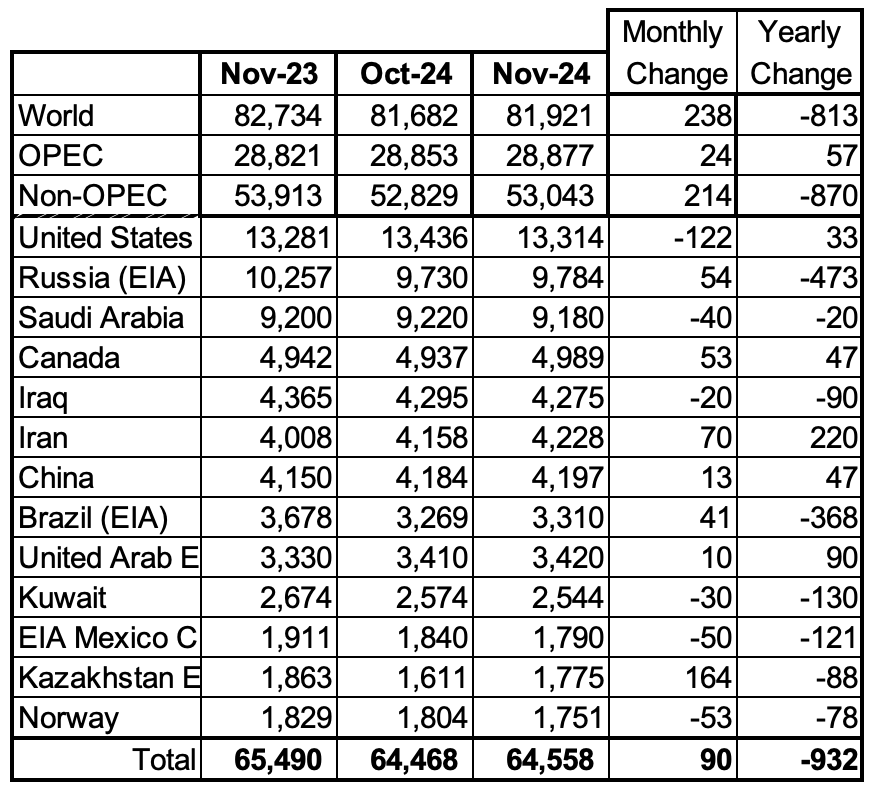
Above are listed the World’s 13th largest oil producing countries. In November 2024, these 13 countries produced 78.8% of the World’s oil. On a MoM basis, production increased by 900 kb/d in these 13 countries while on a YOY basis, production dropped by 932 kb/d. Note the large YoY production increase in Iran and the large drop in Brazil and Russia. Will the upcoming potentially stricter U.S. sanctions on Iran curb/slow that increasing trend?
November Non-OPEC Oil Production Charts
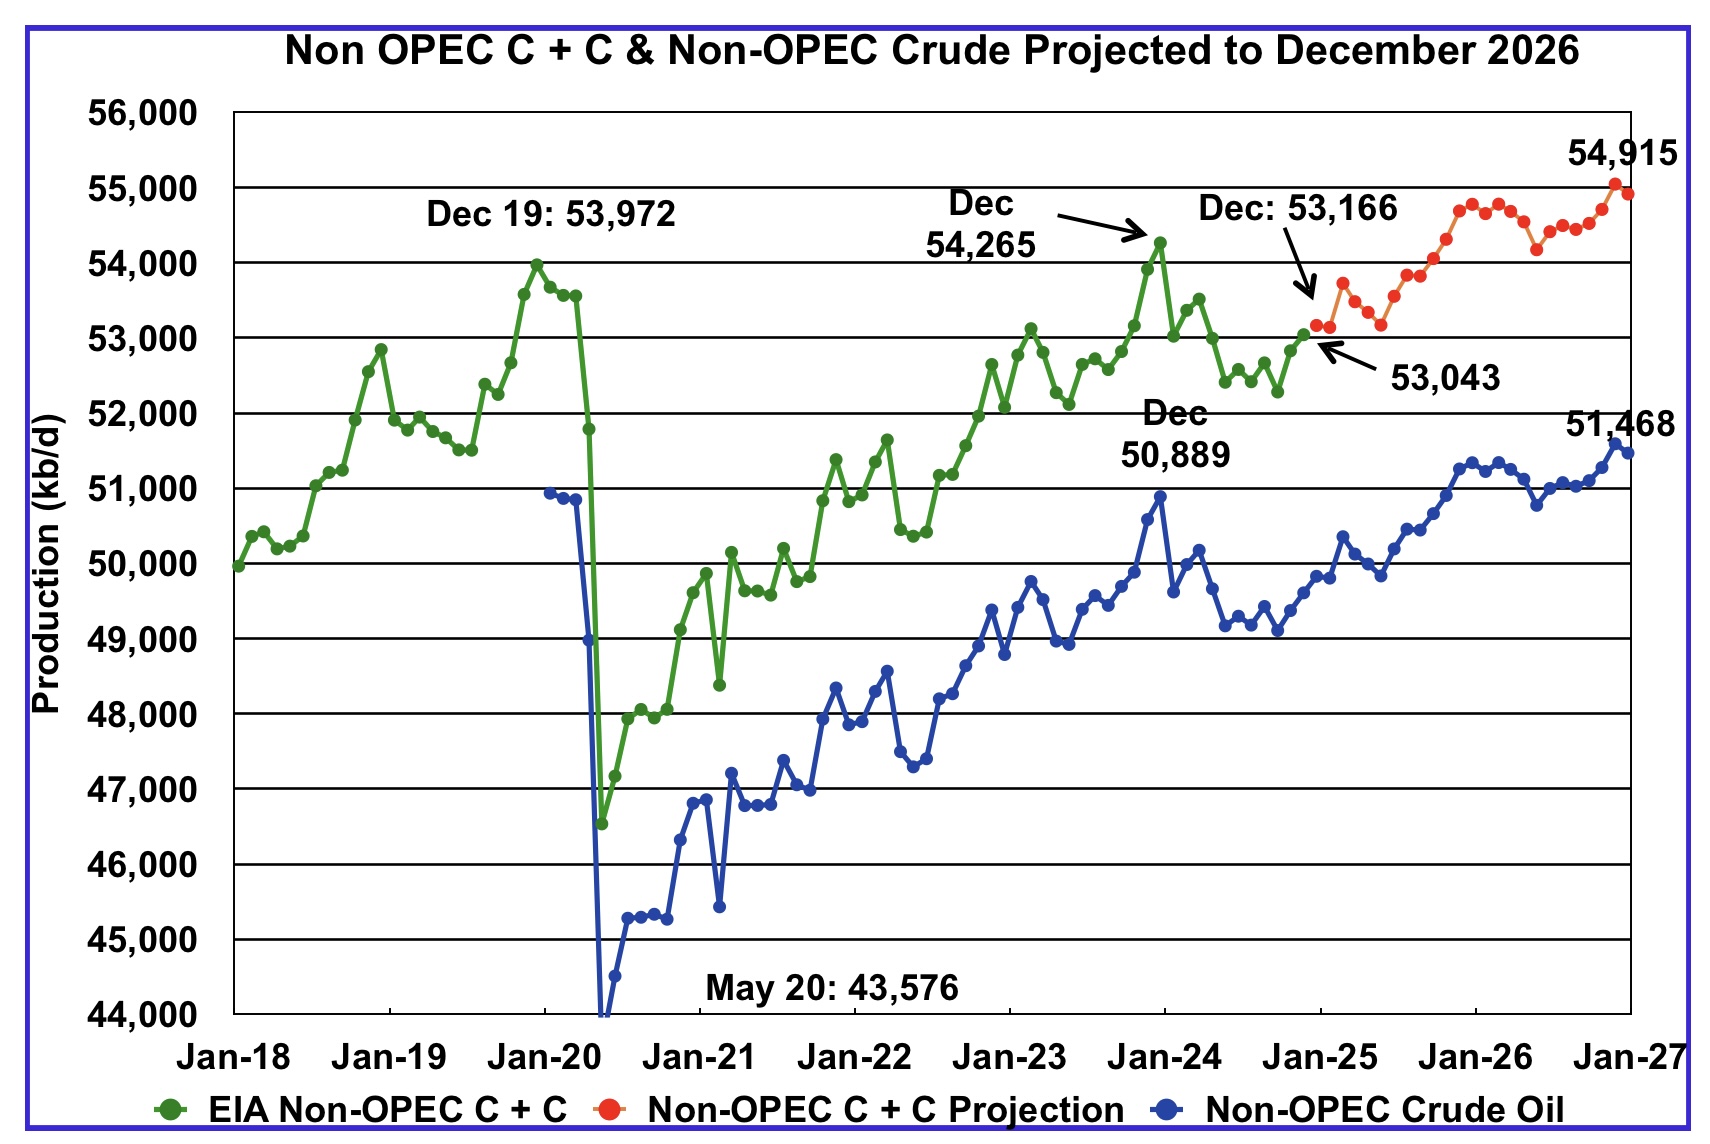
November Non-OPEC oil production increased by 214 kb/d to 53,043 kb/d.
Using data from the March 2025 STEO, a projection for Non-OPEC oil output was made for the period December 2024 to December 2026. (Red graph). Output is expected to reach 54,915 kb/d in December 2026.
From December 2023 to December 2026, oil production in Non-OPEC countries is expected to increase by 650 kb/d.
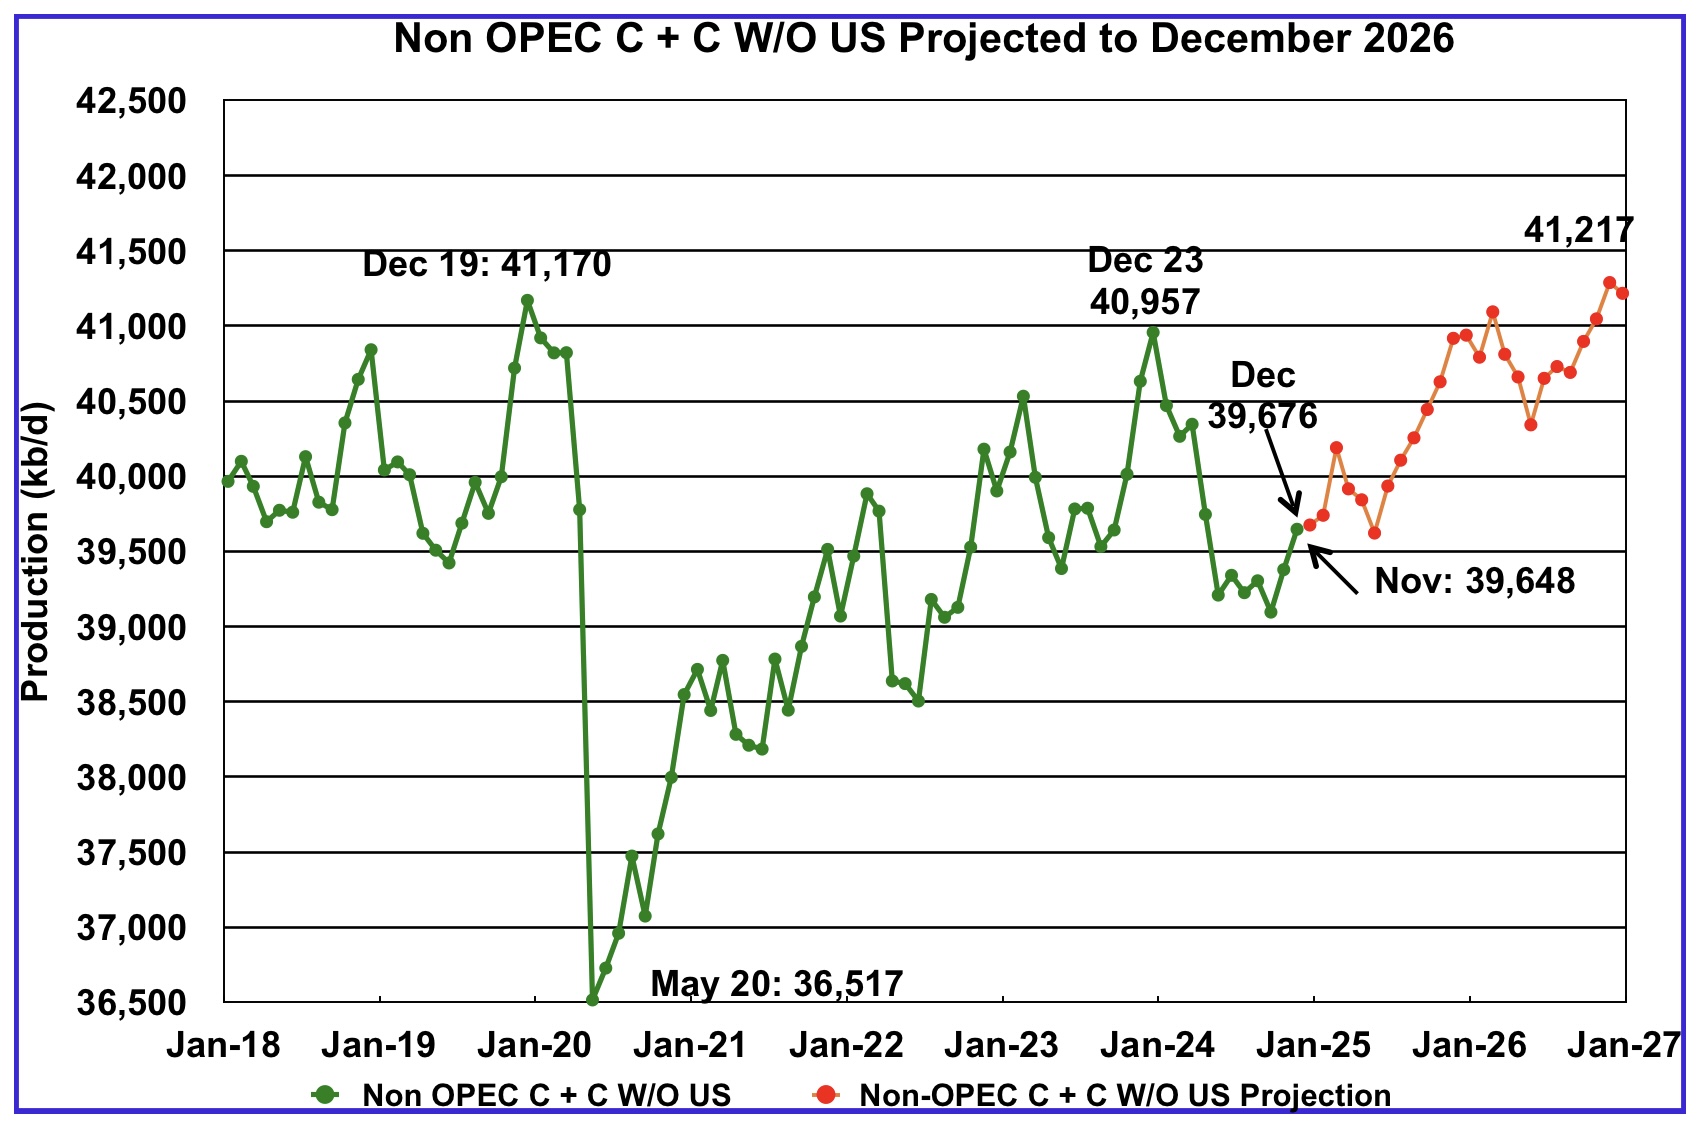
November’s Non-OPEC W/O US oil production rose by 336 kb/d to 39,648 kb/d. December’s production is projected to rise by 7 kb/d to 39,655 kb/d.
From December 2023 to December 2026, production in Non-OPEC countries W/O the U.S. is expected to increase by 260 kb/d or 87 kb/d/yr. December 2026 production is projected to be 47 kb/d higher than December 2019, essentially no growth over seven years.
Non-OPEC Oil Countries Ranked by Production
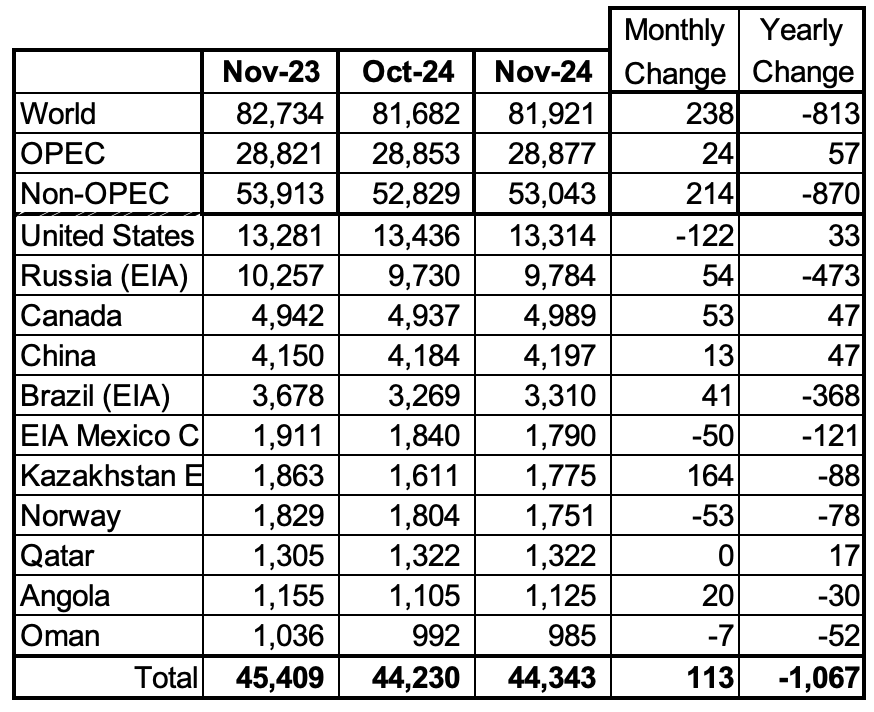
Listed above are the World’s 11 largest Non-OPEC producers. The original criteria for inclusion in the table was that all of the countries produced more than 1,000 kb/d. Oman has recently fallen below 1,000 kb/d.
November’s production increased by 113 kb/d to 44,343 kb/d for these eleven Non-OPEC countries while as a whole the Non-OPEC countries saw a yearly production loss of 870 kb/d to 53,043 kb/d.
In November 2024, these 11 countries produced 83.6% of all Non-OPEC oil.
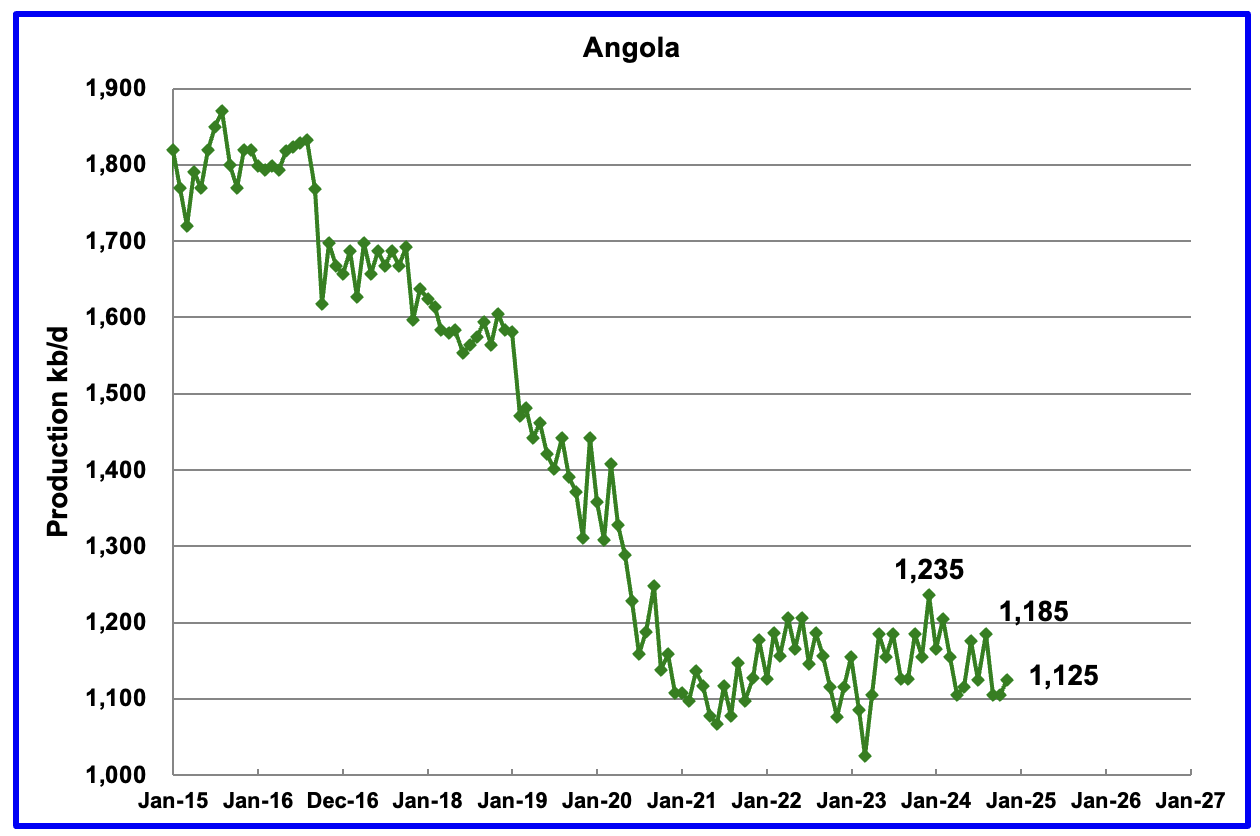
Angola’s November production rose by 20 kb/d to 1,125 kb/d. Since early 2022 Angola’s production appears to have settled into a plateau phase between 1,100 kb/d and 1,200 kb/d.
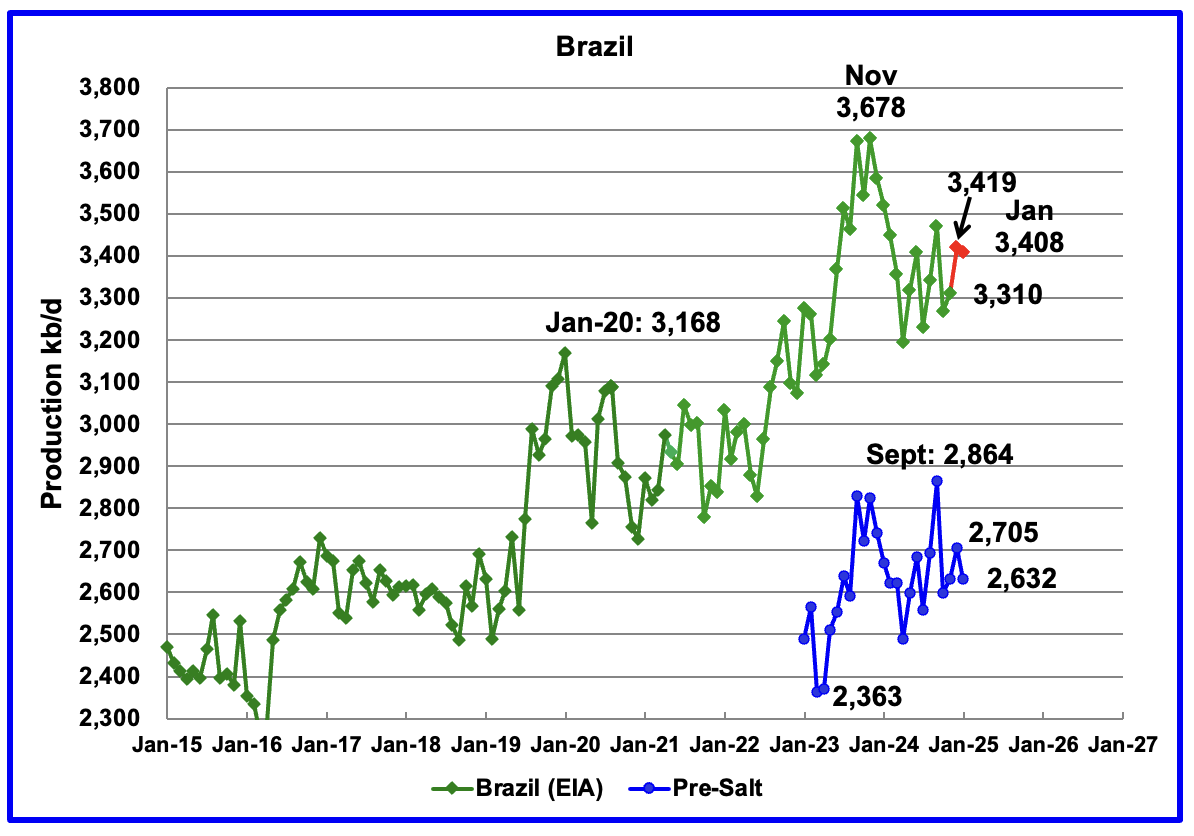
The EIA reported that Brazil’s November production increased by 41 kb/d to 3,310 kb/d.
Brazil’s National Petroleum Association (BNPA) reported that production increased in December and dropped in January to 3,408 kb/d The pre-salt graph tracks Brazil’s trend in the crude oil graph. For December, pre-salt production increased by 74 kb/d to 2,705 kb/d and dropped to 2,632 kb/d in January.
The December increase could be related to the addition of the two new floating platforms. The December OPEC report states that two new floating production storage and offloading (FPSO) platforms came online in November. It also mentions operational issues and slow ramp-ups in several offshore platforms continue to be an issue.
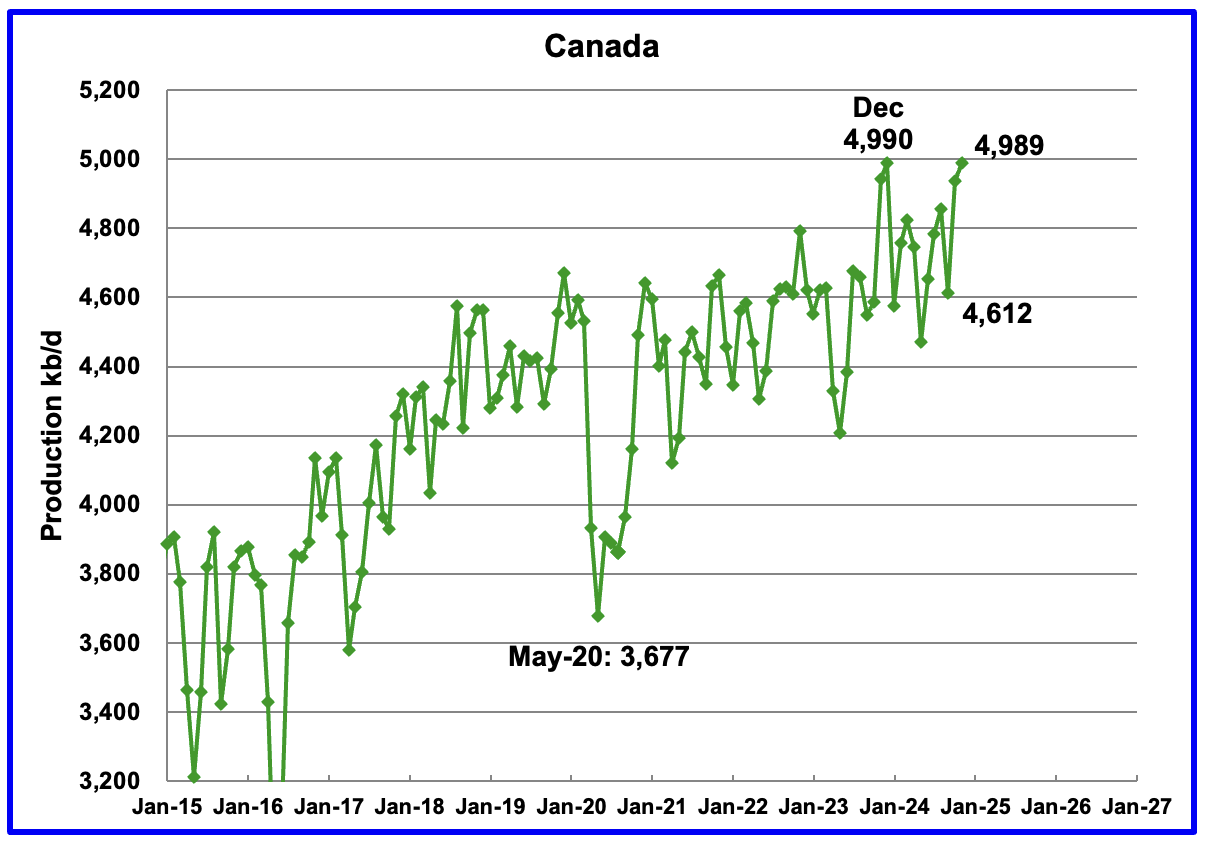
Canada’s production increased by 53 kb/d in November to 4,989 kb/d. The increase is primarily due to site restarts associated with the previous month’s wild fires in the oil sands area around Fort McMurray and the completion of maintenance on oil sands cokers.
With tariffs looming, Canada is now grappling with the effects of having to ship 75% of its oil to the US. Canada has woken up to the risks associated with becoming too close/dependant to a trading neighbour. At this time the anticipated tariff on oil is 10%.
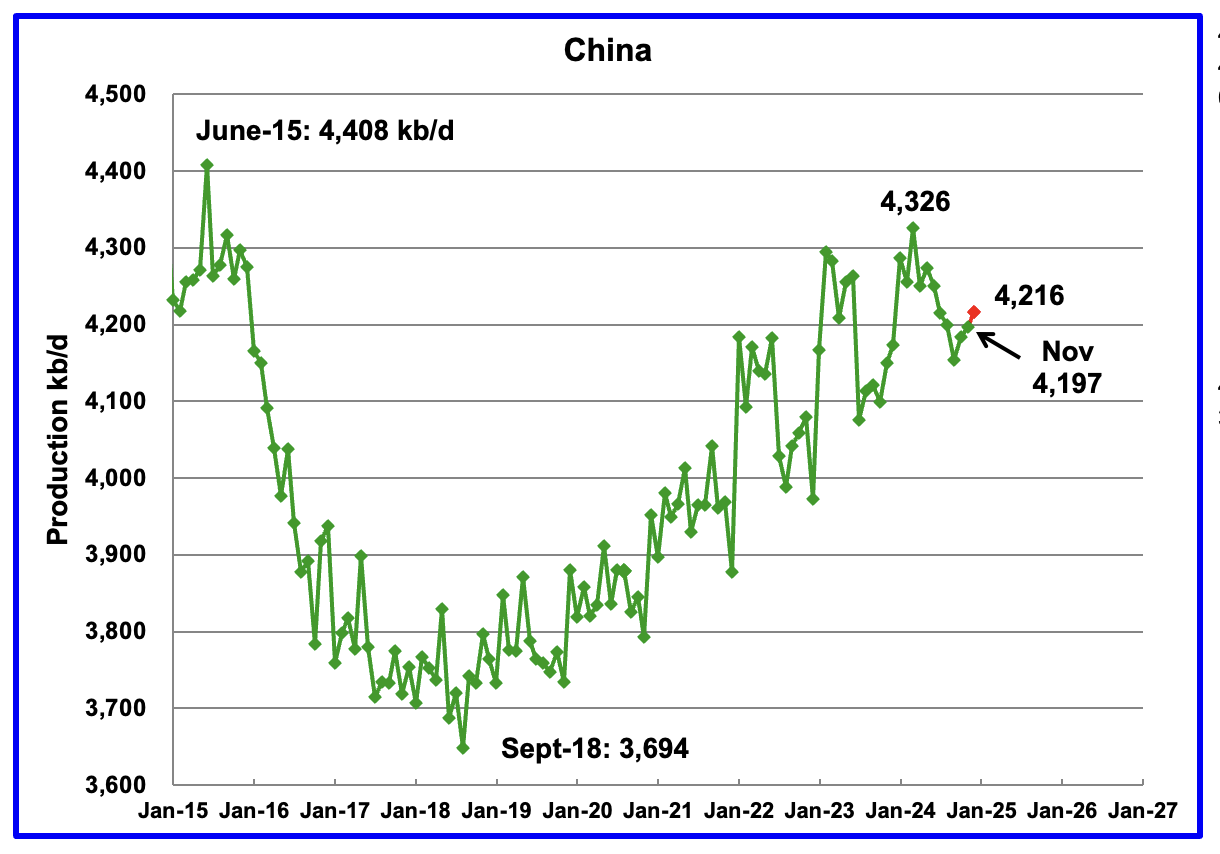
The EIA reported China’s November oil output increased by 13 kb/d to 4,197 kb/d.
The China National Bureau of Statistics reported production for December. December production added 19 kb/d to 4,216 kb/d, red markers.
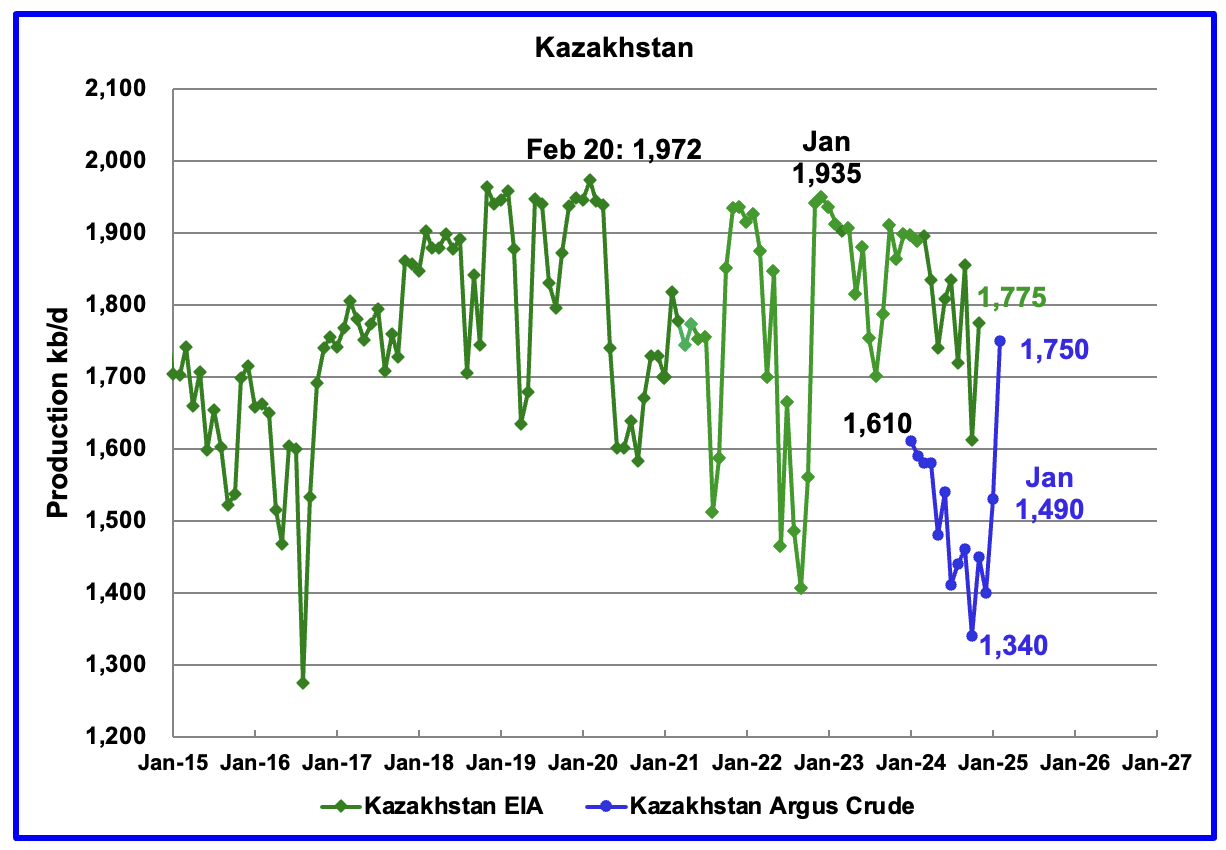
According to the EIA, Kazakhstan’s oil output increased by 164 kb/d in November to 1,775 kb/d.
Kazakhstan’s recent pre-salt crude oil production, as reported by Argus, has been added to the chart. In October pre-salt crude production dropped by 120 kb/d to a low 1,340 kb/d. Since then production has risen by 410 kb/d. February production came in at 1,750 kb/d due to a New Field coming online. Note this is Crude whereas the EIA numbers are C + C.
Kazakhstan’s OPEC crude production target is 1,470 kb/d. At 1,750 kb/d, Kazakhstan is 280 kb/d over their target. According to this Article, Kazakhstan seeks Tengiz and Kashagan output cuts from its international operators.
“Increased output from the Tengiz field helped boost Kazakhstan’s production by 297,000 b/d to a record 1.747mn b/d in February, 279,000 b/d above its Opec+ target of 1.468mn b/d. Kazakhstan’s March target of 1.45mn b/d includes an additional 18,000 b/d cut related to its plan to compensate for past overproduction.
The Chevron-led Tengizchevroil consortium launched a third crude production plant at the field in January. This helped boost Tengiz production to 878,000 b/d in February, compared with about 500,000 b/d in mid-January — although part of the increase is explained by the completion of maintenance at another crude unit at Tengiz.”
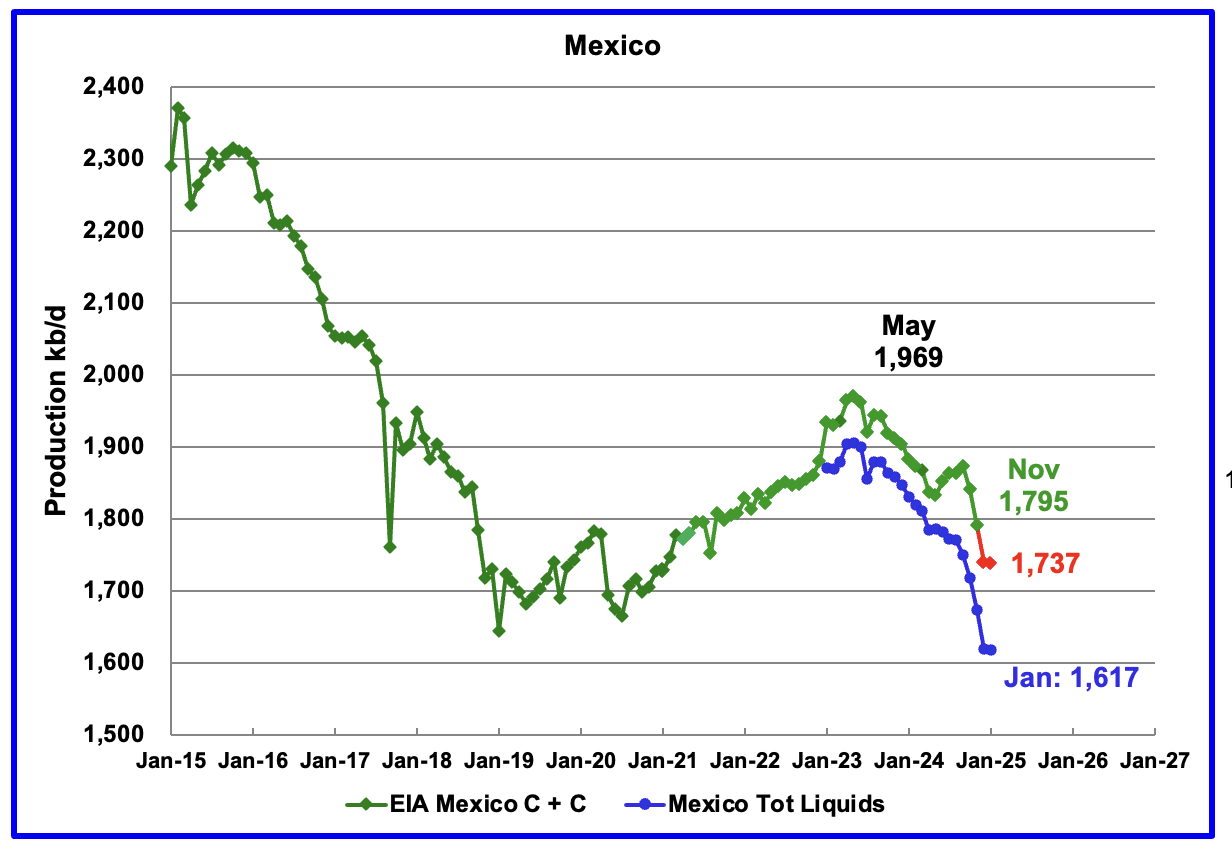
According to the EIA, Mexico’s November output dropped by 45 kb/d to at 1,795 kb/d.
In June 2024, Pemex issued a new and modified oil production report for Heavy, Light and Extra Light oil. It is shown in blue in the chart and it appears that Mexico is not reporting condensate production when compared to the EIA report.
In earlier reports, the EIA would add close to 55 kb/d of condensate to the Pemex report. However for October and November it was increased to 122 kb/d and 117 kb/d respectively. It is not clear if this is the result of better communications with Pemex officials. The condensate addition has been bouncing around 120 kb/d over the last few months.
For December and January production, 120 kb/d have been added to the Pemex production to estimate Mexico’s December and January C + C production, red markers. Note that Mexico’s production, according to Pemex, has continued to fall every month since May 2023, except for one month. However January oil production is little changed from December.
According to this Article, the decline in Mexico’s crude and gas production could accelerate.
“The decline is beyond Pemex control now,” said Alma América Porres Luna, an independent analyst who formerly served as commissioner at the National Hydrocarbons Commission, or CNH, the country’s upstream oil and gas regulator.
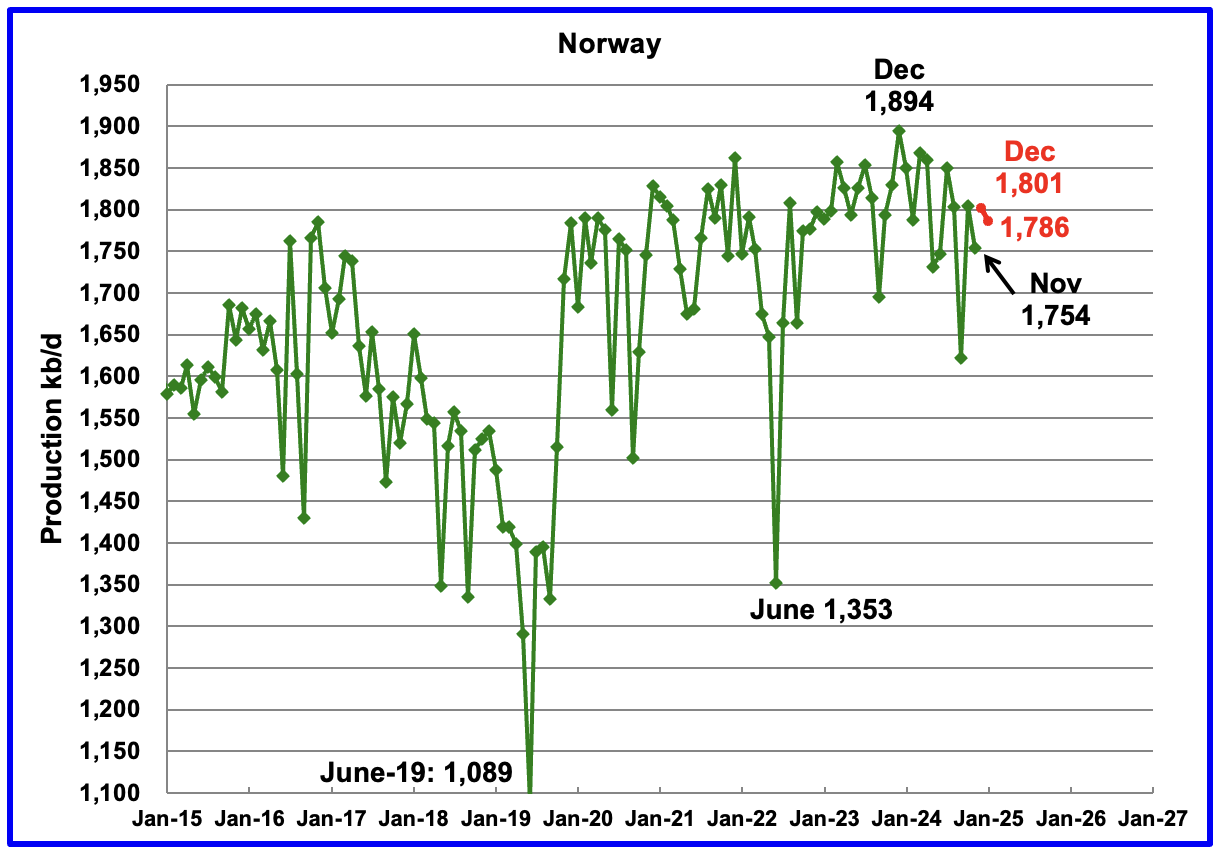
The EIA reported Norway’s November production dropped by 45 kb/d to 1,754 kb/d.
Separately, the Norway Petroleum Directorate (NPD) reported that December production increased by 47 kb/d to 1,801 kb/d and January dropped to 1,786 kb/d, red markers.
The Norway Petroleum Directorship reported that January’s oil production was 2.6% above forecast.
The OPEC February MOMR has this to say for Norway’s 2025 and 2026 oil production. A small production increase for 2025 and then flat. Note this is all liquids.
In 2025, Norwegian liquids production is forecast to grow by 0.1 mb/d to average 2.1 mb/d. Several small-to-large-scale projects are scheduled to ramp up, including Kristin, Eldfisk and Balder/Ringhorne. At the same time, start-ups are expected at the Balder/Ringhome, Norne floating, production, storage and offloading (FPSO), Maria and Kvitebjorn oil field projects. Norway’s Var Energi recently announced the start-up of its Balder X oil project in the North Sea for 2Q25. According to Equinor, the Johan Castberg FPSO is expected to produce the first oil in Norway’s Barents Sea in January or February, after being delayed by bad weather conditions. According to Statistics Norway, total oil and gas investment on the Norwegian continental shelf for 2025 is forecast to rise by about 3%, y-o-y, supporting expected growth this year.
Norwegian liquids production is forecast to drop by about 40 tb/d to average 2.1 mb/d in 2026. Some projects at different scales are scheduled to ramp up in 2026, such as Johan Castberg, Edvard Grieg, Balder/Ringhorne, Heidrun, Grane, Valhall and Ivar Aasen. Simultaneously, start-ups are expected at limited assets, such as the Symra and Edvard Grieg oil field projects.
Comparing the chart with the OPEC statement, it appears that the December 2023 output of 1,894 kb/d is the peak for Norway’s oil production. That peak was associated with the Johan Sverdrup 2 coming online a year before. S & P Global reports that Johan Sverdrup oil field is expected to start declining from late-2024/early-2025.
“Europe’s highest producing oil field, Johan Sverdrup, is expected to start declining in late-2024 or early-2025 — earlier than expected — amid increased signs of water production at some wells”
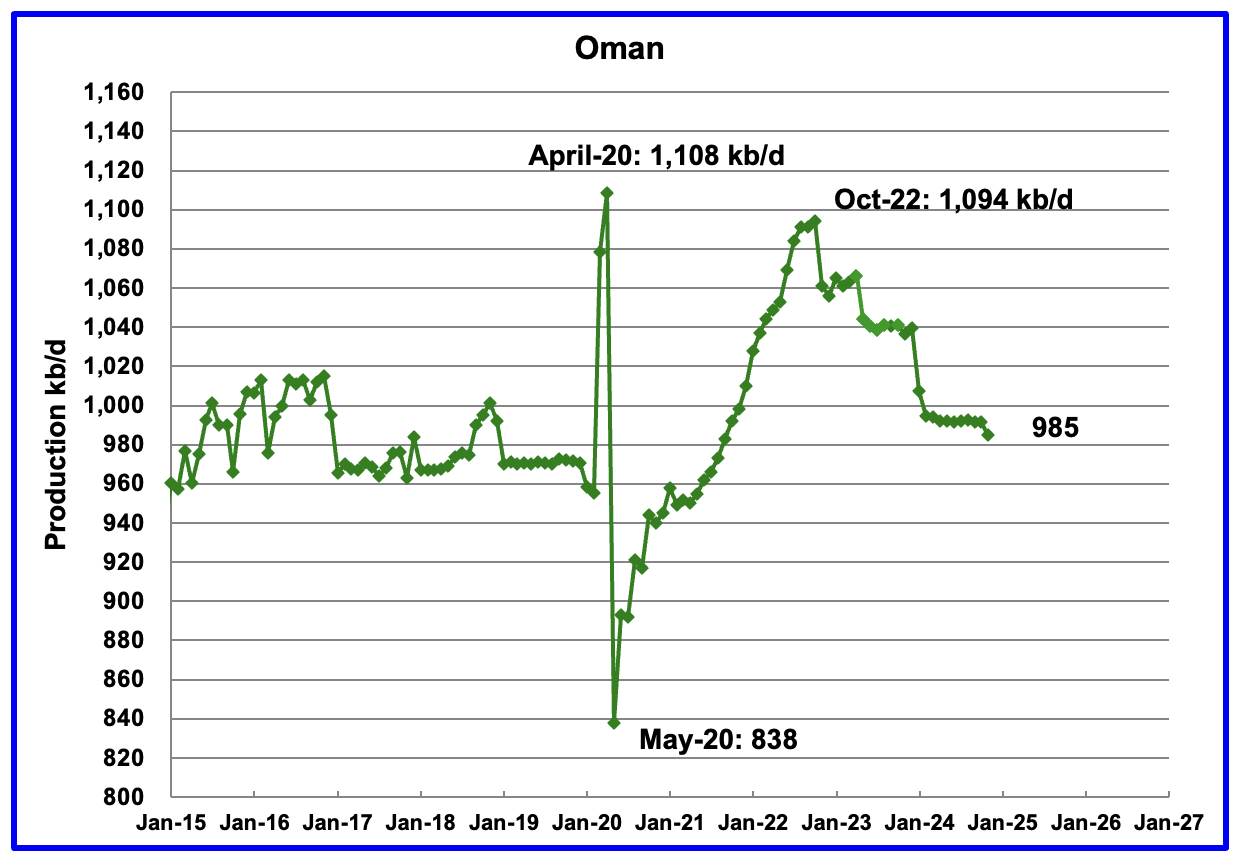
Oman’s production had risen very consistently since the low of May 2020. However production began to drop in November 2022. According to the EIA, November’s output dropped by 7 kb/d to 985 kb/d.
Oman produces a lot of condensate. The OPEC MOMR reports that crude production in November was 764 kb/d, 228 kb/d lower than the EIA’s C + C.
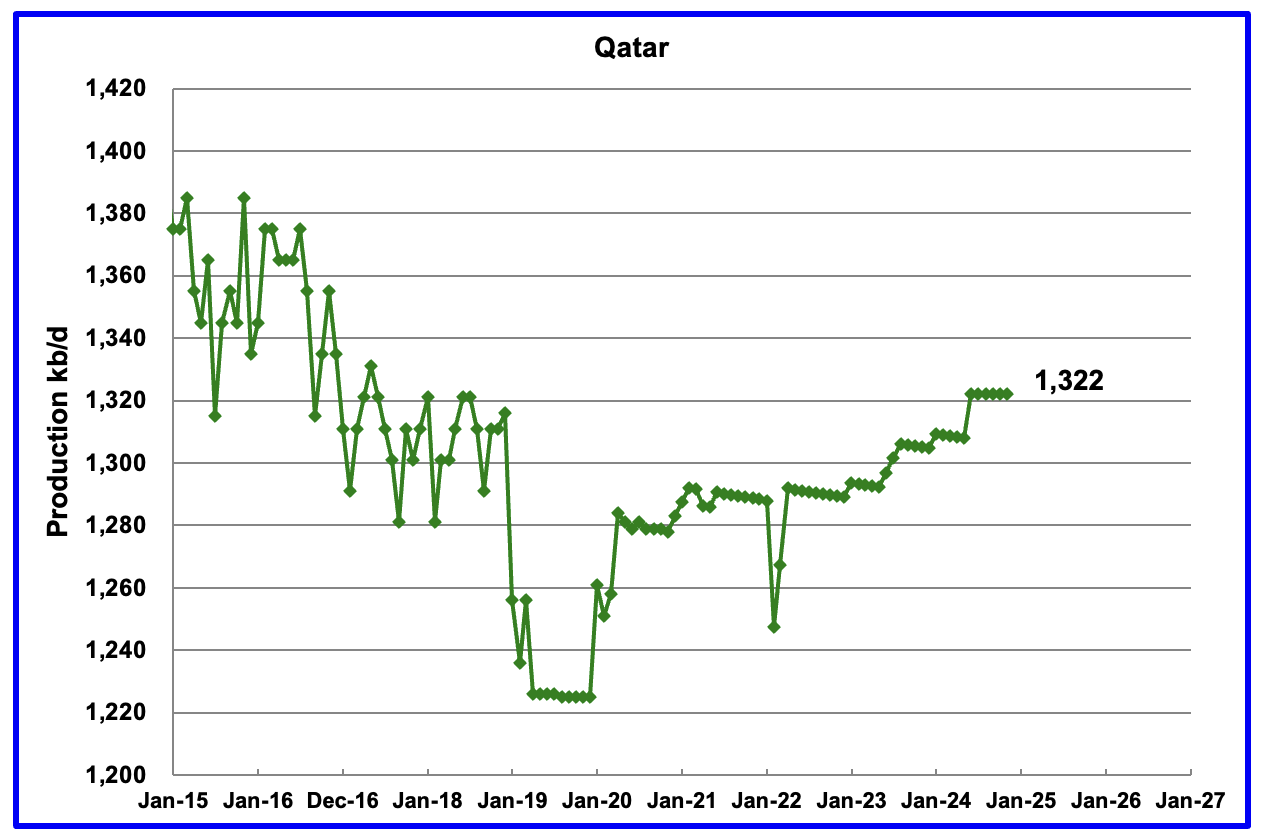
The EIA had been reporting flat output of 1,322 kb/d for Qatar since early 2022. However the current November update has revised down all of the previous production data. Qatar’s November output was reported again to be 1,322 kb/d.
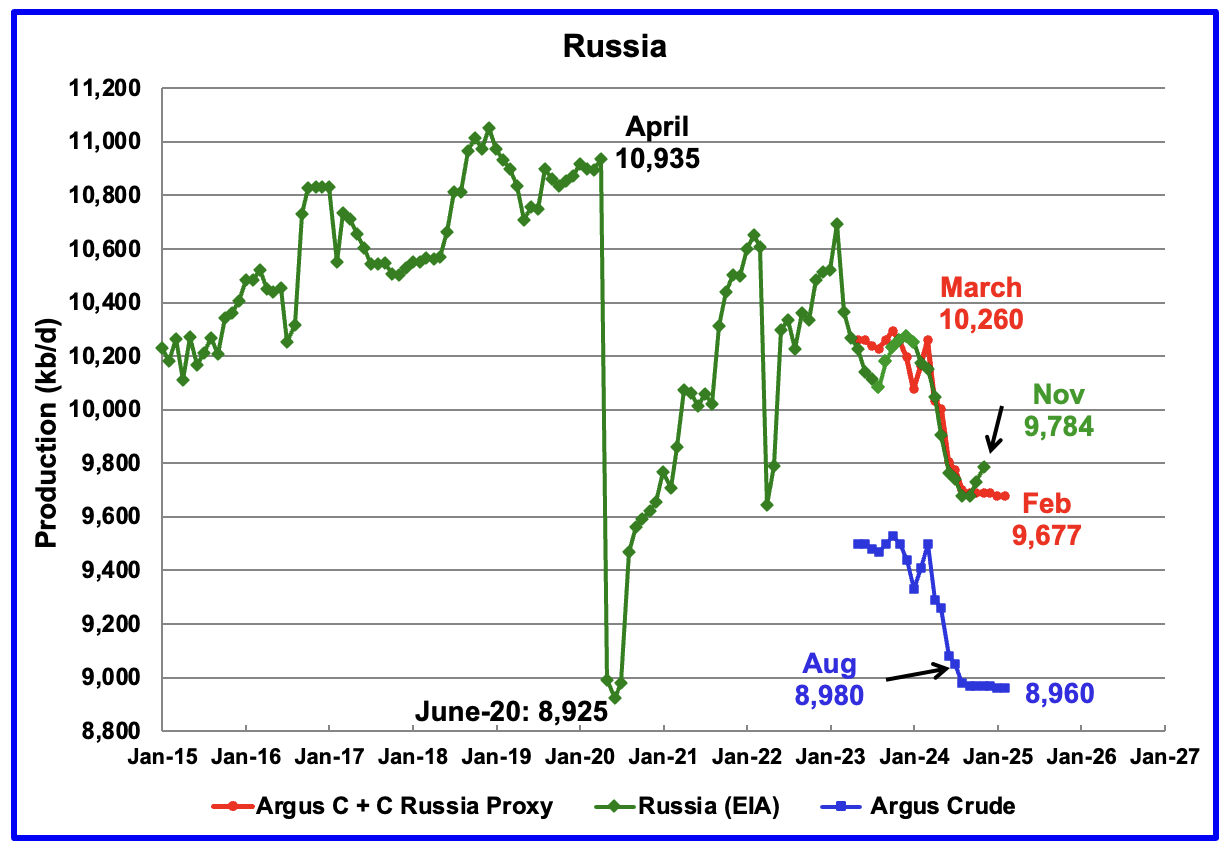
The EIA reported Russia’s November C + C production rose by 54 kb/d to 9,784 kb/d and was down 476 kb/d from March 2024. It is also 96 kb/d higher than the Argus Russia proxy estimate of 9,688 kb/d for November. OPEC reports that Russian crude production in November was 9,010 kb/d.
Using data from Argus Media reports, Russian crude production is shown from May 2023 to January 2025. For February 2025, Argus reported Russian crude production was 8,960 kb/d, unchanged from January, blue markers. Adding 8% to Argus’ February’s crude production provides a C + C production estimate of 9,677 kb/d for Russia, which is a proxy for the Pre-War Russian Ministry estimate, red markers.
According to Argus, Russian crude production of 8,960 kb/d is in compliance with their OPEC target of 8,980 kb/d because it is 20 kb/d lower.
In pre-war times, the Russia Energy Ministry production estimate used to be 400 kb/d higher than the EIA estimate. For November, the EIA’s C + C estimate of 9,784 kb/d is 96 kb/d higher than the Argus proxy estimate of 9,677 kb/d.
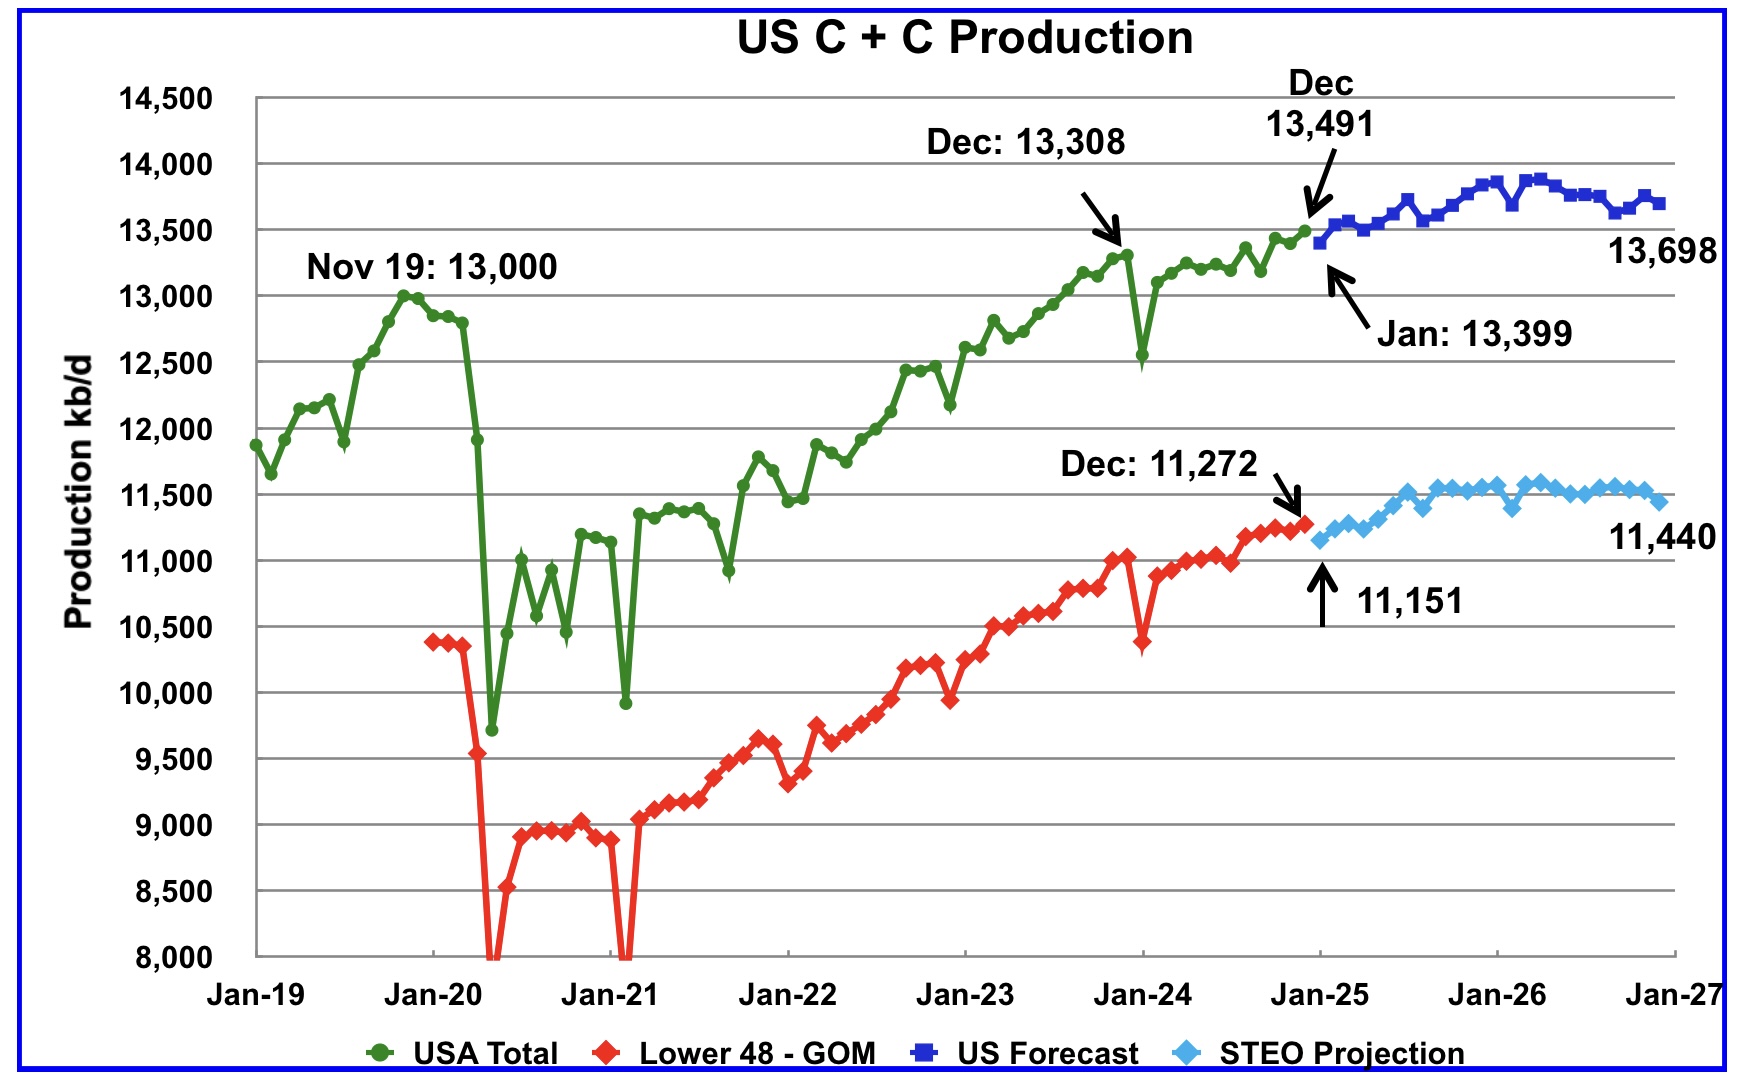
This US production chart is very similar to the one published last week in the US update post. The STEO portions of the two graphs have been updated using the March 2025 STEO.
Production in December 2026 is 41 kb/d higher than reported in the previous post. For the onshore L48, oil production falls off in the latter half of 2026 to 11,440 kb/d and is 74 kb/d higher than in the previous post.
Thank you again OVI. It appears that the November 2018 high remains the permanent high.
Seppo,
If we focus on the 12 month average peak (around 83 Mb/d in 2018), the Feb STEO had that being surpassed in 2025, I have not yet done the estimate for the March STEO (my method is slightly different than Ovi’s and he doesn’t give us the 12 month average), but it looks like for Ovi’s estimate for the March STEO that there will be a new peak (83.5 Mb/d) by 2026 (if the STEO is accurate). My guess is that the STEO may be too optimistic, but I do have a new 12 month peak at 83.1 Mb/d in 2026 with that peak surpassed in both 2027 and 2028 and a final 12 month average peak of 83.7 Mb/d in 2028 (no doubt that my guess will prove incorrect.)
Seppo
Thanks.
I think it will be very difficult to exceed the November 2018 high. Possibly more than likely from lower demand.
Great job Ovi, thank you for this report.
Dennis
Thanks. Did you get my email?
Yes. I got it.
Brazil crude production did not grow in the last 12 months. See graph “Histórico de produção de petróleo” on page 6 in the January 2025 monthly report
https://www.gov.br/anp/pt-br/centrais-de-conteudo/publicacoes/boletins-anp/boletins/arquivos-bmppgn/2025/janeiro.pdf
Again I refer to my post:
US shale oil seems to cover up peaking crude oil production in the rest
of the world since 2018
4 Mar 2024
https://crudeoilpeak.info/us-shale-oil-seems-to-cover-up-peaking-crude-oil-production-in-the-rest-of-the-world-since-2018
Thanks Ovi (and Dennis), nice work with the detailed posts.
Matt – Yes, it is especially apparent with the significant increase in lighter end components that are getting lumped into the C+C category, I believe there’s been almost 10% of C+C that is from a group of light end chemicals (ethane and LNG). This is in stark contrast to 20 years ago. Will this trend continue? I’m curious to group world production in two categories, 1) countries that have increased production during recent high price periods, and 2) those that have not. I think this might help to show decline that is driven by natural decline and decline that is not (economically sensitive), imagine it’s a small group that is not in natural decline (maybe 5-10 countries?).
Gas liquids are usually shown separately in statistics and are not included in C&C
On question 1 see Fig 6 in above post
On question 2 see Fig 4 in above post
Kengeo,
NGL (which is primarily propane, ethane, butane, and isomers) is not included in C plus C.
Matt,
That is correct and the reason why I expect World C plus C may peak when US tight oil peaks in 2027 or 2028. It is also the reason I follow tight oil output closely.
Trump’s trade wars will mean that global economic activities will be dampened and therefore oil production and oil prices.
I’m not sure that’s the case, I’d say it’s more of an indirect effect. If investment is too low then there could be some impact. High interest rates and jobs play a larger role in oil production than the tariffs. At a glance, it looks like the tariffs will essentially be a tax on the average American family of $10,000 over 10 years, with major negative impact to jobs/industry in Canada and Mexico. There could be some benefits to Americans if job/industry growth shifts to the US. Energy (from Canada) and food/cars (from Mexico) likely being most heavily impacted. It’s interesting that Trump is a big fan of Elon Musk who is not a supporter of tariffs or any other trade relations that cause market disruption/distortion…I wonder if Musk will eventually convince Trump to abandon the tariff nonsense…
Kengeo,
Free trade benefits the US, tariffs by the US will be matched by other nations, this type of behavior in the late nineteenth and early 20th century led to two World Wars, cooperation and trade allowed the World to avoid World War 3. The tariffs will be of no benefit to anyone and are much more likely to lead to harm than benefit. Also the chaos and uncertainty by Trumps on again off again policies will lead to low business investment in general, in addition Trump’s tendency to flout the rule of law will not be seen as positive by the business community, the ethics wing of the Justice department has been decimated by Trump and now “ethics” will be monitored by political hacks loyal to Trump.
It is a sad period for representative democracy and the rule of law in the US.
I think Matt has this right, a Worldwide recession and lower demand for oil seems likely, but perhaps not enough to prevent a new peak eventually. Much depends on whether Trump recognizes his errors, this seems unlikely, the man seems delusional and there are no longer any adults in the room. Musk is a chump and a con man much like Trump himself.
Trump’s goal is to attract companies to the US: He was to make it more attractive to produce right in the country. Therefore all that trade war. Will it work? I don’t know. But if it works, the use of coal and oil will go up significantly in the US, which will lead to significantly more oil imports. This could become the tricky part.
Westtexasfanclub,
No it won’t work. US exports will take a hit as other nations also impose retaliatory tariffs. Generally what happens is everyone becomes worse off. Simple example, nation A can make very nice wine for $10/bottle, in nation B they can make an equivalent quality wine for $20/bottle. Nation B can make shirts for $10/shirt, while in nation A it costs $20/shirt. Trading wine and shirts makes more sense than protecting the wine industry in nation B by erecting a wine tariff wall and in nation A by erecting short tariff wall. Should the tariff walls be imposed by both nations their citizens will be poorer as a result. This is very basic international economics that even a chump like Trump should understand.
Trump was sleeping in economics class and must have paid someone to take his exams.
Dennis
T’s tariffs on Canada have two objectives. The first is to increase revenue into the US treasury. Canada buys more from the US than any other country. The biggest source of tariff income for the US would be to impose tariffs on Canada to help offset his tax reduction for the rich. His second objective is to wage economic warfare on Canada to force us into a deep recession and ask to become the fifty first state.
Unfortunately for Canada, he would only grant us becoming a protectorate. He knows we are to liberal. As a state we would get 40 to 45 congressional districts. The house would become a democratic majority forever.
As for trade, Canada buys more goods and services from the US than any other country and the US has a G and S surplus with Canada. The issue is oil. The US imports 4 Mb/d of Western Canada Select every day for basically $10/b less than WTI. So the US imports this great heavy oil for $57/b and exports its oil to the World for $67/b, using today’s rough prices.
So if the US used some of its own oil, the trade imbalance with the US would vanish. T talks of the US subsidizing Canada. It’s the other way around. We subsidize US gasoline and diesel consumers. T is great at flipping the story.
The criticism that Canada exports fentanyl to the US is only a ruse. Last year US intercepted 45 lbs, inconsequential compared to Mexico. So his greater goal is to try to take over Canada and Greenland, over which he doesn’t have much leverage.
One big grocery chain in Canada is seeing Canadian product sales soar and US product sales dropping. Some company in Maine is reporting orders from Canada are dropping and being cancelled. The premier of Ontario has taken all US spirits and beer off the shelves. Ontario buys over $1B of spirits a year from the US. The biggest bourbon supplier said this is worst than tariffs.
I agree both Canada and the US would be losers if a saner mind doesn’t come to the table.
My best guess at this point is T will push ahead and watch what happens. He doesn’t care if US businesses and citizens are hurt. At some point he might decide to ease tariffs if the US economy slows and the market is down. Before he does, he will tell his rich buddies to buy the Market because he will ease tariffs in the coming weeks.
Ovi, of the 5 Mbpd oil production in Canada what percent of exports could be shifted away from the US this year or next if that was a priority action?
Hickory
Canada’s TMX pipeline to water can ship 900 kb/d without crossing US territory.
Keystone to the Gulf can ship 600 kb/d. The question is will the US put a tariff on that oil. Enbridge also has lines into the US that could ship another 500 k/d to the Gulf but same question again.
OVI FYI,
URGENT WARNING: Trump is Planning to Invade Canada & Greenland
The Regime’s Big Talk Indicates that the Decision Has Been Made; They Just Don’t Know How or When.
Malcolm Nance -US Intelligence 40 yrs Expert on National Security, Counter-Terrorism, Intelligence, Domestic Extremism. x5 NYT Bestselling Author. Honorably retired US Navy Senior Chief, Ukrainian Army Foreign Legionnaire, Widower, Connoisseur of the French 75
Mar 08, 2025
Note: This assessment has been in the works for over a month. It has been broadly discussed on two X Spaces in the last week and in my Substack discussions with both Michael Cohen and Steven Beschloss. As an American married to a Canadian, my worries are not only for my in-laws but also for my Canadian and American friends who serve in the intelligence community and the armed forces on both sides of the border.
However, the details of Trump’s phone conversations with Prime Minister Justin Trudeau have given me, and finally, the New York Times, an unambiguous intelligence indicator that the decision has been made to annex Canada. This is my assessment of the situation.
****
The political rhetoric in the first five weeks of the Trump regime is giving clear indications that the United States fully intends to invade and seize Canada and Greenland at President Trump’s command. The possible timeline is 6-18 months of political destabilization to weaken the Canadian economy, split political parties, and carry out secret destabilization efforts, including identifying and making contact with Canadians who would betray their country.
The best hope is that the operation would be compromised and the planning publicized well in advance of mobilization by anti-Trump loyalists to the Constitution in the intelligence and armed forces who would recognize the campaign’s foolhardiness. However, this does not guarantee that Trump would not carry out the attack.
The occupation of Canada would quickly become a continent-wide, high-intensity modern war akin to Russia’s invasion of Ukraine……
https://malcolmnance.substack.com/p/urgent-warning-trump-is-planning
https://www.youtube.com/watch?v=DGOaf3ryWG4
5 minutes
Analysis of Trump’s decision to cut off Chevron’s ability to export oil to the USA
Will oil demand really peak before global production
https://ourworldindata.org/grapher/per-capita-oil?tab=chart&time=earliest..latest&country=IND~GBR~FRA
India oil consumption per person is increasing and why would anyone think they will not consume at least as much per person as France or the U.K.
India is currently building over 30,000km of roads.
https://www.constructionworld.in/transport-infrastructure/highways-and-roads-infrastructure/india-builds-101900-km-of-national-highways-since-2014/68838
95% of cars sold in India are petrol or diesel, because electric cars with a reasonable range are double the price of an ice car and not affordable for most.
India is consuming 4 times as much oil as the U.K. and has 22 times the population, it has a long way to go.
The list of countries increasing oil consumption is far longer than the list of countries that have peaked.
Things will get interesting in 2029 onwards. You may also want to research how many new runways, airports and terminals are being built around the world. That will not peak any time soon.
Yep on India- for example “Air India has placed a historic order for 570 aircraft, including 470 in 2023 and an additional 100 in 2024, to modernize its fleet and meet growing passenger demand, with deliveries starting in late 2023.”
Hickory
Not seen these figures before, truly extraordinary number of aircraft purchased by just one company.
You’ve shared some interesting links recently, thank you.
This one prompted me to compare BYD EV prices in India with Toyota ICE prices in India. It’s hard to know if a google search is representative, but your factor of 2x cost for EV seems to be a decent metric.
I can’t recall seeing recent updates to the relative mix of 2 & 3 wheel motorbikes vs. cars in India though.
Thanks
I am sure that India will increase oil consumption to around 15 million barrels per day, an increase of 10 million barrels per day.
When India reaches that level each Indian will still be using only 20% of the average consumption of someone in The United States.
I really don’t understand people like Ovi who don’t see consumption increasing.
Heads up.
CNBC radio, interview with Scott Sheffield, past owner of Pioneer (sold to Exxon). He was being grim.
Nearly a quote:
“Pioneer properties, our Tier 1 properties, will be empty by 2027. Our Tier 2 by 2032. The world is oblivious to what this means.” Lots of talk of “the twilight of US shale.”
One wonders how he got Exxon to buy. Maybe they won’t develop Tier 3 and let scarcity explode the price of their Guyana flow.
Thanks Watcher,
Is this what you are talking about?
https://www.cnbc.com/video/2025/03/11/pioneer-natural-ceo-scott-sheffield-on-trumps-tariffs-impact-on-steel-business-and-oil-prices.html
also
https://www.youtube.com/watch?v=JDsAb3Ebo3U
Dennis
Scott said that the drillers need $50/b to $55/b. I wonder if that was for a T1 well or T2. Any idea what the difference in $ is for T1 wells vs T2?
EXXON had in 2024 an ebit margin of round about 15%. Most of their income is oil and gas. So you can guess how deep the oil price compared to 2024 must fall to bring them to 0.
They will install cost cutting programs when this happens, and improve hedging – but I think this is the general overview how big their margins are in general.
Parts of cost cutting will be reduction of drilling…
https://www.dailymail.co.uk/yourmoney/article-14421387/warren-buffett-stock-market-401k-crash.html
And Warren Buffet and Berkshire Hathaway are sitting on 300 billion in cash and continues to sell off portfolio
Berkshire has a fiduciary duty to their clients to do what is in their best interest financially.
What does he tell the SEC?
“When asset prices plummet….we are ready to pounce on them……10 cents on the dollar”
WTI is down in the mid 60s. That corresponds to low 50s in 2019 dollars Have to wonder how much that retards shale drilling. It’s definitely near the decision point for marginal projects.
Not sure why it changed. Could be recession worries. Could be OPEC discipline worries. Or maybe even (Russia) “peace breaking out” worries . Or some off each. FWIW, none of the three have really happened yet. But markets are forward looking and betting Bayesian…so even worries move the needle.
And then the futures curve is also backwardated. So the markets are betting on even cheaper supply/demand in the future. Of course, they don’t have a crystal ball…but are putting money on the table.
Given that Trump has been unleashed and now has moron Musk advising him, the market thinks a World Recession is highly likely which would send oil prices down.