By Ovi
The focus of this post is an overview of World oil production along with a more detailed review of the top 11 Non-OPEC oil producing countries. OPEC production is covered in a separate post.
Below are a number of Crude plus Condensate (C + C) production charts, usually shortened to “oil”, for oil producing countries. The charts are created from data provided by the EIA’s International Energy Statistics and are updated to November 2024. This is the latest and most detailed/complete World oil production information available. Information from other sources such as OPEC, the STEO and country specific sites such as Brazil, Norway, Mexico and China is used to provide a short term outlook.
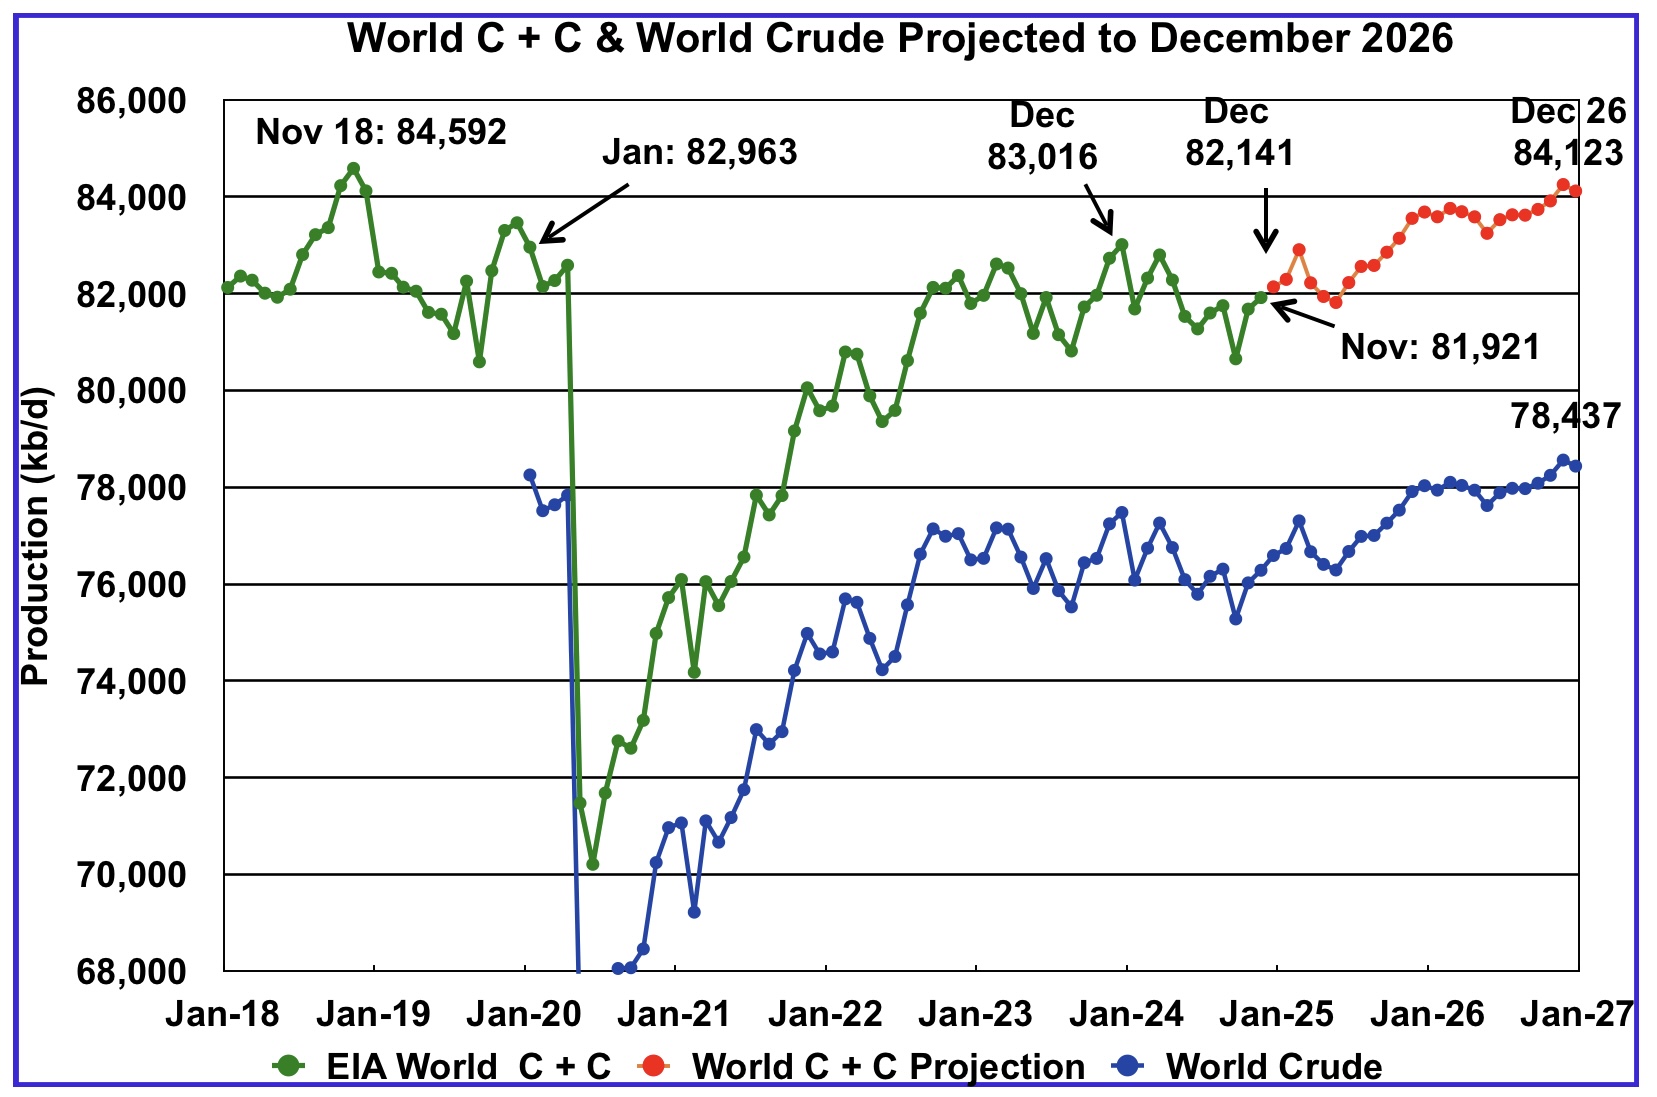
World oil production increased by 238 kb/d in November to 81,921 kb/d, green graph. The largest increases came from Libya, 110 kb/d and Kazakhstan, 164 kb/d. December’s World oil production is projected to increase by 220 kb/d to 82,141 kb/d.
This chart also projects World C + C production out to December 2026. It uses the March 2025 STEO report along with the International Energy Statistics to make the projection.
For December 2026, production is projected to be 84,123 kb/d. The December 2026 oil production is lower than the November 2018 peak by 469 kb/d. December 2026 production has been revised down by 383 kb/d from the previous report. December 2026 crude has been downwardly revised by 357 kb/d.
From December 2023 to December 2026, World oil production is estimated to increase by 1,107 kb/d.
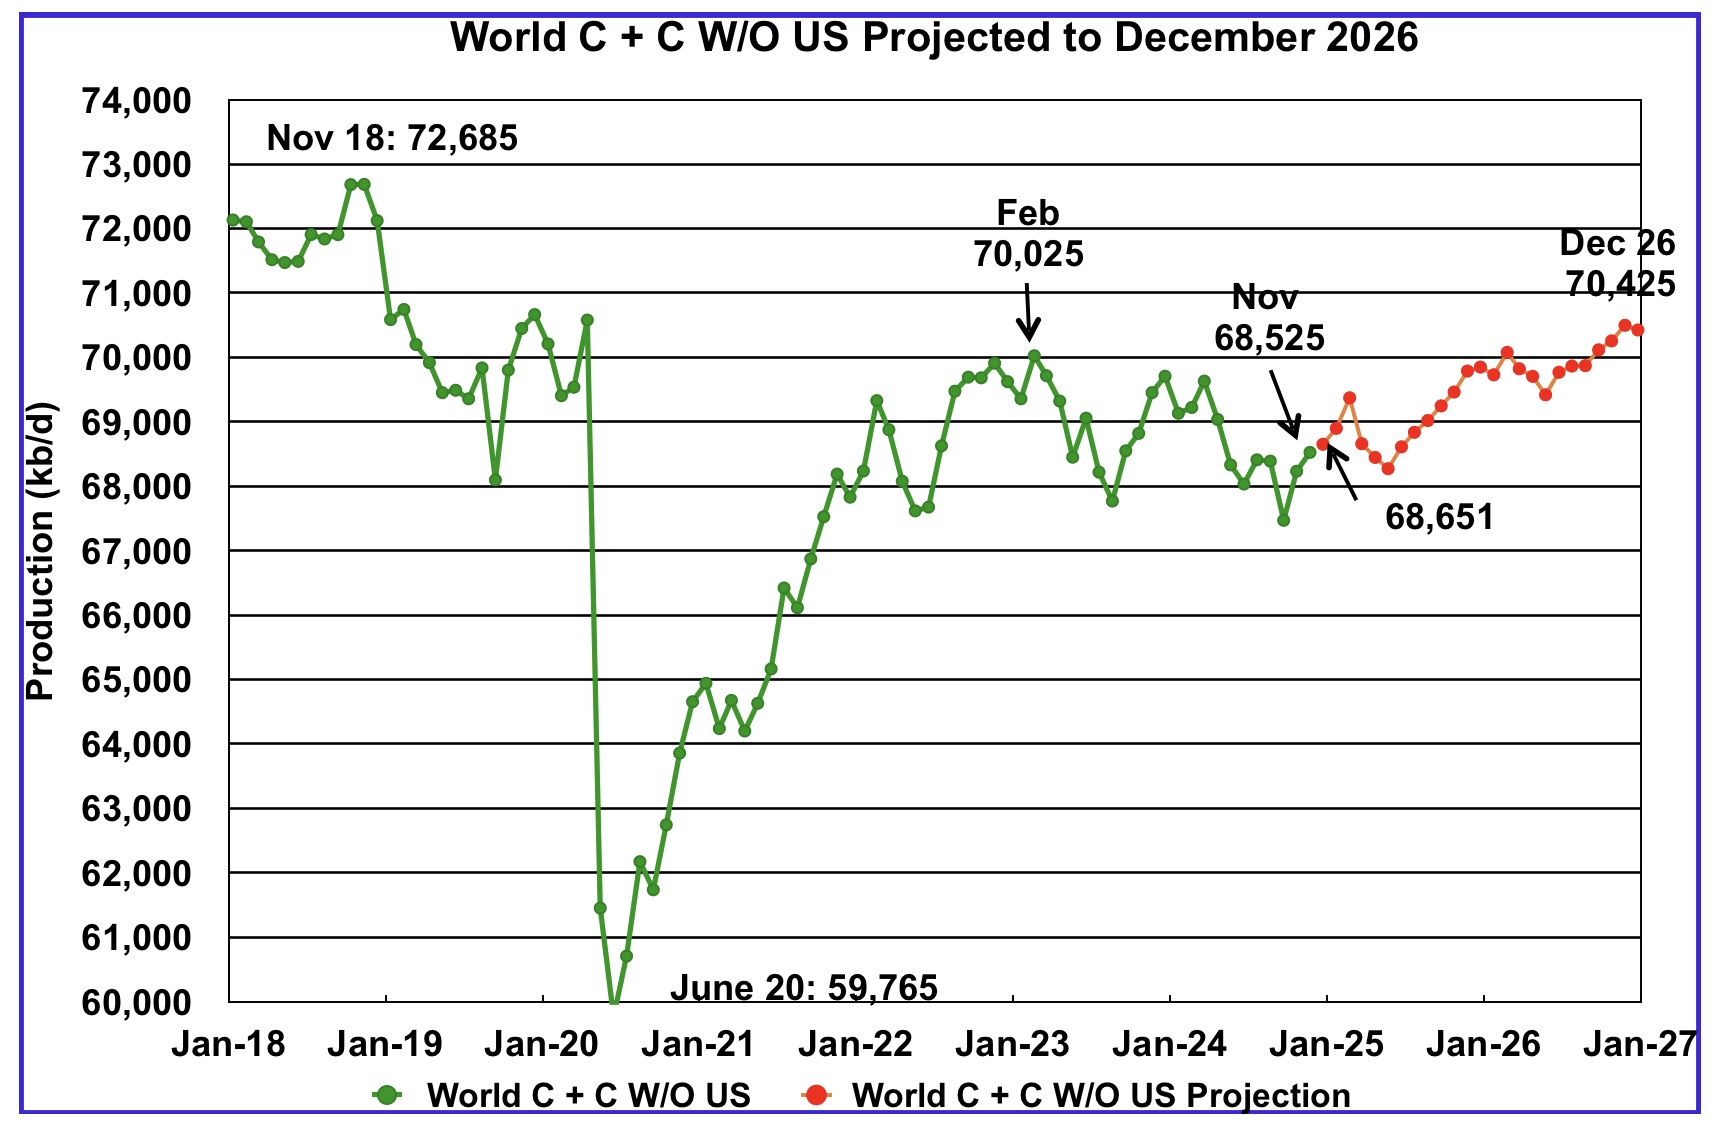
November World oil output without the US increased by 293 kb/d to 68,525 kb/d. December’s production is expected to increase by 126 kb/d to 68,651 kb/d.
The projection is forecasting that December 2026 crude output will be 70,425 kb/d. Note that the December 2026 output is 2,260 kb/d lower than the November 2018 peak of 72,685 kb/d.
World oil production W/O the U.S. from December 2024 to December 2026 is forecast to increase by a total of 1,874 kb/d.
A Different Perspective on World Oil Production
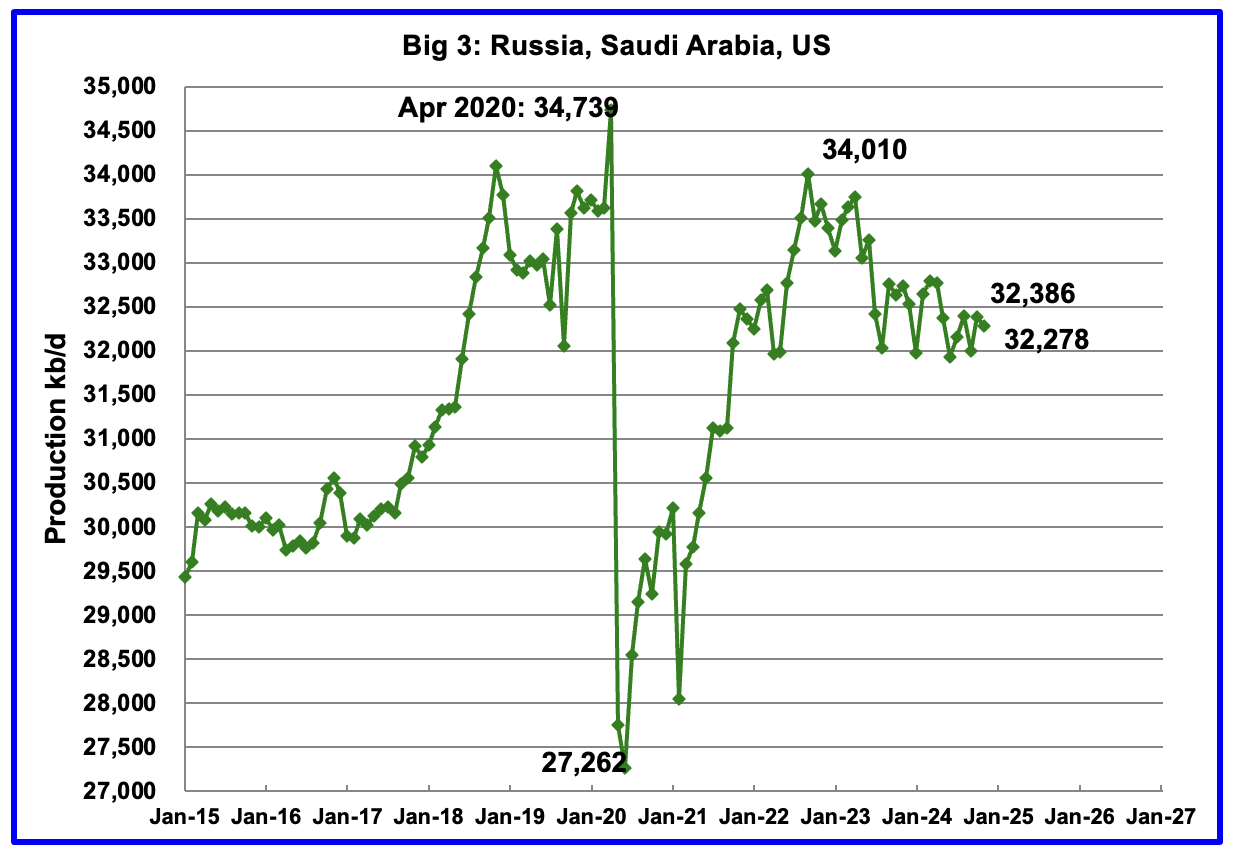
Peak production in the Big 3 occurred in April 2020 at a rate of 34,739 kb/d. The peak was associated with a large production increase from Saudi Arabia. Post covid, production peaked at 34,010 kb/d in September 2022. The production decline since then is primarily due to cutbacks by Saudi Arabia and Russia.
November’s Big 3 oil production decreased by 108 kb/d to 32,278 kb/d. Production in November was 1,732 kb/d lower than the September 2022 post pandemic high of 34,010 kb/d. Of the Big 3, the country with the largest December decrease was the U.S. with a decline of 122 kb/d, see Table below.
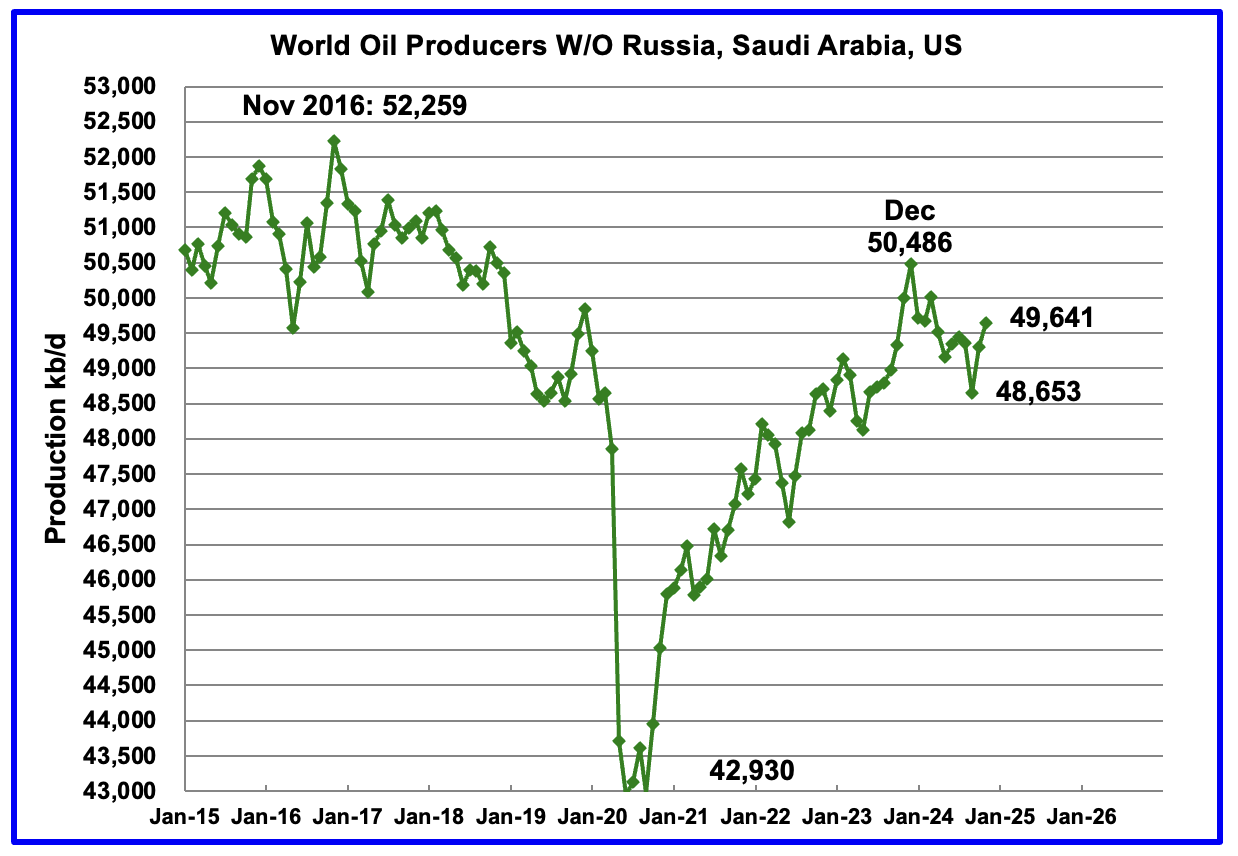
Production in the Remaining Countries had been slowly increasing since the September 2020 low of 42,930 kb/d. Output in December 2023 reached 50,486 kb/d, a new post covid high. However production began falling in January 2024 and been lower ever since. December’s production increased by 344 kb/d to 49,641 kb/d and is now 845 kb/d lower than December 2023.
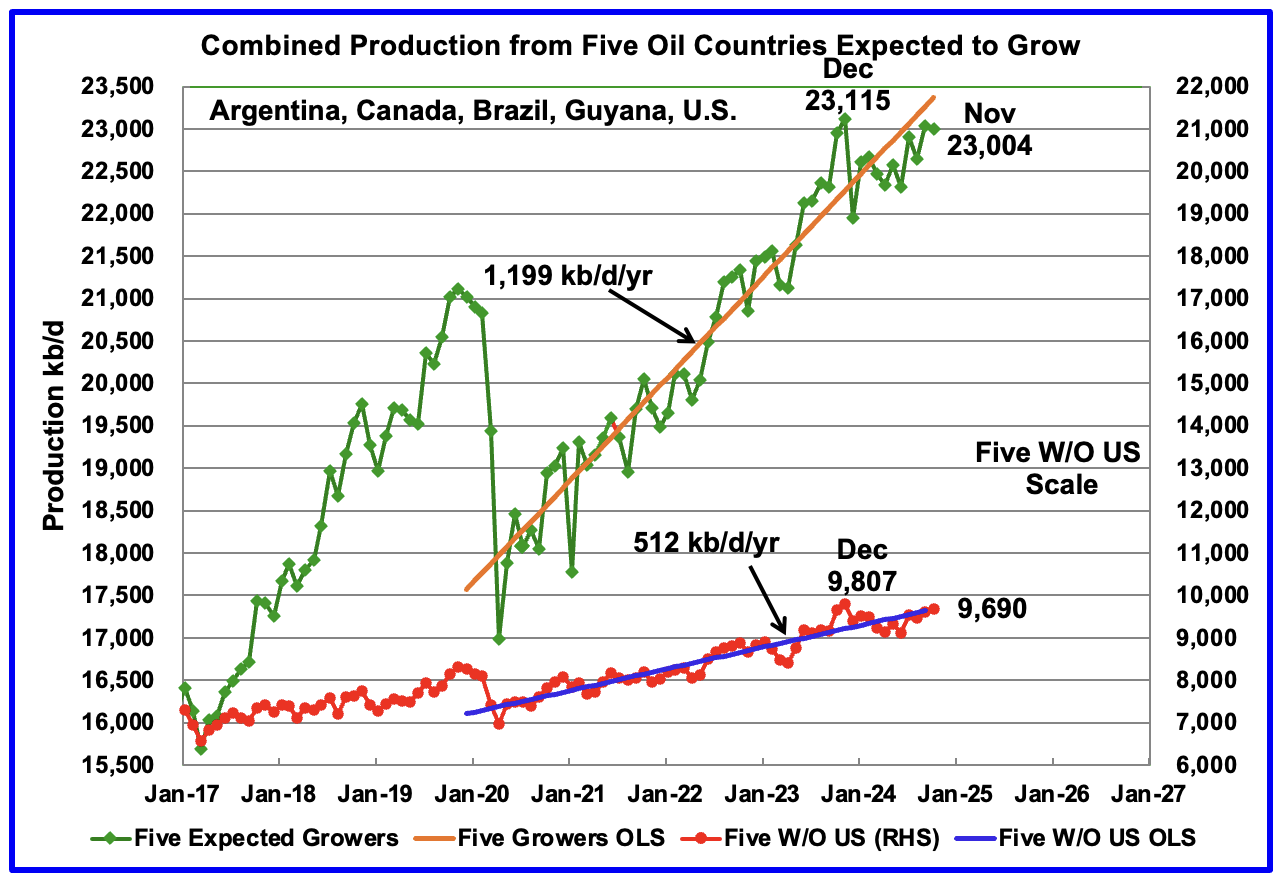
This chart was first posted a few of months back and shows the combined oil production from five Non-OPEC countries, Argentina, Brazil, Canada, Guyana and the U.S. whose oil production is expected to grow. These five countries are often cited by OPEC and the IEA for being capable of meeting the increasing World oil demand for next year while OPEC withholds its oil from the market. For these five countries, production from April 2020 to August 2024 rose at an average rate of 1,199 kb/d/year as shown by the orange OLS line.
To show the impact of US growth over the past 5 years, U.S. production was removed from the five countries and that graph is shown in red. The production growth slope for the remaining four countries has been reduced by 687 kb/d/yr to 512 kb/d/yr.
November production has been added to the five growers chart, down 34 kb/d to 23,004 kb/d. For the Five growers W/O U.S., November production rose by 89 kb/d to 9,690 kb/d.
The OLS lines have not been updated and will not be updated going forward unless there is a strong indication that production is rising.
Production up to December 2023 may be a situation where the past is not a good indicator of the future. In this case it may be more important to focus on what has happened to production after December 2023 rather than before.
Countries Ranked by Oil Production
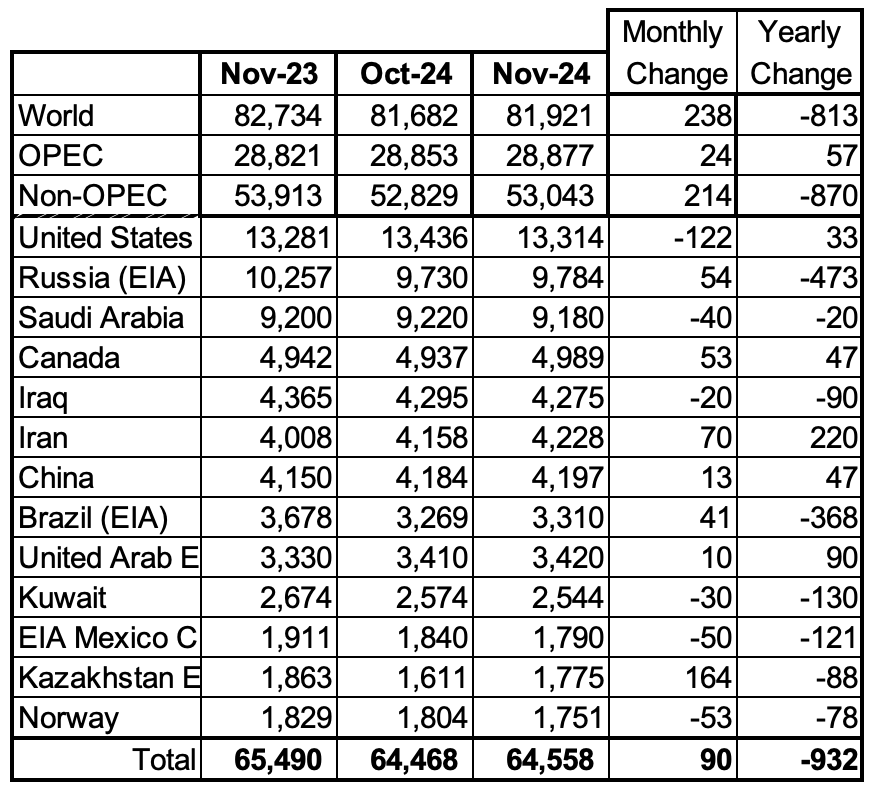
Above are listed the World’s 13th largest oil producing countries. In November 2024, these 13 countries produced 78.8% of the World’s oil. On a MoM basis, production increased by 900 kb/d in these 13 countries while on a YOY basis, production dropped by 932 kb/d. Note the large YoY production increase in Iran and the large drop in Brazil and Russia. Will the upcoming potentially stricter U.S. sanctions on Iran curb/slow that increasing trend?
November Non-OPEC Oil Production Charts
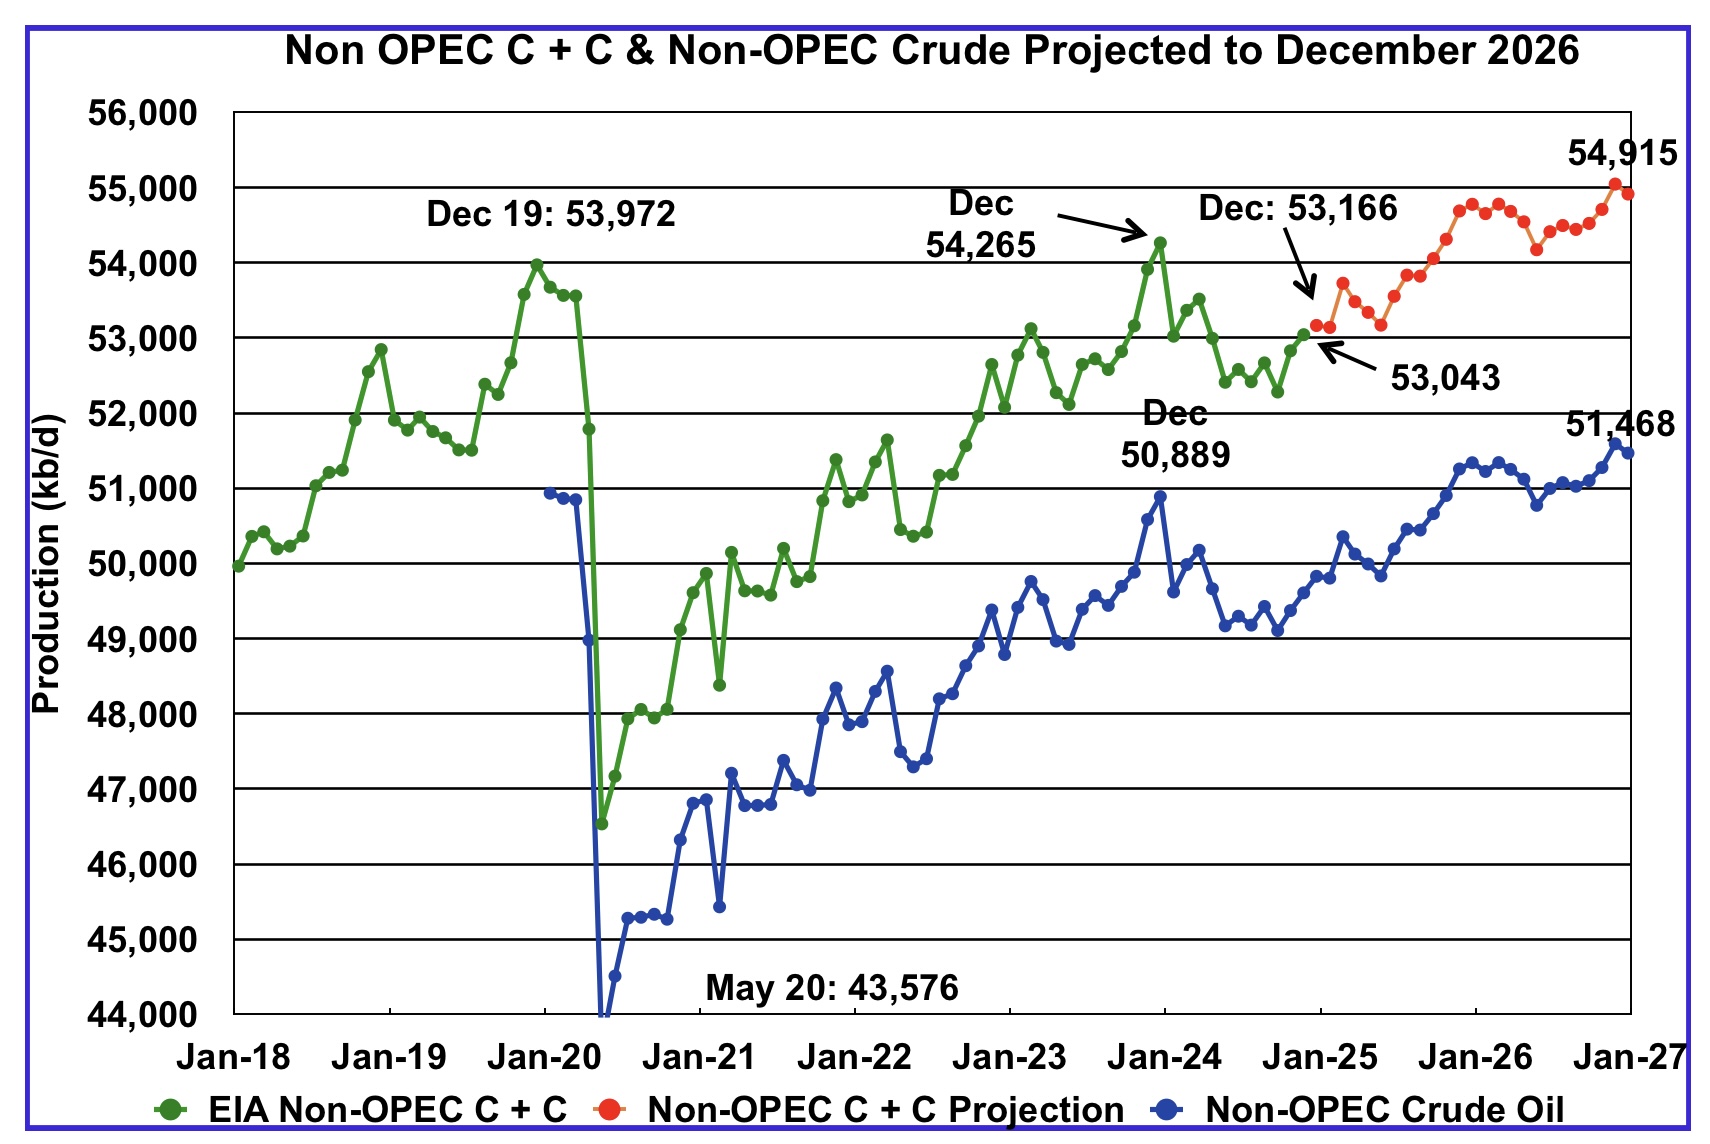
November Non-OPEC oil production increased by 214 kb/d to 53,043 kb/d.
Using data from the March 2025 STEO, a projection for Non-OPEC oil output was made for the period December 2024 to December 2026. (Red graph). Output is expected to reach 54,915 kb/d in December 2026.
From December 2023 to December 2026, oil production in Non-OPEC countries is expected to increase by 650 kb/d.
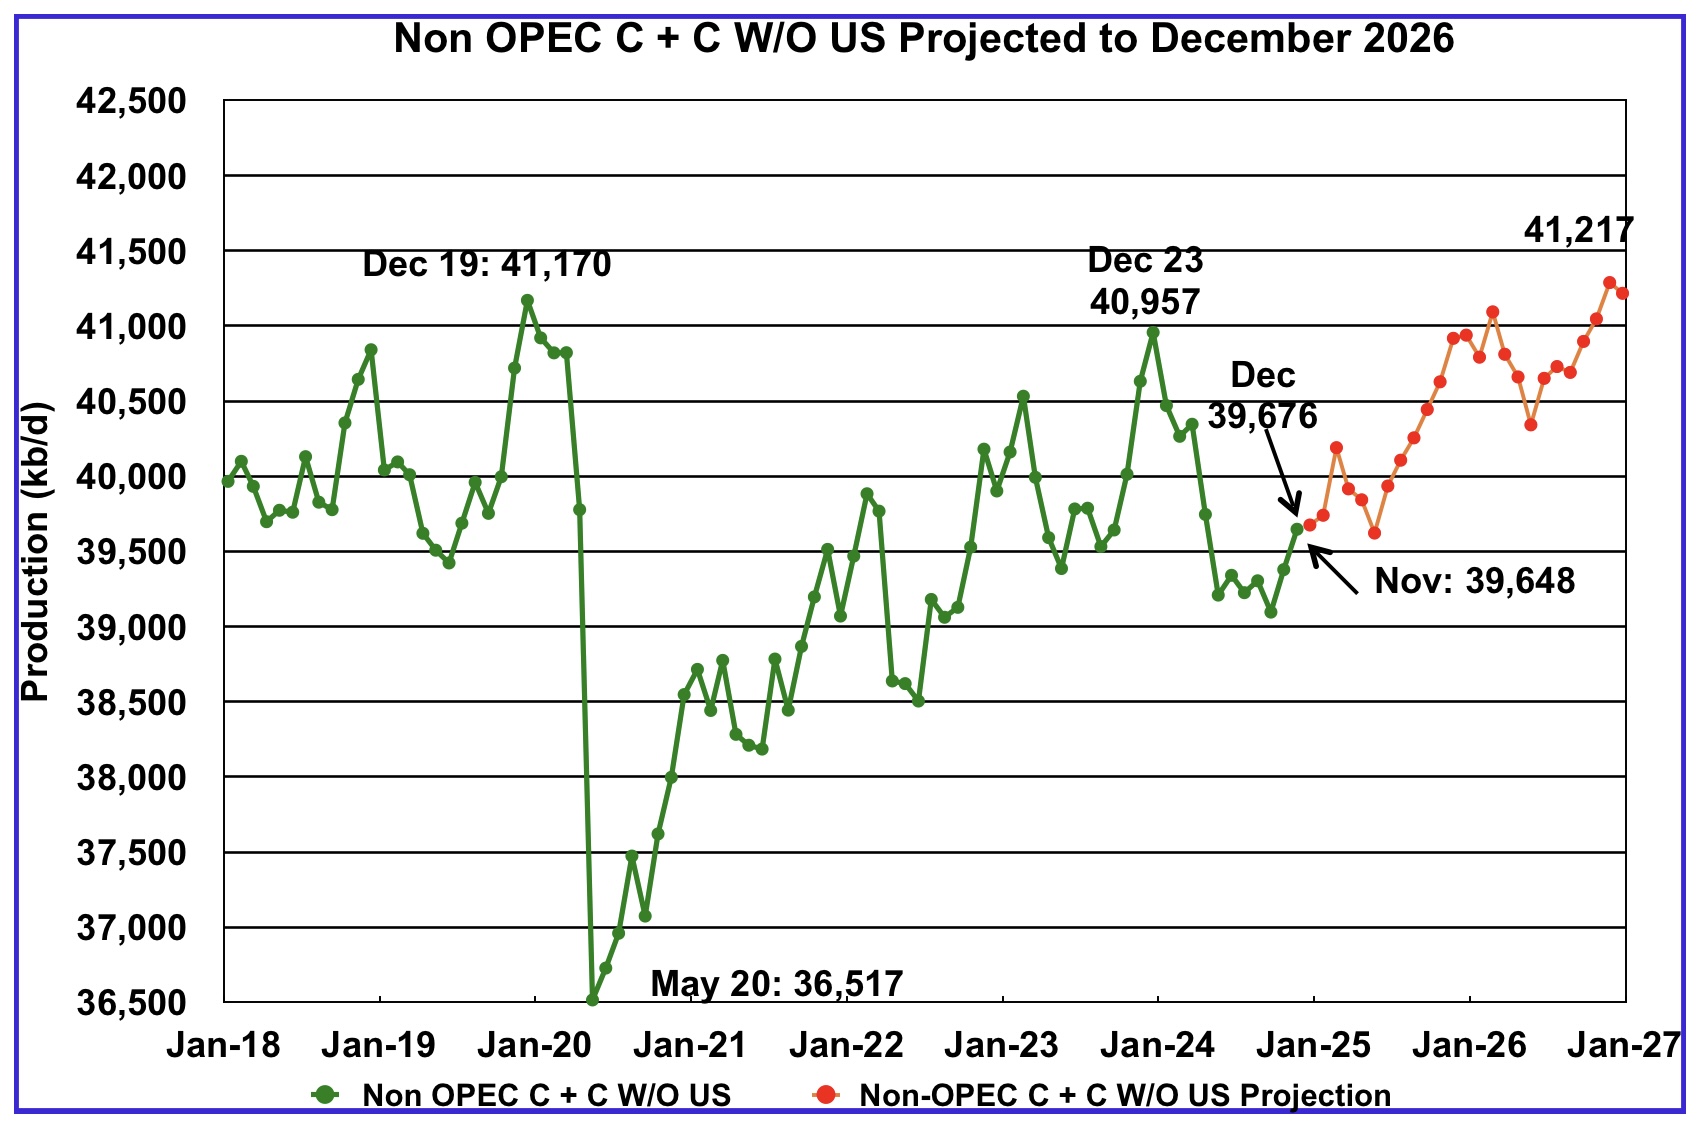
November’s Non-OPEC W/O US oil production rose by 336 kb/d to 39,648 kb/d. December’s production is projected to rise by 7 kb/d to 39,655 kb/d.
From December 2023 to December 2026, production in Non-OPEC countries W/O the U.S. is expected to increase by 260 kb/d or 87 kb/d/yr. December 2026 production is projected to be 47 kb/d higher than December 2019, essentially no growth over seven years.
Non-OPEC Oil Countries Ranked by Production
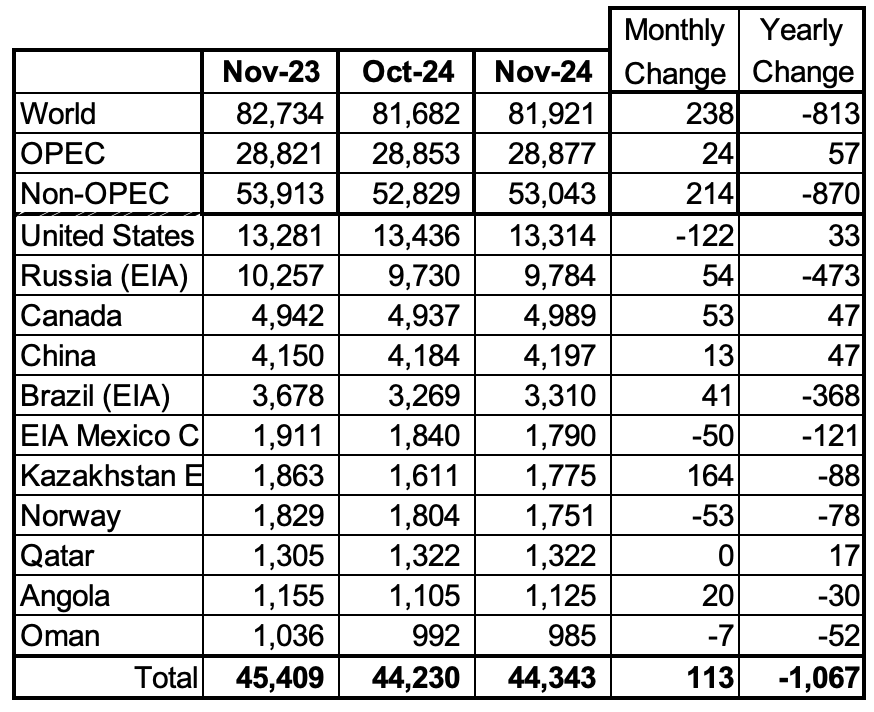
Listed above are the World’s 11 largest Non-OPEC producers. The original criteria for inclusion in the table was that all of the countries produced more than 1,000 kb/d. Oman has recently fallen below 1,000 kb/d.
November’s production increased by 113 kb/d to 44,343 kb/d for these eleven Non-OPEC countries while as a whole the Non-OPEC countries saw a yearly production loss of 870 kb/d to 53,043 kb/d.
In November 2024, these 11 countries produced 83.6% of all Non-OPEC oil.
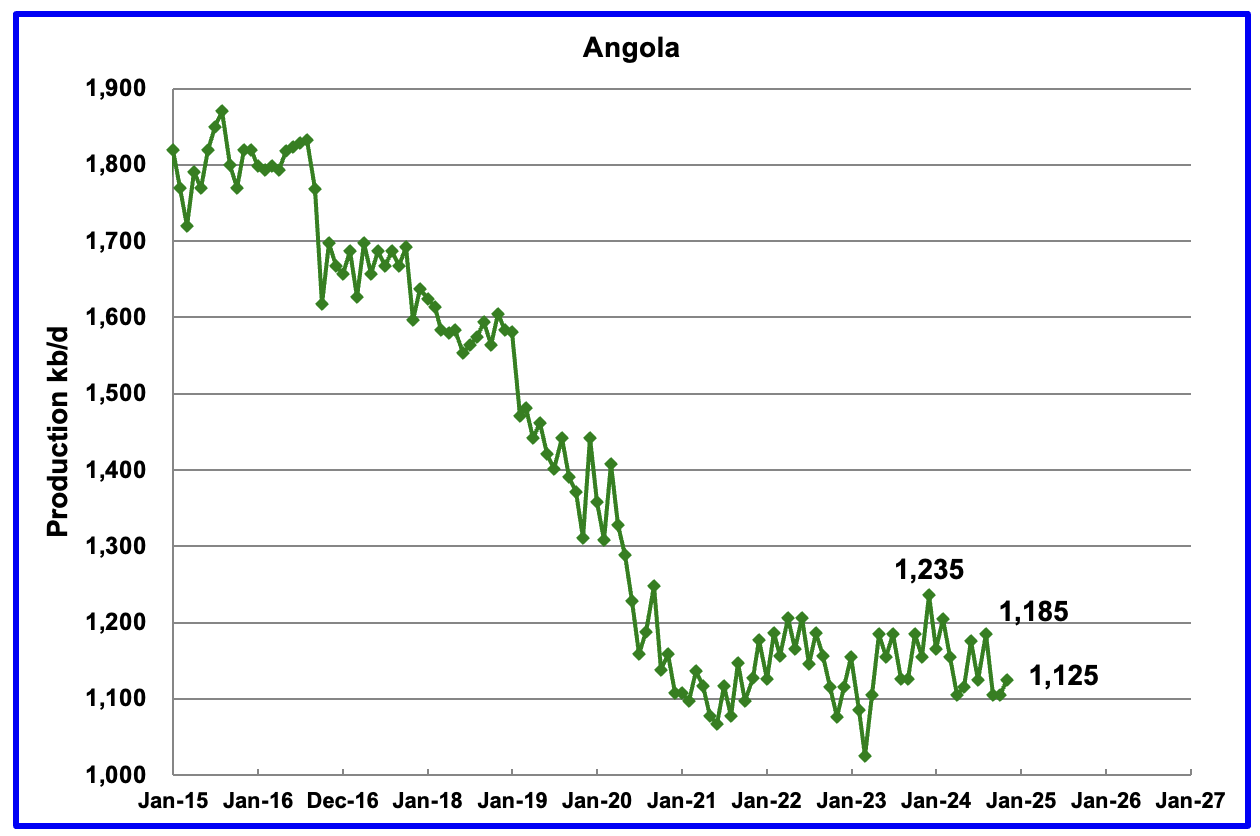
Angola’s November production rose by 20 kb/d to 1,125 kb/d. Since early 2022 Angola’s production appears to have settled into a plateau phase between 1,100 kb/d and 1,200 kb/d.
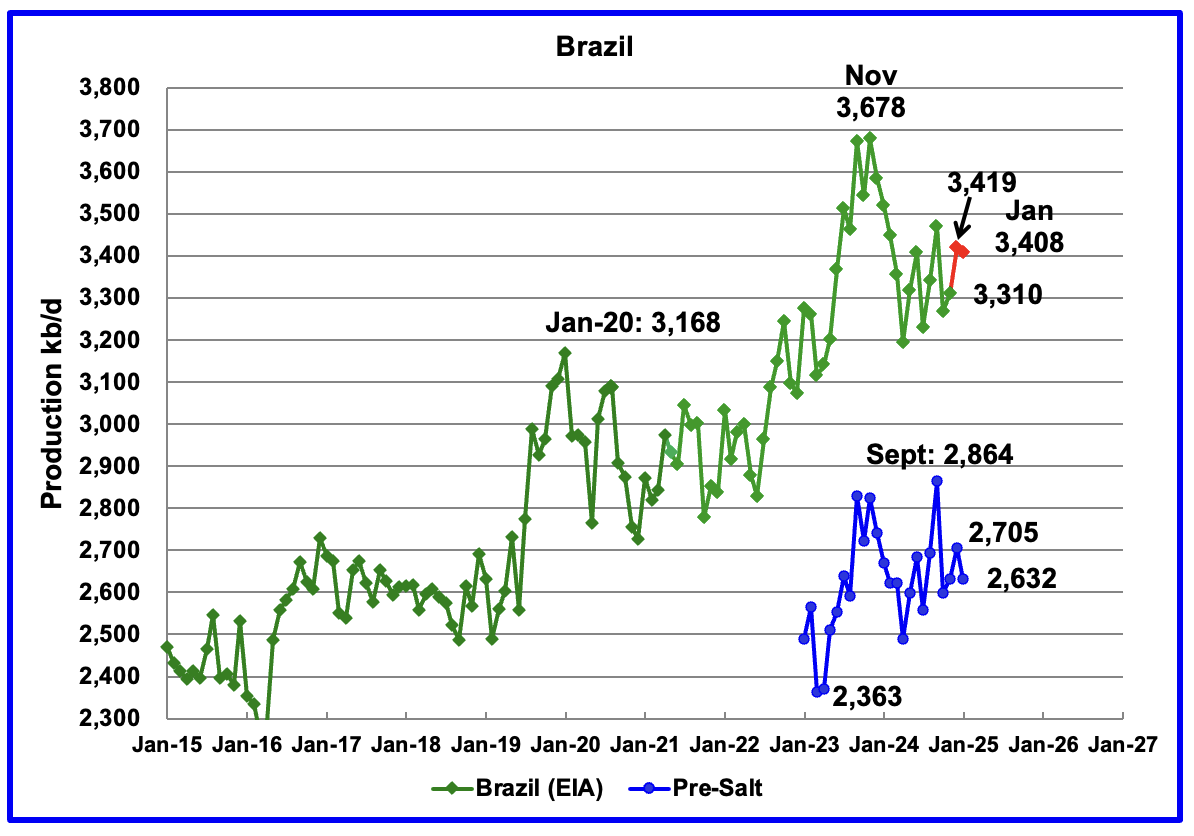
The EIA reported that Brazil’s November production increased by 41 kb/d to 3,310 kb/d.
Brazil’s National Petroleum Association (BNPA) reported that production increased in December and dropped in January to 3,408 kb/d The pre-salt graph tracks Brazil’s trend in the crude oil graph. For December, pre-salt production increased by 74 kb/d to 2,705 kb/d and dropped to 2,632 kb/d in January.
The December increase could be related to the addition of the two new floating platforms. The December OPEC report states that two new floating production storage and offloading (FPSO) platforms came online in November. It also mentions operational issues and slow ramp-ups in several offshore platforms continue to be an issue.
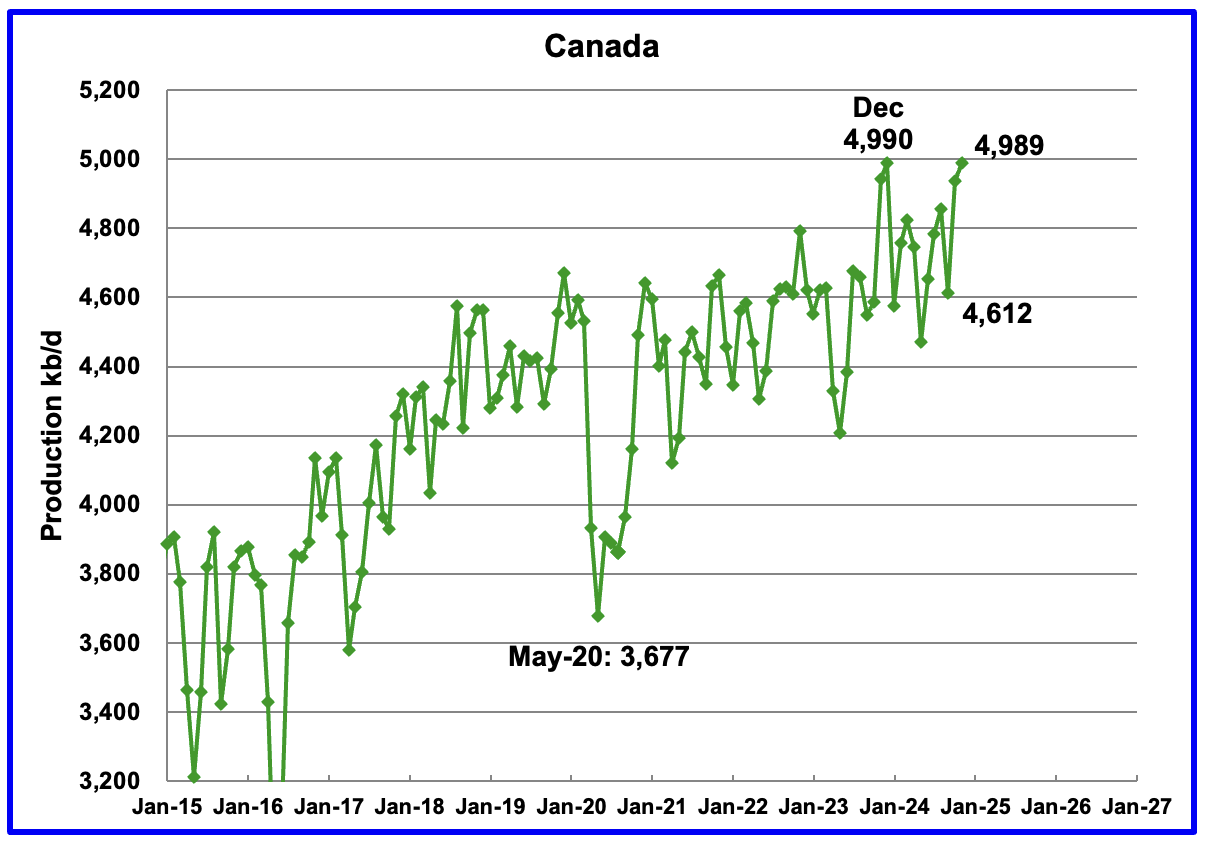
Canada’s production increased by 53 kb/d in November to 4,989 kb/d. The increase is primarily due to site restarts associated with the previous month’s wild fires in the oil sands area around Fort McMurray and the completion of maintenance on oil sands cokers.
With tariffs looming, Canada is now grappling with the effects of having to ship 75% of its oil to the US. Canada has woken up to the risks associated with becoming too close/dependant to a trading neighbour. At this time the anticipated tariff on oil is 10%.
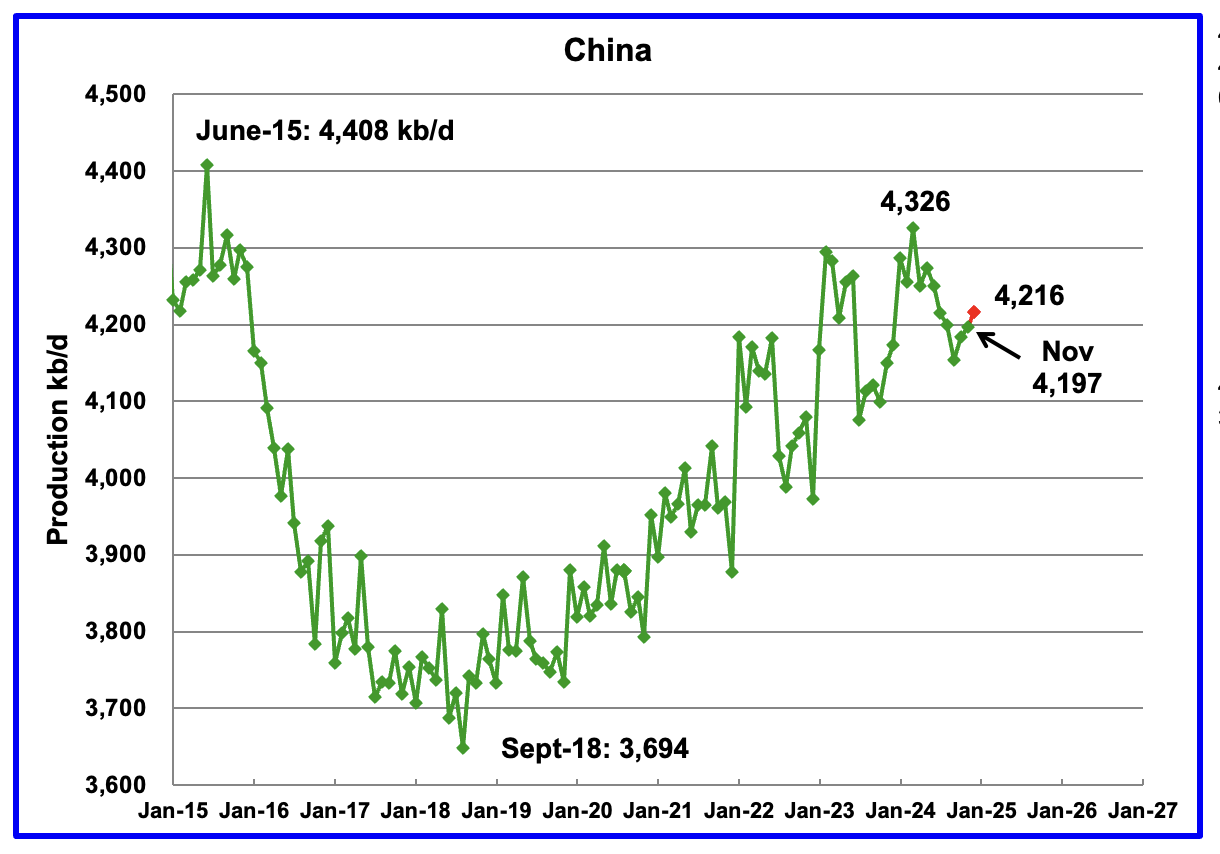
The EIA reported China’s November oil output increased by 13 kb/d to 4,197 kb/d.
The China National Bureau of Statistics reported production for December. December production added 19 kb/d to 4,216 kb/d, red markers.
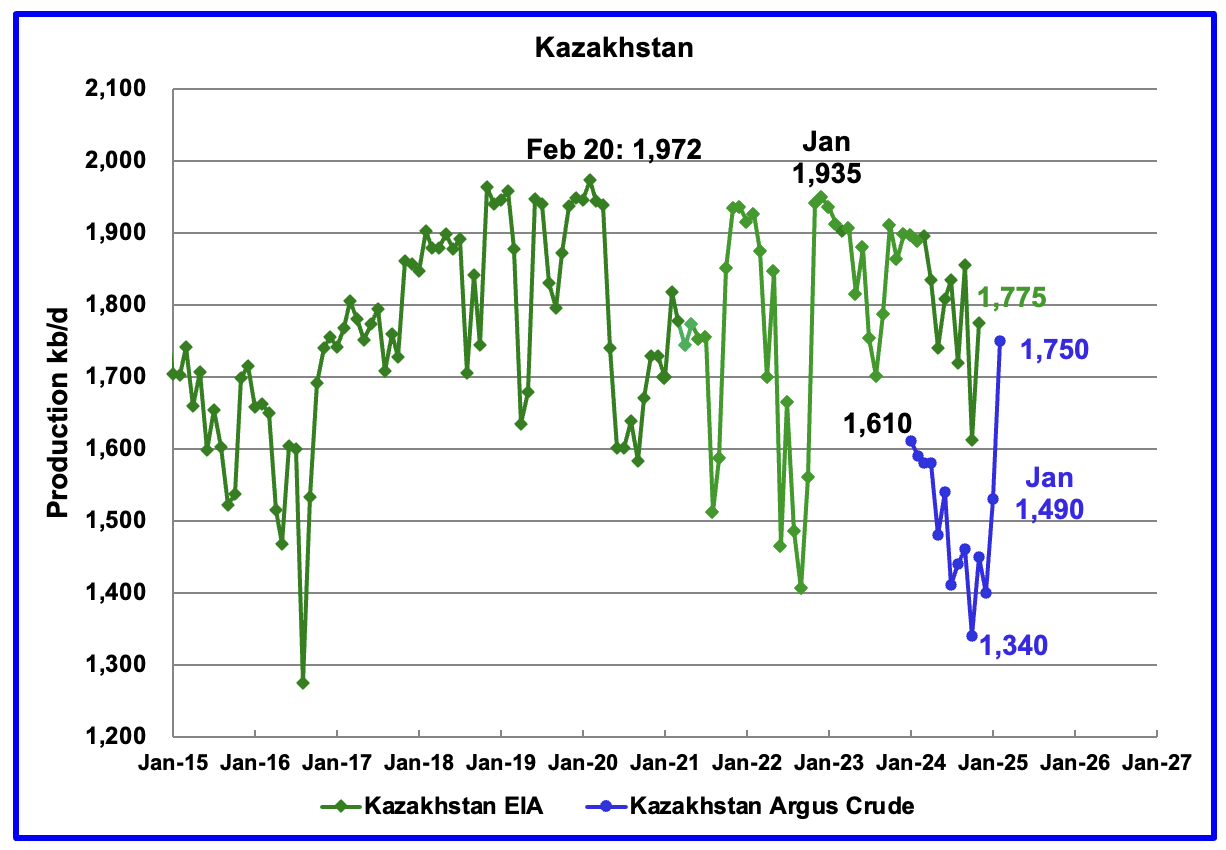
According to the EIA, Kazakhstan’s oil output increased by 164 kb/d in November to 1,775 kb/d.
Kazakhstan’s recent pre-salt crude oil production, as reported by Argus, has been added to the chart. In October pre-salt crude production dropped by 120 kb/d to a low 1,340 kb/d. Since then production has risen by 410 kb/d. February production came in at 1,750 kb/d due to a New Field coming online. Note this is Crude whereas the EIA numbers are C + C.
Kazakhstan’s OPEC crude production target is 1,470 kb/d. At 1,750 kb/d, Kazakhstan is 280 kb/d over their target. According to this Article, Kazakhstan seeks Tengiz and Kashagan output cuts from its international operators.
“Increased output from the Tengiz field helped boost Kazakhstan’s production by 297,000 b/d to a record 1.747mn b/d in February, 279,000 b/d above its Opec+ target of 1.468mn b/d. Kazakhstan’s March target of 1.45mn b/d includes an additional 18,000 b/d cut related to its plan to compensate for past overproduction.
The Chevron-led Tengizchevroil consortium launched a third crude production plant at the field in January. This helped boost Tengiz production to 878,000 b/d in February, compared with about 500,000 b/d in mid-January — although part of the increase is explained by the completion of maintenance at another crude unit at Tengiz.”
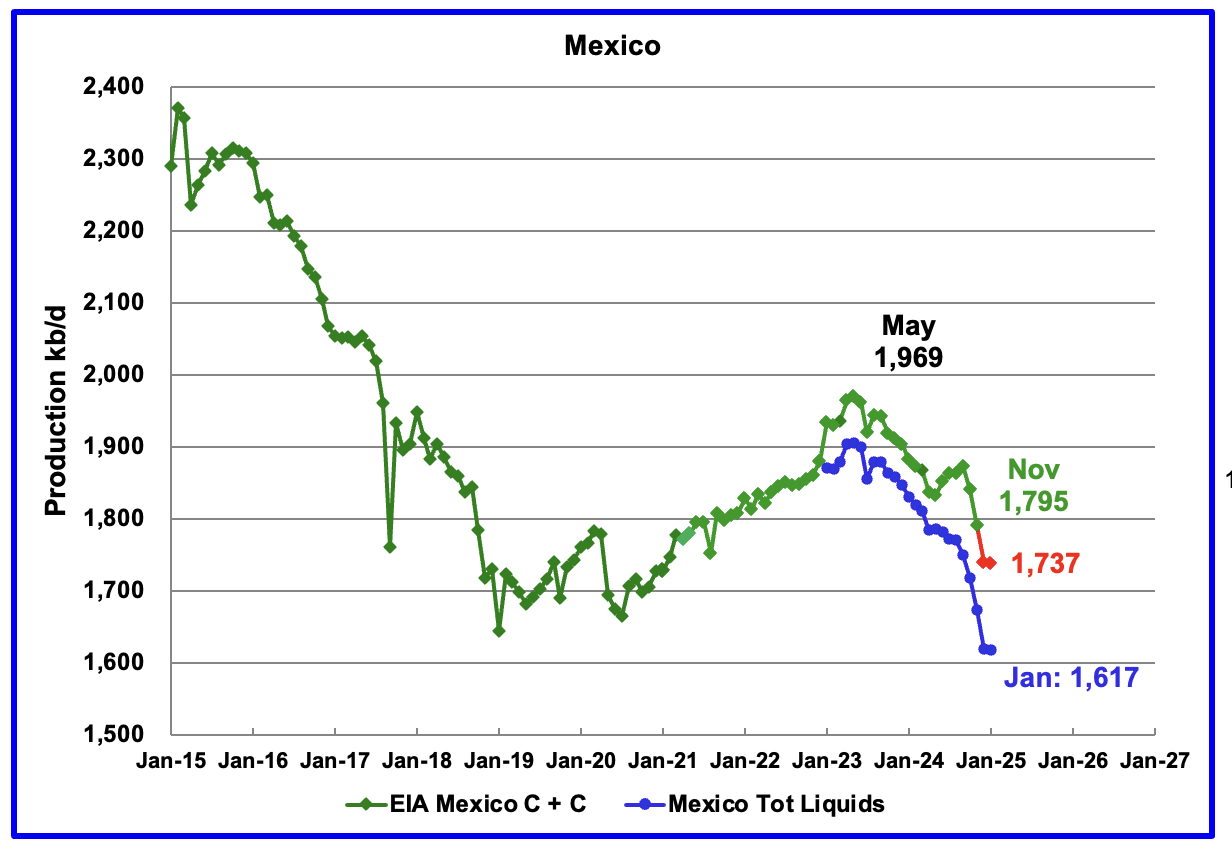
According to the EIA, Mexico’s November output dropped by 45 kb/d to at 1,795 kb/d.
In June 2024, Pemex issued a new and modified oil production report for Heavy, Light and Extra Light oil. It is shown in blue in the chart and it appears that Mexico is not reporting condensate production when compared to the EIA report.
In earlier reports, the EIA would add close to 55 kb/d of condensate to the Pemex report. However for October and November it was increased to 122 kb/d and 117 kb/d respectively. It is not clear if this is the result of better communications with Pemex officials. The condensate addition has been bouncing around 120 kb/d over the last few months.
For December and January production, 120 kb/d have been added to the Pemex production to estimate Mexico’s December and January C + C production, red markers. Note that Mexico’s production, according to Pemex, has continued to fall every month since May 2023, except for one month. However January oil production is little changed from December.
According to this Article, the decline in Mexico’s crude and gas production could accelerate.
“The decline is beyond Pemex control now,” said Alma América Porres Luna, an independent analyst who formerly served as commissioner at the National Hydrocarbons Commission, or CNH, the country’s upstream oil and gas regulator.
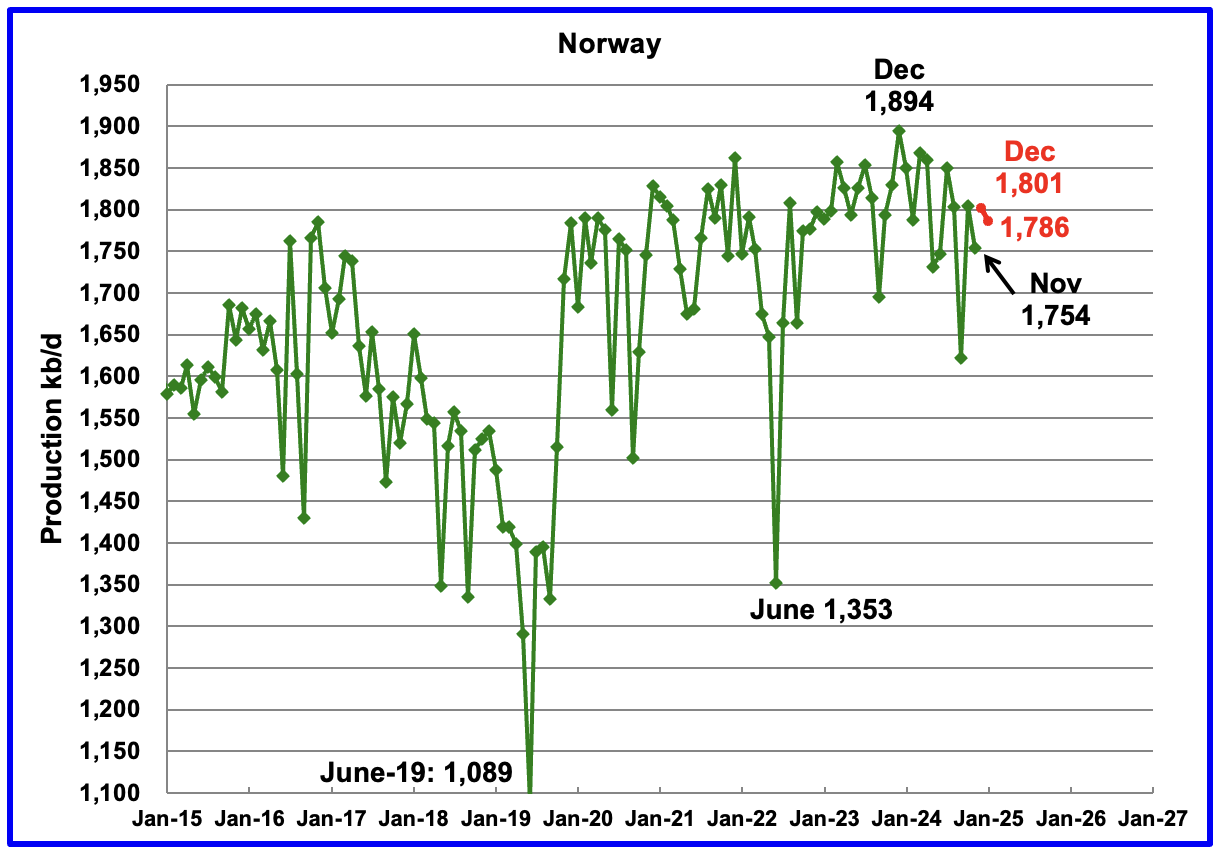
The EIA reported Norway’s November production dropped by 45 kb/d to 1,754 kb/d.
Separately, the Norway Petroleum Directorate (NPD) reported that December production increased by 47 kb/d to 1,801 kb/d and January dropped to 1,786 kb/d, red markers.
The Norway Petroleum Directorship reported that January’s oil production was 2.6% above forecast.
The OPEC February MOMR has this to say for Norway’s 2025 and 2026 oil production. A small production increase for 2025 and then flat. Note this is all liquids.
In 2025, Norwegian liquids production is forecast to grow by 0.1 mb/d to average 2.1 mb/d. Several small-to-large-scale projects are scheduled to ramp up, including Kristin, Eldfisk and Balder/Ringhorne. At the same time, start-ups are expected at the Balder/Ringhome, Norne floating, production, storage and offloading (FPSO), Maria and Kvitebjorn oil field projects. Norway’s Var Energi recently announced the start-up of its Balder X oil project in the North Sea for 2Q25. According to Equinor, the Johan Castberg FPSO is expected to produce the first oil in Norway’s Barents Sea in January or February, after being delayed by bad weather conditions. According to Statistics Norway, total oil and gas investment on the Norwegian continental shelf for 2025 is forecast to rise by about 3%, y-o-y, supporting expected growth this year.
Norwegian liquids production is forecast to drop by about 40 tb/d to average 2.1 mb/d in 2026. Some projects at different scales are scheduled to ramp up in 2026, such as Johan Castberg, Edvard Grieg, Balder/Ringhorne, Heidrun, Grane, Valhall and Ivar Aasen. Simultaneously, start-ups are expected at limited assets, such as the Symra and Edvard Grieg oil field projects.
Comparing the chart with the OPEC statement, it appears that the December 2023 output of 1,894 kb/d is the peak for Norway’s oil production. That peak was associated with the Johan Sverdrup 2 coming online a year before. S & P Global reports that Johan Sverdrup oil field is expected to start declining from late-2024/early-2025.
“Europe’s highest producing oil field, Johan Sverdrup, is expected to start declining in late-2024 or early-2025 — earlier than expected — amid increased signs of water production at some wells”
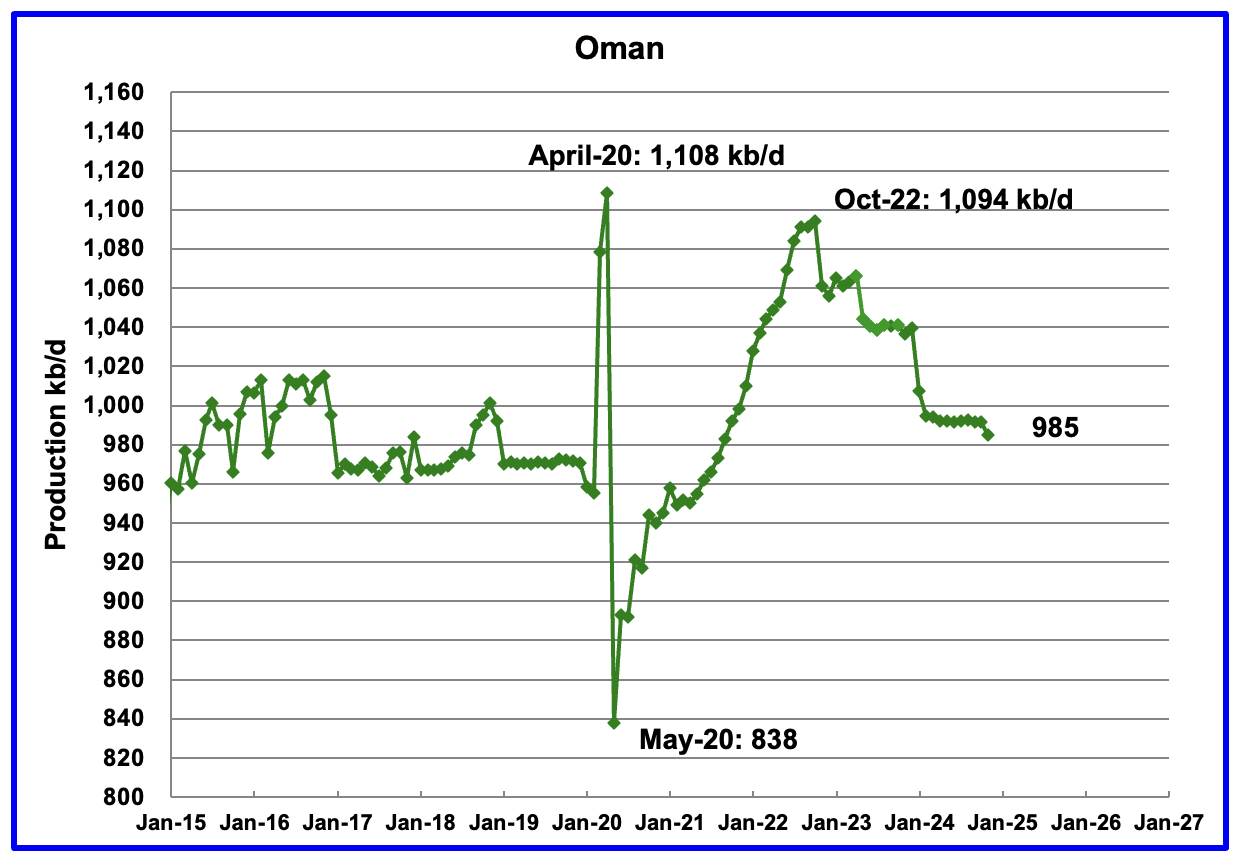
Oman’s production had risen very consistently since the low of May 2020. However production began to drop in November 2022. According to the EIA, November’s output dropped by 7 kb/d to 985 kb/d.
Oman produces a lot of condensate. The OPEC MOMR reports that crude production in November was 764 kb/d, 228 kb/d lower than the EIA’s C + C.
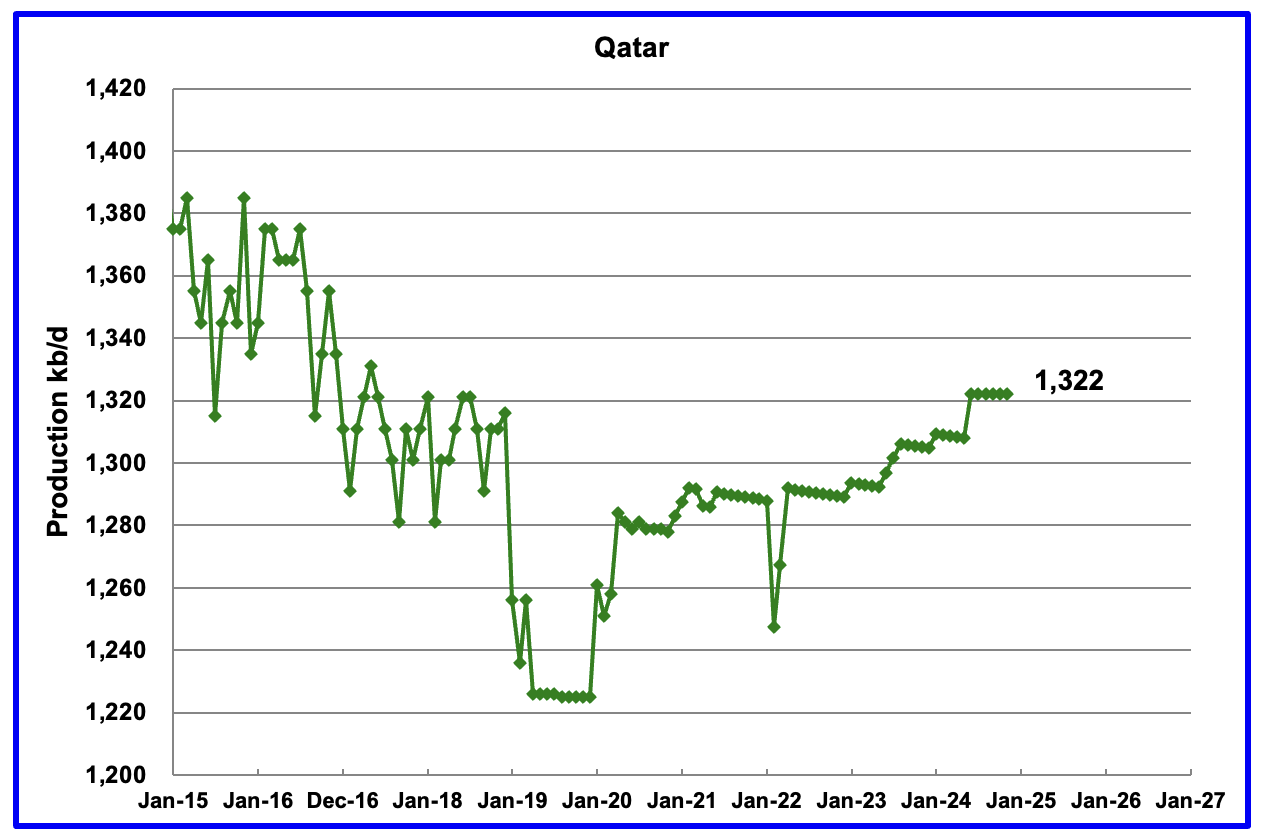
The EIA had been reporting flat output of 1,322 kb/d for Qatar since early 2022. However the current November update has revised down all of the previous production data. Qatar’s November output was reported again to be 1,322 kb/d.
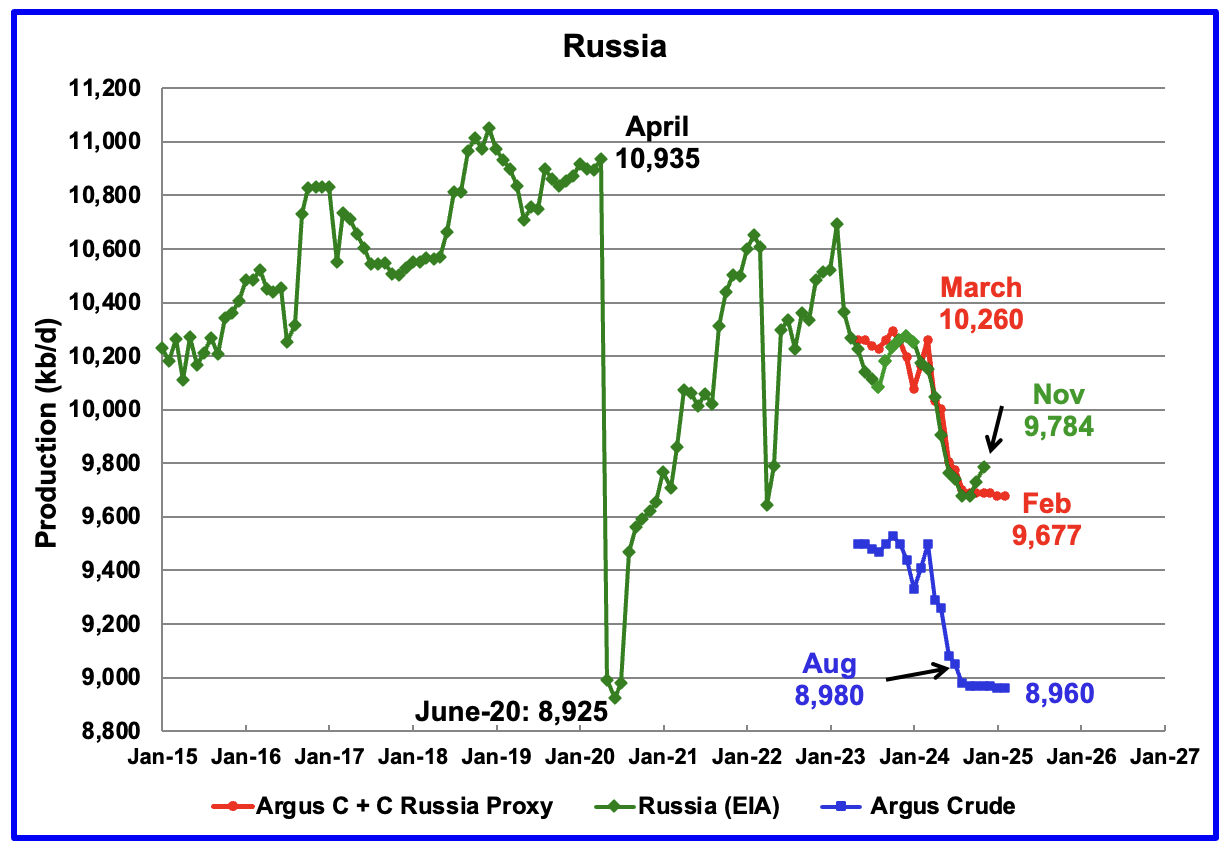
The EIA reported Russia’s November C + C production rose by 54 kb/d to 9,784 kb/d and was down 476 kb/d from March 2024. It is also 96 kb/d higher than the Argus Russia proxy estimate of 9,688 kb/d for November. OPEC reports that Russian crude production in November was 9,010 kb/d.
Using data from Argus Media reports, Russian crude production is shown from May 2023 to January 2025. For February 2025, Argus reported Russian crude production was 8,960 kb/d, unchanged from January, blue markers. Adding 8% to Argus’ February’s crude production provides a C + C production estimate of 9,677 kb/d for Russia, which is a proxy for the Pre-War Russian Ministry estimate, red markers.
According to Argus, Russian crude production of 8,960 kb/d is in compliance with their OPEC target of 8,980 kb/d because it is 20 kb/d lower.
In pre-war times, the Russia Energy Ministry production estimate used to be 400 kb/d higher than the EIA estimate. For November, the EIA’s C + C estimate of 9,784 kb/d is 96 kb/d higher than the Argus proxy estimate of 9,677 kb/d.
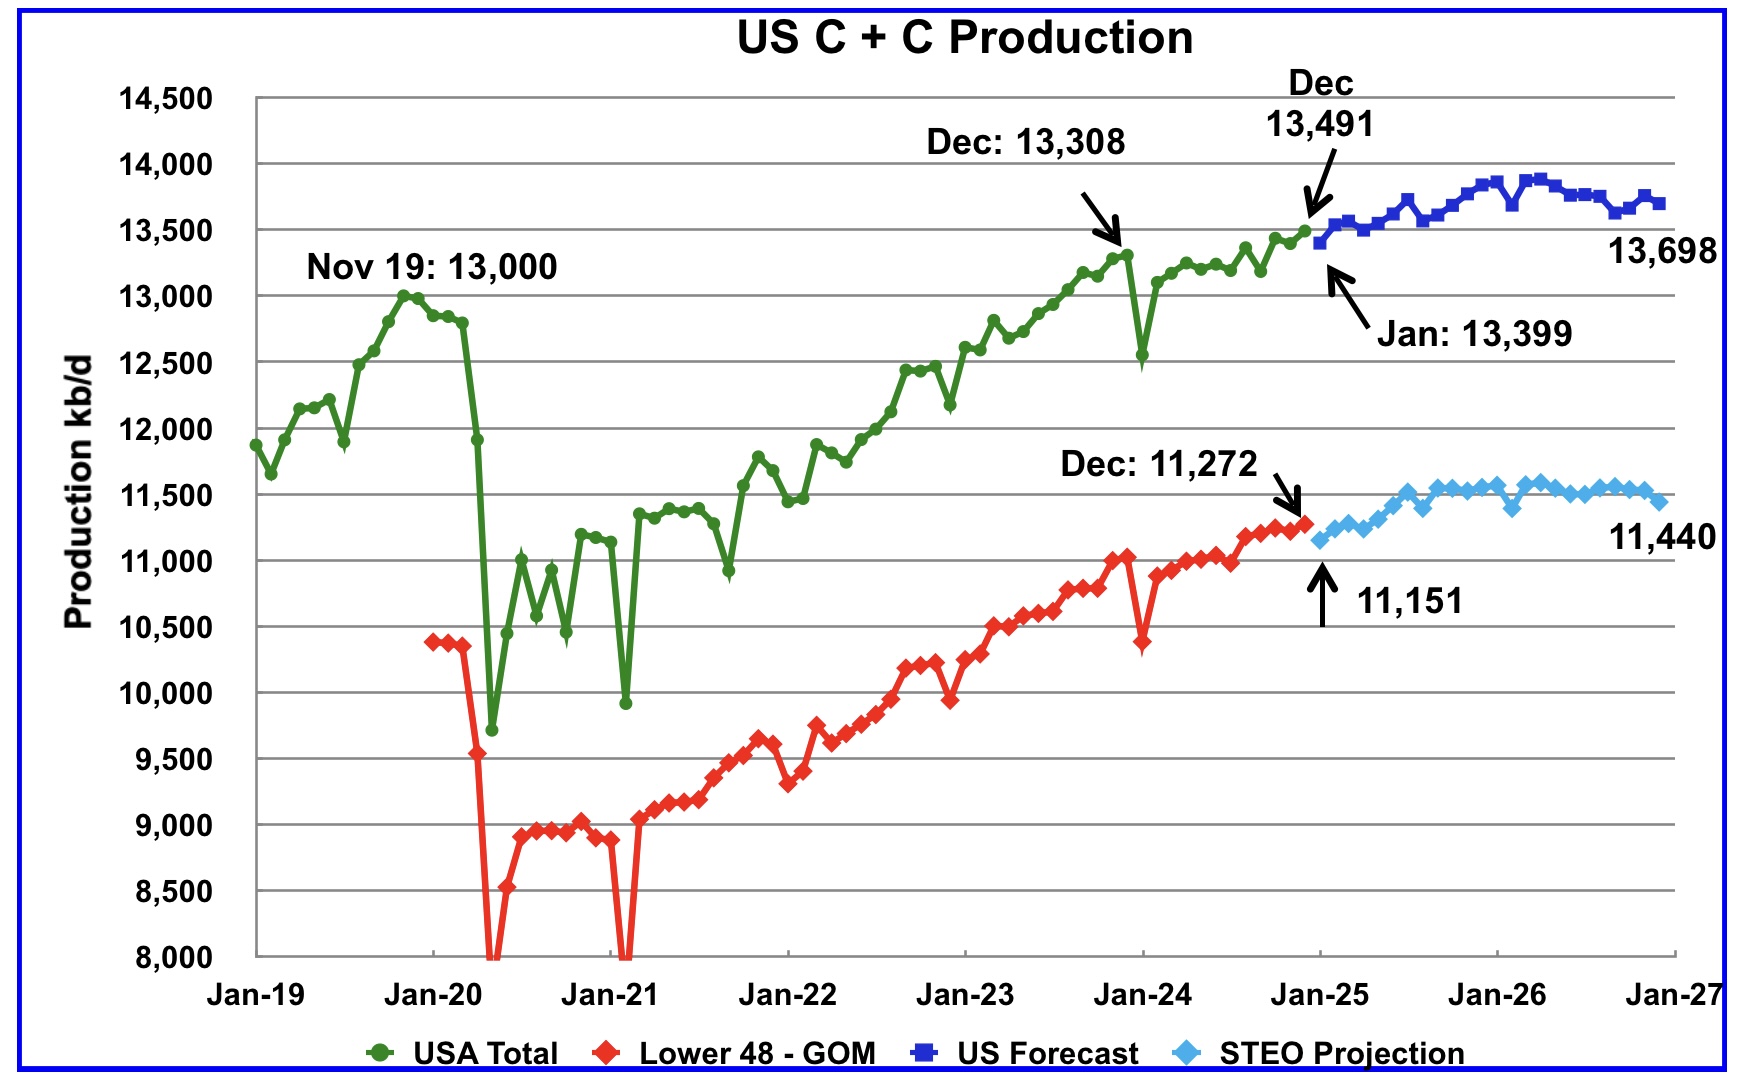
This US production chart is very similar to the one published last week in the US update post. The STEO portions of the two graphs have been updated using the March 2025 STEO.
Production in December 2026 is 41 kb/d higher than reported in the previous post. For the onshore L48, oil production falls off in the latter half of 2026 to 11,440 kb/d and is 74 kb/d higher than in the previous post.
145 responses to “November Non-OPEC and World Oil Production Rose”
Thank you again OVI. It appears that the November 2018 high remains the permanent high.
Seppo,
If we focus on the 12 month average peak (around 83 Mb/d in 2018), the Feb STEO had that being surpassed in 2025, I have not yet done the estimate for the March STEO (my method is slightly different than Ovi’s and he doesn’t give us the 12 month average), but it looks like for Ovi’s estimate for the March STEO that there will be a new peak (83.5 Mb/d) by 2026 (if the STEO is accurate). My guess is that the STEO may be too optimistic, but I do have a new 12 month peak at 83.1 Mb/d in 2026 with that peak surpassed in both 2027 and 2028 and a final 12 month average peak of 83.7 Mb/d in 2028 (no doubt that my guess will prove incorrect.)
Seppo
Thanks.
I think it will be very difficult to exceed the November 2018 high. Possibly more than likely from lower demand.
Great job Ovi, thank you for this report.
Dennis
Thanks. Did you get my email?
Yes. I got it.
Brazil crude production did not grow in the last 12 months. See graph “Histórico de produção de petróleo” on page 6 in the January 2025 monthly report
https://www.gov.br/anp/pt-br/centrais-de-conteudo/publicacoes/boletins-anp/boletins/arquivos-bmppgn/2025/janeiro.pdf
Again I refer to my post:
US shale oil seems to cover up peaking crude oil production in the rest
of the world since 2018
4 Mar 2024
https://crudeoilpeak.info/us-shale-oil-seems-to-cover-up-peaking-crude-oil-production-in-the-rest-of-the-world-since-2018
Thanks Ovi (and Dennis), nice work with the detailed posts.
Matt – Yes, it is especially apparent with the significant increase in lighter end components that are getting lumped into the C+C category, I believe there’s been almost 10% of C+C that is from a group of light end chemicals (ethane and LNG). This is in stark contrast to 20 years ago. Will this trend continue? I’m curious to group world production in two categories, 1) countries that have increased production during recent high price periods, and 2) those that have not. I think this might help to show decline that is driven by natural decline and decline that is not (economically sensitive), imagine it’s a small group that is not in natural decline (maybe 5-10 countries?).
Gas liquids are usually shown separately in statistics and are not included in C&C
On question 1 see Fig 6 in above post
On question 2 see Fig 4 in above post
Kengeo,
NGL (which is primarily propane, ethane, butane, and isomers) is not included in C plus C.
Matt,
That is correct and the reason why I expect World C plus C may peak when US tight oil peaks in 2027 or 2028. It is also the reason I follow tight oil output closely.
Trump’s trade wars will mean that global economic activities will be dampened and therefore oil production and oil prices.
I’m not sure that’s the case, I’d say it’s more of an indirect effect. If investment is too low then there could be some impact. High interest rates and jobs play a larger role in oil production than the tariffs. At a glance, it looks like the tariffs will essentially be a tax on the average American family of $10,000 over 10 years, with major negative impact to jobs/industry in Canada and Mexico. There could be some benefits to Americans if job/industry growth shifts to the US. Energy (from Canada) and food/cars (from Mexico) likely being most heavily impacted. It’s interesting that Trump is a big fan of Elon Musk who is not a supporter of tariffs or any other trade relations that cause market disruption/distortion…I wonder if Musk will eventually convince Trump to abandon the tariff nonsense…
Kengeo,
Free trade benefits the US, tariffs by the US will be matched by other nations, this type of behavior in the late nineteenth and early 20th century led to two World Wars, cooperation and trade allowed the World to avoid World War 3. The tariffs will be of no benefit to anyone and are much more likely to lead to harm than benefit. Also the chaos and uncertainty by Trumps on again off again policies will lead to low business investment in general, in addition Trump’s tendency to flout the rule of law will not be seen as positive by the business community, the ethics wing of the Justice department has been decimated by Trump and now “ethics” will be monitored by political hacks loyal to Trump.
It is a sad period for representative democracy and the rule of law in the US.
I think Matt has this right, a Worldwide recession and lower demand for oil seems likely, but perhaps not enough to prevent a new peak eventually. Much depends on whether Trump recognizes his errors, this seems unlikely, the man seems delusional and there are no longer any adults in the room. Musk is a chump and a con man much like Trump himself.
Trump’s goal is to attract companies to the US: He was to make it more attractive to produce right in the country. Therefore all that trade war. Will it work? I don’t know. But if it works, the use of coal and oil will go up significantly in the US, which will lead to significantly more oil imports. This could become the tricky part.
Westtexasfanclub,
No it won’t work. US exports will take a hit as other nations also impose retaliatory tariffs. Generally what happens is everyone becomes worse off. Simple example, nation A can make very nice wine for $10/bottle, in nation B they can make an equivalent quality wine for $20/bottle. Nation B can make shirts for $10/shirt, while in nation A it costs $20/shirt. Trading wine and shirts makes more sense than protecting the wine industry in nation B by erecting a wine tariff wall and in nation A by erecting short tariff wall. Should the tariff walls be imposed by both nations their citizens will be poorer as a result. This is very basic international economics that even a chump like Trump should understand.
Trump was sleeping in economics class and must have paid someone to take his exams.
Dennis
T’s tariffs on Canada have two objectives. The first is to increase revenue into the US treasury. Canada buys more from the US than any other country. The biggest source of tariff income for the US would be to impose tariffs on Canada to help offset his tax reduction for the rich. His second objective is to wage economic warfare on Canada to force us into a deep recession and ask to become the fifty first state.
Unfortunately for Canada, he would only grant us becoming a protectorate. He knows we are to liberal. As a state we would get 40 to 45 congressional districts. The house would become a democratic majority forever.
As for trade, Canada buys more goods and services from the US than any other country and the US has a G and S surplus with Canada. The issue is oil. The US imports 4 Mb/d of Western Canada Select every day for basically $10/b less than WTI. So the US imports this great heavy oil for $57/b and exports its oil to the World for $67/b, using today’s rough prices.
So if the US used some of its own oil, the trade imbalance with the US would vanish. T talks of the US subsidizing Canada. It’s the other way around. We subsidize US gasoline and diesel consumers. T is great at flipping the story.
The criticism that Canada exports fentanyl to the US is only a ruse. Last year US intercepted 45 lbs, inconsequential compared to Mexico. So his greater goal is to try to take over Canada and Greenland, over which he doesn’t have much leverage.
One big grocery chain in Canada is seeing Canadian product sales soar and US product sales dropping. Some company in Maine is reporting orders from Canada are dropping and being cancelled. The premier of Ontario has taken all US spirits and beer off the shelves. Ontario buys over $1B of spirits a year from the US. The biggest bourbon supplier said this is worst than tariffs.
I agree both Canada and the US would be losers if a saner mind doesn’t come to the table.
My best guess at this point is T will push ahead and watch what happens. He doesn’t care if US businesses and citizens are hurt. At some point he might decide to ease tariffs if the US economy slows and the market is down. Before he does, he will tell his rich buddies to buy the Market because he will ease tariffs in the coming weeks.
Ovi, of the 5 Mbpd oil production in Canada what percent of exports could be shifted away from the US this year or next if that was a priority action?
Hickory
Canada’s TMX pipeline to water can ship 900 kb/d without crossing US territory.
Keystone to the Gulf can ship 600 kb/d. The question is will the US put a tariff on that oil. Enbridge also has lines into the US that could ship another 500 k/d to the Gulf but same question again.
OVI FYI,
URGENT WARNING: Trump is Planning to Invade Canada & Greenland
The Regime’s Big Talk Indicates that the Decision Has Been Made; They Just Don’t Know How or When.
Malcolm Nance -US Intelligence 40 yrs Expert on National Security, Counter-Terrorism, Intelligence, Domestic Extremism. x5 NYT Bestselling Author. Honorably retired US Navy Senior Chief, Ukrainian Army Foreign Legionnaire, Widower, Connoisseur of the French 75
Mar 08, 2025
Note: This assessment has been in the works for over a month. It has been broadly discussed on two X Spaces in the last week and in my Substack discussions with both Michael Cohen and Steven Beschloss. As an American married to a Canadian, my worries are not only for my in-laws but also for my Canadian and American friends who serve in the intelligence community and the armed forces on both sides of the border.
However, the details of Trump’s phone conversations with Prime Minister Justin Trudeau have given me, and finally, the New York Times, an unambiguous intelligence indicator that the decision has been made to annex Canada. This is my assessment of the situation.
****
The political rhetoric in the first five weeks of the Trump regime is giving clear indications that the United States fully intends to invade and seize Canada and Greenland at President Trump’s command. The possible timeline is 6-18 months of political destabilization to weaken the Canadian economy, split political parties, and carry out secret destabilization efforts, including identifying and making contact with Canadians who would betray their country.
The best hope is that the operation would be compromised and the planning publicized well in advance of mobilization by anti-Trump loyalists to the Constitution in the intelligence and armed forces who would recognize the campaign’s foolhardiness. However, this does not guarantee that Trump would not carry out the attack.
The occupation of Canada would quickly become a continent-wide, high-intensity modern war akin to Russia’s invasion of Ukraine……
https://malcolmnance.substack.com/p/urgent-warning-trump-is-planning
Hunting Beach
Thanks for the warning.
I think there is more than a grain of truth in that article.
Attached is an article that CNN published indicating that T has asked for plans to be drawn up on how to seize the Panama Canal. My question is why was this leaked. Is this a warning for Canada and Greenland?
https://www.cnn.com/2025/03/13/politics/pentagon-panama-canal-options/index.html
Pharis Romero from BC came on stage and proclaimed proud Canadian sovereignty, and proceeded to open the show with the Canadian national anthem. The whole crowd of about 1000 stood in support, with a rousing standing ovation.
This was in Washington State recently. A border state.
This county…the largest and most diverse in the state, voted 84% for Harris.
NBC just aired a video implicating Elon Musk is working for Chinese government.
https://www.youtube.com/watch?v=fY9nngnNa4I
As Canada is a member of NATO, I wonder if they would be defended by other NATO members under Article 5 as Canada is one of the founding members of NATO.
Ovi, Malcolm and Jake start talking about Canada at about the 40 minute mark.
“My question is why was this leaked. Is this a warning for Canada and Greenland?” Ovi, there are so many questions. T’s behavior mostly parallels fascist and mob boss leaders of the early 20th century. T is dismantling the 80 years of institutions after WWII were a new economic order and international laws had replaced colonization.
The Mexican–American War,[a] also known in the United States as the Mexican War, and in Mexico as the United States intervention in Mexico,[b] (April 25, 1846 – February 2, 1848) was an invasion of Mexico by the United States Army. In the 1844 United States presidential election, Democrat James K. Polk was elected on a platform of expanding U.S. territory to Oregon, California (also a Mexican territory), and Texas by any means, with the 1845 annexation of Texas furthering that goal. Polk sent a diplomatic mission to Mexico in an attempt to buy the disputed territory, together with California and everything in between for $25 million (equivalent to $778 million in 2023), an offer the Mexican government refused.[9][10] Polk then sent a group of 80 soldiers across the disputed territory to the Rio Grande, ignoring Mexican demands to withdraw. Mexican forces interpreted this as an attack and repelled the U.S. forces on April 25, 1846,[13] a move which Polk used to convince the Congress of the United States to declare war.
https://en.wikipedia.org/wiki/Mexican–American_War
Malcolm Nance: Ukraine Defends Democracy | Jake Broe Podcast
https://www.youtube.com/watch?v=oHZWa-Ajbvk&t=21s
@Tommykey07- The United States is blessed to have Canada as a neighbor. The longest peaceful border in human history. Only an idiot would ruin that.
https://www.youtube.com/watch?v=DGOaf3ryWG4
5 minutes
Analysis of Trump’s decision to cut off Chevron’s ability to export oil to the USA
Will oil demand really peak before global production
https://ourworldindata.org/grapher/per-capita-oil?tab=chart&time=earliest..latest&country=IND~GBR~FRA
India oil consumption per person is increasing and why would anyone think they will not consume at least as much per person as France or the U.K.
India is currently building over 30,000km of roads.
https://www.constructionworld.in/transport-infrastructure/highways-and-roads-infrastructure/india-builds-101900-km-of-national-highways-since-2014/68838
95% of cars sold in India are petrol or diesel, because electric cars with a reasonable range are double the price of an ice car and not affordable for most.
India is consuming 4 times as much oil as the U.K. and has 22 times the population, it has a long way to go.
The list of countries increasing oil consumption is far longer than the list of countries that have peaked.
Things will get interesting in 2029 onwards. You may also want to research how many new runways, airports and terminals are being built around the world. That will not peak any time soon.
Yep on India- for example “Air India has placed a historic order for 570 aircraft, including 470 in 2023 and an additional 100 in 2024, to modernize its fleet and meet growing passenger demand, with deliveries starting in late 2023.”
Hickory
Not seen these figures before, truly extraordinary number of aircraft purchased by just one company.
You’ve shared some interesting links recently, thank you.
This one prompted me to compare BYD EV prices in India with Toyota ICE prices in India. It’s hard to know if a google search is representative, but your factor of 2x cost for EV seems to be a decent metric.
I can’t recall seeing recent updates to the relative mix of 2 & 3 wheel motorbikes vs. cars in India though.
Thanks
I am sure that India will increase oil consumption to around 15 million barrels per day, an increase of 10 million barrels per day.
When India reaches that level each Indian will still be using only 20% of the average consumption of someone in The United States.
I really don’t understand people like Ovi who don’t see consumption increasing.
Loadsofoil,
Consumption of crude plus condensate has not increased since 2018.
Dennis
The world had a pandemic which many countries reacted to with total hysteria. Vast numbers of people working from home cut fuel requirement for cars. You need to understand this saving has been done.
This year 80 million people will stop driving due to old age but 120 million will start for the first time. 85% will buy a new or second hand petrol or diesel car. This year 100 million people will fly for the first time. Next year and the year after the figures will be very similar.
The demand decline caused by Covid of 5 million barrels has already been wiped out.
https://www.energyinst.org/__data/assets/pdf_file/0006/1542714/684_EI_Stat_Review_V16_DIGITAL.pdf
This year average will pretty well equal 2018 average. Next year the 60 million new drivers and 100 million new fliers and 70 million new consumers will push demand to new highs.
There is plenty of spare capacity for the next 3 or 4 years.
Refinery throughput (proxy for C plus C demand) from Energy Institute. Perhaps India’s consumption eventually rises to 15 Mb/d, but note that China will relentlessly drive down the cost of EVs and eventually cheap Chinese EVs will dominate the Indian market for new cars. In China in 2024 49% of new car sales were plugin hybrids and BEVs, with BEVs accounting for about 30% of total sales. India may soon follow the Chinese example.
Also Americans tend to think of transportation purely in terms of private cars, due to cities being stunted by politics and the general lack of transit options in the country.
Things look different in the crowded South and Southeast Asia, where two- and three-wheeler sales are booming. If you’ve ever been there you know how loud the oil-based tech is, so cities have a huge incentive to replace them.
Another area of rapid growth of electric transportation is buses. There’s no range anxiety here, because routes are planned long in advance. Most electric buses are in China, but they are also spreading rapidly across other geographies as the technology matures.
As for cars, the future of the industry is Chinese and electric. China already produces about a third of all light vehicles worldwide and the government is all in on EVs. Change is coming faster than you imagine. The self-destructive antics of the current American government won’t affect this any more than a rain dance would change the weather.
Dennis
Your graph shows clearly how demand is still increasing.
Do you know how many ICE vehicles would have to be removed from the global fleet in just one year when production is declining by 1.5 million barrels per day in one year?
Loadsofoil,
If you draw a line from 2018 to 2023 you will find refinery throughput is less in 2023 than in 2018. So a 5 year period where demand has not increased. Some parts of the World may see an increase in consumption while others see a decrease.
China has started the trend to less consumption of oil for road transport. India will likely follow China’s lead along with the rest of the World. The cost of BEVs will be driven down to less than the cost of ICEVs and sales of new ICEVs will fall to zero. In 20 years the non-plugin fleet will be under 50% of the total passenger fleet.
Do you know how many ICE vehicles would have to be removed from the global fleet in just one year when production is declining by 1.5 million barrels per day in one year?
None actually. It’s enough for people to drive less, as the pandemic showed. I agree with the general idea that fleet demographics are a good rough predictor of oil consumption, but it isn’t very precise.
Art first used Norway as example that transition to EV does not lower fossil fuel consumption.
Actually majority of Norway electricity are all renewable hydropower, the reason behind is that the major consumption of fossil fuel in some EU countries is for other way of life, like snow-ice-sea sports entertainment, all these are like Elon Musk’s rocket — smaller but already readily expandable. The same for China and India, and you could see the snow covered mountains in northern China, Xingjiang and Tibet are all becoming crowded.
Every mountain in Switzerland is covered with fossil fuels — so easy to see the difference.
how could South Korea consume same amount of oil per capita as the US?
https://ourworldindata.org/grapher/per-capita-oil?tab=chart&time=earliest..latest&country=USA~KOR
Heads up.
CNBC radio, interview with Scott Sheffield, past owner of Pioneer (sold to Exxon). He was being grim.
Nearly a quote:
“Pioneer properties, our Tier 1 properties, will be empty by 2027. Our Tier 2 by 2032. The world is oblivious to what this means.” Lots of talk of “the twilight of US shale.”
One wonders how he got Exxon to buy. Maybe they won’t develop Tier 3 and let scarcity explode the price of their Guyana flow.
Thanks Watcher,
Is this what you are talking about?
https://www.cnbc.com/video/2025/03/11/pioneer-natural-ceo-scott-sheffield-on-trumps-tariffs-impact-on-steel-business-and-oil-prices.html
also
https://www.youtube.com/watch?v=JDsAb3Ebo3U
Dennis
Scott said that the drillers need $50/b to $55/b. I wonder if that was for a T1 well or T2. Any idea what the difference in $ is for T1 wells vs T2?
EXXON had in 2024 an ebit margin of round about 15%. Most of their income is oil and gas. So you can guess how deep the oil price compared to 2024 must fall to bring them to 0.
They will install cost cutting programs when this happens, and improve hedging – but I think this is the general overview how big their margins are in general.
Parts of cost cutting will be reduction of drilling…
Ovi,
No I do not know the EUR of T1 vs T2. My guess is that the 50 to 55 would be for tier one wells. My Wag would be that the tier 2 wells would need $70 plus to earn a marginal ROI (similar to investing in the S&P 500).
Also interesting that he clearly says Pioneer inventory of Tier one wells would run out by 2028 and Tier 2 by 2032. Also note he is saying $50/b in 2018 $, in today’s dollars that is about $65/bo.
https://www.dailymail.co.uk/yourmoney/article-14421387/warren-buffett-stock-market-401k-crash.html
And Warren Buffet and Berkshire Hathaway are sitting on 300 billion in cash and continues to sell off portfolio
Berkshire has a fiduciary duty to their clients to do what is in their best interest financially.
What does he tell the SEC?
“When asset prices plummet….we are ready to pounce on them……10 cents on the dollar”
WTI is down in the mid 60s. That corresponds to low 50s in 2019 dollars Have to wonder how much that retards shale drilling. It’s definitely near the decision point for marginal projects.
Not sure why it changed. Could be recession worries. Could be OPEC discipline worries. Or maybe even (Russia) “peace breaking out” worries . Or some off each. FWIW, none of the three have really happened yet. But markets are forward looking and betting Bayesian…so even worries move the needle.
And then the futures curve is also backwardated. So the markets are betting on even cheaper supply/demand in the future. Of course, they don’t have a crystal ball…but are putting money on the table.
Given that Trump has been unleashed and now has moron Musk advising him, the market thinks a World Recession is highly likely which would send oil prices down.
The relentless fall in battery prices will probably push oil prices even farther down. The battery industry is planning to produce four or five times as many batteries in 2025 as there is demand for, pushing prices even further down.
Oil is mostly used to store energy in a moving vehicle. Oil can’t compete in the energy industry per se, it’s much too expensive. That is why it is so rare in electricity generation. Oil primarily competes with batteries.
Battery prices have fallen 90% in the last decade. In situations like this, where the basics have shifted so far, it doesn’t make much sense to use the past as a predictor of the future. EVs are now cheaper than combustion engine vehicles. For example the VW ID3 is now being leased at €249 a month in Germany, and the comparable Golf still costs €399.
So it’s hard to see oil prices going up much.
Alim,
If oil is primarily competing with batteries and as you claim EVs are cheaper than ICEs, then why is world liquid fuel consumption increasing yoy and projected to continue increasing for the short term ?
https://www.eia.gov/outlooks/steo/report/global_oil.php
Oil prices are much more sensitive to economic outlook as Dennis is stating and geopolitical tension. Not EVs and battery prices, well not yet anyways.
ExxonMobil’s U.S. Oil & Gas Well Earnings Completely Dismal vs. NON-U.S.
This is in response to Eulenspiegel and others. For some odd reason, investors are overlooking the inherent weakness in Shale Oil Economics when compared ExxonMobil’s Foreign or NON-U.S. Upstream Earnings.
Not only is ExxonMobil’s Q4 2024 U.S. Upstream Earnings much lower than its Non-US, the company is spending more CAPEX to earn 4X less the Earnings… LOL. (Check attached image)
So, how do you explain to investors during Q4 2024, the investment of $3.2 billion CAPEX in the U.S. Upstream Oil & Gas Sector to earn only $1.2 billion compared to its NON-US Upstream CAPEX spending of $2.6 billion to earn $5.2 billion.
Thus, Exxon’s NON-US Upstream Sector Earned $2.00 for each $1.00 CAPEX invested, while the U.S. Upstream Sector Earned $0.40 for each $1.00 in CAPEX spending.
Sounds like a great deal…
steve
Do you know the production growth rate and oil gas mix? At least more than in your graphic?
Guyana is much lower cost than US shale.
Ovi, great post, as usual! (and thanks to Dennis and Ron too for keeping us updated)
One minor note though, my favourite neighbouring country Norway had a primary peak around the year 2000 or so at ~3,500 kb/day so the latest peak would actually be a secondary one, around/slightly above half the primary one.
Not that it matters much but anyway, it tells a story. Been harping about it for some time but still interesting in my view.
Laplander
Thanks. It was an earlier question by you that led me to hunt around for more info on Norway and came up with the S&P Global article. It will be interesting to see if a steady decline starts and will it be in the order of 7%.
I was aware that Norway had an earlier peak but failed to note that the recent peak was #2.
like Wilcox in Gulf of America, new peak for oil actually
In order to understand where oil prices are heading you have to understand what is happening with global trade realligment .
There will be 3 seperate areas of trade activities.
One is north america and australia. The tarrif rethoric is noise. In order to create this zone you have to break up some trade monopolies and tarrifs are the tool.
Oil prices will be supported with a help of Opec + not to go too high or too low in the next 2-3 years.
Also there are other issues : removing US dollar as reserve currency, introducing digital crypto into the banking system, deflating very gradually stock market and real estate. So oil price will be relatively affordable for consumers in nominal dollars.
Governments actually have very little say so in regards to what the global reserve currency is or will be. They can talk about it all day. Not much they actually do about it.
Crypto currencies aren’t really currencies. Banks are never going to accept crypto in mass as collateral for loans. There just isn’t enough crypto to go around and let’s not forget crypto is really just a pile of leveraged dollars that were used to buy crypto. If you were somehow able to kill the dollar. The value of crypto goes to zero with it.
Central bank digital currencies would also be a leverage play on US treasuries. Besides central banks aren’t currency issuers. Commercial banks are currency issuers. Central banks are just bank regulators.
The world has the US dollar confused with the Eurodollar. They are two different things. We are told time and time again that the US dollar is the global reserve currency. When in actuality it’s the Eurodollar.
Good luck with Eurodollar banks accepting any kind of crypto currency be it central bank digital currency or bitcoin as collateral to make a loan.
Using anything other than Eurodollars is like having and using an I-phone that doesn’t have any apps. Good luck hedging out your risk with no available apps.
Hint, the bank reserves that central banks already create aren’t used as collateral in the Eurodollar market. Central bank digital currencies are bank reserves.
Central banks don’t have the power to print actual useful money. What they print is more like a token at Chucky Cheeses. Only good, only used between banks.
Besides the Saudi’s wealth is denominated in dollars. Would it really be in their best interests for all those dollars to lose value or go to zero heaven forbid.
China’s reserve assets are denominated in you guessed it, US dollars. Decades of receiving US dollars for all the things they export. Would it be in their best interest for the value or purchasing power of their dollar denominated assets lose value or go to zero?
Hint, banks don’t need bank reserves created by the FED. Banks can create their own liquidity without any bank reserves involved. Commercial banks expanded the money via loans prior to 2008 without any problem. There was only about $40 billion in central bank reserves or the central banks balance sheet prior to 2008.
What matters is we have a growing energy supply that commercial banks can use to create money via loans. The idea that government policy or central bank policy will save us is miss placed.
HHH
Whatever you hear in media is spin.
Reality is different. Globalisation is finished in 2016 with the first T admin.
We have now dismentaling of global monetary system since 2 WW.
There will be new currency, new area of economic activity for north american currency.
Talk of Canada, Grenland, Panama canal all point to that. Oil will be produced and traded still globaly but the inflated economy of north america will have to deflate to reflact the global price of oil.
$65 price of oil will pull everything down: stock market, real estate etc
Not having an expanding energy supply will ultimately bring the price of everything including oil down. Price is a function of availability of currency.
The money supply expands when commercial banks create loans. Noticed I said create loans. The commercial banks didn’t have the money in their vault. They created the money out of thin air when they loaned it into existence. Money is literally destroyed when you payback a loan.
When you payback a loan plus interest the money supply contracts by the principal portion plus interest expense. The interest expense was never loaned into existence in the first place. Higher interest rates suck money out the economy faster than lower rates.
The system works as long as banks are creating enough loans to offset the monthly contraction as payments are made. Debt literally has to expand or it collapses. If the private debt fails to expand. The tax receipts go down making public debt unserviceable.
Low oil price, low oil production and low oil demand is where we are heading.
If you look over at China their internal demand is weak. They are 100% dependent on exports to drive their economy because they don’t have the internal demand to soak up what they produce. Who exactly is going to replace the demand from the US?
Who exactly will become rich enough to replace the demand from the US? The demand from the US will be going away as US consumer become poorer. And it will not be replaced with demand elsewhere.
Oh, and low interest rates aren’t stimulus. They are a sign of an unhealthy economy that is struggling to grow. Take a look at China’s bond yields.
And last but not least. Helicopter money doesn’t solve anything. It compounds all the problems that come with less energy.
Trump doesn’t have the power to dismantle the global monetary system. And neither does any other government leader. The Eurodollar evolved outside of any government control. That’s why it worked so well right up until energy became a problem in 2008.
The last thing governments want you to know is that they don’t have any control over the monetary system. Governments want you to believe that central banks are the monetary system and have complete control.
HHH
Once again you’re spot on. The problem is that most people believe what they were taught in school. They believe that the banks are only intermediaries between savers and borrowers and the government controls the supply of money. The reality is so perverse to that way of thinking they don’t understand that debt is money underwritten by energy. Even Ben Bernacke didn’t understand it.
Commercial banks create money through loans based on collateral that is ultimately the ability to repay which requires leveraging productivity using energy.
Instead people think there is some mysterious stock of money that everyone is competing for. The competition is actually for energy of which on a per capita bases means the US has dominated the system. Hence the Eurodollar system. So to replace dollar dominance would require a country or block of countries to out perform US consumption.
In a collapsing global economy this isn’t going to happen.
Just adding to the argument that people are ignorant to how economy works are the Trump trials over property evaluation. Absolutely the dumbest thing I’ve ever seen. First of all the case had no standing. Meaning there was no victim. The court’s argument was his loan diminished the prospect of other loans. Completely wrong.
Deutsche bank agreed to the loan value based on their own assessment of his properties combined with the fact that the man had cash flow. The real collateral behind the loan was Trump not the properties.
The reality is Deutsche bank printed the money out of thin air, just the way every other bank does, and they were very satisfied with the performance of Trump who paid it all back. There were no competing businesses that couldn’t get financing because that’s not how the system works.
However, the social cost of this lawfare is not unnoticed who’s going to trust the judicial system now they re obviously are ignorant of how the system work’s. Kevin O’Leary is absolutely right that he won’t do business in New York. Neither will I.
JT
WRT T. The question that needs to be asked is who signed the DB loan guarantees after no US bank would give him a loan. The only logical answer appears to be Russian Oligarchs. One night while watching TV a few years back, a person discussing this question said that was the only possible answer. If it could be proven, that would have a lot of implications.
HHH
I will be short.
You agree with me oil prices are going down in real value, almost a decade.
What we dissagree that western finincial system is bankrupt. Economy will recover but with a different financial system. But in short term there will be pain.
I don’t believe the idea that the US is going to onshore or near shore all its manufacturing is correct.
Mexico might have a very healthy demographic. What they don’t have is energy. 80% of Mexico’s electricity comes from natural gas. 90% of their natural gas comes from Texas.
How long is US natural gas going to flow to Mexico? Because without that natural gas there is no manufacturing base in Mexico.
I can go on and on. There will be some re-shoring of the manufacturing base. But most of it will continue coming out of China and elsewhere in Asia until China’s coal reserves are gone. So about 20-25 years for China. But China could ramp up coal to liquids which would shrink their coal reserves a lot faster.
The manufacturing base is just going to shrink and it will very much look like de-globalization.
Anybody counting on China to be mass producing solar panels 20 years from now is in for a rude awakening.
Mike S. makes a very good point, why drain America’s oil and gas first. From a strategic standpoint. Why not let China drain its coal reserves first instead of putting more pressure on shale gas by bringing manufacturing back.
20 years from now China won’t have the coal to mass produce steel and concrete. China will never come close to, not even remotely close to replacing its coal production with imports.
HHH,
you are right about coal and industrialization.
When I was visiting Argentina, I realized why south America did not successfully industrialize — one reason is they do not have vast good coal reserve.
Currently, China coal mining has reached close to 1km, while India only 50meter. There is little incentive for CHina to drill deeper, so they import more and started mining in Xingjiang and transport the coal over 1000 miles.
But, China just figured out the deeper coal have lots of coalbed methane than shallow coal, and it is expected the coalbed methane production could easily reach 10BCF/day in 5 years.
China imports around 10% of its total coal. Which equates to about 40% of all global imports.
Ten years ago those numbers were they import 6% of their coal. Which equated to about 15% of all global coal imports at the time.
China is going to de-industrialize over the next couple of decades.
And obviously they will use government stimulus to try to fight this. Which will keep production artificially higher than it should or otherwise would be. Which only means faster depletion.
Oil prices are still very high compared to the cheapest sources. That’s what keeps obviously stupid people like the Saudi family rich and able to blow billions on projects like NEOM.*
At the same time, oil is dirt cheap compared to its actual value in a pinch. The low price allows Americans to think it’s normal to drive ten miles in a three ton vehicle to buy a bottle of milk.
That gap is what allows expensive oil sources like shale to be tapped and then almost completely wasted on low-return uses like poorly thought-out transportation infrastructure. It also encourages the flaring off of more than a hundred million tons of natural gas every year.
The idea that there is an energy shortage or will be in the near future is based on the belief that the current system is anywhere near efficient in its use of energy. That is also the basis of the idea that money equals energy. You have to know how to convert energy to money to make that work. In other words, information is just as important to the economy, as energy, if not more important.
Heck look at Arabia. It was a dirt-poor backwater for thousands of years, not because of a lack of energy resources, but because of a lack of knowledge on how to use them. Information is the key.
If oil prices do go up, it will disproportionately damage those societies that are locked in to wasting oil by poor investment choices. If prices go down, it will damage producers, not consumers.
*To be fair, NEOM is much more likely to succeed and be profitable than a Mars colony, now being openly advocated by the American government. MBS gets his information about the modern world from watching Marvel movies, but he still isn’t quite as stupid as Musk/Trump.
HHH,
I think you misunderstood me.
There is no global economy anymore. Finito.
There is 3 very seperate economic and technological areas in very near future, lets say 3 years.
There is north american (canada, Us, grenland) with a addition of Australia.
There is China with rest of Asia, and there is Russia with eastern Europe. Western europe willl dissapear as viable economic area.
Most trade will happen within these zones.
Oil will be traded mostly within zones but some will be traded between zones. Exxon got order to pack up and leave Venezuela. That is a fact and it was done by American administration.
So that is a clue.
No point leaving Shale in the ground because you need for transition period. Yes its not that profitable but now we are in the end game.
No I understood what you said. The global economy is still alive and kicking. Even if parts are falling part like Europe due to lack of energy.
Europe is still exporting production. And here is the thing. Asia as a whole has to export. Europe as a whole has to export. There isn’t enough internal demand to soak up production and keep unemployment low without the exports you’ll see 30-40% unemployment across every country in Europe and Asia. Perhaps higher.
If you don’t believe global trade is still going on go take a look at the trade data.
Oil and gas producers have to export or keep it in the ground. Keeping it in the ground isn’t an option. They all need revenue.
I’m not saying global trade will go on forever. Soon as China runs out of domestically produced coal we will see a big drop in global trade. Not only from the Chinese manufacturing but also from the demand side. Think of all the minerals and materials and parts they import to produce finished goods.
China’s coal supply going away is a big deal that will lead to some de globalization.
Not going to happen in 3 years due to government policies.
Matter of fact, Chinese coal production going away will lead to mass unemployment not just in China. There are millions of people outside of China who’s jobs and livelihoods depend on China burning that dirty ass polluting coal.
Mass unemployment leads to a huge drop in demand for oil and oil products.
Makes me wonder how much global oil demand is a direct result from China burning coal to keep their export manufacturing base going. Every country that supplies China is burning oil to satisfy China’s needs for raw materials. Plus all the employees of all the companies supplying China use oil everywhere in their everyday lives.
Oil demand all because China has coal to burn. Oil demand that goes away little by little, year by year until the coal is gone. And like I said in an earlier post. China won’t be able to even remotely replace coal production with imports.
re-industrialization or industrialization is the only way to be alive for US, EU and China & India, Latin So America Africa too.
I remember 50 years ago when I was a kid watching TV first time and got scared by BBC broadcasting rainforest in Brazil, aka “Mother Earth’s Lung”, was burnt to grow economic plants. I was more scared then than the climate change scare now. As a kid, you could get more scared and excited as Greta Thunberg, and I have been ridiculed by my kids — “dad, stop researching killing mother earth”.
The Rainforest story pushed Brazil to drill and discover deep water Santos, and the Climate Change 25 years ago pushed China to industrialization and lead in EV while EU and US Japan deindustrialized. — Summarized by Chris Wright in the Ceraweek: What about the other 7 billion people? They want what we have. The other 7 billion people on average consume only 3 barrels of oil per person per year versus our 13. Africans average less than one barrel.
Horizontal Oil Rig Count from Friday March 14, 2025. Permian down 2 from last week and down 11 from one year ago and about the same as 7 months ago. Total US horizontal oil rigs unchanged from last week and down 6 from a year ago and up 12 from 7 months ago.
Big 4 is Permian, Williston, Eagle Ford, and DJ/Niobrara Basins where most of US tight oil is produced. Note that other basins besides the Big 4 have seen increasing rig counts from July 2024 with an increase from 52 to 82 horizontal oil rigs, while the Big 4 minus Permian have seen a fall in horizontal oil rigs from 90 to 79 over the same period (July 12, 2024 to March 14, 2025). So it may be worth watching the other Basins besides the Big 4 as there has been a 57% increase in horizontal oil rigs in those Basins over the past 8 months.
Permian Horizontal Oil Rig (HOR) Count and centered 52 week average, most recent 52 week centered average was about 291 and 12 months earlier was about 310 and 8 months earlier was about 298. Peak since 2021 was 330 rigs in December 2022.
Frack spreads up 2 from last week to 212 and down 57 from one year ago. Note that the frack spread count includes both shale gas and tight oil frack spreads.
Dennis
Thanks
The Permian has been very steady around 300 since the last quarter of 23. There has been a slow drop starting in Q2-24 to 287.
Couple of good links from Novi Labs on the Uinta Basin (Utah). Good basic primer on the geography, strata, companies.
https://novilabs.com/resources/urtec2024-unpacking-the-uinta-basin/
https://novilabs.com/resources/urtec-2024-unpacking-the-uinta-basin-the-next-great-oil-play/
I wrote couple of articles about Uinta along with Vaca Muerta,
https://www.linkedin.com/pulse/uinta-rise-us-lacustrine-shale-oil-lowering-gor-sheng-wu-dajoc
from start, no operator dare to drill in the low GOR region, and you could see first movers like Ovintiv/Newfield YPF/Chevron/XTL have much higher GOR in the 2~3 MCF/bbl, API 40~50. Then, the results show the lower GOR the better productivity. The best block in Vaca Muerta is now in the 300scf/bbl now, and in Uinta emerging formation is about 350scf/bbl, API under 35. In theory, and proven already in couple of good wells, the GOR could go as low as 50scf/bbl and API to lower 20s and still be productive —- this is different totally from LTO in marine shale oil.
right now,
https://www.linkedin.com/pulse/low-gor-black-shale-oil-news-from-vaca-muerta-rio-negro-sheng-wu-5fhpc
The EIA TRR for Vaca Muerta did not include any acreage currently producing with GOR under 300scf, and therefore missing the TRR oil by at least 100%, if not 200%.
On the other side, the real dry shale gas is not that good, at least not as good as the condensate and wet gas part in VM.
So, EIA might overestimated the TRR shale gas in VM, by up to 50%
https://www.linkedin.com/pulse/comparing-vaca-muerta-shale-oil-gas-best-us-patches-production-wu-tw42c
Good article on the Uinta, Sheng Wu. I would add that the waxy crude from the Uinta is nearly free of contaminants, such as sulfur and all toxins, and that it has a much lower gravity than marine shale oil–both attributes that should make it more valuable than it is.
It’s not clear to me how they’re getting such nice EUR’s with low GOR’s. Shale oil is almost uniformly considered to be a solution gas drive system. With so much less NG, you would think these Uinta wells would hit the wall at an earlier point. Maybe deeper, and at higher reservoir pressure?
It would appear from current isopach that the fluvial/lacustrine system that resulted in the Uinta was much larger than previously thought. Your comment was incisive: this is the only producing lacustrine shale system in the United States.
Gerry,
After I saw the surprising good production from these low GOR & API shale laterals in China (I actually helped translate and co-author a paper presented in URTEC 2021 about a low GOR yet productive lacustrine shale lateral in China, and I was puzzled) and Vaca Muerta (most think it is marine like Eagle Ford, but the oil GOR and API and wax all point to hypersaline Lacustrine, similar to Wilcox GOA) especially in 2023, and learning the bubble point death model by Scott Lapierre, I came up with a model for highly productive low GOR black shale oi, see youtube
https://youtu.be/2wwoUOT4rGE
— still very few believe in this, but so far all results in Uinta, VM and China seem to prove that this model works. But, to be productive, you need high pressure, LTO marine shale oil too, and correct maturity too. In China, and the part of VM with little GOR & API, most tend to believe that the maturity is too low, and porosity non-existent to under 3%. In reality, there is plenty of porosity, and it is correlated with overpressure (the XCL found out similar results). I remotely logged a low GOR&API (50scf/bbl, 21deg API) shale gas well in China’s Permian hypersaline Jimusaer Lacustrine in 2021and the isotope-maturity actually is the same as the Permian in Midland with GOR&API at 800scf/bbl and 41deg.
Uinta still have shallower formation that might have similar VM low GOR&API waxy patches, and the Paradox basin might also have similar lacustrine shale oil.
Gerry,
I think there is a little more than meets the eye. The Uinta oil is really a medium density black oil, as opposed to many LTO’s which are volatile oils. The waxy nature of the oil points to the type of species that formed the kerogen, which depends on the deposition environment and subsequent classification type. Type I and II are more oil prone and can contain more membrane lipids and aliphatic bio-polymers which tend to be present in higher concentration in the oil as aliphatics (paraffins), the higher MW types being waxy. An assay of the crude oil should be able to determine the PNA
(paraffins, naphthenes, aromatics) and the SARA (saturates, aromatics, resins , asphaltenes) of the atmospheric residue(> 375 deg C).
If you compare the Uinta crude with others such as Nigerian Bonny Light you will see that the vacuum distillate has a high pour point and the diesel cut a high CFPP.
https://ts.totalenergies.com/wp-content/uploads/2021/07/BONNY-LIGHT.pdf
Such a crude is good for fuels refining as the the waxy VGO is good feedstock for FCC units (gasoline) or hydrocracking (diesel, jet, lubes). Hydrocracked naphtha is particularly good reformer feed. The is one crude that the US should NOT export.
Thanks for the explanation, Carnot. Fascinating and very informative. This Uinta basin is even more unusual and valuable than I imagined.
Found this on Uinta, the resource is not very large maybe 500 to 700 million barrels (for context the US input to refineries is about 5840 million barrels per year so this is only about 12% of US crude input to refineries.)
https://www.huffpost.com/entry/texas-oilman-jim-finley-utah-oil-boom_n_65aaa010e4b041f1ce65d0a1
Excerpt from end of article:
The retired industry professional argued that if the state of Utah were thinking strategically, it would develop the basin’s unique resource over time and keep it in the state.
“The path they are on, right now, is to ship all of our good oil out of state. What are we going to replace it with in 20 years?” the retired professional said. “Finley, he’s really doing a major disservice if people would think through it.”
This sounds like a familiar argument from another oil pro, one which I think makes sense.
To DC on the Uinta: Yes, the Utah bunch finds itself with a high-powered problem. Anyone could see–from a distance–that the best approach would be to produce this very unusual, precious oil at a slow pace and run it through the local refineries in SLC at such a pace to provide niche products. This would avoid most transportation issues, which are awful. For example, I have long been a fan of the Book Cliffs, which is the longest escarpment in the world, so named because looked at from afar appears like a great library. There are lots of Darwinian examples there on the Colorado Plateau encircled by the Book Cliffs (only place in the world for certain species of bird, etc). In the photo of the tanker train in the article you attached, the train is beneath the Book Cliffs. I have spent a lot of time in that area–it’s hauntingly beautiful. A train spill would be environmentally horrible. Trucking is almost as bad. It’s the best blending oil in the world but also too “good” for this sloppy purpose. Like I said, a high-powered problem. If they played this right they would receive a premium for the Yellow Waxy. I doubt they will. Crescent Point had a large position and they were good stewards of their acreage; however, they sold out for a half-B, which was pocket change due to what’s happening up there. Wouldn’t you know, the greatest oil in America, land-locked, being fought over in order to develop it just as fast as humanly possible. Just mind-blowing.
Carnot,
The lacustrine sourced oils usually are waxy (90% have wax level over 10%) while 99% marine sourced oils have wax/paraffin below 8%. In UINTA,it is probably the highest wax to over 40%.
The transportation cost for ultra-high wax is higher even with pipe lines, so the economics are not that good, and export oversea is even worse in terms of economics.
Similar high wax and low sulfur oil from Daqing, China also command the highest price, even higher than Bonny Light, according to oilprice.com. Japan had a long term contact for Daqing oil, and export to Japan did not stop till 2014. Also, in China’s Bohai bay, lots of shallow medium-heavy oil also have low sulfur, medium low wax and they have high content of cyclic saturated which could produce high grade kerosene for aviation and lubricant under high temperature cycles. Conoco-Philips has a 50% interest in one of the largest field, and it is also the field with the largest profit margin within COP.
US is also importing Vaca Muerta shale oil, and first shipment was heading to US, and probably it is due to the unique lacustrine sourced oil property.
Norway zero emissions for transport. 😂
https://elbil.no/english/norwegian-ev-policy/
Not sure if one should laugh or cry.
https://www.norskpetroleum.no/en/production-and-exports/exports-of-oil-and-gas/
Norway has incentivised the purchase of electric cars with all sorts of subsidies. How has it been able to afford to do that? Crude oil and gas exports make up 61% of Norway export revenues, 30% of gas consumption in Europe comes from Norway.
How does China sell so many EVs, it does so with massive subsidies.
https://www.csis.org/blogs/trustee-china-hand/chinese-ev-dilemma-subsidized-yet-striking
China is able to subsidise the electric vehicles by burning 4,800,000,000 tonnes of coal which is the cheapest form of stored energy in the world. India knows that in order to become richer it will also burn its coal reserves. It has publicly said it intends to double coal production.
There is no energy transition, just a very public veneer over lots of very dirty coal and oil.
Unfortunately, if there´s a buck to be made, or perhaps a possibility of a small step up the ladder it will be done, sad but true. Definately prevalent in “lesser” developed countries but also very common in “highly” developed countries, but by different means,
I´m pretty sure Ola knew the party would end eventually so hedged accordingly.
(Still likes Norway thuogh)
Do Americans really understand how much oil they use and why?
https://energynow.com/2023/09/infographic-oil-consumption-per-capita-energyminute/
I don’t mean knowing how much I mean actually understanding why so much is used. Some people here casually declare that China can reduce oil consumption or India can almost bypass oil and go straight to renewables.
How about Americans? I don’t see much change in oil consumption in the last 10 years.
https://ourworldindata.org/grapher/oil-consumption-by-country?tab=chart&country=USA~IND
Oil consumption under Biden 2022/2023 was higher than under Trump first term, that says a great deal about how difficult reducing consumption is.
Any chance of preventing global climate catastrophe would require America to reduce oil consumption to 5 million barrels per day by 2035 at the latest. That level of consumption would still be 3 times what the average Indian uses.
Loadsofoil,
See
https://www.eia.gov/dnav/pet/hist/LeafHandler.ashx?n=PET&s=MCRRIUS2&f=A
Crude input to refineries in 2018 was 16969 kb/d and in 2024 16224 kb/d.
Dennis
Please see
https://www.eia.gov/tools/faqs/faq.php?id=33&t=6#:~:text=Although we use petroleum product,7.39 billion barrels of petroleum.
And anyway in order for global temperatures not to hit 3c higher Americans still need to use about 5 million barrels per day by 2035. This would allow people who use only a fraction of what people in America do,to use a little more. After 2040 average consumption per person should be less than 2 barrel per year. Which for America would be about 3 million barrels per day.
Loads of oil,
The 20 Mb/d estimate includes LPG and other products, the “oil” that is refined into products is primarily crude oil and the important products created from crude are gasoline, diesel, and jet fuel. In 2018 US consumption of these products was 15187 kb/d and in 2024 consumption was 14428 kb/d.
See
https://www.eia.gov/dnav/pet/pet_cons_psup_dc_nus_mbblpd_a.htm
I agree the US should use less, but most US citizens don’t agree with me.
Also using Energy Institute data for World, in 2019 consumption of gasoline, distillate fuel, and jet fuel was 59980 kb/d and in 2023 was 59917 kb/d. Numbers for 2024 will be available in late June 2025, perhaps in 2025 demand increases as some suspect, time will tell.
On Coal and Oil and Nat Gas consumption- yes the global population ability to fund the extraction and combustion has not yet peaked.
I have stated previously that the Peak Global Combustion Day will be July 27th in 2034, or perhaps 2037.
Roughly.
It won’t come as a result of good intentions, or for a failure of trying to set new records of ignition.
It won’t come as a result of deliberate human turning away from all things metal and plastic and ballistic and digital.
It will simply come to pass as a result of the finite nature of the resource.
Perhaps I underestimate the insatiable demand and ability to fund the extraction of the marginal EROEI deposits, and peak combustion day will be just a little later on.
Note. It is true that the nuclear/hydro/’renewables’ are basically piggyback riders on fossil fuels,
but it also true that once they get going (constructed) they more than carry their own weight to a considerable degree. And that is why people around the world eagerly deploy them….especially those who don’t have plentiful or cheap domestic sources of the fossils, or who have foresight about the ramifications of peak fossil supplies.
Oh, and then there is that little issue the big chemistry experiment related to mass combustion. Peak atmospheric CO2 concentrations won’t come until after 2100, since the long effective half life of clearance results in accumulation. Hope you and your country are well insured.
Yes, your latter point is tragically correct.
In this case, I think ‘well insured’ means something different than what it means today for Allianz, Prudential, etc
In the case of the consequences of climate change, I would suggest that well insured means that you and your country:
1. Can absorb or avoid being overwhelmed by the 1B+ climate refugees that will flee their current homes
2. Can stay warm enough in the winter or cool enough in the summer to live.
3. Can manage retreat from critical coastal infrastructure or, even better, don’t have a significant amount of such infrastructure.
4. Have the military might to serve as an effective deterrent, and/or steadfast allies.
5. Can maintain sufficient agriculture to feed yourselves in light of the changes to the hydrologic cycle and temperatures.
6. Can maintain a cohesive social infrastructure to weather the growing tensions.
7. Can maintain a cohesive physical infrastructure to weather the natural and man-made disasters. There’s a side range here including energy, medical, transportation, etc
I’ll try to mirror your understatement and just say that it is going to be a bumpy ride….
Very well said T Hill. Of course effective ‘insurance’ is impossible to achieve against this kind of risk. But the attempts need to be made and it will be incredibly expensive….just getting started.
On #3 I’ll add that its not just coastal regions at risk, but all river floodplains. Floodplains that people all over the world are learning are much wider than previously understood, the hard way.
“Over the next 30 years, due to the impacts of climate change, an additional 1.2 million residential properties, 66,000 commercial properties, 63,000 miles of roads, 6,100 pieces of social infrastructure and 2,000 pieces of critical infrastructure will also have flood risk that would render them inoperable, inaccessible, or impassable,” the report says.
“The study, which evaluated flood risk to infrastructure including airports, hospitals, fire stations, schools, roads, residential and commercial properties, found that in addition to the 25% of all critical infrastructure at risk of becoming inoperable today, 23% of all road segments throughout the country are at risk of becoming impassable. An additional 20% of all commercial properties, 17% of social infrastructure facilities like schools, and 14% of all residential properties also face operational risk, the report found.”
https://www.usnews.com/news/national-news/articles/2021-10-11/flooding-threatens-25-of-us-infrastructure-study-says
Hickory,
I haven’t seen the proprietary information behind the first street analysis, but have read through their public information and looked at their results. My sense is that their flood risk work is more accurate for larger basin, areal river flooding than it is for flash flooding related impacts. As an aside, it’s the flash flooding that can be truly terrifying. I think their work is also OK for inundation limit prediction in larger basins but has limited utility in characterizing the impacts on any given piece of physical infrastructure. That’s not necessarily a knock on their approach as much as an indication of the complexity involved.
That said, the scale of their results looks to be reasonable (unfortunately). Analysis of large networks has some inherent shortcomings relative to any individual physical asset, and an analyst of such systems can only hope to achieve a result that hits a representative average of the uncertainty distribution.
DC,
If you’re reading this one, I’ll point to my second paragraph here as one of the reasons why I like your general analysis approach. In my experience, you can be familiar with the performance of scores, hundreds or thousands of physical assets and still draw flawed conclusions from what is essentially anecdotal information if the larger system includes tens of thousands to hundreds of thousands of assets. Your approach from a very large scale helps mitigate this one particular challenge.
Thanks T Hill.
CH4 ppm
Hey Hickory,
Is your 2034 to 2037 estimate a simple judgement call, or are relying on some particular analysis results?
FWIW, this timeline plus a bit (5-10 years) of error bar mostly on the back end seems reasonable to me based on various population trends, resource availability, net energy, geopolitics and economics.
I offered this up in some jest and more to stimulate people to think for a second about the big picture, knowing that being accurate in this kind of prediction is impossible.
However I have looked hard at the available charts on the trajectory of global combustion and reserves, and have watched the global human experiment for quite awhile. So I consider my estimate to be more than just ‘out of the blue’.
There will be day in the 2030’s when Peak Global Combustion (all fuel sources) happens.
If we knew when we could plan a global moment of silence, or perhaps people being people (Homo pyromancer) would choose to have a bonfire and BBQ instead.
Nonetheless, after peak day there will be a big fat tail of combustion that burns on for the rest of the century.
Everyone… I am gathering some statistical data or at least trying to. I got this from AI on the web:
“In 2023, the United States produced approximately 8.32 million barrels per day (bpd) of tight oil, which is about 64% of total U.S. crude oil production, highlighting the significant role of shale oil in the nation’s energy landscape.
Worldwide, deepwater oil production, defined as water depths of 400 meters (1,312 feet) or more, is expected to reach 17 million barrels per day by the end of the decade, growing from 10.4 million barrels per day in 2022. “
Adding these two and the minuscule amount of shale oil produced outside the USA, that means about 19 million barrels per day of unconventional oil is produced. That would mean that worldwide production of conventional oil stands at about 62.7 million barrels per day, give or take half a mb/d.
But that doesn’t help me a lot because I do not have yearly production numbers for shale and deepwater oil.
Does anyone know what year conventional oil peaked? That is world oil production minus deepwater minus shale production?
Ron,
I don’t consider deepwater oil as unconventional, just tight oil and extra heavy oil. I don’t have data on World deepwater output, but if you add up Mexico, Brazil, US Norway and UK that probably covers most of the deepwater production (some of this will be shallower shelf production and I don’t know where to find the data).
Deep water drilling
https://www.woodmac.com/news/opinion/global-deepwater-production-to-increase-60/#:~:text=Deepwater%20is%20the%20fastest%20growing,pass%2017%20million%20boe%2Fd.
Global 12 month moving average for oil production is just under previous 12 months moving high.
2025 will see demand for C&C hitting new records.
USA Deepwater Oil Production ib thousand barrels per day, 1985 thry 2023
World oil production, January 1993 – November 2024. C+C in barrels per day.
Ron – Maybe look at the statistical review and exclude North America from totals? My general opinion is that peak was 2012 (centered). Some consider 2000-2020 as a bumpy plateau, I’m not sure about that…Anything after 2010 should also be checked for LPGs as they skew the numbers:
https://www.energyinst.org/__data/assets/pdf_file/0006/1542714/684_EI_Stat_Review_V16_DIGITAL.pdf
Thanks for the link Kengeo, I can use that. I agree with your opinion.
Ron – Excluding North America, global crude production grew about 6/10 of a percent annually and peaked in 2016. From 2016 on its been declining by 7/10 of a percent each year, or 0.5 mbpd for past 7 years. To match the 2016 peak, we’d need all the countries to stop declining and then we’d need OPEC+ to increase production by 3 mbpd. If even possible, it would likely take over a decade to achieve…however without considerable growth in 1P reserves, a best case scenario is that global production might be half of what it currently is, so not looking like the peak from 10 years ago has any chance of being challenged…
Kengeo,
I disagree. I would guess the odds are about 2 in 3 that a new 12 month peak C plus C will be achieved, probably as early as 2026 and my guess is the final 12 month centered average peak will be in 2028, but only 1 in 4 odds that will be correct, the final World C plus C peak might occur in 2027 or 2029, perhaps a 50% probability it will be between Dec 2026 and January 2030.
Excluding North America????
Kengeo,
No excluding North America, I don’t think there will be a new peak.
Scenario below for whole world C plus C, annual decline is about 1.5 Mb/d from 2030 to 2050 for this scenario.
Ron
You could draw a line from 1998 to 2002 and you would get a downward trend.
You could draw a line from 2004 to 2009 and also get a downward trend.
A line from 2021 to 2024 is a very steep upward trend.
I think we need at least 3 consecutive years of falling production without a pandemic to start to call peak oil.
Another factor is also needed. Consistently rising oil price which indicates that there is a latent demand which is greater than what can be supplied. Increasing by $10 per year would be a good starting point.
Loads, I am not making predictions with that chart, just drawing lines. I was shocked that the increase from 1993 through 2020 was that lineiar, if you iron out the bumps and dips. And of course we will need at least five more years to know if we actually have a peak. I don’t doubt that we will have an increase in production from today. Just how much of an increase and for how long will it last is the question.
Ron
This is what the IEA said.
“There you have it – crude oil production peaked four years ago. Now, that’s conventional oil. The IEA’s current scenario suggests “production in total does not peak before 2035, although it comes close to doing so.”
https://earthbound.report/2010/11/11/iea-peak-oil-happened-in-2006/#:~:text=This%20year's%20World%20Energy%20Outlook,but%20that%20includes%20unconventional%20fuels.
Wow! Thanks Ovi, I did not know that this report existed. I have been two busy lately with other projects to keep up. The line from about 2008 to 2035, without natural gas liquids and whatever they consider “unconventional oil”, is flat level, no increase. And of course, crude oil fields “yet to be found” is always suspect.
Ron
I just happened to remember that report because it raised a big fuss. Just did a search for IEA states pekoil occurred in 2006 and up it came. Google is amazingly
Ron
This is what the IEA said.
“There you have it – crude oil production peaked four years ago. Now, that’s conventional oil. The IEA’s current scenario suggests “production in total does not peak before 2035, although it comes close to doing so.”
https://earthbound.report/2010/11/11/iea-peak-oil-happened-in-2006/#:~:text=This%20year's%20World%20Energy%20Outlook,but%20that%20includes%20unconventional%20fuels.
I see Harold Hamm agrees with me. I assume his company has a lot of Tier 2 and Tier 3 acreage.
Last quarter of 2024 refinery throughput higher than the average of 2018.
https://momr.opec.org/pdf-download/res/pdf_delivery_momr.php?secToken2=accept
Good chance these cheap prices will spur on increased demand to new highs
Loadsofoil,
Perhaps, but note that prices are low because demand is not robust, if demand increases as you suggest oil prices might increase, but the trade wars initiated by Trump are likely to dampen World demand for oil and lead to lower prices which will lead to slower development of oil resources and slow or no growth in output.
We will see what happens, but Trump’s chaos is not likely to be good for business, odds are much higher for a World Recession than before Jan 20, 2025.
Dennis
Demand is not that bad considering fuel efficiency and 17 million electric vehicles sold. Increased by a million barrels per day last year.
At the moment oil is being over produced, quite the opposite of what peak oil people predicted.
If jobs come back to the States it can only be good for Americans, paying for Chinese goods just make China rich.
Loadsofoil,
Yes it would be nice if jobs came back to US, but note that if wishes were horses, beggars would ride.
Tariffs often lead to World War, or the tariffs of the late 19th and early 20th century certainly did. Trump’s policies are patently unwise. Yes oil is being overproduced because demand has been growing very slowly for the past 6 years, this slow demand growth was not predicted by many. My guess is slow growth from Jan 2025 to December 2028, an average annual growth in oil demand (where oil=C plus C) of about 450 kb/d, after that I expect no further growth in oil demand at the World level.
Dennis
Tariffs caused ww1 and ww2?
That is an utter simplistic view of what happened before Ww1. Ww1 was much more to do with who ruled various countries in order to have access to vast oil, mineral wealth and land to grow food.
Germany and Britain both could not feed themselves or had any known oil at the time.
There were few tariffs before WW2.
Your own graph show C and C demand increase by a million barrels per day last year. I doubt it will fall to zero in just a few years. Peak will be a geological issue.
Unlike you I don’t flip from saying it is a demand issue to a geological issue a back again whenever it suits. Sometimes you like an oil refinery blend the two that no one is sure what you believe.
There were few tariffs before WW2.
Never heard of Smoot Hawley I guess.
Anyway have a look at this chart. WWII marked the end of tariffs.
https://en.wikipedia.org/wiki/History_of_tariffs_in_the_United_States#/media/File:Average_Tariff_Rates_in_USA_(1821-2016).png
Loadsooil,
It is never clear whether it will be supply or demand for oil which will be more important.
I shift my thinking depending on the relative price of oil (in inflation adjusted dollars) over time.
Recently (compared to 2011 to 2014) oil prices have been relatively low (2022 was exceptional due to Russian invasion of Ukraine). If oil prices continue to be relatively low, this suggests lack of demand for oil is the primary reason for the slow growth in C plus C output from 2018 (83 Mb/d) to 2028 (where my forecast is 83.7 Mb/d), so an average annual increase of about 70 kb/d over that 10 year period. Perhaps oil prices rise sharply when oil output begins to decrease, but the rate of decrease would be slowed if oil prices rise (as more of the resource will be profitable to produce).
It is impossible to predict with precision what future supply and demand will be and there are many different viewpoints on how things might play out.
As the facts change over time my viewpoint adjusts, just the way I am wired.
On Tariffs see
https://en.wikipedia.org/wiki/Smoot–Hawley_Tariff_Act
A Republican president, (Hoover), a Republican senator, (Smoot), and a Republican congressman, (Hawley), got us into the Great Depression by their stupid financial policies, (tariffs). Our current Republican president along with a Republican controlled House and Senate will get us into another one. Tariffs are the dumbest thing that ever came down the pike.
Smoot was a Republican from Utah and chairman of the Senate Finance Committee. Willis C. Hawley, a Republican from Oregon, was chairman of the House Committee on Ways and Means.
“If jobs come back to the States it can only be good for Americans”
On the other hand, globalization of supplies and labor results in lower priced items all around which is helpful to the average person. Would you gladly pay double for your shoes or jeans, or an extra 10K for a vehicle knowing that you were supporting a worker somewhere on this continent rather than another?
Its not a simple equation , even though we would like it to be.
The way we are now working towards towards reshoring will result in a smaller overall pie. The powers that be don’t mind since getting rid of the ‘dead wood’ is part of the longterm plan.
Hickory
Have you thought of the final price we are all going to pay for a powerful and savage country that has made it clear it will take Taiwan by force?
China is only able to do this because it has grown rich by greedy western business closing hundreds of factories in America and Europe. Millions made unemployed fighting over jobs that in real terms paid less and less. Hundreds of billions of dollars and Pounds have financed a massive Chinese military that is already pushing out into neighbouring islands.
I buy home made clothes and they are not double in price but also last far longer.
Lots of people have been fooled by the global trade propaganda that it exists for the benefit of working people.
https://www.amnesty.org/en/location/asia-and-the-pacific/east-asia/china/
“take Taiwan by force?”
Of course. I recommend the book ‘Chip Wars’, btw.
Taiwan Semi is the most important company and getting some of that expertise and industrial muscle deployed in the US and other locations is the most important industrial policy we could implement. Its a decade long project to accomplish some of it.
I would not trust the US to protect myself from China, if I was Taiwan.
Try not to make this globalization issue a simple black and white one…big huge grey zone exists in regard to pros and cons of various policy choices.
Production peaks for 2007 / 2014:
How much spare capacity do you think OPEC+ has
Loads of oil,
My guess is about 2.5 Mb/d spare capacity for OPEC plus. Not clear how much more demand will grow.
If we assume the average passenger vehicle gets 30 MPG (US gallon) and drives on average 12k miles per year, then the average vehicle uses 9.5 barrels of fuel per year. A decrease in output of 1.5 Mb/d is about 547 Mb per year so about 547/9.5=57.6 million ice vehicles would need to be removed from the road on average each year. In Dec 2024 the annual rate of sales for plugin vehicles was about 23 million and the rate of annual growth was about 26% in 2024.
If the 26% annual rate of sales growth continues until 2030 then annual plugin sales increase from 17 million in 2024 to 68 million in 2030. Also we will see heavy duty trucks switch to natural gas (already occurring in China) and to EVs for short haul and long haul will be covered by trains which are for more fuel efficient than trucks and can also be electrified if needed. If oil supply becomes short, prices will rise and will accelerate the transition due to higher profit incentives for non-oil fueled transportation.
Dennis
It really depends on how much Saudi Arabia have maintained their spare capacity.
https://www.reuters.com/business/energy/factbox-opec-saudi-spare-oil-production-capacity-2024-01-30/
Between OPEC and the others there could be 5 million of spare capacity, more likely between 3 and 4. We will find out around 2028.
If aviation consumption increases anywhere near the increase in the last 3 years then 30 million electric cars will have to be sold each year just to stay still.
Loadsofoil,
For air transport the last 3 years was recovery from pandemic downturn, so not a great predictor of future growth. From 2010 to 2019 the average annual rate of growth in jet fuel consumption was 197 kb/d. Long term average annual rate of growth in jet fuel consumption (1985-2019) was about 80 kb/d per year.
My capacity estimate is for OPEC Big 4 (2500 kb/d) is based on the 2022 peak in 12 month average output of crude oil compared to March 2025 output. There might be a bit of capacity for Russia, but unclear how much, perhaps 500 kb/d at most once OPEC plus starts producing all out. Big 4 OPEC producers are Saudi Arabia, UAE, Iraq, and Kuwait, the surplus capacity numbers often reported by EIA and other agencies are not realistic. I base my estimates on historical 12 month average output. One month numbers are just not important, sustainable capacity is what matters in my opinion.
I agree we will know more in the future, perhaps spare capacity could be higher if oil prices return to $100/b in 2025 US$. I long held the view that oil prices would return to this level, but I have been wrong for most of the 2015 to 2024 period (with the exception of 2022). It seems oil prices ar stuck in the $60 to $75 per barrel range for WTI (about $4/b higher for Brent), I expect this price level will continue until 2028 unless there is an all out Middle East War or World War 3 due to Trump/Putin missteps.
Dennis
IATA has global aviation increased last year by 9 billion gallon.
You are correct it was only an increase of 5 billion more than 2019.
That is still the equivalent consumption of about 17 million cars. That is all the electric cars produced last year just made up for the increase in aviation consumption.
I agree spare capacity must be sustainable for more than 90 days, so I do not think 5 million barrels per day is correct.
What was the highest OPEC output to be sustained?
Loads of Oil,
The important number is sustainable capacity from OPEC Big 4 because all other members are not restricting output. See most recent OPEC Post, Big 4 chart where Big 4 is Saudi Arabia, UAE, Iraq, and Kuwait. Peak 12 month average output for Big 4 was in 2022 at 20849 kb/d and February output for Big 4 was 18339 kb/d, the difference is 2510 kb/d and that is my estimate for OPEC spare capacity.
Note that I disagree that the 90 day average is a good metric for sustainable capacity, 365 day average is a better metric for what is sustainable in my view,
here is a long story short about history of crude refinery and US president affectionate with Russia,
In history, there are several presidents who were like Trump — Russia spy like
The most famous is Roosevelt, and after he was elected, his domestic policies are like communists, and he also established formal relationship with USSR, exported lots of technology along with skilled workers to USSR.
A graduate from MIT stole the refinery tech and help USSR refine diesel and aviation fuel, and got several dozen tons of gold from Stalin. Later, at the II WW, the German tanks and planes using gasoline got frozen at Moscow, Stalingrad and Lenningrad. Today, the MIT graduate family funded the anti-climate change, and probably behind Trump, Wright .
Later his successor, Truman, was hated by mainstream media, and labeled as pro-communist, the KMT from China and first President of Korea Lee, used USAID $$ to fund his opponent, Dewey? On the night of election, main media papers already printed as “Dewey Defeats Truman”
Truman stopped KMT to help Korea war , and forced Korea Lee to sign the truce with communists. So, today neocons from Taiwan to Korea to West still believe the Korea war was stopped by the Trump like Truman.
Roosevelt cut Churchill out of several meetings with Stalin.
He encouraged people to refer to Stalin as Uncle Joe, even though he knew Stalin ordered the murder of thousands of Polish officers. Their hands tied behind there back and taken in small groups into an underground room where they were shot in in back of the head.
He also had evidence of the starvation that Stalin ordered in Ukraine where one million men women and children starved to death.
USAID
was established in 1961
forgot a space, “US AID”, but similarly the same
If YouTube had been around when I was young, I would be a whole smarter than I am today.
the unsustainable green transition
Ron
This is a good round up of where were are. Thank You. Michael Michaux will sure upset some people on this blog, but he is only repeating what Hideaway keeps pointing out.
Resource depletion is probably the main threat to mankind.
Not just a main threat, but approaching at breakneck speed…the 5 largest oil producing regions only have reserves for about another 10 years or so…
Estimated Remaining Reserves in the Five Major Basins:
1. Ghawar Field (Saudi Arabia): ~60 Gb barrels 
2. Permian Basin (USA): ~80 Gb barrels
3. West Siberian Basin (Russia): ~60 Gb barrels 
4. Rub’ al Khali Basin (Saudi Arabia, UAE, Oman, Yemen): ~70 Gb barrels
5. Maracaibo Basin (Venezuela): ~50 Gb barrels
Ron used to talk about enhanced oil recovery techniques ( I forget the term, I think “creaming” or something).
These guys have been using those techniques for awhile now.
And allegedly that reduces the amount of oil you can produce.
I never see anyone talk about this anymore.
Totally out of my qualifications.
Venezuela has a lot more reserves than 50Gb albeit difficult to produce (Orinoco Basin).
“we don’t care, we’ll do what we want.”
who could that possibly be?
New Posts are up
https://peakoilbarrel.com/opec-update-march-2025/
and
https://peakoilbarrel.com/open-thread-non-petroleum-march-20-2025/