By Ovi
The focus of this post is an overview of World oil production along with a more detailed review of the top 11 Non-OPEC oil producing countries. OPEC production is covered in a separate post.
Below are a number of Crude plus Condensate (C + C) production charts, usually shortened to “oil”, for oil producing countries. The charts are created from data provided by the EIA’s International Energy Statistics and are updated to March 2024. This is the latest and most detailed/complete World Oil production information available. Information from other sources such as OPEC, the STEO and country specific sites such as Brazil, Norway and China is used to provide a short term outlook.
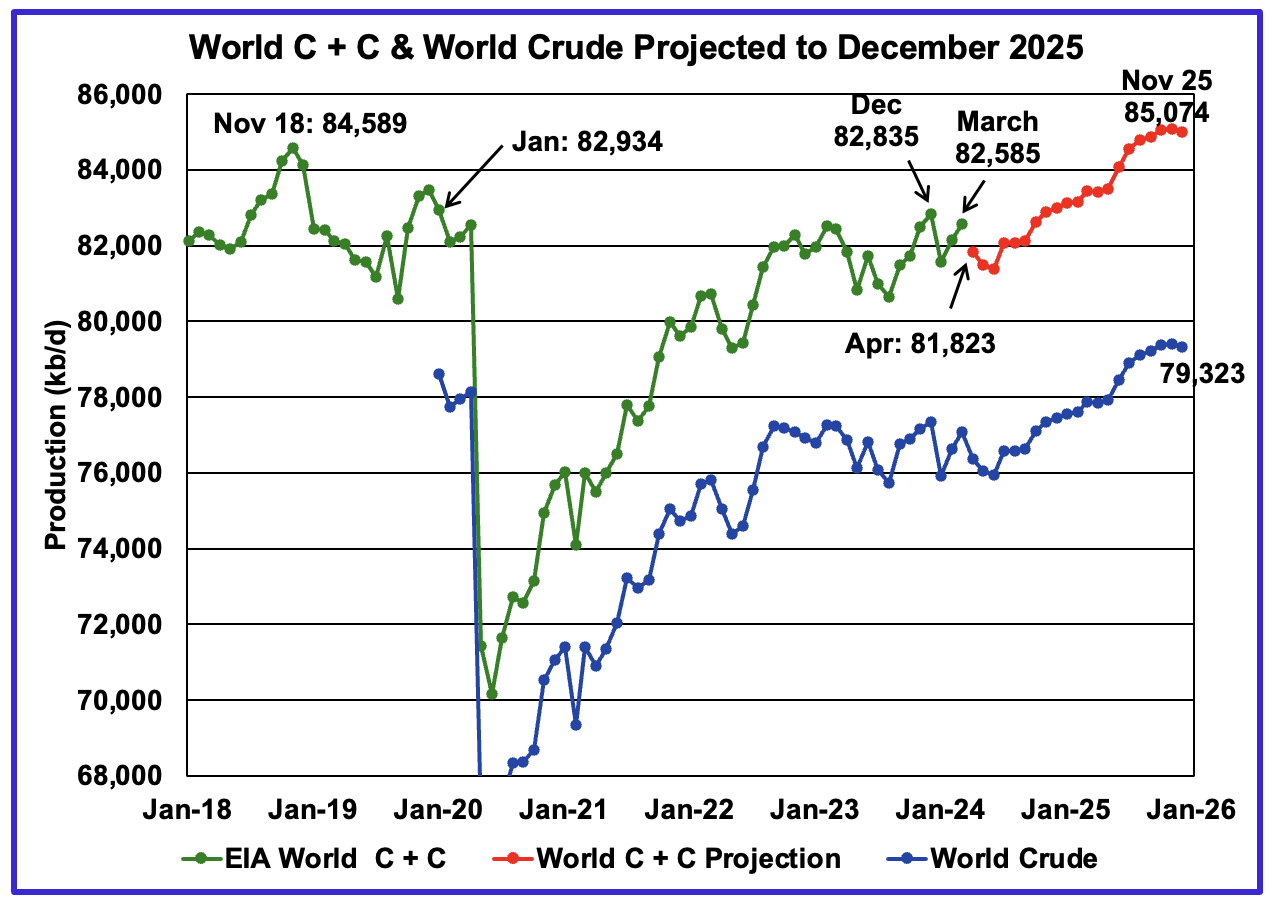
World oil production increased by 440 kb/d in March to 82,585 kb/d, green graph. The largest increase came from Saudi Arabia 100 kb/d while Brazil had the biggest drop, 92 kb/d. April’s World oil production is projected to drop by 762 kb/d to 81,823 kb/d largely due to a drop in Non-OPEC production.
This chart also projects World C + C production out to December 2025. It uses the July 2024 STEO report along with the International Energy Statistics to make the projection. The red graph forecasts World oil (C + C) production out to December 2025 using the STEO’s crude oil report.
For December 2025, production is expected to be 84,998 kb/d. It is preceded by a November 2025 peak that slightly exceeds 85,000 kb/d.
From March 2024 to December 2025, World oil production is estimated to increase by 2,413 kb/d while crude output is forecast to rise by 2,236 kb/d.
A note of caution. The July STEO is now reporting/forecasting only Crude production which is also shown in the chart. As a result the red C+C graph is a projection based on the crude production graph.
There is a significant change in the ratio (C + C)/C over the last five months of reported crude production relative to the previous five months. The average (C + C)/C ratio for the latest 5 months is 8% higher than the previous five months This difference makes a significant change to the projection. The red graph uses the average for last five months of data to make the forecast. In a few months, this report will transition to a fixed six month average.
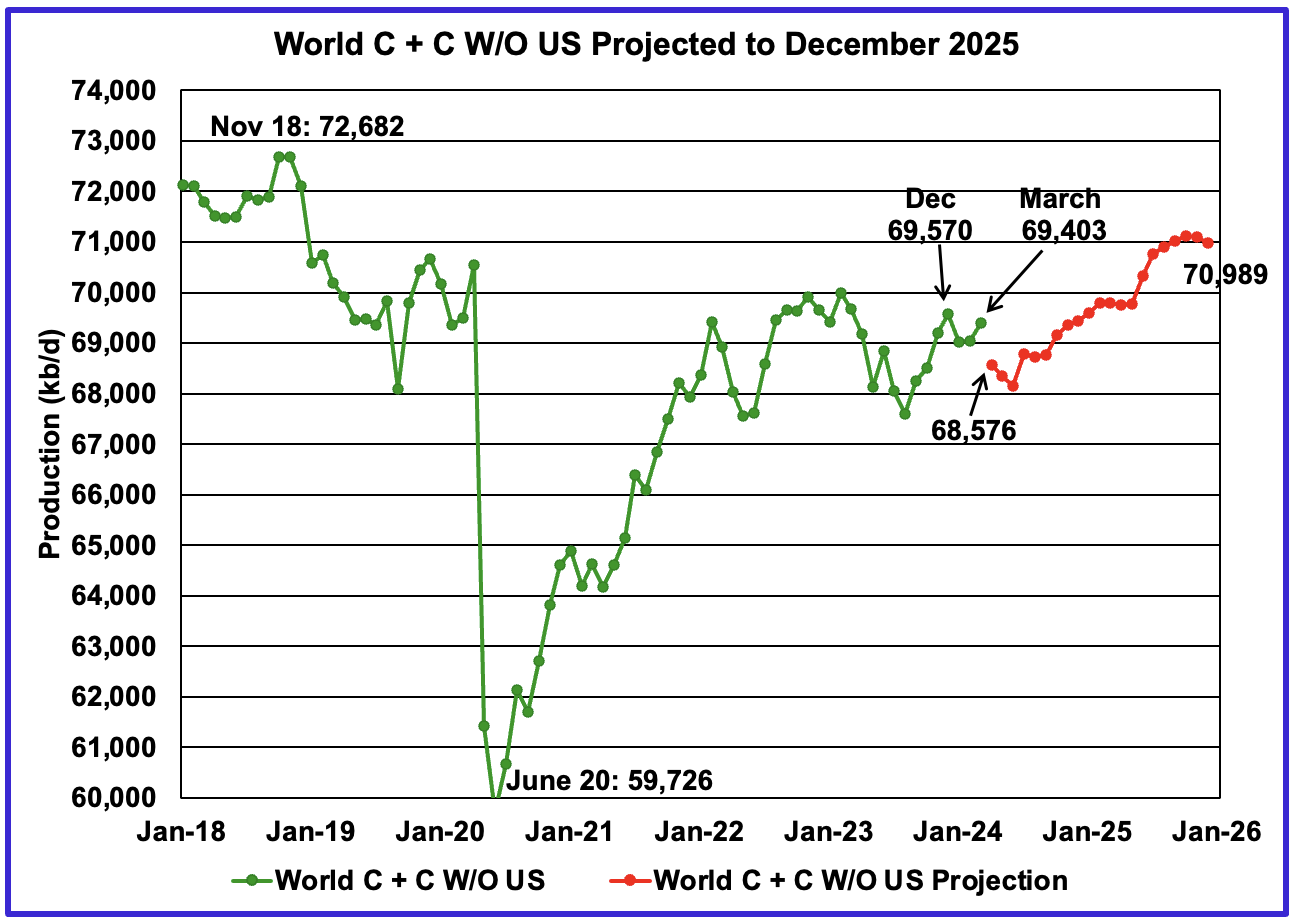
World without US March oil output increased by 364 kb/d to 69,403 kb/d. April production is expected to decrease by 827 kb/d to 68,576 kb/d and continue to decrease into June before beginning to recover.
Note that December 2025 output of 70,989 kb/d is 1,693 kb/d lower than the November 2018 peak of 72,682 kb/d.
World oil production W/O the U.S. from March 2024 to December 2025 is forecast to increase by a total of 1,586 kb/d.
A Different Perspective on World Oil Production
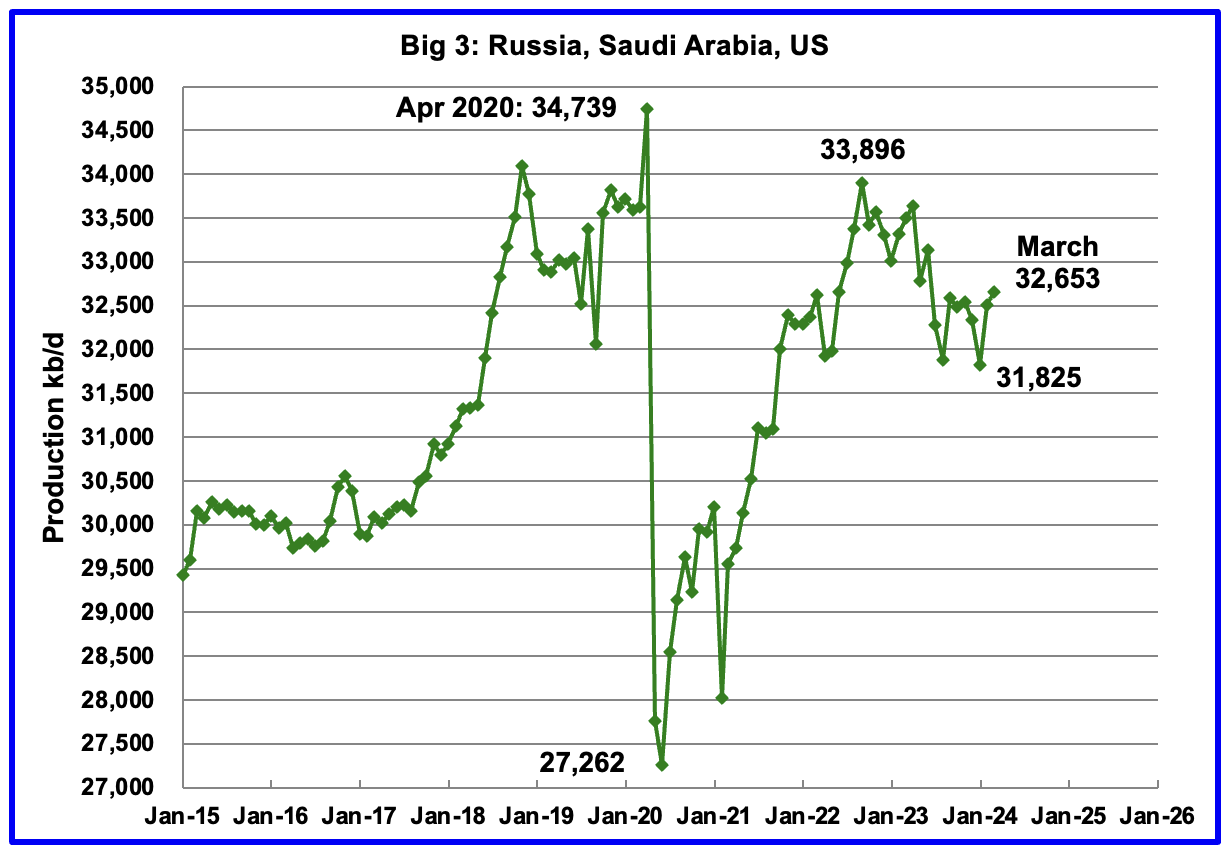
Peak production in the Big 3 occurred in April 2020 at a rate of 34,739 kb/d. The peak was associated with a large production increase from Saudi Arabia. Post covid, production peaked at 33,896 kb/d in September 2022. The production drop since then is primarily due to cutbacks in Russia and Saudi Arabia.
March’s Big 3 oil production increased by 151 kb/d to 32,653 kb/d. March’s production is 1,243 kb/d lower than the September 2022 post pandemic high of 33,896 kb/d. Adding in the current Saudi Arabia 1,000 kb/d cut would raise production to 33,653 kb/d, just 243 kb/d lower than September 2022 production. Saudi Arabia along with other OPEC + countries will begin to reverse their cuts in October 2024.
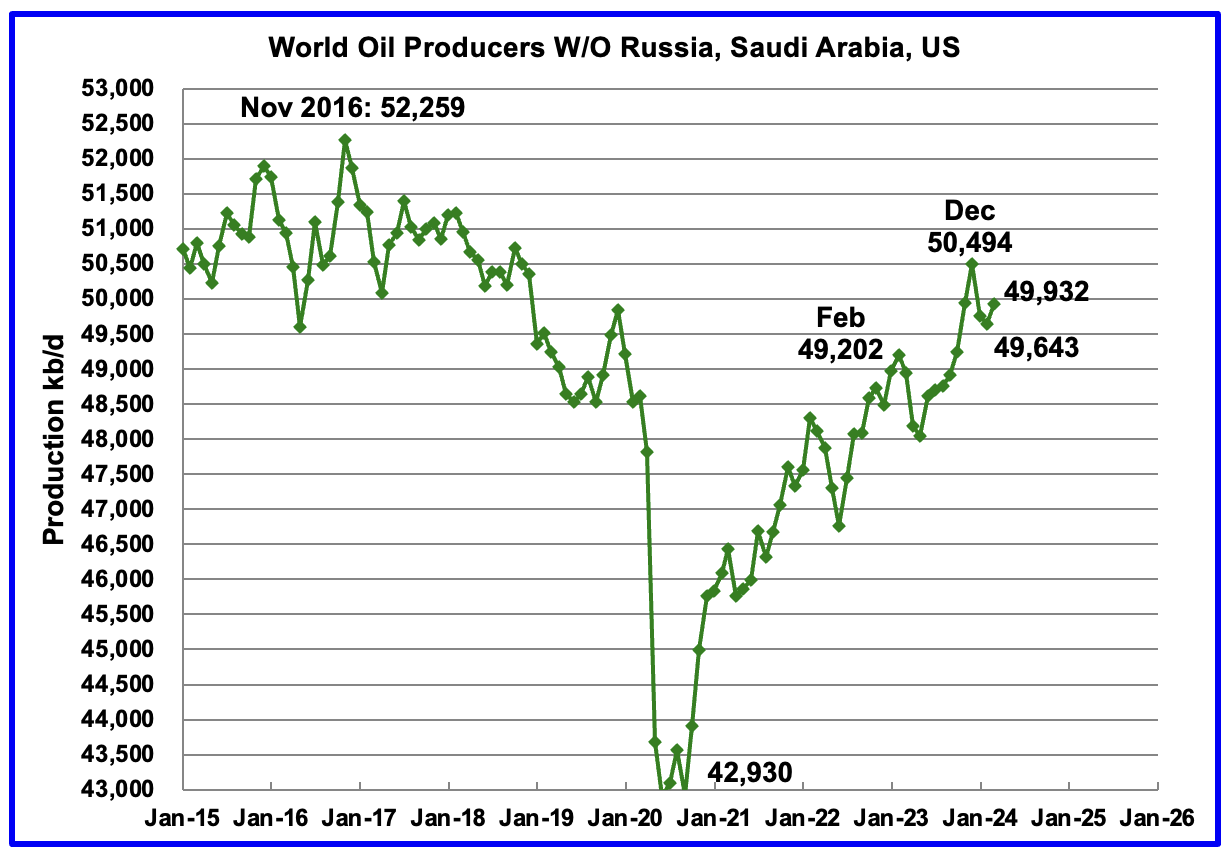
Production in the Rest had been slowly increasing since the September 2020 low of 42,930 kb/d. Output in December 2023 reached 50,494 kb/d, a new post covid high. However January and February production reversed the increasing trend and production dropped by 919 kb/d over those two months to 49,643 kb/d. March production rose by 289 kb/d to 49,932 kb/d.
Countries Ranked by Oil Production
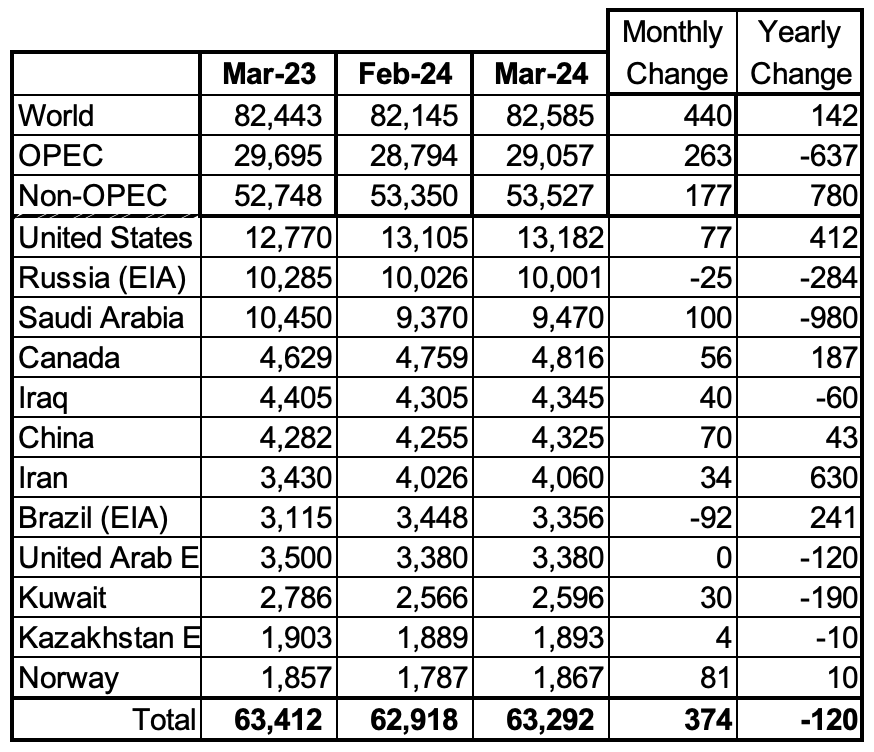
Above are listed the World’s 12th largest oil producing countries. In March 2024, these 12 countries produced 76.6% of the World’s oil. On a MoM basis, these 12 countries increased production by 374 kb/d while on a YOY basis, production dropped by 120 kb/d.
Note the large YoY increase in Iranian oil production vs the large voluntary Saudi Arabian drop.
March Non-OPEC Oil Production
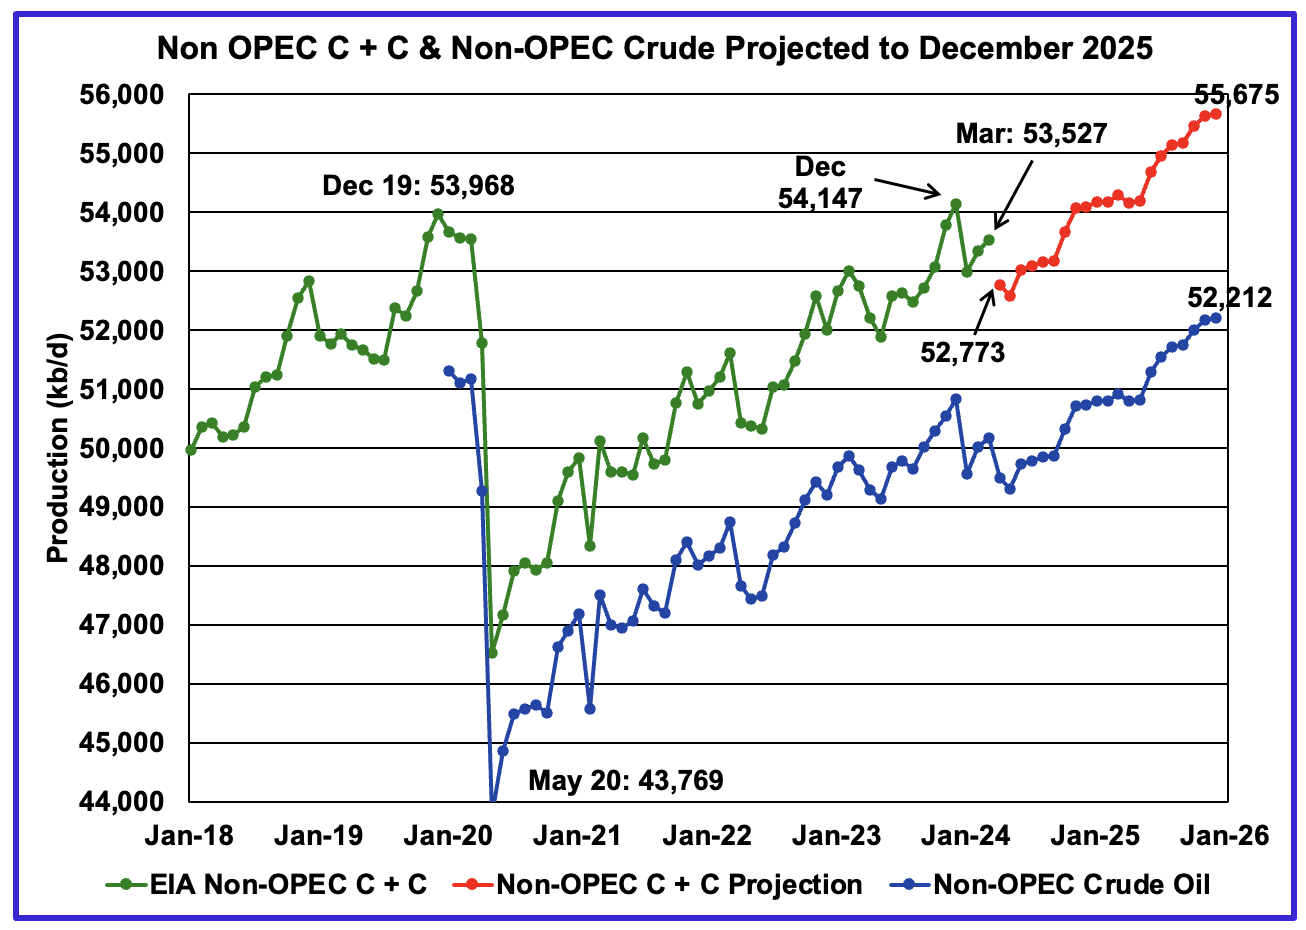
March Non-OPEC oil production increased by 177 kb/d to 53,527 kb/d. The largest increases came from the US and Norway. Note that Non-OPEC production now includes Angola.
Using data from the July 2023 STEO, a projection for Non-OPEC oil output was made for the period April 2023 to December 2025. (Red graph). Output is expected to reach 55,675 kb/d in December 2025, which is 1,707 kb/d higher than the December 2019 peak of 53,968 kb/d.
The same caution as noted in the comments for the World chart above apply to this chart.
From December 2023 to December 2025, oil production in Non-OPEC countries is expected to increase by 1,528 kb/d.
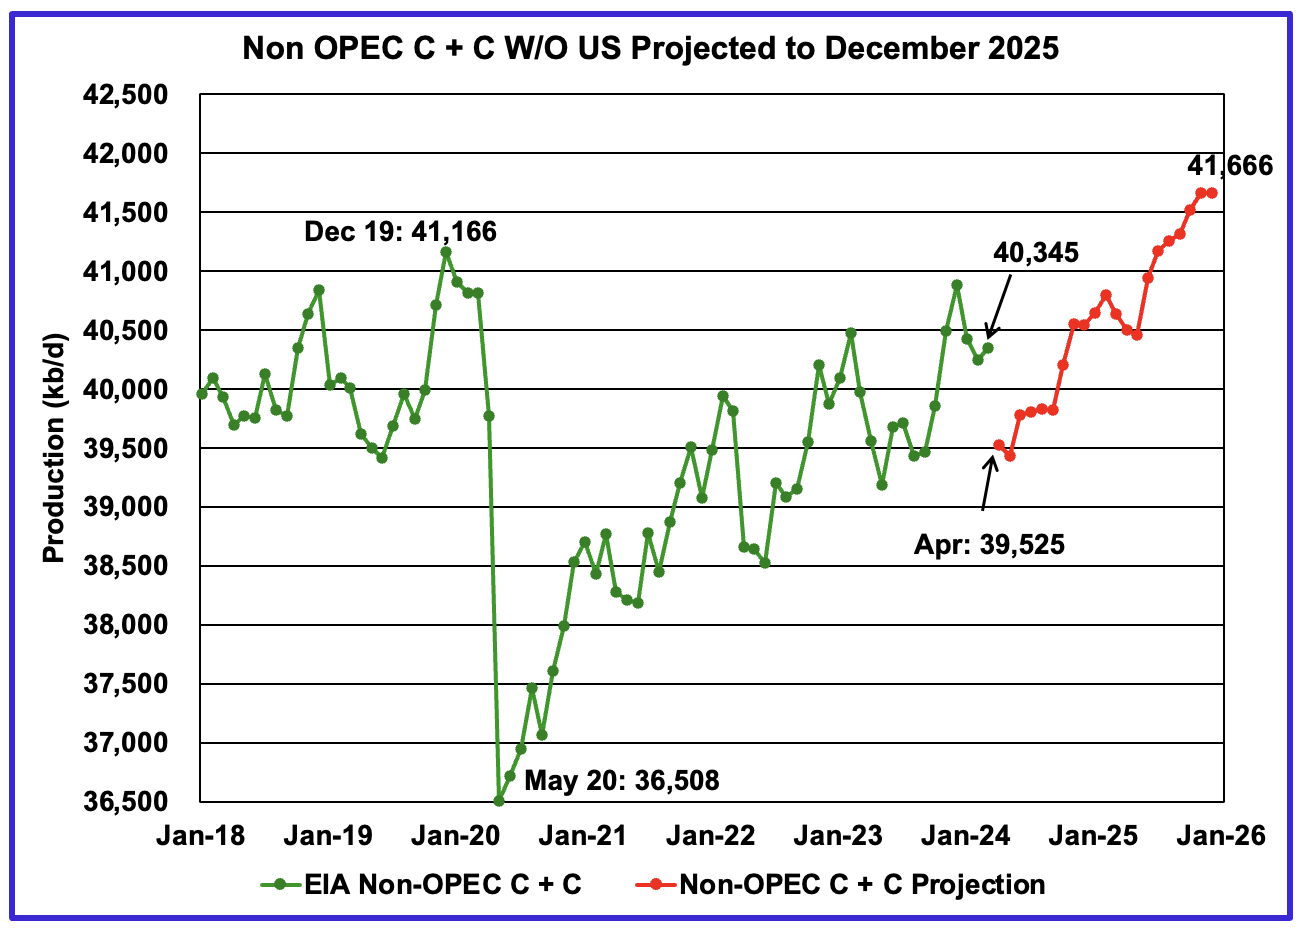
March Non-OPEC W/O US production increased by 100 kb/d to 40,345 kb/d. April’s production is projected to drop 820 kb/d to 39,525 kb/d. The large drop is due to the STEO projecting a 727 kb/d drop in April crude production.
From March 2024 to December 2025, production in Non-OPEC countries W/O the US is expected to increase by 1,321 kb/d. December 2025 production is projected to be 500 kb/d higher than December 2019.
Non-OPEC Oil Countries Ranked by Production
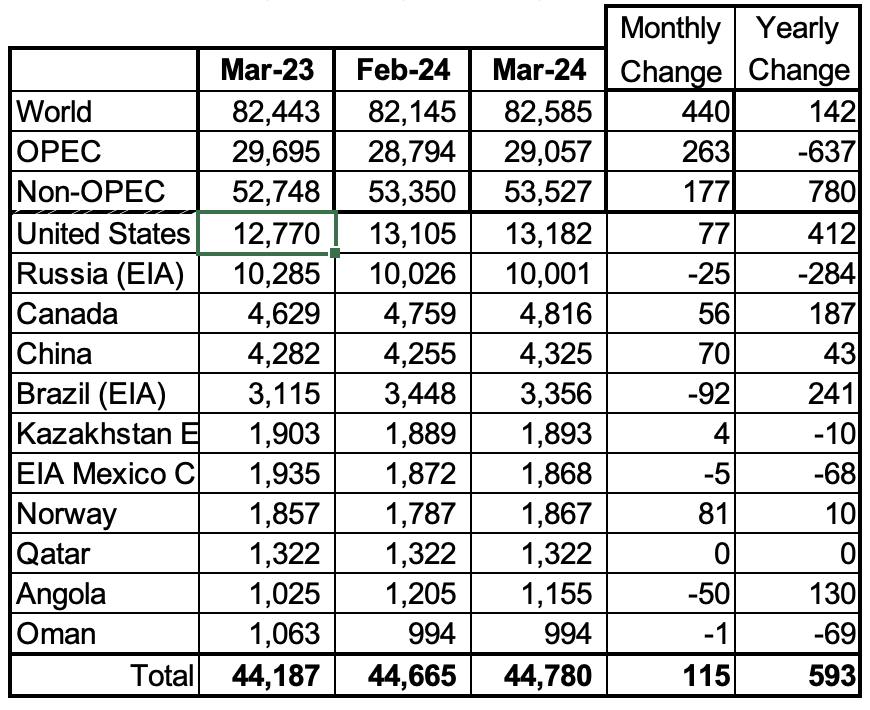
Listed above are the World’s 11 largest Non-OPEC producers. The criteria for inclusion in the table is that all of the countries produce more than 1,000 kb/d. Note that Angola has been added to this table.
March production increased by 115 kb/d to 44,780 kb/d for these eleven Non-OPEC countries while as a whole the Non-OPEC countries saw a monthly production increase of 177 kb/d.
In March 2024, these 11 countries produced 83.7% of all Non-OPEC oil production.
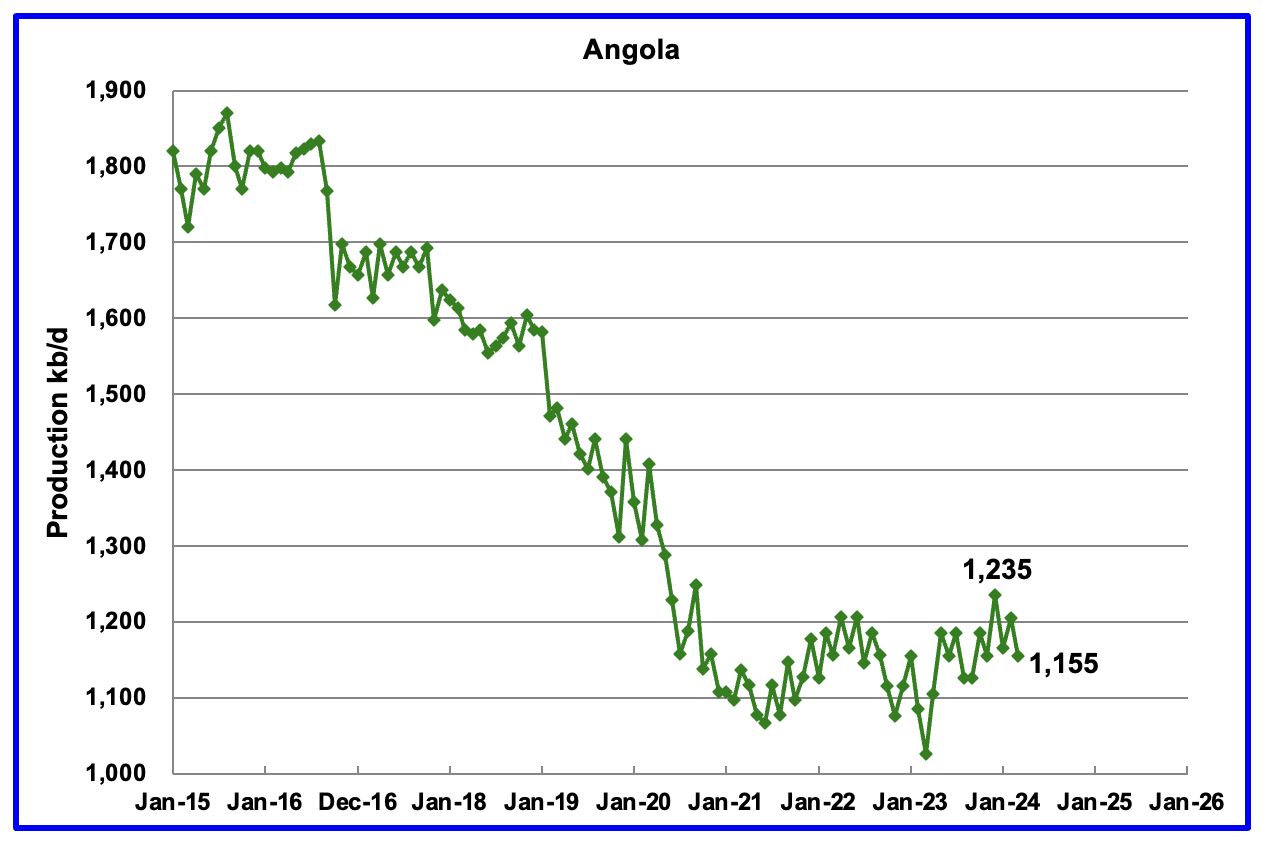
Angola has been added to the Non-OPEC producing countries since they withdrew from OPEC.
Angola’s March production decreased by 50 kb/d to 1,155 kb/d. Angola’s production since early 2022 appears to have settled into a plateau phase.
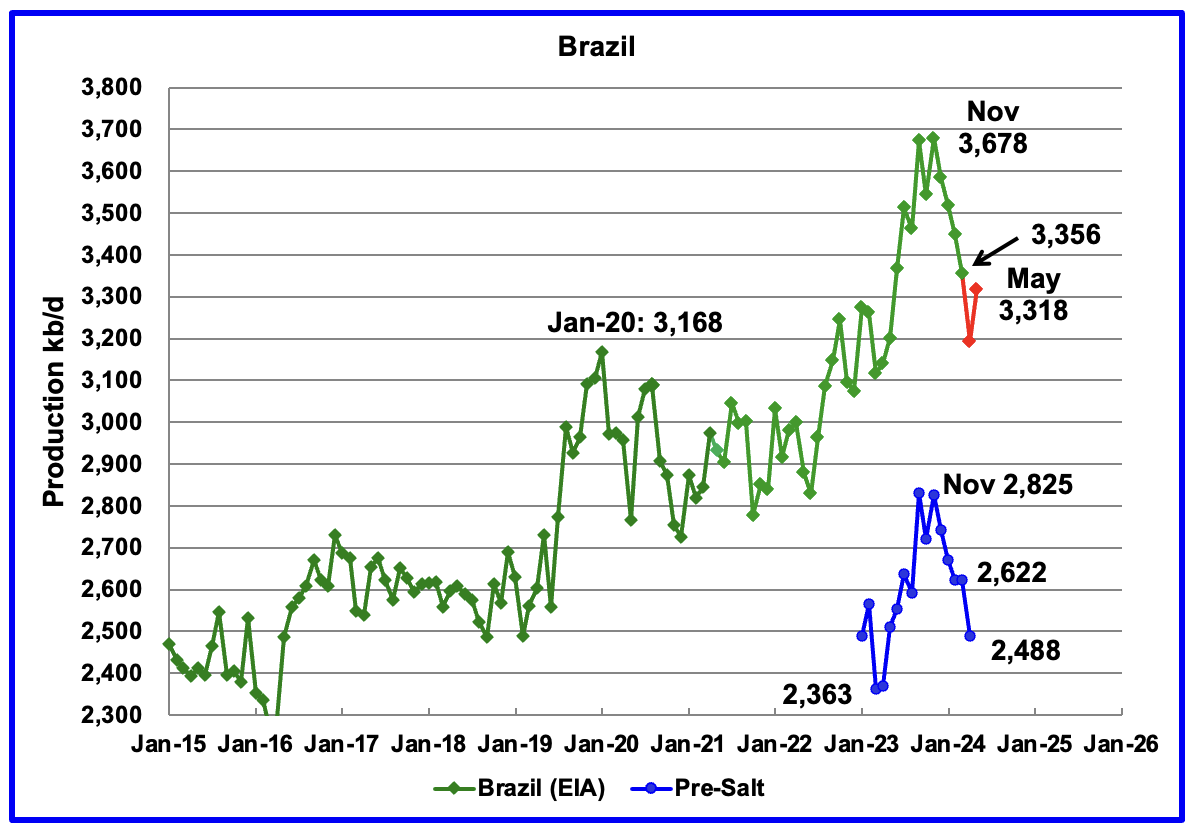
The EIA reported that Brazil’s March production decreased by 92 kb/d to 3,356 kb/d.
Brazil’s National Petroleum Association (BNPA) reported that output dropped in April and increased in May. April’s production dropped by 162 kb/d to 3,194 kb/d while May’s production increased by 124 kb/d to 3,318 kb/d.
Production from Brazil’s off-shore pre-salt region has been added to this chart. April’s pre-salt oil production dropped by 134 lb/d to 2,488 kb/d. The drop in the pre-salt region accounts for 83% of Brazil’s overall drop of 162 kb/d. The OPEC MOMR states: “The April drop in output was primarily driven by maintenance, operational issues and natural decline.” May’s pre-salt information was not available and reporting may have stopped.
From March 2023 to November 2023, production increased by 563 kb/d. A similar rise in production is not expected in 2024. For 2024 the OPEC MOMR is expecting a smaller increase, closer to 100 kb/d while the EIA is forecasting essentially flat output.
Currently, “Petrobras and other oil drillers face multiple headwinds. The environmental agency known as Ibama is on strike and it looks like the standoff over wages will only get worse. This has delayed permits for new production equipment and related work.” according to this source.
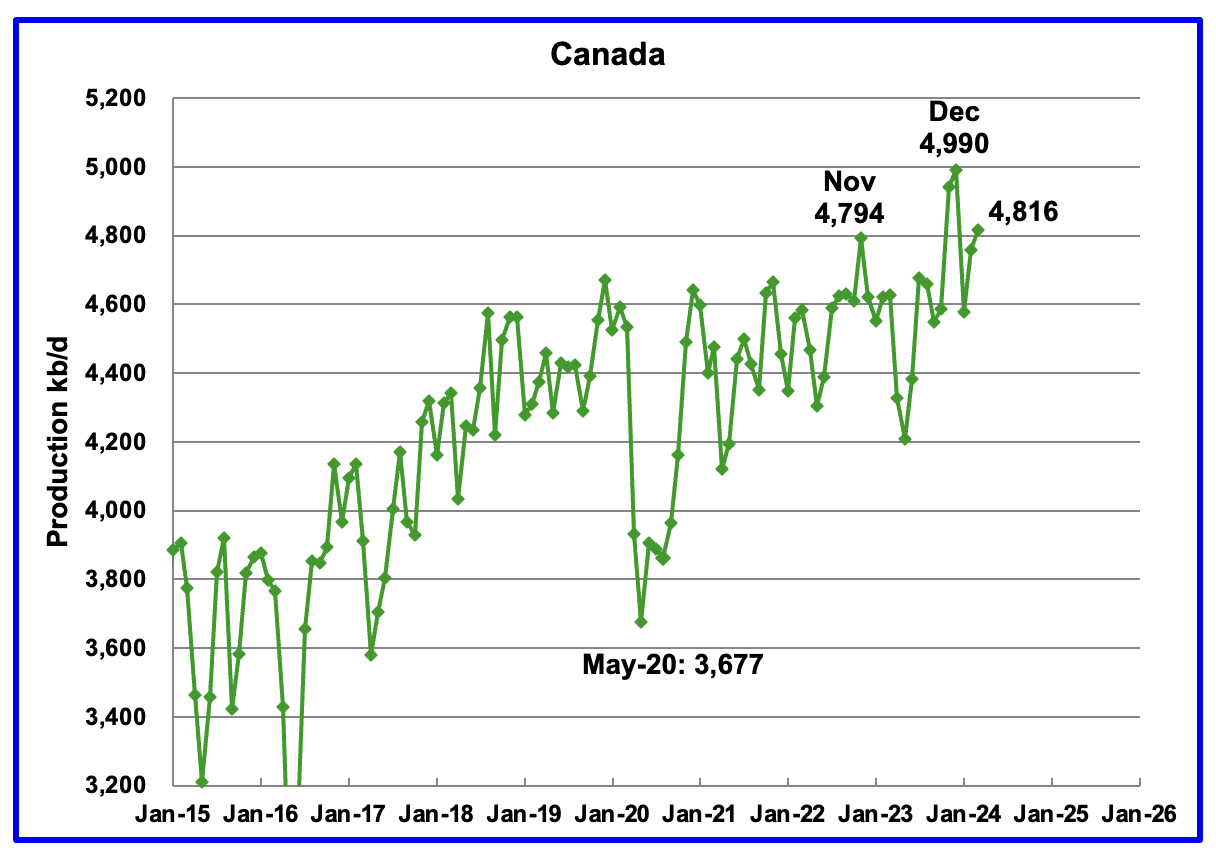
Canada’s production increased by 56 kb/d in March to 4,816 kb/d.
The TMX pipeline received final approval to operate on May 1, 2024. The line is currently operational and the first ships have left Vancouver.
For June, the Trans Mountain oil pipeline was just shy of its target for first-month loadings according to this source.
“The vessels, partially loaded Aframaxes able to carry about 550,000 barrels each, mostly sailed to the U.S. West Coast and Asia. Some cargoes were loaded onto larger ships for delivery to India and China, according to data providers LSEG, Kpler and Vortexa.
Reliance Industries bought 2 million barrels of Canadian crude for July delivery, a deal that involved four ship-to-ship transfers to load the oil onto a very large crude carrier offshore California. The oil is destined for Sikka, India, where the company operates the world’s biggest refining complex.”
A number of shippers were concerned with the high volatility and sulphur standard of the crude being allowed for shipment on the pipeline.
According to this report, Trans Mountain this month revised standards for accepting crude oil on its recently expanded system, alleviating worries about the acidity and vapour pressure of the line’s crude oil.
The same report also states that “The expanded Trans Mountain pipeline is running around 80% full with some spot capacity used. Trans Mountain forecasts 96% utilization from next year. It has capacity to load 34 Aframax ships a month.”
Fires in northern Alberta have forced Suncor to shut its Firebag site according to this article.
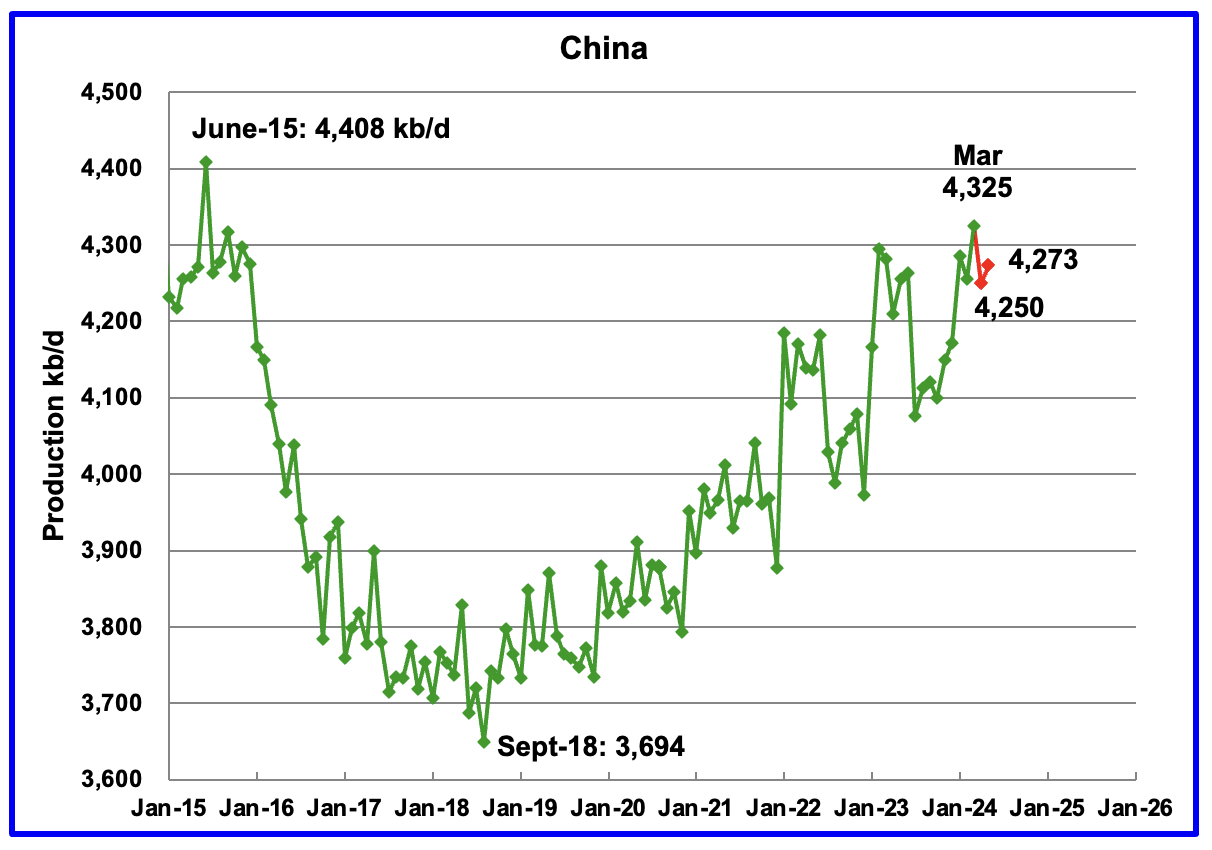
The EIA reported China’s oil output in March increased by 70 kb/d to 4,325 kb/d, a new high.
The China National Bureau of Statistics reported production for April and May. April dropped 75 kb/d to 4,250 kb/d and May recovered to 4,273 kb/d.
While China’s production growth has risen steadily since 2018, it may be approaching its post pandemic high since the YoY increase for 2024 was 32 kb/d vs the 102 kb/d increase in 2023. The OPEC MOMR states: “For 2024, China’s liquids production is expected to rise by about 15 tb/d, y-o-y”
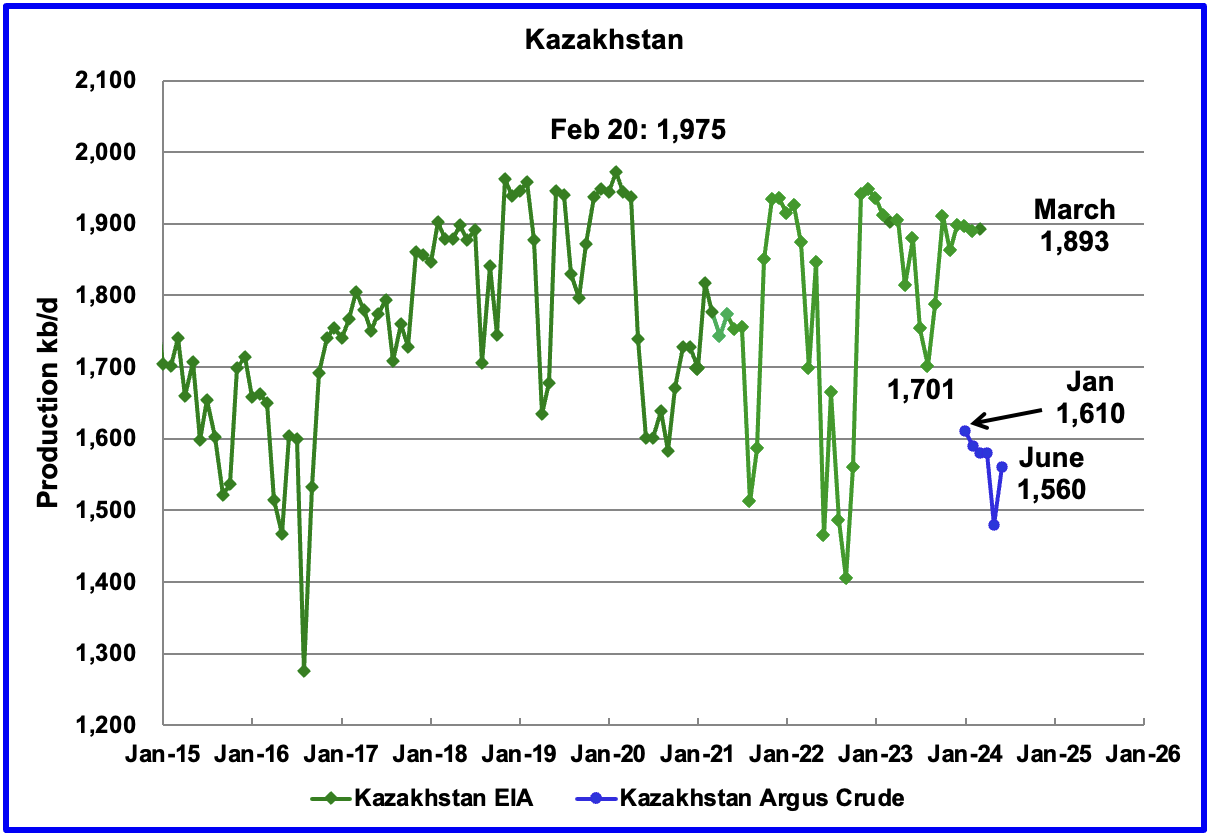
According to the EIA, Kazakhstan’s oil output increased by 4 kb/d in March to 1,893 kb/d. Kazakhstan’s recent crude oil production, as reported by Argus, has been added to the chart. In June crude production rebounded by 80 kb/d to 1,560 kb/d.
Kazakhstan and Iraq have been under pressure to reduce their production to comply with the OPEC + targets since oil inventories have not been falling as fast as expected. According to this source both countries will reduce their output. However according to this source the OPEC+ oil production cheats show little sign of making compensation cuts.
“The latest round is off to an inauspicious start.
From May, Iraq and Kazakhstan promised both to adhere to their assigned limits, and cut substantially below these levels each month to make up for overproduction since the beginning of the year. But neither country has so far hit their initial quota, let alone begun the work of compensation.
Baghdad pumped about 195,000 barrels above its target in May, at 4.195 million a day, while Astana produced an excess of 43,000 a day, at 1.511 million a day, according to OPEC’s latest monthly report. Data compiled by Bloomberg indicate that Iraq continued to overproduce at a similar level in June.
Both countries have a long history of chafing against OPEC+ quotas, as Iraq seeks revenue to rebuild its war-shattered economy, while Kazakhstan rushes to monetize new capacity, such as the $48.5 billion Tengiz oil field project led by Chevron Corp.”
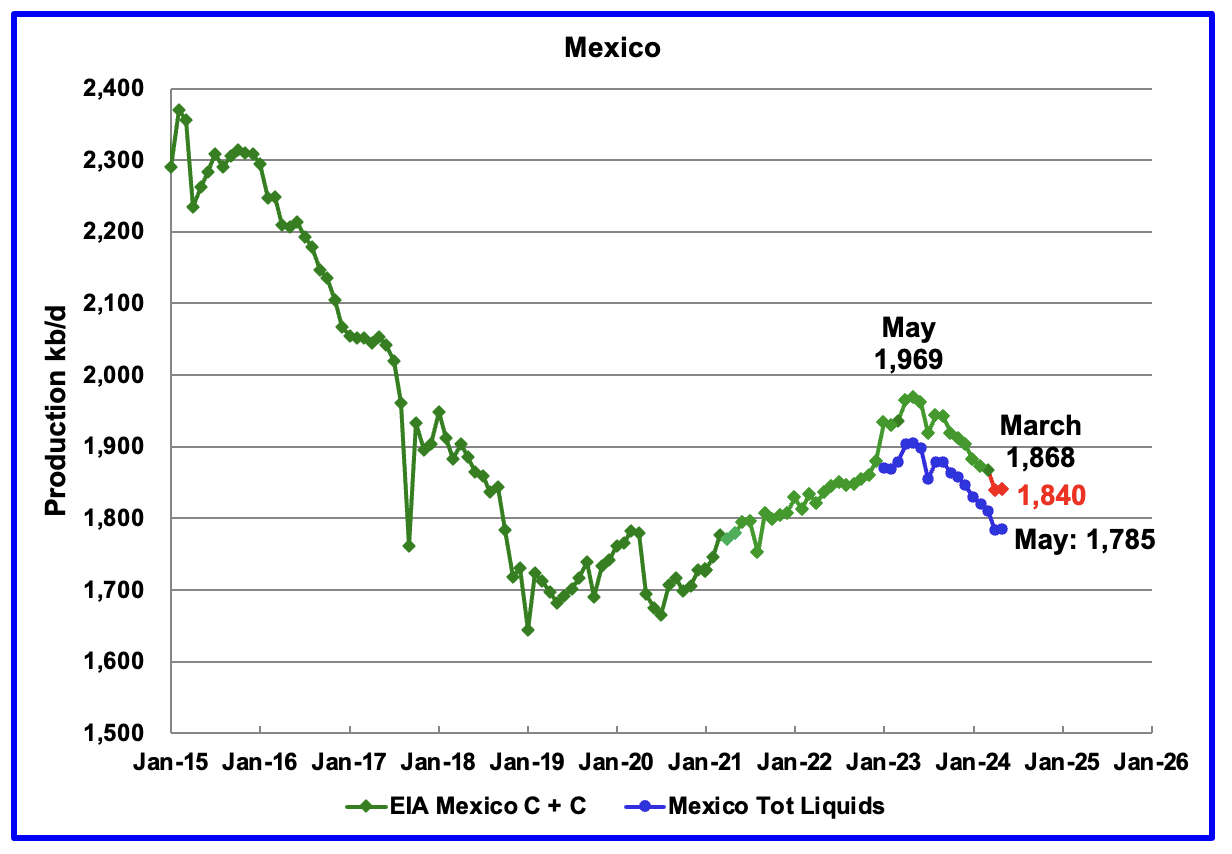
According to the EIA, Mexico’s output decreased by 5 kb/d in March to 1,868 kb/d.
For March, Pemex issued a new and modified oil production report for Heavy, Light and Extra Light oil. It is shown in blue in the chart and it appears that Mexico is not reporting condensate production when compared to the EIA report.
In earlier reports, the EIA would add close to 55 kb/d to the Pemex report. The gap between the EIA report and Pemex on average has been close to 55 kb/d over the last 6 months. Condensate of 55 kb/d has been added to the Pemex report to estimate Mexico’s May production of C + C 1,840 kb/d, red markers.
From May 2023 to May 2024, Mexico’s production has dropped by 129 kb/d or 6.5%
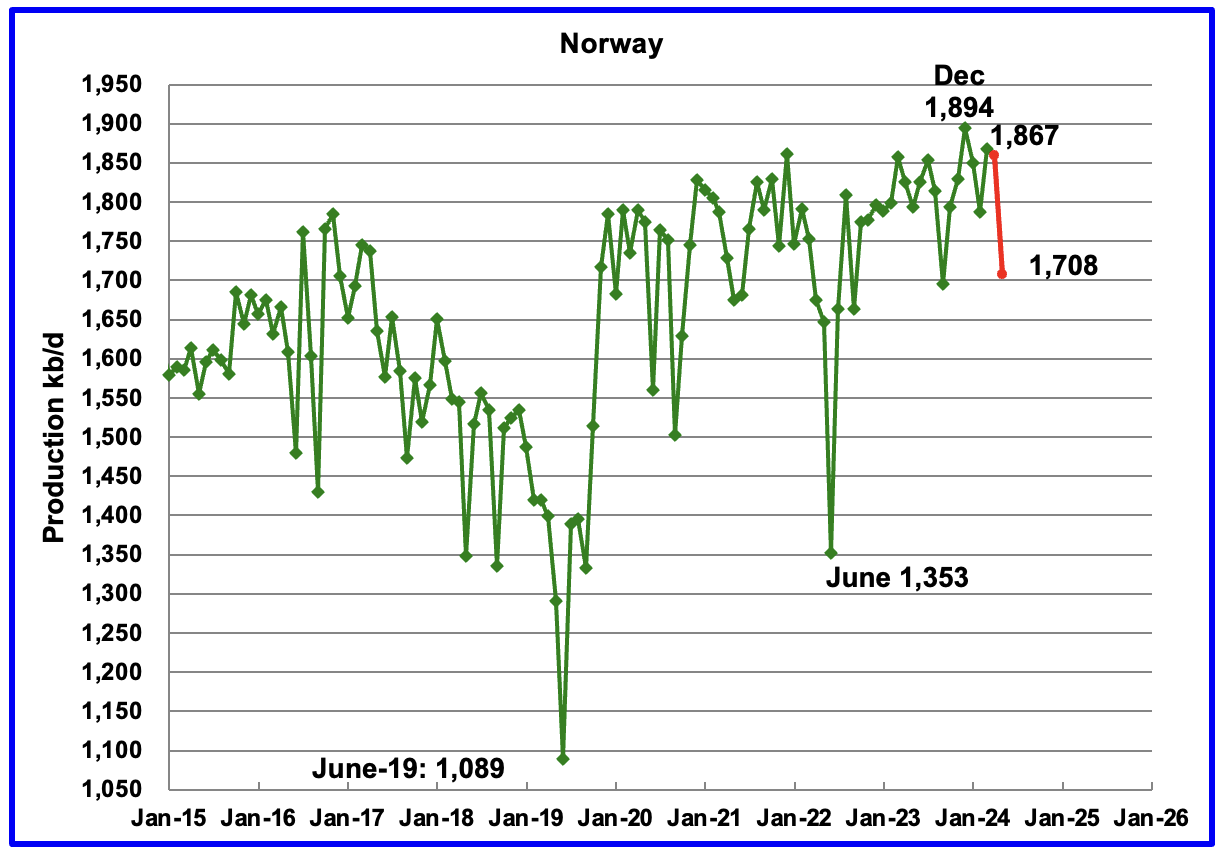
The EIA reported Norway’s March production increased by 81 kb/d to 1,867 kb/d.
Separately, the Norway Petroleum Directorate (NPD) reported that April’s production decreased by 8 kb/d to 1,867 kb/d, red markers. May’s production dropped another 151 kb/d to 1,708 kb/d.
The Norway Petroleum Directorship stated that May production came in above target. This indicates that the drop was due to planned maintenance.
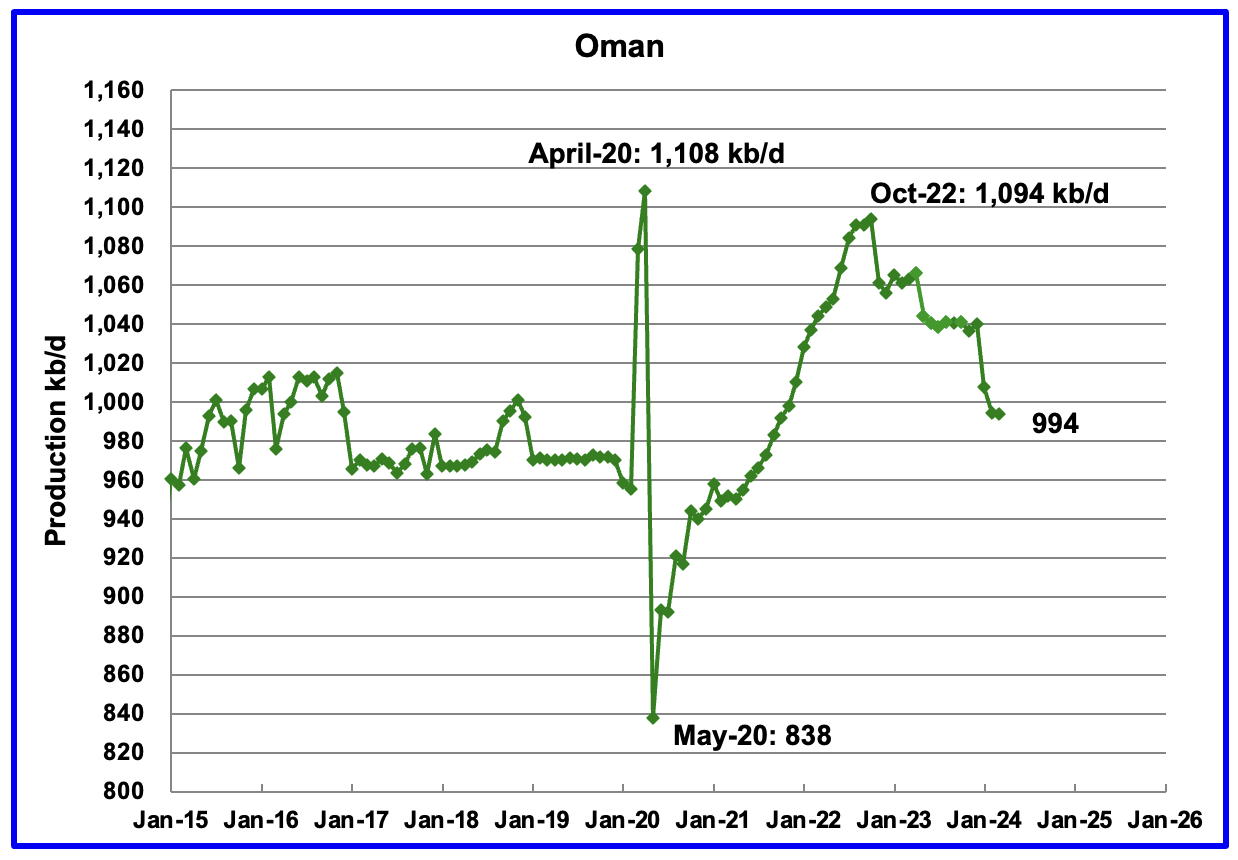
Oman’s production has risen very consistently since the low of May 2020. However production began to drop in November 2022. According to the EIA, March’s output was flat at 994 kb/d, 100 kb/d lower than October 2022.
Oman produces a lot of condensate. The OPEC MOMR reports that crude production in May was 766 kb/d, 228 kb/d lower than the EIA’s C + C.
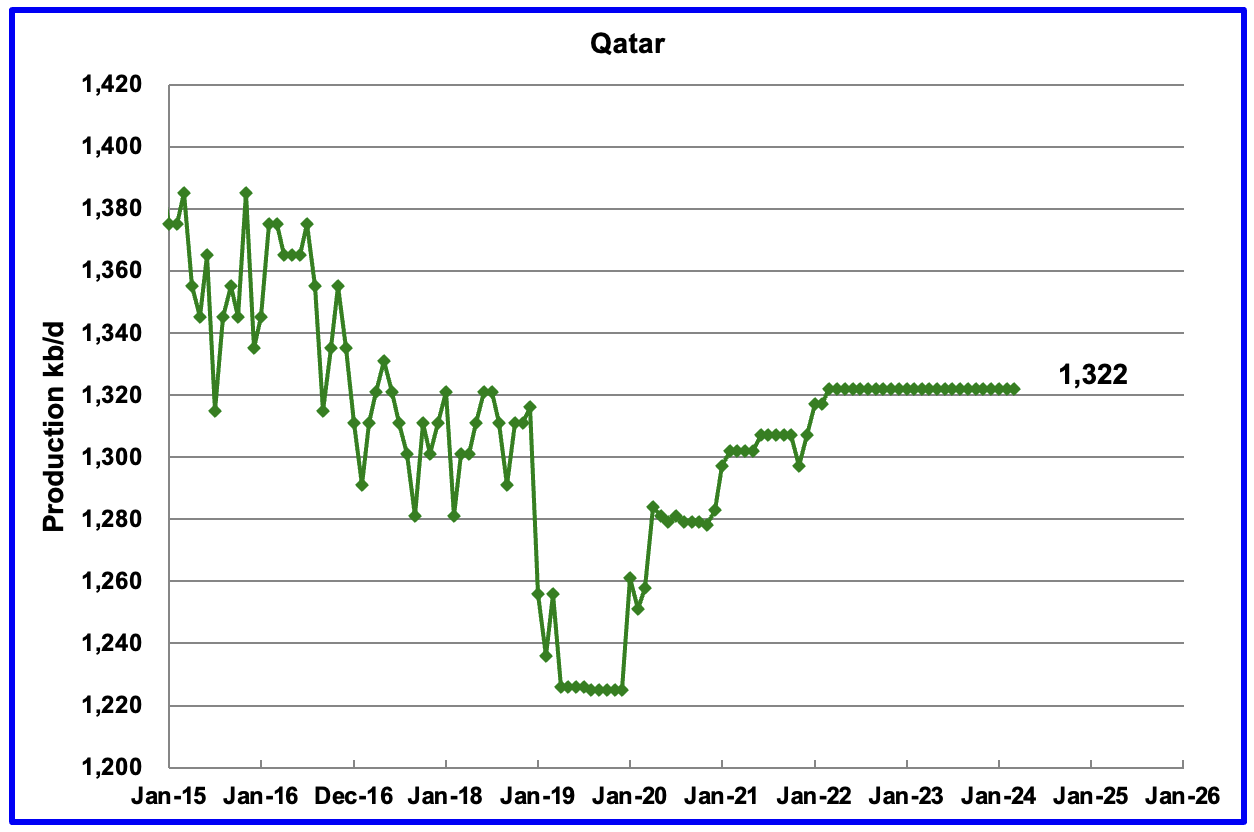
Qatar’s March output was unchanged at 1,322 kb/d, possibly due to lack of updated information.
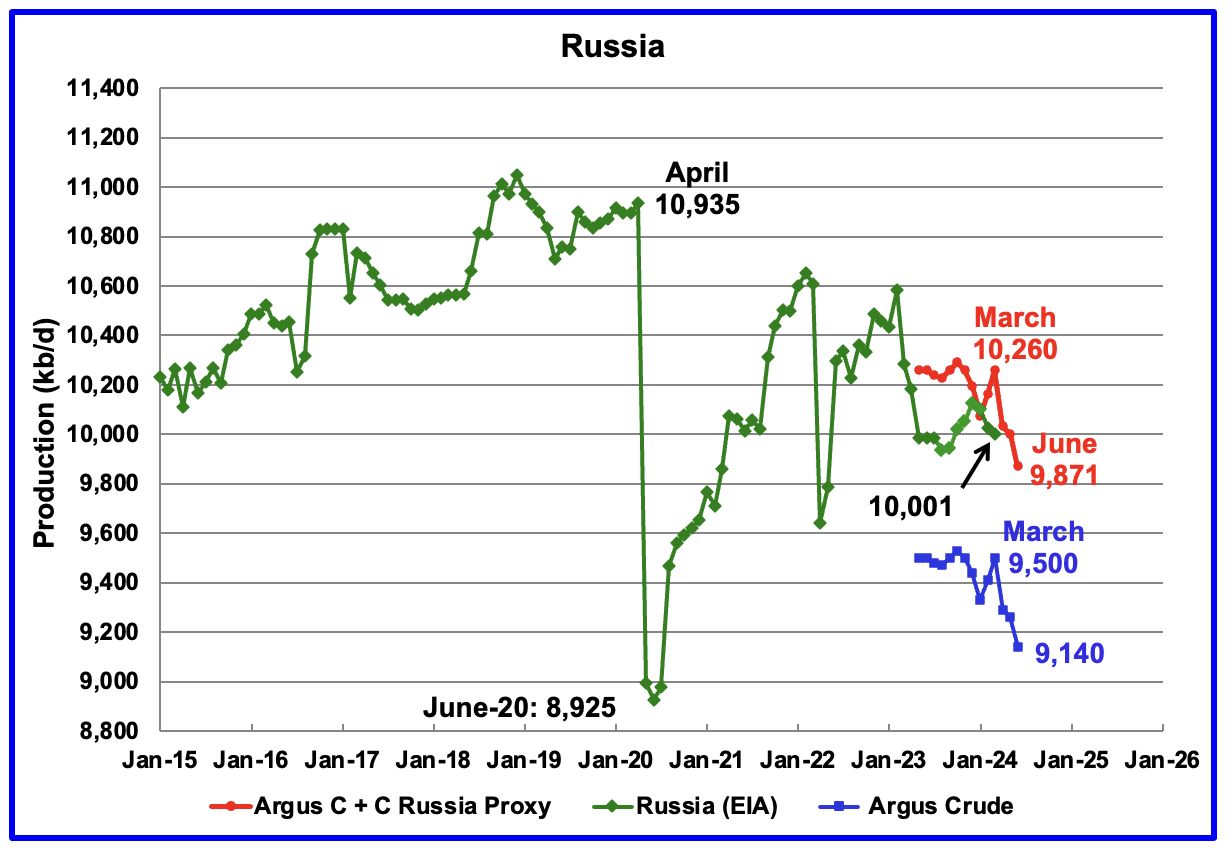
The EIA reported Russia’s March’s C + C production dropped by 25 kb/d to 10,001 kb/d.
Using data from Argus Media reports, Russian crude production is shown from May 2023 to June 2024. For June 2024, Argus reported Russian crude production was 9,140 kb/d, a decrease of 120 kb/d from May, blue markers. Adding 8% to Argus’ May crude production provides a C + C production estimate of 9,871 kb/d, which is a proxy for the Pre-War Russian Ministry estimate, red markers.
In pre-war times, the Russia Energy Ministry estimate used to be 400 kb/d higher than the EIA estimate. For March, the Argus proxy estimate is 259 kb/d higher.
“S & P Platts reports that Russian June crude production was 9,100 kb/d, down 140 kb/d from May. This is 40 kb/d lower than reported by the Argus report.
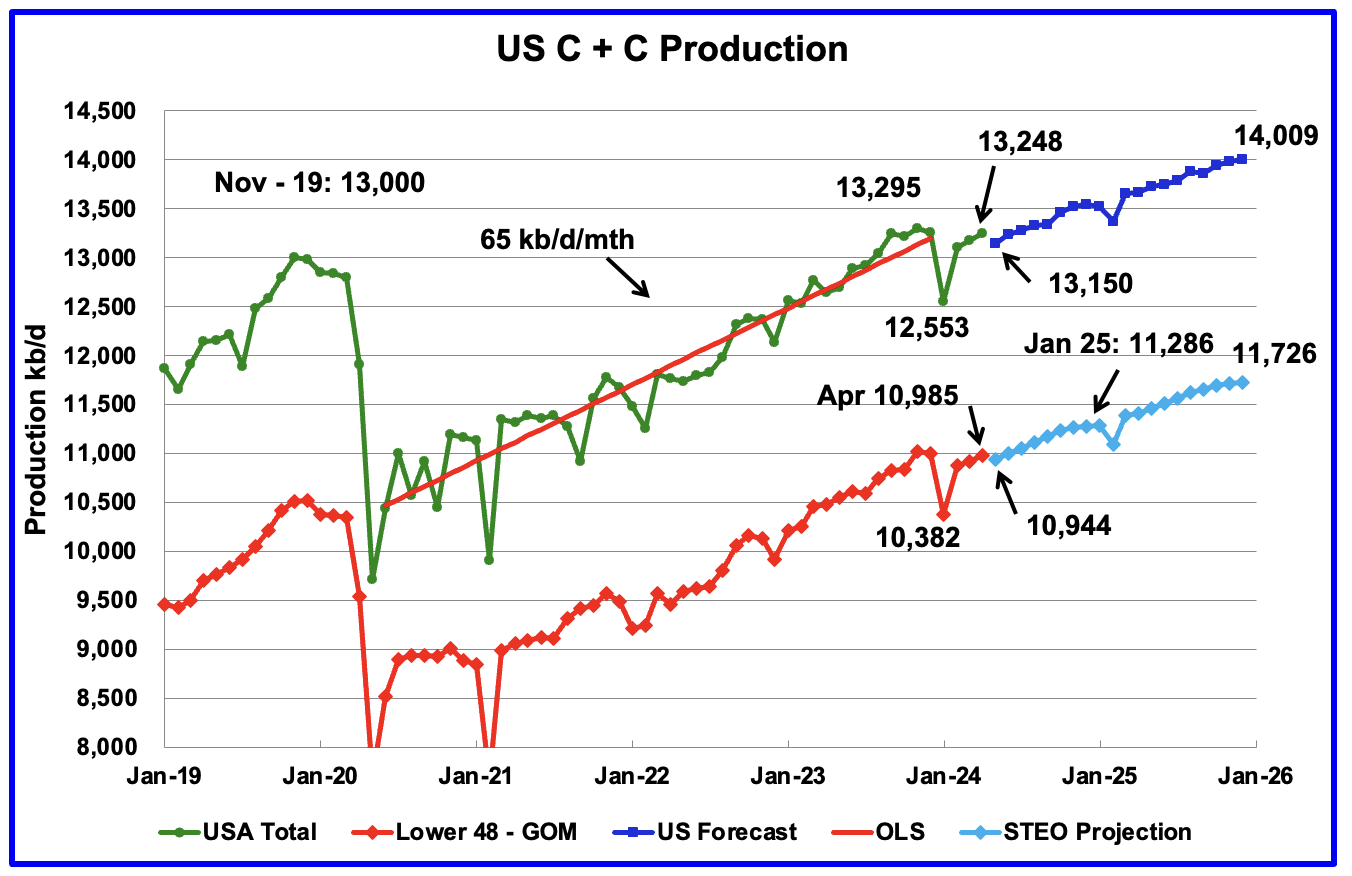
This chart is almost the same as posted in the US April update except that the light and dark blue graphs have been updated using the July STEO. After a small production drop in May, US production is expected to rise slowly till the end of the year.
It seems that each STEO update increases US production for December 2025, especially the Onshore L48. For the July update, the STEO increased Onshore L48 December 2025 production by 130 kb/d to 11,726. Overall US production in December 2025 was increased by 92 kb/d.
90 responses to “March Non-OPEC and World Oil Production Rose”
Russia in June 2024 reduced oil production to 9.139 million barrels per day
July 10/ 21:00
Moscow. In June 2024, Russia reduced oil production by 114 thousand barrels per day – to 9.139 million barrels per day. However, it exceeded the plan within the framework of the agreements on the OPEC+ deal by 161 thousand barrels per day
“In April the figure was 9.301 million b/d, in May – 9.253 million b/d, the average level of the first quarter was 9.431 million barrels per day, the second – 9.231 million barrels per day,” quotes data presented in the monthly report of the Organization of Countries – oil exporters (OPEC) TASS.
At the same time, already in June, Russia, taking into account all voluntary reductions in oil production within the framework of the OPEC+ agreements, was supposed to reduce production to 8.978 million barrels per day. Thus, Russia exceeded the oil production plan by 161 thousand barrels per day.
The total volume of voluntary OPEC+ cuts in the second quarter, as in the first, was about 2.2 million barrels per day.
At the same time, Russia in the first quarter reduced oil supplies to world markets, not production, by 500 thousand barrels per day. In the second quarter, the decline in indicators was already accounted for by both exports and production. On average, over three months, production and exports were expected to decrease by 471 thousand barrels per day. In April, Russia’s production reduction was supposed to be 350 thousand barrels per day, and exports – 121 thousand barrels per day. In May, the reduction in production should be 400 thousand barrels per day, exports – 71 thousand barrels per day, in June only production should have decreased – by 471 thousand barrels per day. Thus, in June the Russian Federation was supposed to produce 8.978 million barrels per day.
Previously, the Russian Ministry of Energy stated that the country in April and May slightly exceeded the volume of oil production as part of the voluntary cuts under the OPEC+ deal due to technical difficulties in reducing production. But in June the issue of overproduction should have been resolved.
By the end of June, Russia had to submit to the OPEC secretariat a plan to compensate for shortened production volumes as part of its voluntary obligations.
Opritov Alexander
The issue with Russian production is to know how much are real cuts, if any, how much is due to natural decline, how much is due to sanctions on drilling equipment and how much is due to bombing of refineries.
I did read a while back where Putin did order Russian producers to cut back.
Any insight you have would be appreciated.
Unfortunately, I do not have such information. I believe that the official statements of the Russian authorities can be trusted to a certain extent; the effectiveness of the bombings is not reported for obvious reasons. I believe that all of Russia’s obligations to OPEC+ will be fulfilled.
gCaptain: Chinese shipyard exit stops work on Russian Arctic LNG 2
July 12/ 07:22
Moscow. The US sanctions regime continues to restrict Russia’s flagship liquefied natural gas (LNG) project. Days after Chinese company Wison New Energies withdrew two modules intended for the Arctic LNG 2 project due to fears of sanctions, work on the project is likely to be stopped.
Wison has confirmed the return of modules 3-TMR-001 and 3-TMR-002 to its Zhoushan shipyard. These two modules were to become the basis of the third production line, Arctic LNG 2. The Chinese heavy lift vessel Wei Xiao Tian Shi is expected to return to China with cargo by the end of August.
Sources at the Belokamenka shipyard confirmed to gCaptain that construction of the gravity-based platform (GBS) that housed the modules has ceased and several hundred workers are preparing to leave the site.
Meanwhile, work on Train 2 is almost complete and GBS-2 is preparing to be launched and towed to the Gydan Peninsula around July 21, sources confirm.
After the launch of GBS-2, the main construction activity at Belokamenka is likely to slow down. According to sources, Novatek intends to mothball GBS-3 until a path forward is determined, now that Chinese production and delivery of at least some modules has ceased.
NOVATEK’s decision to freeze Train 3 will limit Arctic LNG 2’s production to 13.2 million tons per year, compared to its design capacity of 19.8 million tons per year. And even achieving this reduced volume will be a very difficult task, industry experts agree. The lack of a complete set of Baker Hughes turbines required a redesign of Trains 1 and 2. Much-needed ice-capable LNG tankers remain in short supply and blocked by sanctions.
Wison’s decision also affects the future of NOVATEK’s next project, Murmansk LNG. Planning for Murmansk LNG has been put on hold indefinitely, according to people familiar with the company’s operations.
Opritov Alexander
Attached is a table taken from today’s IEA report.
According to the iEA, Russian June production is 9,220 kb/d, 100 kb/d above the level you mention in your first line and their production is currently 240 kb/d above target.
Does anybody really know what is happening in Russia? If they stay at this level, the cut reversals that start in October will get to Russia’s target.
Thank you. I would trust Russian data more. There may be discrepancies based on different calculation methods, we are talking about the density and temperature of oil, but this is not certain. I note that discrepancies have always existed before.
Chinese oil demand has likely peaked. Multiple factors are at play. Xi’s authoritarian turn has put off further investment from manufacturers. They are also concerned about severe sanctions should China invade Taiwan. Domestic EV growth continues apace, as does growth in renewable energy. Oil production is also rising from recent lows. Population has peaked and the construction boom that led to huge oil demand growth has permanently ended. This will be a major headwind against global oil demand growth. It could also eventually lead to a major economic downturn as the property market has been in bubble land for at least a decade.
https://oilprice.com/Energy/Crude-Oil/Will-Sluggish-Chinese-Oil-Demand-Derail-OPECs-Optimistic-Forecasts.html
They are also close to peak coal consumption, some estimate in the next 1-2 years.
A rapid decline would be welcome, but I’m not holding my breathe.
US output increases by about 770 kb/d from June 2024 to December 2025 based on the July STEO with 90% of that increase coming from the combined output from Permian, Eagle Ford, Bakken, Haynesville, and Appalachia regions. Of that 90% increase from these 5 regions, 75% is from the Permian Basin (67.5% of the US increase over those 18 months).
Forecast starts after June 2024 (marked with 8.95 label on chart).
I think the falling horizontal oil rig count will lead to lower output than the EIA has forecast over the next 18 months. I assume the horizontal oil rig (HOR) count will remain close to the current level for the next 12 months, if the HOR count rises, then the EIA’s forecast could be correct. I think higher oil and natural gas prices will be needed to create an increase in the HOR count .
Yes, Dennis, I am also starting to doubt this “short-term outlook”.
I was buying that 2H2024 will ramp-up, due to: 1.Materhorn going online and 2. Exxon getting busy on the Pioneer acreage. The latest Dallas Fed energy survey also confirmed intentions to crank-up…
However, we should have seen some rig adds by now, if this 2H24 ramp is to happen…
Looks like the new government in Britain is going to ban all new oil projects in the North Sea.
Which would have been completely unnecessary as the North Sea oil fields are in decline.
From my view, since there is not that much left to explore, an easy “win”
Kind of like the US banning new expropriation of indigenous lands in year 1920 (well except when the opportunity is significant like Hawaii).
Somewhat connected, what about the Falklands/Malvinas, inquiring minds would kind of like to know what happened there?
Also, the Venezuela issue at hand? Some may get my drift…
(Btw, don´t mention Germany in the mid 40´s)
https://finance.yahoo.com/news/beetaloo-juice-us-shale-explores-050000347.html
Very good article on Australia’s Beetaloo Basin.
Scott Sheffield’s son (PIONEER) Bryan is going for some
BEETALOO JUICE!!!
The real focus needs to be on Iran, Canada, Venezuela, and Guyana.
That’s all of the incremental growth.
I agree, John.
Ovi has a 1MMbpd cut-off, but given the high variable growth in Veny and Guyana I hope he will start including them…
https://www.bnnbloomberg.ca/investing/2024/07/11/ftc-delays-chevron-hess-decision-to-after-exxon-arbitration/
FTC Delays Chevron-Hess Decision to After Exxon Arbitration – Guyana
“The real focus needs to be on Iran, Canada, Venezuela, and Guyana.”
https://www.msn.com/en-us/news/world/russian-warship-spotted-docking-in-venezuela-as-tensions-over-drills-near-us-smilitary newsurge/ar-BB1pmHn7
Venezuelan President Nicolas Maduro has previously denounced Western sanctions imposed on Russia over its full-scale invasion of Ukraine, describing the relationship between Caracas and Moscow as “loyal allies.”
I can figure this out sitting at my computer at home.
Iran – China and Russia
Canada – Canada/USA
Venezuela – Russian Military and USA Sanctions – The current battleground
Guyana – British Warship sent previously when Venezuela threatened invasion.
“Top Secret, Expensive and Risky Actions!!! Speak LOUDER than WORDS.” – Andre
Opritov Alexander
Attached are charts for Argentina, Guyana and Venezuela. On occasion I post Argentina and Guyana. Dennis does Venezuela in the OPEC report every month.
Guyana
Guyana is tricky because I think XOM and the G government are at odds over royalties and XOM may be slowing production increase to use as a lever. Just speculating.
Ovi,
I think there is limited capacity for existing FPSO facilities in Guyana, they may just be waiting on new facilities to be up and running. See
https://finance.yahoo.com/news/exxon-plans-guyana-oil-project-154159879.html
and Yellowtail is supposed to start producing in 2025 see below
https://corporate.exxonmobil.com/locations/guyana/guyana-project-overview#YellowtailProject%E2%80%93Description
Dennis
It is difficult to know what is happening behind the scenes. Could be they are waiting for FPSOs. There is also the question of how XOM wants to husband that resource with regard to keeping the overall oil market in balance and how it will affect the bottom line of their balance sheet and taxes.
“In the next decade, Guyana is poised for major growth. The International Energy Agency predicts a more rapid increase in oil production than the Organization of the Petroleum Exporting Countries, expecting Guyana to reach 1.2 million barrels per day by 2028. OPEC forecasts a peak of about 1.9 million barrels per day by the late 2030s, marking Guyana as a significant contributor to non-OPEC supply growth. This contrasts with the expected medium-term increase and subsequent decline of US oil production in the 2030s.President Ali has strongly committed to continuous production, stressing the adherence to international law, ethics, and historical context.”
https://2025.otcnet.org/2024-technical-program/guyana39s-emergence-regional-energy-powerhouse-expansion-global-oil-market
Ovi,
No doubt there are many factors at play, but technically the oil cannot be produced without the development of more FPSOs. Whether the FPSOs are developed and how quickly that happens depends on many factors. As of June 24, 2024 this is Exxon’s plan according to Bloomberg. FPSOs are planned to come online in 2025, 2026, 2029 and 2029, at roughly 250 kb/d increments for each new project.
No need for traditional platforms, “only” FPSOs?
A lot/several small dispersed fields comes to mind, not knowing the geology. But I may be wrong, as has happened.
Could also be deep?
Laplander,
I don’t know much about deepwater offshore oil production, but my understanding is that FPSO projects are a necessary piece of the puzzle.
More information on the developments in Guyana at link below
https://corporate.exxonmobil.com/locations/guyana/guyana-project-overview#DiscoveriesintheStabroekBlock
For the most recent project (fourth overall, named Yellowtail) along with the FPSO:
Six drill centers are planned targeting the Yellowtail and Redtail resources with 51 wells; 26 production and 25 water and gas injection wells.
They are targeting a 2025 startup with full capacity aimed at 250 kb/d.
Venezuela
Saudi Arabia Ramps Up Purchases of Dirtiest Oil Amid Scorching Summer
Fuel oil imports in June highest since at least November 2020
World’s biggest crude exporter buys fuel oil for power plants
https://www.bloomberg.com/news/articles/2024-07-12/saudi-arabia-ramps-up-purchases-of-dirtiest-oil-amid-scorching-summer?accessToken=eyJhbGciOiJIUzI1NiIsInR5cCI6IkpXVCJ9.eyJzb3VyY2UiOiJTdWJzY3JpYmVyR2lmdGVkQXJ0aWNsZSIsImlhdCI6MTcyMDc5Njk1MywiZXhwIjoxNzIxNDAxNzUzLCJhcnRpY2xlSWQiOiJTRzNSNUxEV1JHRzAwMCIsImJjb25uZWN0SWQiOiJFQjMzQUE3MEVBN0Q0QjdFOUJEMjRENjc4OTY3NjRDQyJ9.hZPq-RONuzsXDkCE8IS4utNHsz762eJEn-IbPozsYIk
Rgds
Vince
Keeping the scum out:
https://pbs.twimg.com/media/GSN0aaeWEAAq-sq?format=jpg&name=small
So host countries aren’t hosting….
The Rig report for the Week Ending July 12
– US Hz oil rigs were unchanged at 428. This is the tenth consecutive week with no rig increase. They are also down 30 from 12 weeks ago and are at the lowest count since January 2022 when the count was 434 and rising after the Xmas break.
– The Texas rig count was unchanged at 234 rigs and is down 92 from January 2023.
– Texas Permian rose by 1 to 189 while the New Mexico Permian held steady at 101. The Texas Permian is down 55 rigs from the 2023 high of 244 in April 2023.
– In New Mexico, Lea and Eddy were both unchanged at 50 rigs each.
– In Texas, Midland county was down 1 to 18 while Martin was unchanged at 31
– Eagle Ford dropped 1 to 43.
– NG Hz rigs dropped 1 to 87. (Not shown).
Ovi, perhaps this is too simplistic, but it would be interesting to look at rig count movements especially in the Permian based on the average weekly price for WTI for the last year or two. It seems like low $80s is a break even spot where rig counts stay about even, below that they contract. Might provide a clue for the break even price for a well.
Stephen
Attached is a rig vs WTI chart for the combined rig count for Midland plus Martin counties The WTI price has been shifted forward by eight months to roughly parallel the rig count. The rig count stops in July. If the eight month shift is about right, the combined rig count for those two counties may fall a bit more, but not much, based on the price of oil stabilizing in the $80/b range.
Also attached is the rig count for NM. It seems to have been pretty steady around a count of 100 and not affected by the price of WTI. There may be a different cost vs returns environment in NM.
Ovi,
I think the HOR count would be most affected by the market expectation of oil prices in the future, say 8 months to 24 months in the future as most of the oil is produced early in the life of a tight oil well (roughly half of a well’s EUR is produced in the first 18 months for the average Permian basin well).
New Mexico Lea plus Eddy county rig count.
Interesting I appreciate this thank you!
Frac Spread report for the Week Ending July 12.
The frac spread count dropped by 4 to 238 and is down 25 from one year ago. It is also down by 34 spreads since March 8. The overall trend in frac spreads appears to be down slowly.
Combined C plus C output for Argentina, Brazil, Canada, Guyana, Norway, United States, and Venezuela.
Just noticed I forgot Argentina on that chart title above, but the comment is correct, it is the 6 nations in the chart title plus Argentina.
Combined C plus C output for the Rest of the World minus the output of the 6 nations in previous chart. Note that most of this decrease has come from 5 nations (Russia, Saudi Arabia, UAE, Kuwait, and Iraq).
For Russia, Saudi Arabia, UAE, Kuwait, and Iraq as a group their output decreased at an average annual rate of 1202 kb/d, so the rest of the World minus the 5 nation group above (Big 4 OPEC plus Russia) actually increased output by 513 kb/d.
Hypothetical, if these countries should decide, for instance, that they don´t support what´s going on in the ME currently, then what?
But of course money matters too, so not an easy answer.
Late post, but anyway…
In the chart above for “Rest of World C plus C” much of the decrease in output has been from OPEC and Russia, the chart below has Rest of World minus OPEC and Russia C plus C. Output has been slightly lower for this group, but relatively flat (the trend is not statistically significant) R^2 is 0.06. This 74 kb/d average annual decrease is about 11% of the total Rest of World average annual decrease of 689 kb/d over this period (Jan 2022 to March 2024).
If we subtract output from the OPEC Big 4 (KSA, UAE, Kuwait and Iraq) plus Russia from World C plus C output (as these are the main 5 nations that have curtailed their oil output to balance the World Market) we find that for the past 24 months (April 2022 to March 2024) the average annual increase has been 2496 kb/d.
Russia’s Crude Shipments Drop by the Most Since Ukraine Invasion
Russia’s weekly crude exports crashed by the most since before the 2022 invasion of Ukraine in the seven days to July 7, with the less volatile four-week average falling to the lowest since February.
There was no clear cause for the slump in shipments. There were no gaps in loading programs to suggest maintenance work and no reports of storms affecting the berthing or loading of vessels. But shipments were down week-on-week from the Baltic, the Black Sea and the Pacific.
Sad article
https://oilprice.com/Energy/Crude-Oil/Oil-and-Gas-Are-Here-To-Stay.html
Because they’re not here to stay and there is no replacement for them.
JT
You are absolutely correct, but I would not call it sad.It is the inevitable consequence of exploiting a finite resource, and it was ever thus the way that eventually there would be a hard landing. Essentially the moment man moved from hunter gathering we as a species were doomed. With each generation increasing their knowledge and skill sit has enabled a population surge that was unprecedented. Growth became a necessity, and growth required ever more exploitation of finite resources. Populations grow to the limits of the resources available and then collapse. There is no steady state. Some believe that the global population will peak. I have no doubt that there will be a peak. But a leveling off looks increasingly unlikely. The peak will result in a rush to hoard resources. Conflicts are inevitable.
Our governments are collectively dumb; most lack any idea of the task at hand. Not one government is now willing to even talk about population control let alone put it into practice. Meanwhile the flora and fauna of the planet will be decimated.
I think BP are probably optimistic. I do not see and Peak demand any time soon. Peak oil will be a supply side issue.
Carnot
I agree it’s a supply side shock that we’re presently in. The banking sector is energy blind and can’t recognize that the “inflation “ they’re fighting isn’t inflation by their definition. It’s rapid cost escalation because of depletion. Economic sectors are competing for resources driving prices in all sectors up. Basically that’s why renewables and EVs just hit a wall.
Without cheap energy growth the global system has cannibalized what stocks of energy were available. Such as selling off public assets to private firms in an attempt to keep the system going. All the leverage we see in the system was a futile attempt to keep legacy costs of social services going.
What’s happening now is the final hours of every man for himself. The political circus we’re witnessing is precisely that. Rats fight for scraps.
Once the frack oil starts its terminal decline which we’re on the verge of there will be no replacement for it. There is no Ghawar waiting to be tapped this time. Exports have been declining rapidly do to economic development in producing states and well depletion. Low wage employment is drying up. Crime is increasing like stealing charging cables from EV chargers. This is only going to increase. The integrity of industry is compromised by cost cutting like we see at Boeing. Everyone is distracted by foolish social issues that have absolutely no material meaning.
Oh but if we can just electrify the system problem solved right? That myopic view of the predicament is a source of comfort for those who believe it. It is for those who can’t accept the situation is terminal and there are thousands of snake oil salesmen ready to take advantage of the naive view of things.
JT. After this global peak plateau of supply is left behind in the early-mid 2030’s, the decline in supply will be a long story. I agree that there will lots of very disruptive jostling for access to the remaining supplies.
Where I disagree with is the appropriate response to the situation. For those who won’t have abundant oil for an indefinite time, it makes perfect sense to make a strong move to replacing what they can with electrical mechanisms, since these mechanisms are more energy efficient and can be powered by a range of other energy sources. Of course, its a more rational and effective response than just sitting on your hands.
In the time after peak oil plateau, countries have several paths to avoiding the worst of energy poverty. One is a supply of oil that their country hasn’t just used up in a flash, or being good friends/allies with nearby countries that still can export fuel. The other big path is the one that makes a massive effort to electrify everything, based on the production of as much domestic electricity as they can pull off.
I have seen rational arguments for avoiding the national shift towards electrification.
-some like Hideaway have argued that we should acknowledge the ecological destruction of mass population overshoot and simply forgo the attempt to offset oil depletion in order to hasten the rapid decline of population. In effect, lets collapse quick.
-most others here, and maybe Hideawy too, have a much more simple rationale…they hope to make more money in a setting of oil shortage/ energy poverty.
-third, some just see all attempts as guaranteed to fail, so why bother.
To the last point, I have no idea how much of the job replacing oil consumption the world can get done. I do know I’d prefer to live in a country or region that got a big chunk of the job done while there is still a little time.
A previously posted picture of the global oil plateau,
a version with longer time frame displayed and future production projection made by Dennis.
By the way, the ground of the Permian oil field dropped of 28 cm in some locations.
And still field pressures are dropping below bubble point….with compression drive.
North Dakota oil production was down 48,558 barrels per day in May.
Click on graph to enlarge.
Make of this chart whatever you may.
Click on the chart to enlarge.
Does this lower productivity per well take into account longer laterals?
These are all producing wells in North Dakota. In May, there were 18,593 of them. Every month, new wells come online, and some are shut down. Of course, all the newer wells produce more than the much older wells. This is just the monthly average of all of them combined. Back in 2014 the monthly average was over 100 barrels per day. It fell to the mid 70s in 2016. But in 2019, just before the Covid shutdown, the average was back up to about about 93 barrels per day. Check it out at this link.
ND Monthly Oil Production Statistics
Frugal,
It is output per well, lateral length not part of the equation. Simply total output divided by number of producing wells divided by days per month to get daily oil output per well.
Greater efficiency!
1. It’s normal that as the well count increases, BO/well decreases. This will happen even with no degradation of the well profiles or change in rate of adding new wells. As a thought experiment, you can take some well profile and just add 10 wells per year. (Dennis has done this.) Since it’s an artificial experiment, you know that wells are not degrading, nor is pace of development changing. However, the population will still become more old over time, as the percent of new (high rate) wells becomes smaller versus the average population of stripper-ish wells.
2. Of course there can be superimposed effects as well. For example look at the big plunge in APR20 and the partial rebound. This is because the snapback from Covid curtailments was bigger than the meta trend of less oil per well.
3. If you look at a longer time frame (e.g. before the widespread development started in 2006), you’ll see a rise in oil per well around 2008. This is because the population of wells was essentially dominated by old stripper wells from the 1980s…and then you got a sudden slug of strong wells. Enough to reverse the effect of factor (1).
4. It’s really not a great metric to use. Has been misapplied in the past. Somehow it is moth to flame though. Sort of like the people every couple years who “discover” that RRC shows TX peaking (when it’s really just the reporting delay). It’s much sounder to look at generations of wells at same point in time. This was the discussion with Dennis. Even if I had some nuanced disagreements on some of his implications, at least we agreed about the subject of discussion. This generational comparison approach is what Enno showed us many years ago…as superior over this metric.
5. Also important to realize that the chart is not true zero. So the relative size of the trend is visually overstated. The chart makes it look like current production per well is about a quarter of pre-Covid, but it is really two thirds.
6. Not a criticism, just a note on the content itself: It does seem like there was sort of a rough plateau pre Covid and now. Many different factors going on (not just para 1) and just an interesting result of what you see here how they combine. In a para 1 thought experiment world, you would just see a pseudo exponential drop in rate/well over time
Anonymous, I have only been following North Dakota oil production for about 15 years, so I am well familiar with everything you wrote. But thanks for the school lesson anyway. But I must comment on one thing you wrote.
5. Also important to realize that the chart is not true zero. So the relative size of the trend is visually overstated. The chart makes it look like current production per well is about a quarter of pre-Covid, but it is really two thirds.
My charts are always non-zero because I want to emphasize the change. I trust that our readers are smart enough to realize that the chart does not start at zero. However, if we have readers that think 64 barrels per day is only about a quarter of 93 barrels per day, then just let them think that because they are too goddamn dumb to even talk to. But I don’t have such a low opinion of our readers. I think they are a lot smarter than you seem to believe.
Also, if we look longer term at daily oil per well it has increased from 2000 to 2015 and then decreased, there were about 3000 producing wells at the start of 2000 and by Jan 2015 there were about 11800 producing wells with about 2060 wells added in 2015 vs about 73 wells added in 2005, the rate that new wells added makes a difference as well as the total number of producing wells. The rate of well completion has increased and decreased over time, but generally a larger total number of wells will require a larger number of new well completions to move the needle.
Dennis,
Agreed (point 3). And thanks for a great chart!
I’m not sure I understand why rural Trump voters would be for his energy policies. Rural landowners where I’m at are making good $$ off wind and solar projects. He says he’s going to disincentivize those. He also thinks oil prices are way too high. Not sure I see how that helps the oil industry to lower prices from here.
I guess Trump is hoping for job layoffs in all energy categories.
I assume Trump would dismantle the methane rules. Which would benefit stripper producers, as the Biden Administration did the same thing the Obama administration did, despite the DOE study which showed that generally stripper wells are not the methane problem that new shale wells are.
It will be interesting to see if, after all of this consolidation, Trump will be able to force XOM, CVX, COP etc to produce enough extra oil to drop prices back down to his preferred price of $40.
At least then Nony would be happy, more money for clothing and concert tickets!
Shallow sand,
I don’t think oil prices will reach $40/bo unless the US economy responds to Trump’s policies with a deep recession. I am fairly certain we would see very few new tight oil wells drilled and completed at $40/bo (in 2024$). Note that the average annual oil price (average annual imported crude oil price) in the US has been over $40/bo every year from 2002 to 2023 with the average annual imported crude oil price over that period (in 2024$) at $86.50 per barrel.
I am guessing that even stripper well producers would not be doing very well at $40/bo in 2024$.
Have you been affected much by the methane rules?
Dennis.
I do believe 2020 oil prices were below $40. 2017, 2018 and 2019 were also low, but not because of Trump policies, but because of shale oversupply during the “shale stocks are growth stocks narrative.”
The methane rules have so far affected us zero, as the Federal government is delegating enforcement to the states, and most state agencies are wholly unequipped and unprepared to take on this enormous task.
State agencies are having trouble finding personnel as talented young people have been told oil and gas is a dead end, even in government regulation.
We had a well inspector pass away, I think two years ago. He was still working past retirement age, in part, because they couldn’t find anyone to replace him. Of course, he liked working, and was in a position where nobody at the home office could give him guff, because the new people in the home office mostly don’t know anything about the industry they are regulating.
The state finally hired his replacement about a month ago, after a long search for someone qualified.
If the methane rules are enforced, they will affect us big time. But I’m not so sure they will be, as our state doesn’t want immediate BK filed by a large percentage of the producers, which would lead to tens of thousands of wells in the state plugging fund.
We have a plugging fund and will take care of ours if that comes to pass. At least that is our plan.
I can guarantee most operators won’t have that capability and/or desire to take care of them.
I also know our state has an informal list of operators that are considered too big to fail. The state tries very hard to not regulate them out of business. I’m aware of one that may be headed down that road anyway, due to mismanagement. Will be interesting to see what happens.
We spent over $200k in 2023 and early 2024 plugging almost all of the wells we deemed uneconomic. We currently have 3 TA injection wells and 3 TA producers. Thats it for inactive for us.
We will follow the methane rules to the best of our ability. We can buy or rent the expensive camera. We feel our wells are such low to no emitters that we may actually enhance the value of our production after that is determined through initial testing. There is no gas infrastructure in our field, so I guess any well that emits to much methane will simply have to be plugged.
As I have posted before, we don’t have wells capable of burning flares. There was never much gas infrastructure built because there never was much gas, after the early years over 100 years ago.
Our field does have a flank on the east edge with gas wells, but we understand they don’t make all that much gas. They are several miles from the oil wells. Gas infrastructure for oil wells which don’t even produce 1 MCF per day isn’t feasible.
Shallow sand,
Thanks for the info, much appreciated. I was giving average annual prices in 2024$, the monthly price did indeed fall below $40/bo in 2020, but the annual average imported crude price was $45/b in 2024 $ in 2020 according to the EIA.
Below are annual average imported crude prices in 2024$ per barrel from 2015 to 2023 based on the STEO Real Prices spreadsheet.
2015, 61.36
2016, 50.60
2017, 62.70
2018, 76.65
2019, 71.13
2020, 45.12
2021, 76.34
2022, 99.54
2023, 76.95
2020 is way off. What I find is WTI $39 and Brent $41.
We lived through 2020. It was the worst year ever for us, even worse than 1998. Even worse than 2016.
Shallow, your perspective is invaluable.
It sounds like you are saying that ‘most operators’ simply plan to walk away and leave all the pollution and safety and clean-up costs to someone else, pocketing their earnings and moving on? Industry wide? Is this normal behaviour?
See the destruction of the atmosphere in real time:
https://viirs.skytruth.org/apps/heatmap/flaringmap.html#zoom=4&lat=40.07777559297127&lon=-93.60273437499998&offset=15&chunk=2024
Most operators couldn’t afford to plug all of their wells at once if a dramatic policy change caused them suddenly to be completely uneconomic.
There are two plugging crews in our county, which has about 7k well bores. So it would take a long time to plug them all.
For example, on the wells we plugged, we started the planning for plugging them in the winter of 2022-23. We got the last ones done in early 2024.
The labor shortage in the oilfield is real.
Shallow sand,
You said the cost was around 200k, how many wells did you plug?
Thanks for your insights they are invaluable as Greenbub has already said.
26. Most cost in the $5k range, but some wells were a little more trouble. One a lot more trouble.
“I’m not sure I understand why rural Trump voters would be for his energy policies”
Its probably like most parts of his policies…the specifics really don’t seem to matter.
Its the overall bandwagon his voters like. He is a world class carnival barker.
Morgan sums it up.
https://surplusenergyeconomics.wordpress.com/
I’m not sure what to make of the average well production chart. I do not see what that tells me.
What would be interesting is completion data. It cuts that 7 to 8 month lag down a lot. I believe Frac focus includes some amount of by field completion data. I wondered if anyone has tried their reporting, and what they found?
DCLonghorn,
Novilabs also has completion data, the frac focus data is much harder to use, Novi labs uses frac focus as one of the databases and Enno Peters is much better at converting the data to a form that is easily used than I am. No need to reinvent the wheel.
See link below
https://public.tableau.com/shared/CXZGDZ3T5?:toolbar=n&:display_count=n&:origin=viz_share_link&:embed=y
and chart from that link below (link gives more info).
https://finance.yahoo.com/news/exxon-looking-drill-30-wells-103655085.html
Exxon’s hammerhead project to push Guyana to 1.5 mbpd.
The project is targeted for completion in 2029, article says capacity of more than 1.4 million barrels per day which could be 1.401 Mb/d rather than 1.5 Mb/d.
Thanks Dennis
Could you compare the completions to oil and gas, or just oil production changes, similarly to how the rig data fits.
I would love to see how well it follows. Thanks.
DCLonghorn,
You are most welcome.
Here is what it looks like for Permian Basin. At 500 completions output was rising, with fewer completions (roughly 440 per month) output is at a plateau assuming no change in new well EUR after Dec 2022 up to Feb 2024. Completions are assumed to be roughly 1.4 times the rig count (which has been shifted forward by 8 months to account for time from spud to first flow for the average well) with DUC inventory assumed to be constant.
Criticism welcome as I am always willing to learn. The 7 to 8 month lag between spud and first flow was suggested by an oil pro who has been willing to teach me a lot and I thank him. Errors in analysis are all mine.
Thank you Dennis, I appreciate your assistance on this and all the work you, Ovi and Ron do on this blog.
What I was trying to tease out of the data is the correlation between completion information and oil production, rather than rigs. I’m not sure that it is a better predictor than rigs, but it seems as it should be.
Thanks.
DCLonghorn
In the US April update a number of county charts were posted comparing oil production with rigs time shifted by forward by 7 to 8 months.
As noted in the post, rig counts were used to project production as opposed to completions because very few extra DUCs were being completed back then.
Attached is the chart for Eddy county. The rig data has been shifted forward by 8 months. It will be interesting to see if production begins to rise in July because the rig count begins to rise then.
DCLonghorn,
Permian tight oil output vs completions Sept 2023 (lower right point on chart) to December 2025 for my scenario.
Anybody know about the potential production of oil and gas from offshore shale formations?
Hickory,
I am fairly sure that will not be economically feasible in deep water (more than 1000 meters), unless oil prices are at $1000/bo in 2024$ (and even that might not be high enough, it is simply a WAG). Perhaps possible in shallower offshore areas, but still expensive (maybe $300/bo in 2024$ might be enough in that case).
Hickory,
In the offshore GOM, the source beds are just too deep to be targeted as a resource play, 25000′ or deeper. In a few cases, the deep source beds have been rafted up to shallow depths, via some pretty wild salt tectonics. I know of a few wells that have drilled the source rocks in these cases. At the time these wells were drilled, back probably 20 years ago or so, the resource plays weren’t considered prospective. If these wells were drilled today, the operators would evaluate them a little differently, and, perhaps, the source rocks would be considered of interest, but, again, these would just be one-offs.
Thank you Bob.
I do wonder if there are a shallow depth oil bearing shale layers elsewhere in the world.
Well, there is the Kimmeridge shale in the North Sea.
A frontier play in a mature basin – the Kimmeridge Clay
https://geoexpro.com/a-frontier-play-in-a-mature-basin-the-kimmeridge-clay/
In general, it can be assumed that petroleum expulsion efficiency from a source rock is about 2-12 %, suggesting that significant amounts of un-expelled oil and gas remain within the source rock and in the migration paths of the basin.
Knowing that about 45 billion barrels of oil reserves were primarily sourced from the Kimmeridge Clay, there is between 330 and 2,205 billion barrels left in the ground depending on whether a 2% or 12% expulsion factor is used.
New posts are up
https://peakoilbarrel.com/opec-update-july-2024/
and
https://peakoilbarrel.com/open-thread-non-petroleum-july-19-2024/