By Ovi
The focus of this post is an overview of World oil production along with a more detailed review of the top 11 Non-OPEC oil producing countries. OPEC production is covered in a separate post.
Below are a number of Crude plus Condensate (C + C) production charts, usually shortened to “oil”, for oil producing countries. The charts are created from data provided by the EIA’s International Energy Statistics and are updated to June 2024. This is the latest and most detailed/complete World Oil production information available. Information from other sources such as OPEC, the STEO and country specific sites such as Brazil, Norway and China is used to provide a short term outlook.
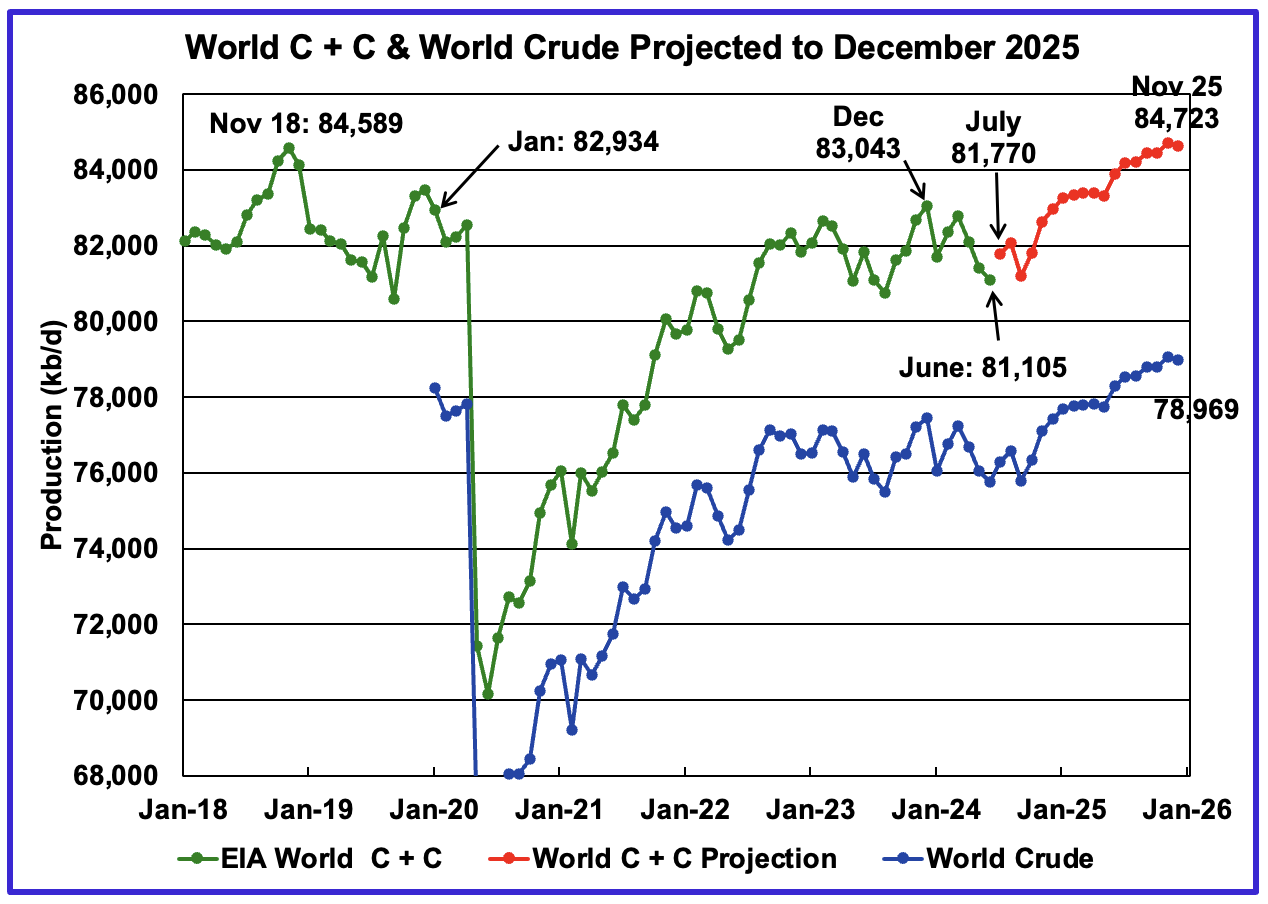
World oil production decreased by 299 kb/d in June to 81,105 kb/d, green graph. The largest decreases came from Saudi Arabai 350 kb/d and Russia 142 kb/d. July’s World oil production is projected to increase by 665 kb/d to 81,770 kb/d.
This chart also projects World C + C production out to December 2025. It uses the October 2024 STEO report along with the International Energy Statistics to make the projection. The red graph forecasts World oil (C + C) production out to December 2025 using the STEO’s October crude oil report.
For December 2025, production is expected to be 84,634 kb/d. It is preceded by a November 2025 peak of 84,723 kb/d. The November 2025 oil production projection is 513 kb/d lower than estimated in the previous post.
From July 2024 to December 2025, World oil production is estimated to increase by 2,864 kb/d.
A note of caution. The October STEO is now reporting/forecasting only Crude oil production which is also shown in the chart. As a result the red C+C graph is a projection based on the crude production graph.
Over the past 10 months, it was noted that the ratio (C + C)/C was changing MoM, possibly due to the EIA’s new crude reporting format. As a result the six month average ratio of (C + C)/C was used to make the December 2025 projection. Over the last 10 months that ratio has now settled down to slightly above 1.07 with only a small variation. As such the six month ratio will continue to be used going forward to continue to check for possible seasonal variations and/or increases in condensate from Iran.
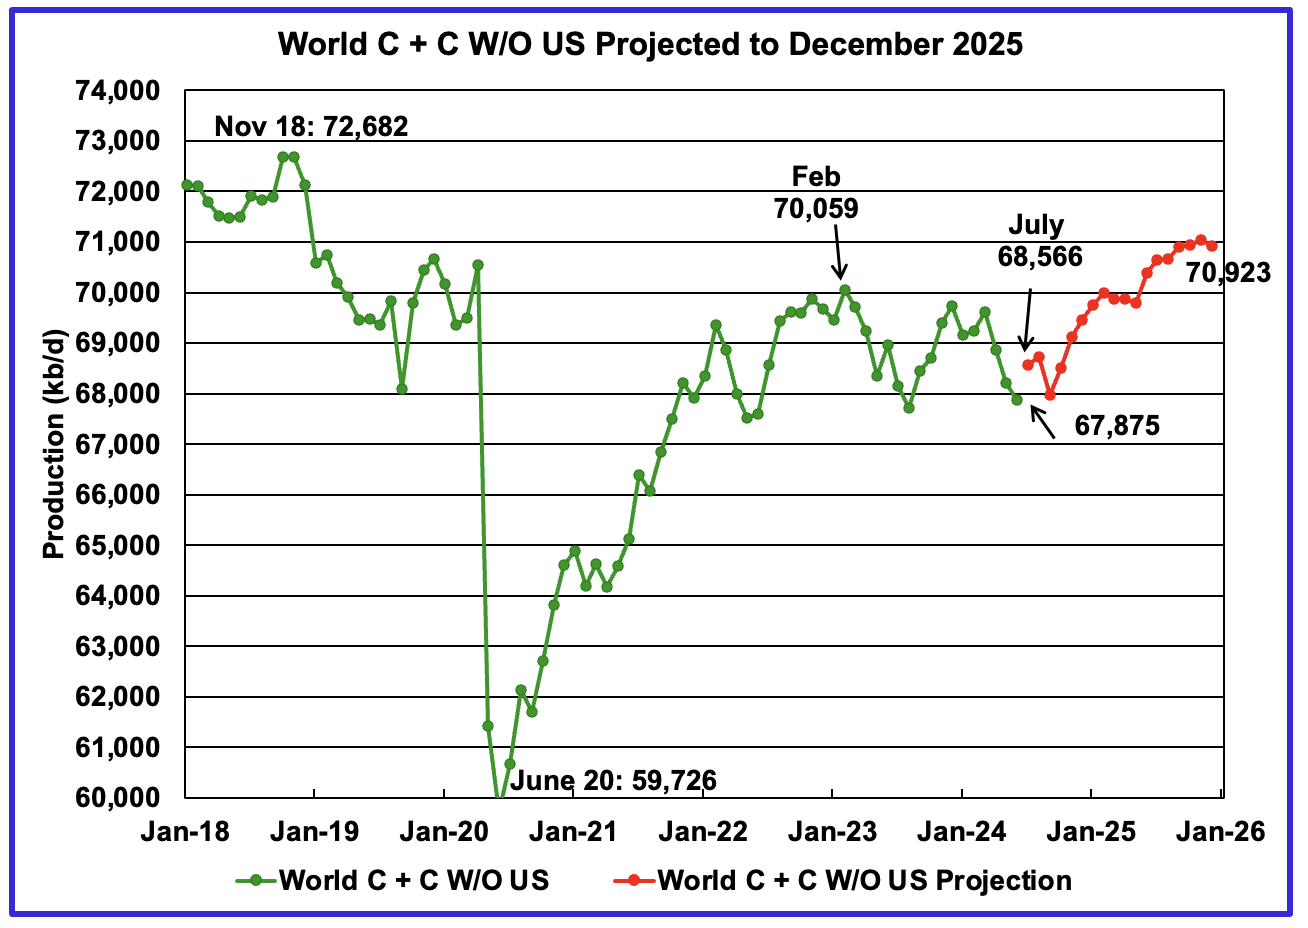
World June oil output without US decreased by 340 kb/d to 67,875 kb/d. July production is expected to rise by 691 kb/d to 68,566 kb/d.
Note that December 2025 output of 70,923 kb/d is 1,759 kb/d lower than the November 2018 peak of 72,682 kb/d.
World oil production W/O the U.S. from July 2024 to December 2025 is forecast to increase by a total of 2,357 kb/d.
A Different Perspective on World Oil Production
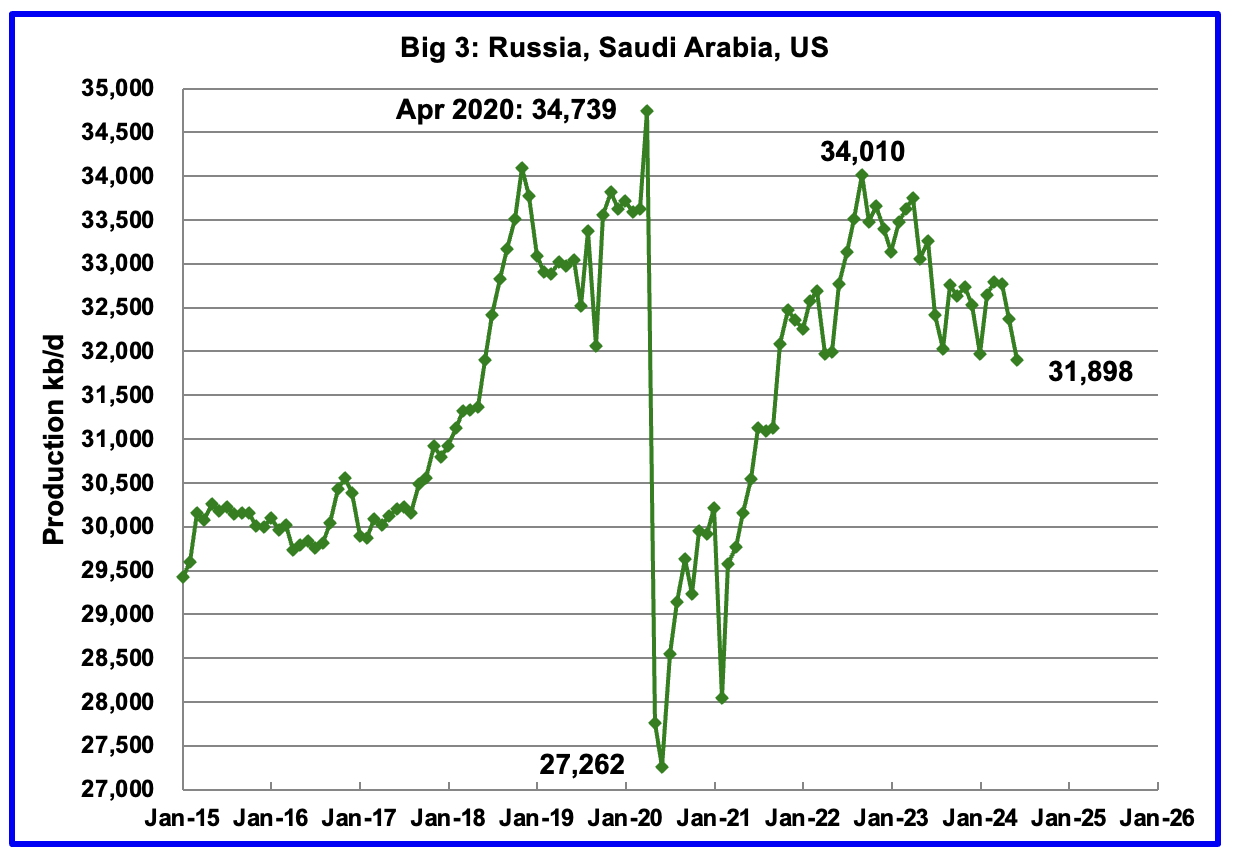
Peak production in the Big 3 occurred in April 2020 at a rate of 34,739 kb/d. The peak was associated with a large production increase from Saudi Arabia. Post covid, production peaked at 34,010 kb/d in September 2022. The production drop since then is primarily due to cutbacks by Saudi Arabia and cutbacks/decline by Russia.
June’s Big 3 oil production decreased by 467 kb/d to 31,898 kb/d. June’s production is 2,112 kb/d lower than the September 2022 post pandemic high of 34,010 kb/d. The countries with the biggest drops were Saudi Arabia and Russia, see Table below.
Adding in the current Saudi Arabia 1,000 kb/d cut would raise production to 32,898 kb/d, just 1,112 kb/d lower than September 2022 production. Saudi Arabia along with other countries which were scheduled to reverse their cuts in October 2024 have now delayed them to December 2024 because of lower Chinese/World demand.
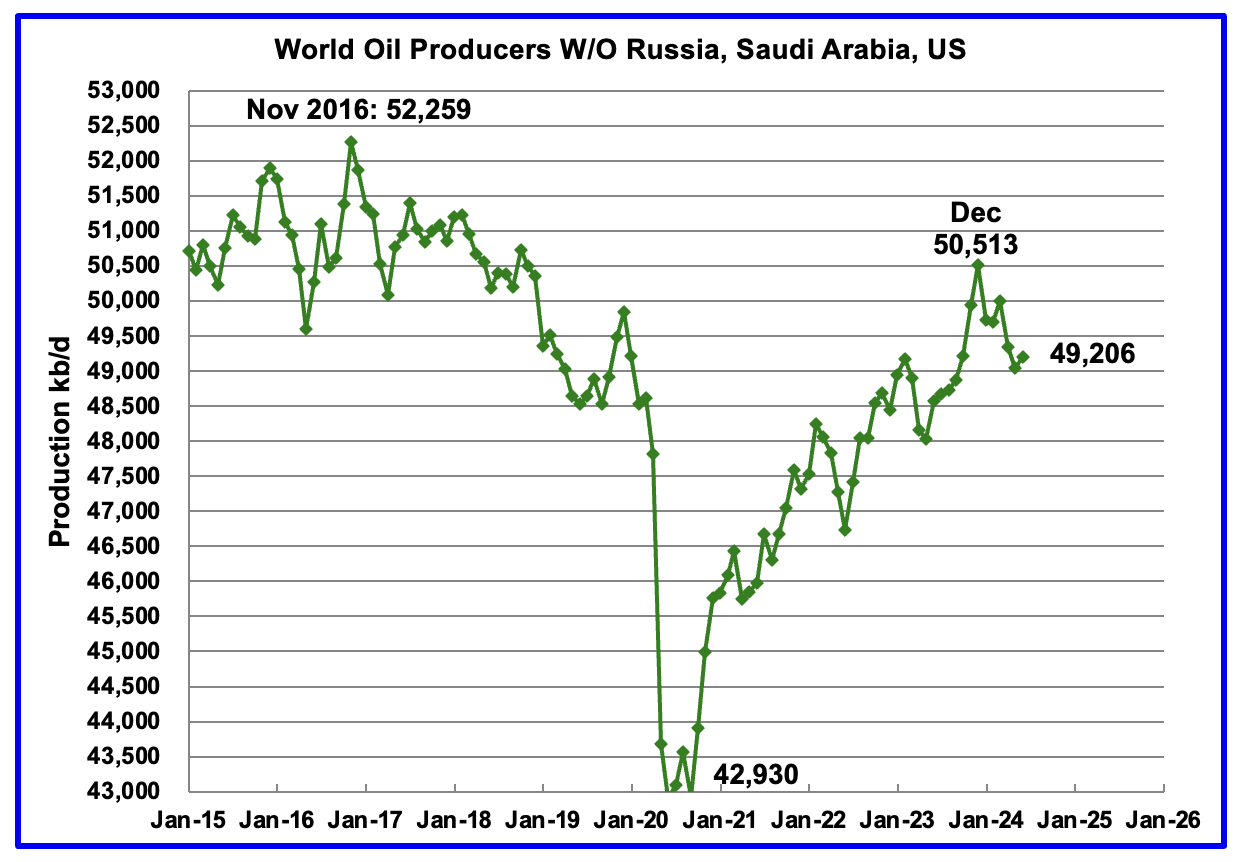
Production in the Remaining Countries had been slowly increasing since the September 2020 low of 42,930 kb/d. Output in December 2023 reached 50,513 kb/d, a new post covid high. However production began to fall in January 2024. June’s production increased by 167 kb/d to 49,206 kb/d. Of the 167 kb/d increase, Canada contributed 194 kb/d. The overall drop from December 2023 to June 2024 is 1,307 kb/d.
Countries Ranked by Oil Production
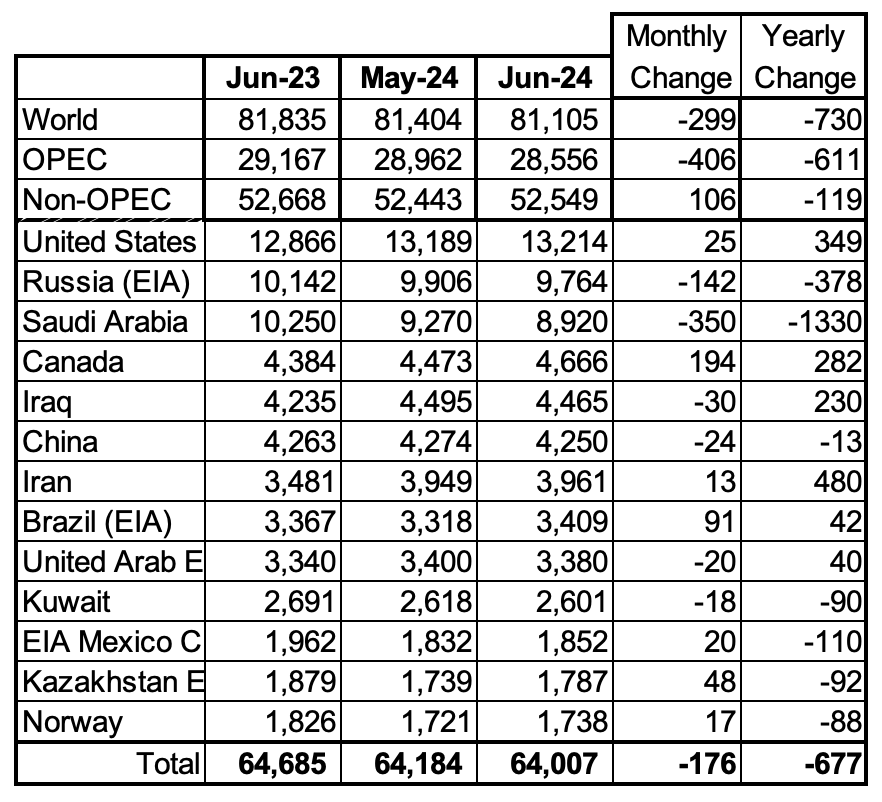
Above are listed the World’s 13th largest oil producing countries. In June 2024, these 13 countries produced 78.9% of the World’s oil. On a MoM basis, production decreased by 176 kb/d in these 13 countries while on a YOY basis, production dropped by 677 kb/d. Note the large MoM and YoY production drop in Saudi Arabia and the YoY increase for Iran.
June Non-OPEC Country Oil Production Charts
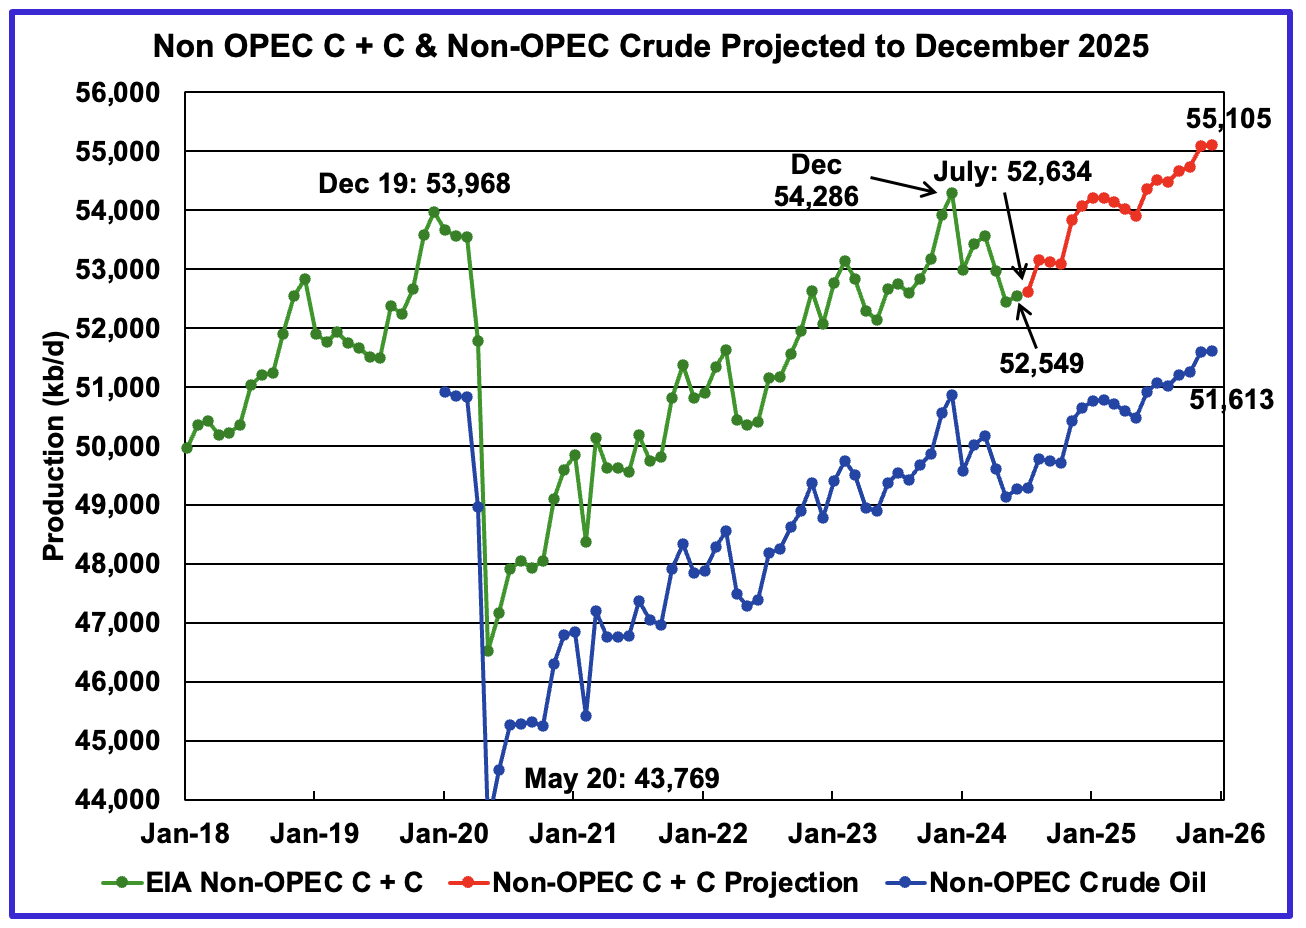
June Non-OPEC oil production increased by 106 kb/d to 52,549 kb/d. The largest increases came from Canada and Brazil while Russia offset those gains. Note that Non-OPEC production now includes Angola.
Using data from the October 2024 STEO, a projection for Non-OPEC oil output was made for the period July 2024 to December 2025. (Red graph). Output is expected to reach 55,105 kb/d in December 2025, which is 1,137 kb/d higher than the December 2019 peak of 53,968 kb/d.
From December 2023 to December 2025, oil production in Non-OPEC countries is expected to increase by 819 kb/d.
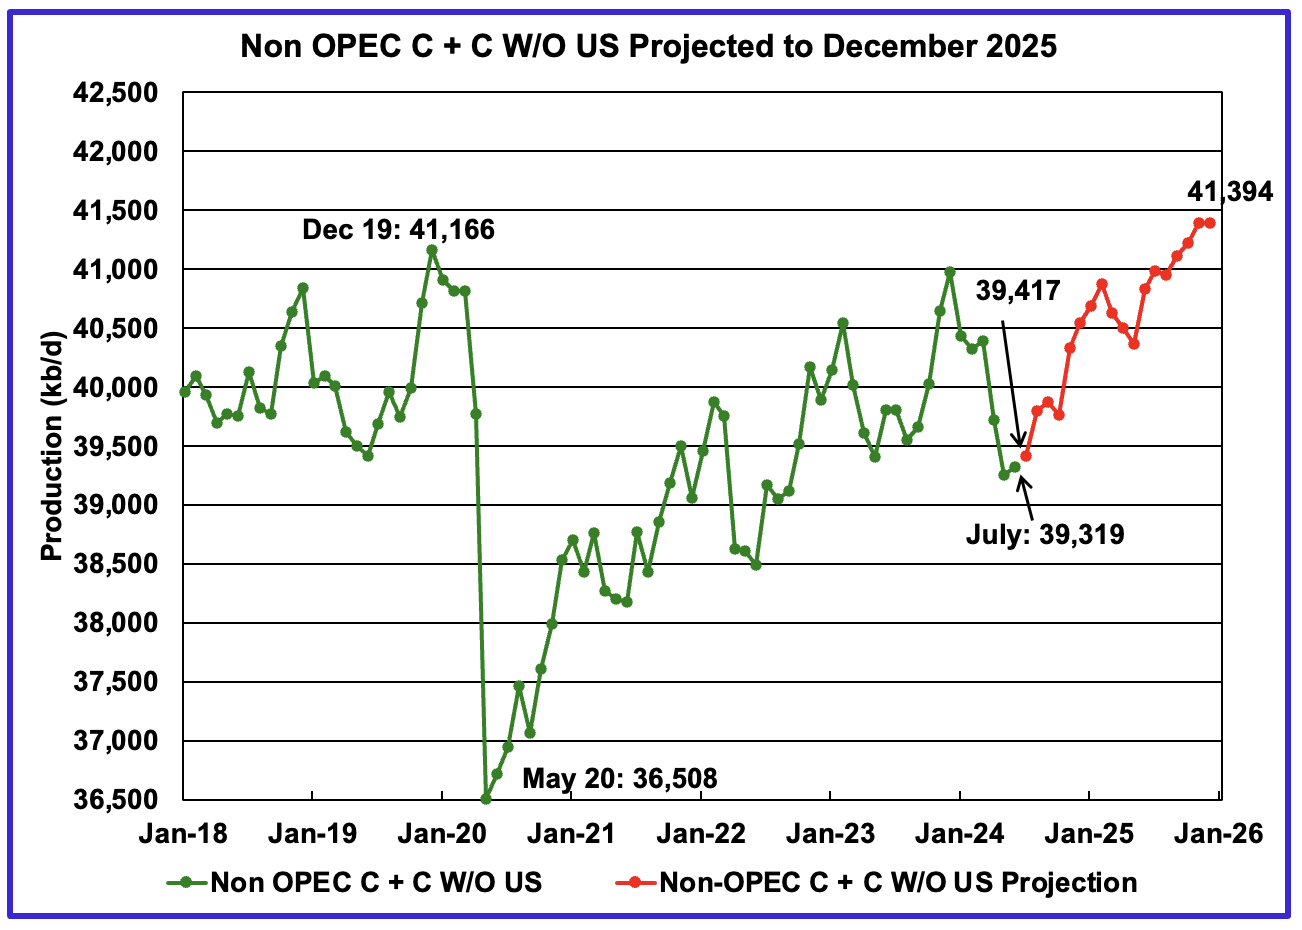
June Non-OPEC W/O US production rose by 65 kb/d to 39,319 kb/d. July’s production is projected to rise by 98 kb/d to 39,417 kb/d.
From July 2024 to December 2025, production in Non-OPEC countries W/O the US is expected to increase by 1,977 kb/d. December 2025 production is projected to be 228 kb/d higher than December 2019.
Non-OPEC Oil Countries Ranked by Production
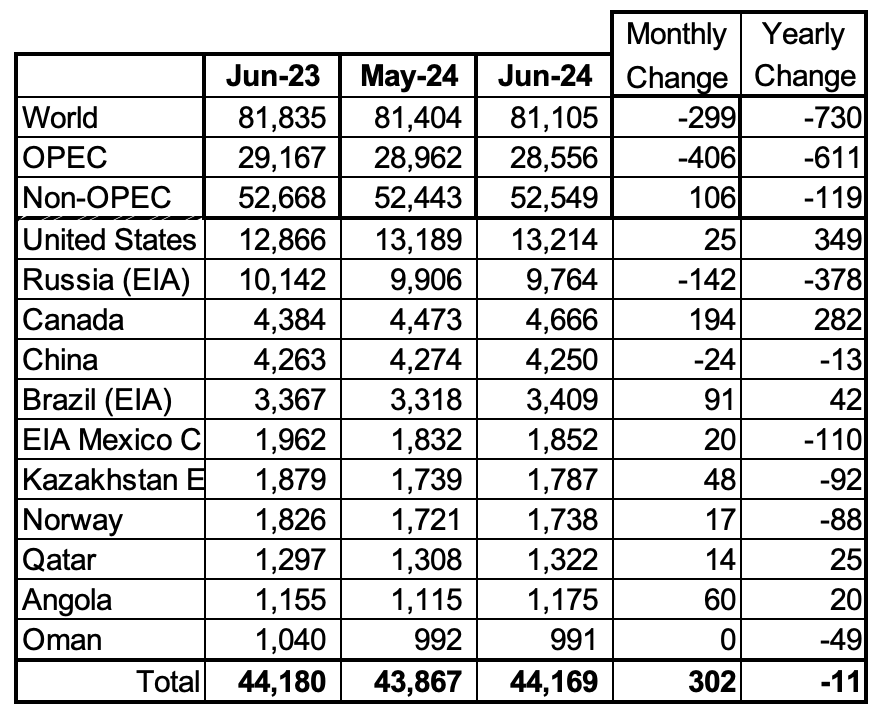
Listed above are the World’s 11 largest Non-OPEC producers. The criteria for inclusion in the table is that all of the countries produce more than 1,000 kb/d. Note that Angola has been added to this table.
June’s production increased by 302 kb/d to 44,169 kb/d for these eleven Non-OPEC countries while as a whole the Non-OPEC countries saw a monthly production increase of 106 kb/d to 52,549 kb/d.
In June 2024, these 11 countries produced 84.1% of all Non-OPEC oil production.
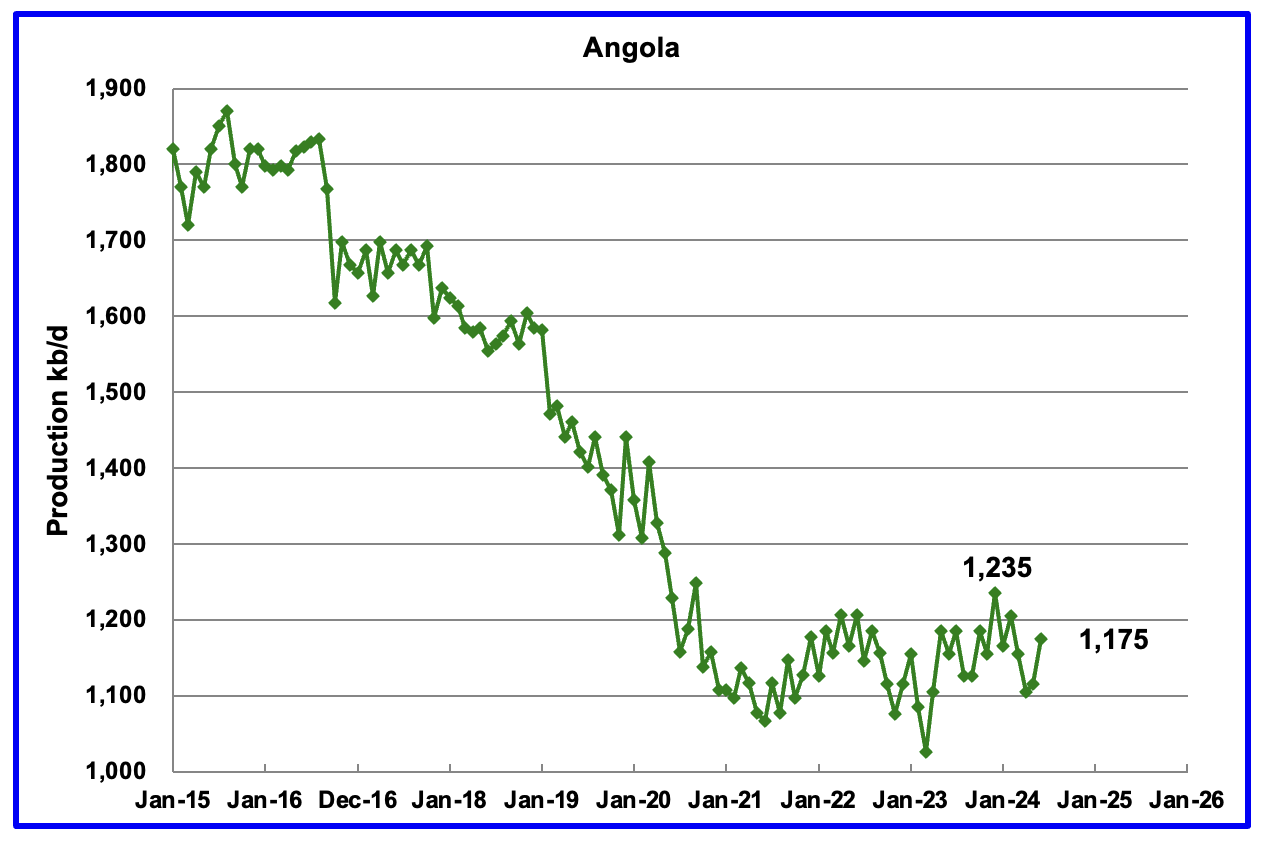
Angola has been added to the Non-OPEC producing countries since they withdrew from OPEC.
Angola’s June production increased by 60 kb/d to 1,175 kb/d. Angola’s production since early 2022 appears to have settled into a plateau phase between 1,100 kb/d and 1,200 kb/d.
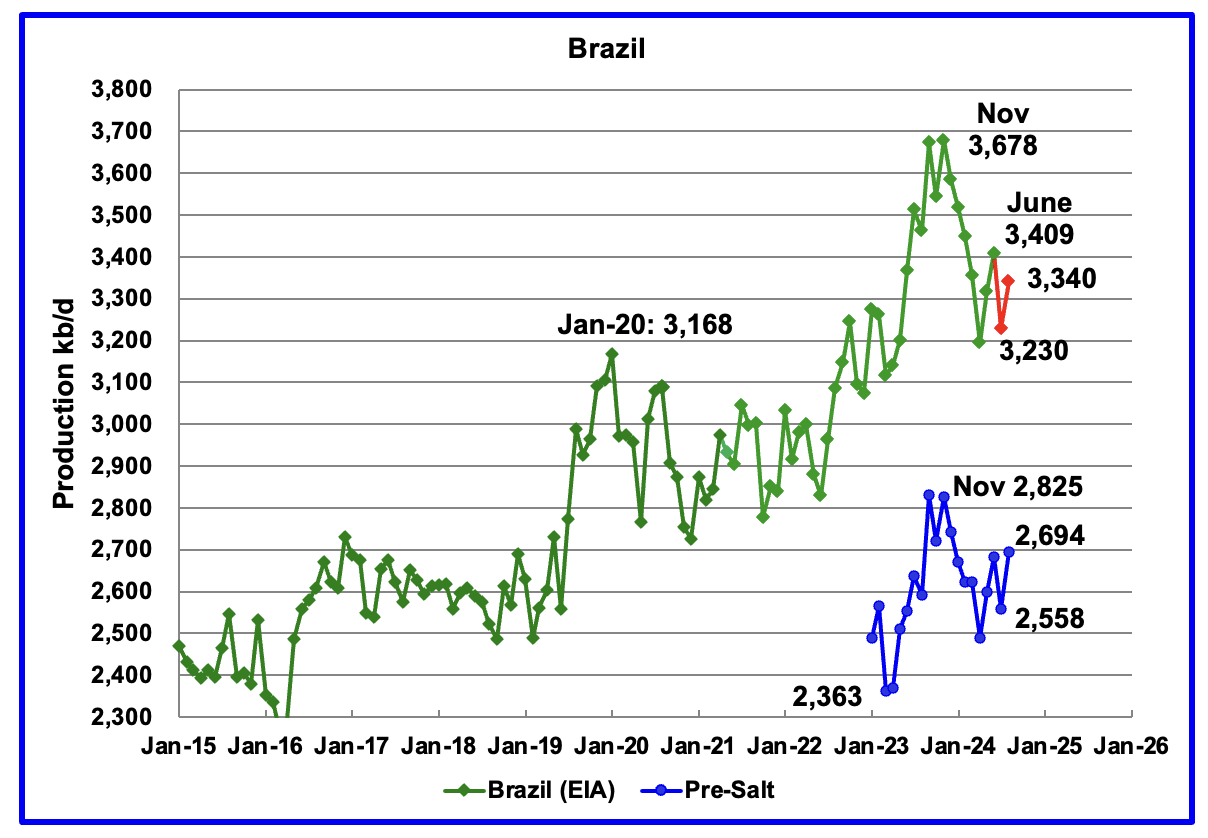
The EIA reported that Brazil’s June production rose by 91 kb/d to 3,409 kb/d.
Brazil’s National Petroleum Association (BNPA) reported that production decreased in July by 179 kb/d but rebounded in August to 3,340 kb/d. The BNPA has started reporting Brazil’s pre-salt production again. The August pre-salt graph tracks the crude oil graph. For August, pre-salt production increased by 136 kb/d.
The drop in production from November 2023 up to April 2024 was primarily due to extensive maintenance and production is expected to recover to previous levels going forward. According to OPEC: “The Brazilian state-controlled Petrobras FPSO unit, Maria Quiteria, is expected to start production in 4Q24 – earlier than previously expected – following its deployment at the Parque das Baleias integrated project.
Production after August has to increase by 338 kb/d to exceed the November 2023 high.
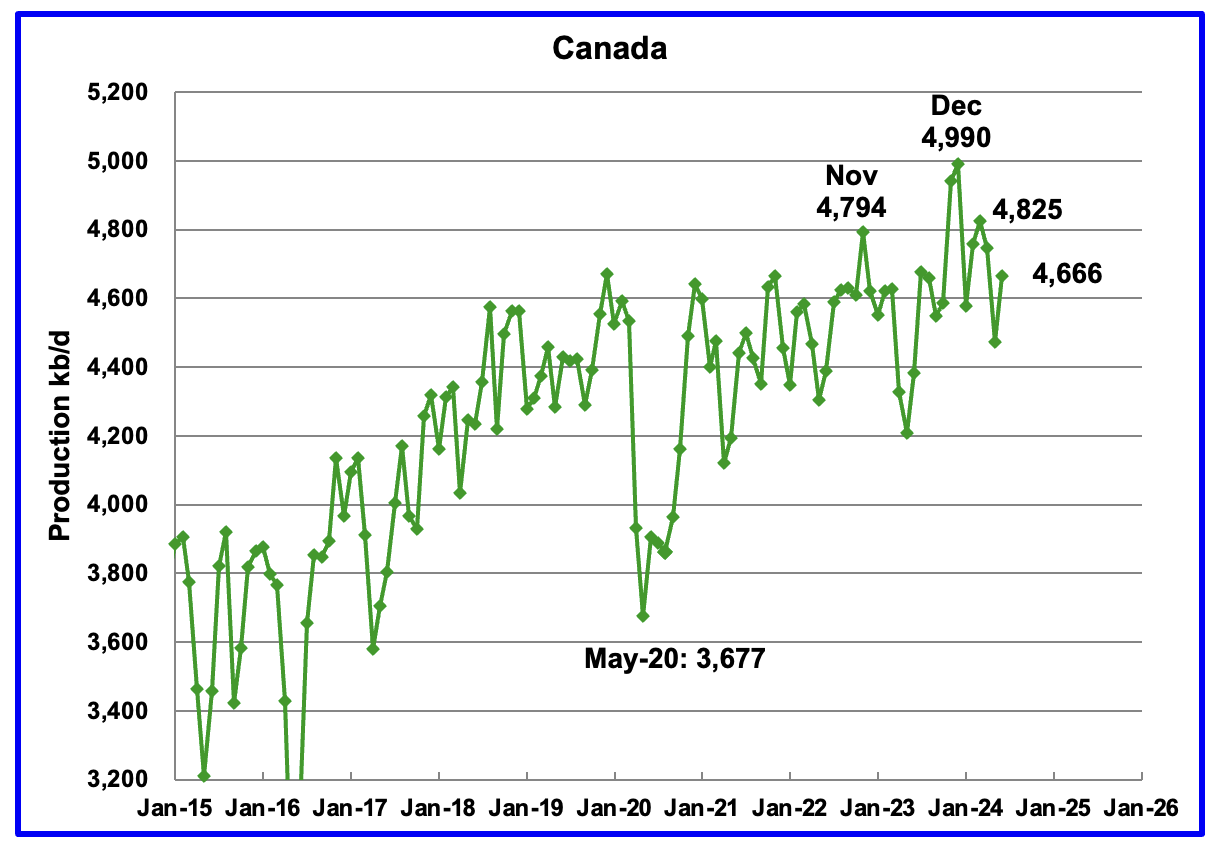
Canada’s production increased by 194 kb/d in June to 4,666 kb/d. The increase is primarily due to the return to operations of facilities shut down for maintenance.
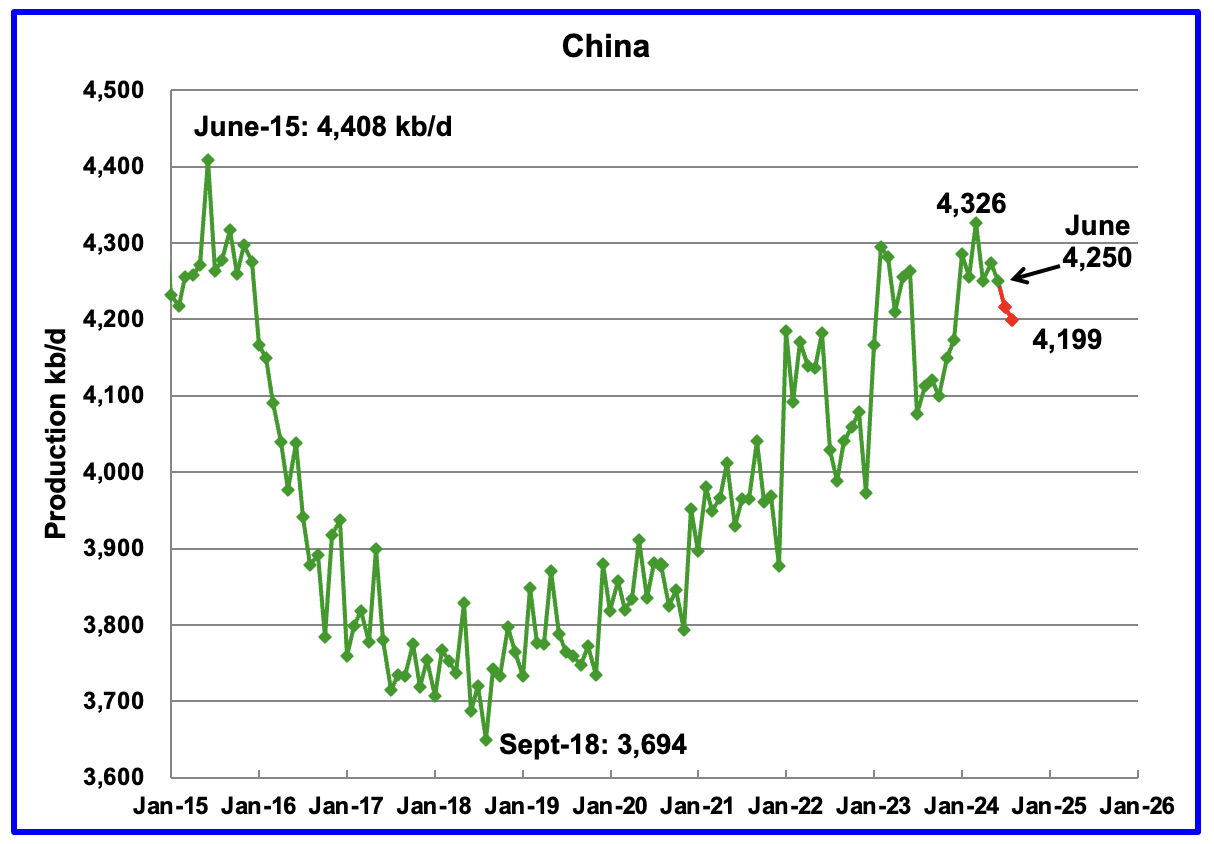
The EIA reported China’s June oil output decreased by 24 kb/d to 4,250 kb/d.
The China National Bureau of Statistics reported production for July and August. July dropped 35 kb/d to 4,215 kb/d and August dropped by 16 to 4,199 kb/d.
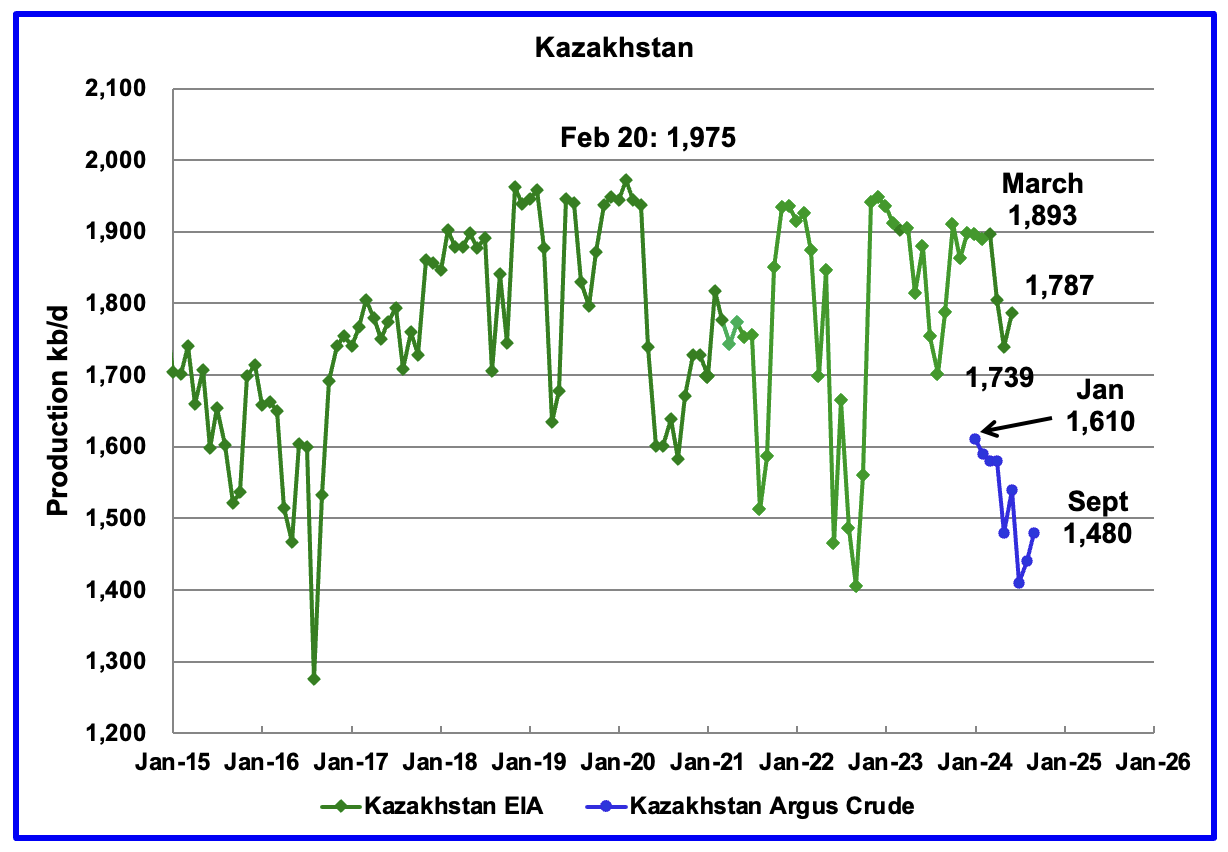
According to the EIA, Kazakhstan’s oil output increased by 48 kb/d in June to 1,787 kb/d. Kazakhstan’s recent crude oil production, as reported by Argus, has been added to the chart. In September crude production rose by 40 kb/d to 1,480 kb/d.
Since January, Kazakhstan crude production has dropped by 130 kb/d to 1,480 kb/d. Their OPEC production target is 1,470 kb/d. At 1,480 kb/d, Kazakhstan is essentially on target.
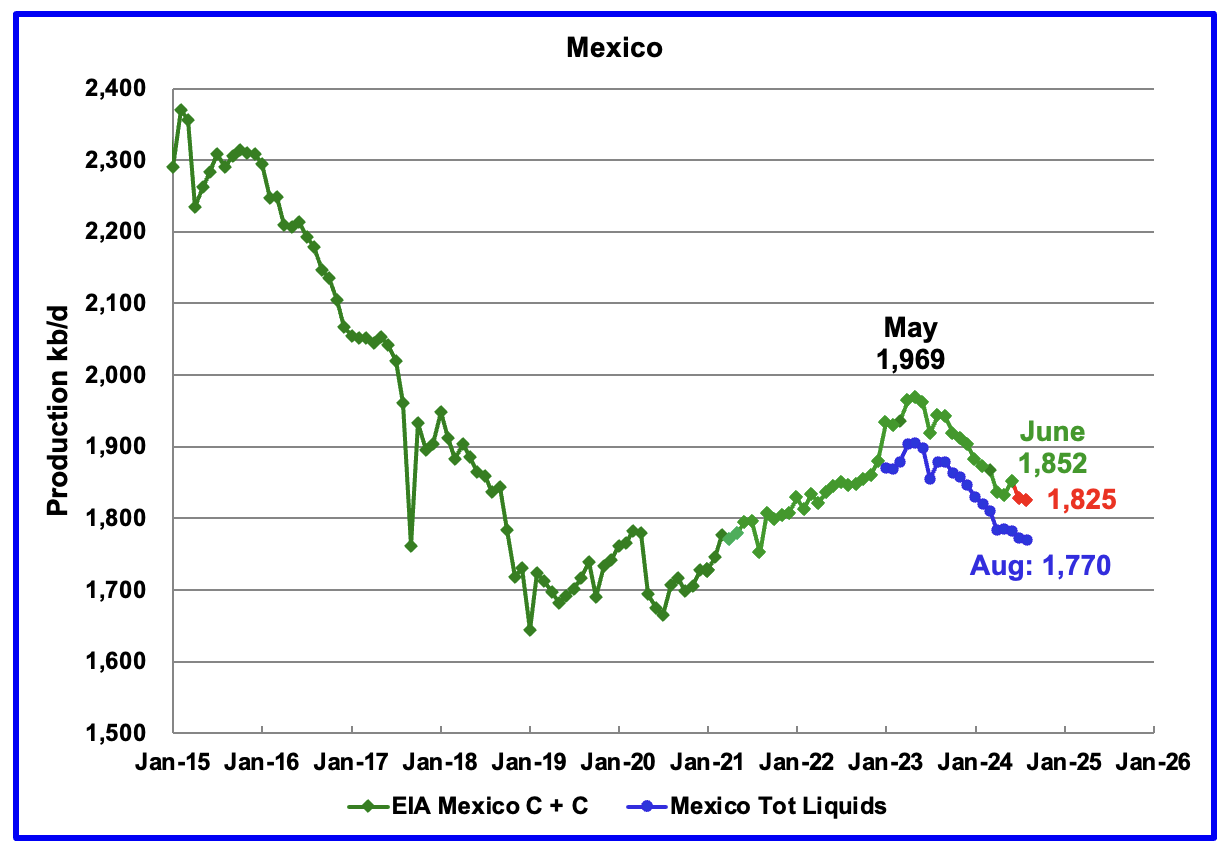
According to the EIA, Mexico’s June output increased by 20 kb/d to 1,852 kb/d.
For June, Pemex issued a new and modified oil production report for Heavy, Light and Extra Light oil. It is shown in blue in the chart and it appears that Mexico is not reporting condensate production when compared to the EIA report.
In earlier reports, the EIA would add close to 55 kb/d to the Pemex report. The gap between the EIA report and Pemex on average has been close to 55 kb/d over the last 6 months. Condensate of 55 kb/d has been added to the Pemex report to estimate Mexico’s August production of C + C 1,825 kb/d, red markers.
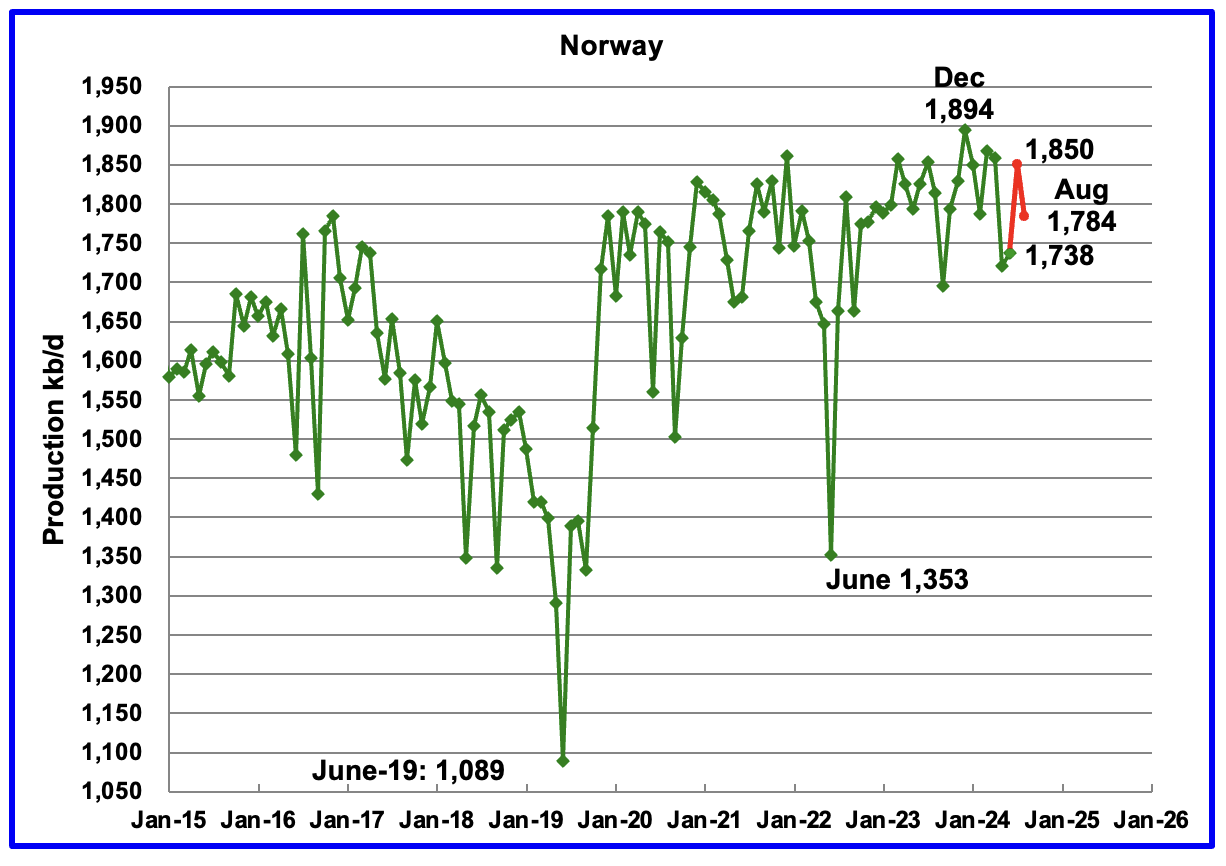
The EIA reported Norway’s June production increased by 20 kb/d to 1,738 kb/d.
Separately, the Norway Petroleum Directorate (NPD) reported that July’s production increased by 112 kb/d to 1,850 kb/d and August dropped by 66 kb/d to 1,784 kb/d, red markers.
The Norway Petroleum Directorship stated that August’s production is 7.5% more than forecast and 3.3% more than the forecast so far this year.
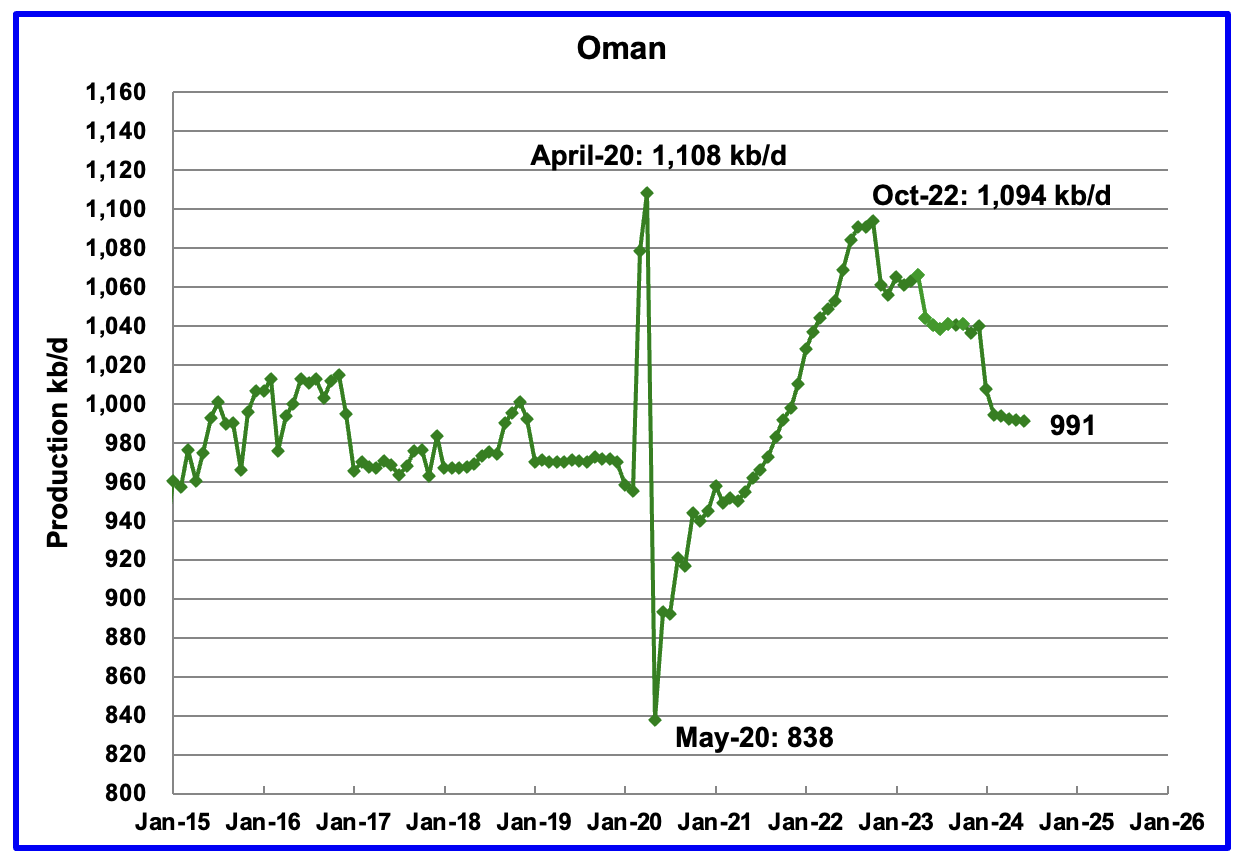
Oman’s production had risen very consistently since the low of May 2020. However production began to drop in November 2022. According to the EIA, June’s output dropped by 1 kb/d to 991 kb/d.
Oman produces a lot of condensate. The OPEC MOMR reports that crude production in June was 766 kb/d, 225 kb/d lower than the EIA’s C + C.
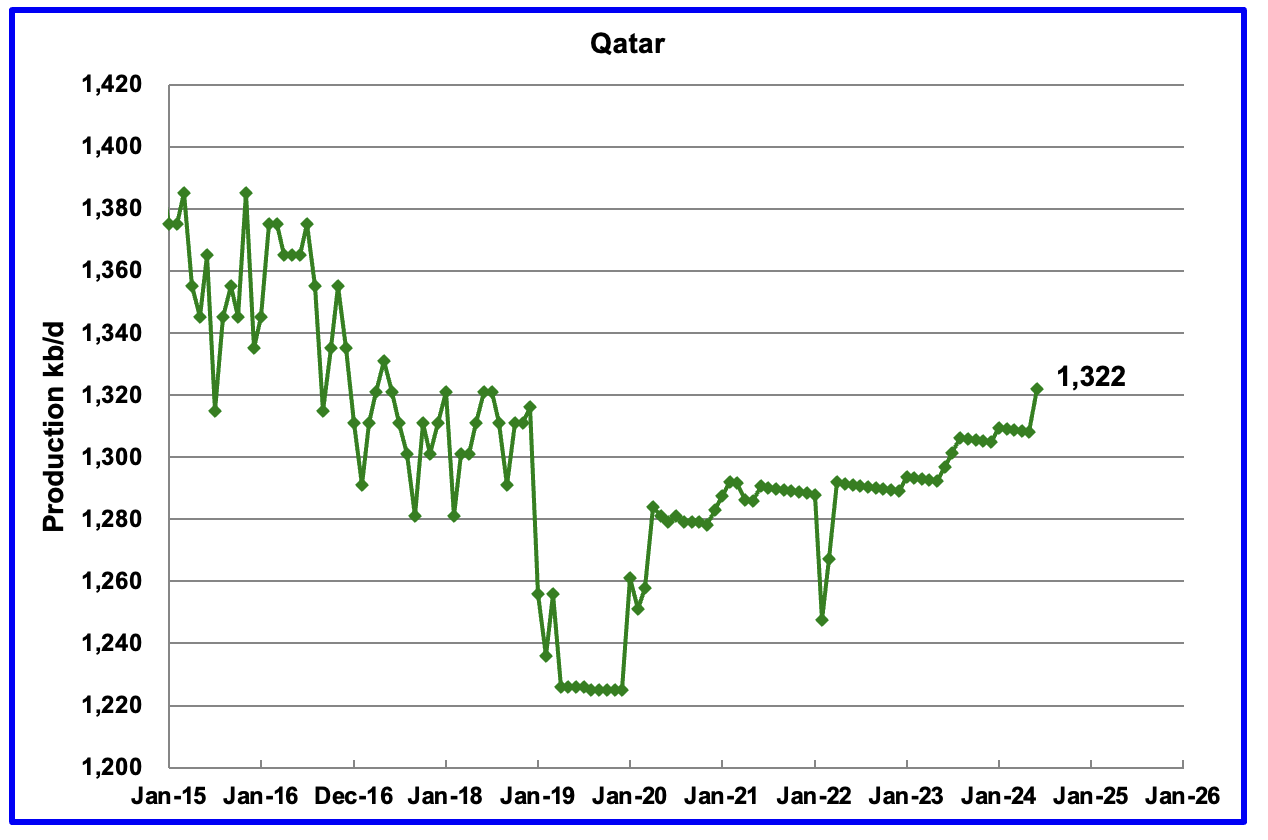
The EIA has been reporting flat output of 1,322 kb/d for Qatar since early 2022. However the current June update has revised down all of that production data. Qatar’s June output was reported again to be 1,322 kb/d.
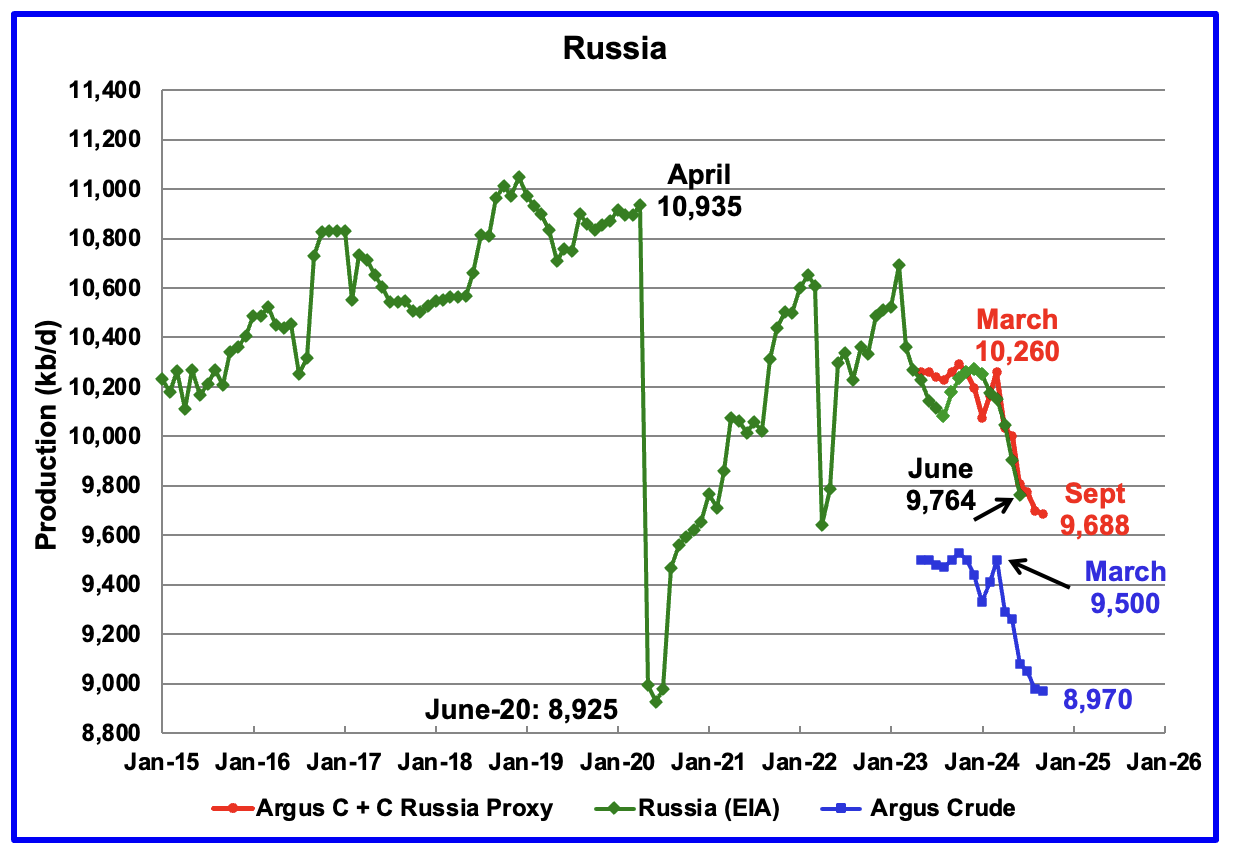
The EIA reported Russia’s June’s C + C production dropped by 142 kb/d to 9,764 kb/d.
Using data from Argus Media reports, Russian crude production is shown from May 2023 to September 2024. For September 2024, Argus reported Russian crude production was 8,970 kb/d, a decrease of 10 kb/d from August, blue markers. Adding 8% to Argus’ September crude production provides a C + C production estimate of 9,688 kb/d for Russia, which is a proxy for the Pre-War Russian Ministry estimate, red markers.
According to Argus, Russian crude production of 8,970 kb/d is in compliance with their OPEC target of 8,980 kb/d.
In pre-war times, the Russia Energy Ministry production estimate used to be 400 kb/d higher than the EIA estimate. For June, the Argus proxy estimate is just 46 kb/d higher.
Can we believe the Russian production numbers? What are their sources of information?
According to this Article Russian September production was “8.97 million barrels a day last month, the people said on condition of anonymity because the figures aren’t public. That’s down about 13,000 barrels a day down from the August level.”
The last two paragraphs, shown below, provide some insight on why it may be necessary to take the Russian information with a grain of salt. Since the data is classified, are these official sources providing information with the approval of higher ups that is designed to put Russian oil production in a more favourable light
“Russia has classified official output data amid Western sanctions over the Kremlin’s invasion of Ukraine, leaving oil market watchers with just a few gauges, such as seaborne oil exports and domestic refinery runs, to follow trends in the industry.
Earlier this year, Moscow also changed the way it reports data used to compile OPEC+ production estimates, making an independent assessment of its compliance with output cuts more difficult. The Energy Ministry now reports the data in barrels per day and appears to be using a ton-to-barrel ratio at the lower end of the traditional conversion factors used by analysts for Russia’s crudes.“
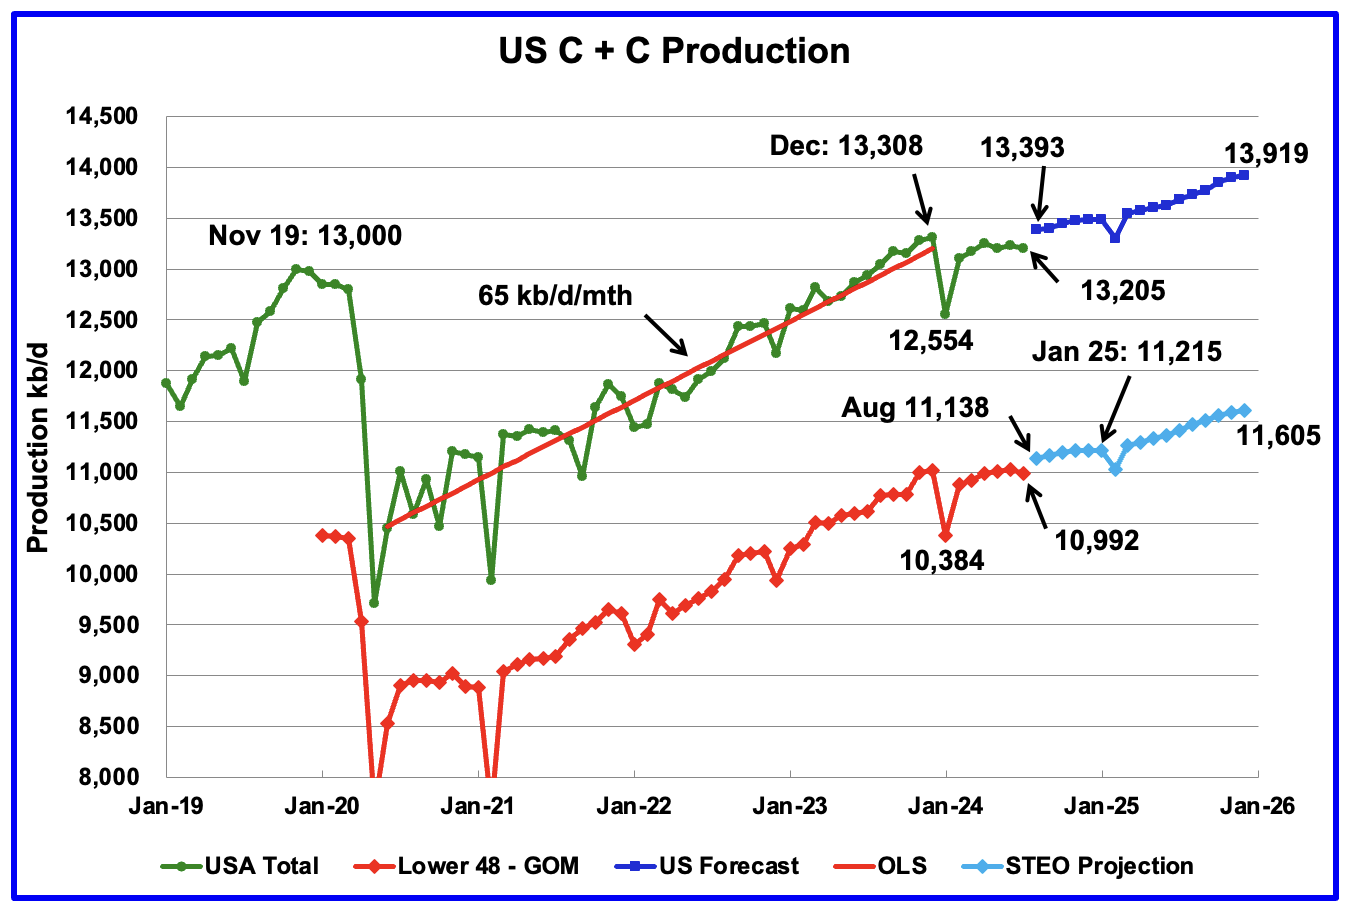
Comparison chart from the latest US post to compare with the latest EIA/STEO projection
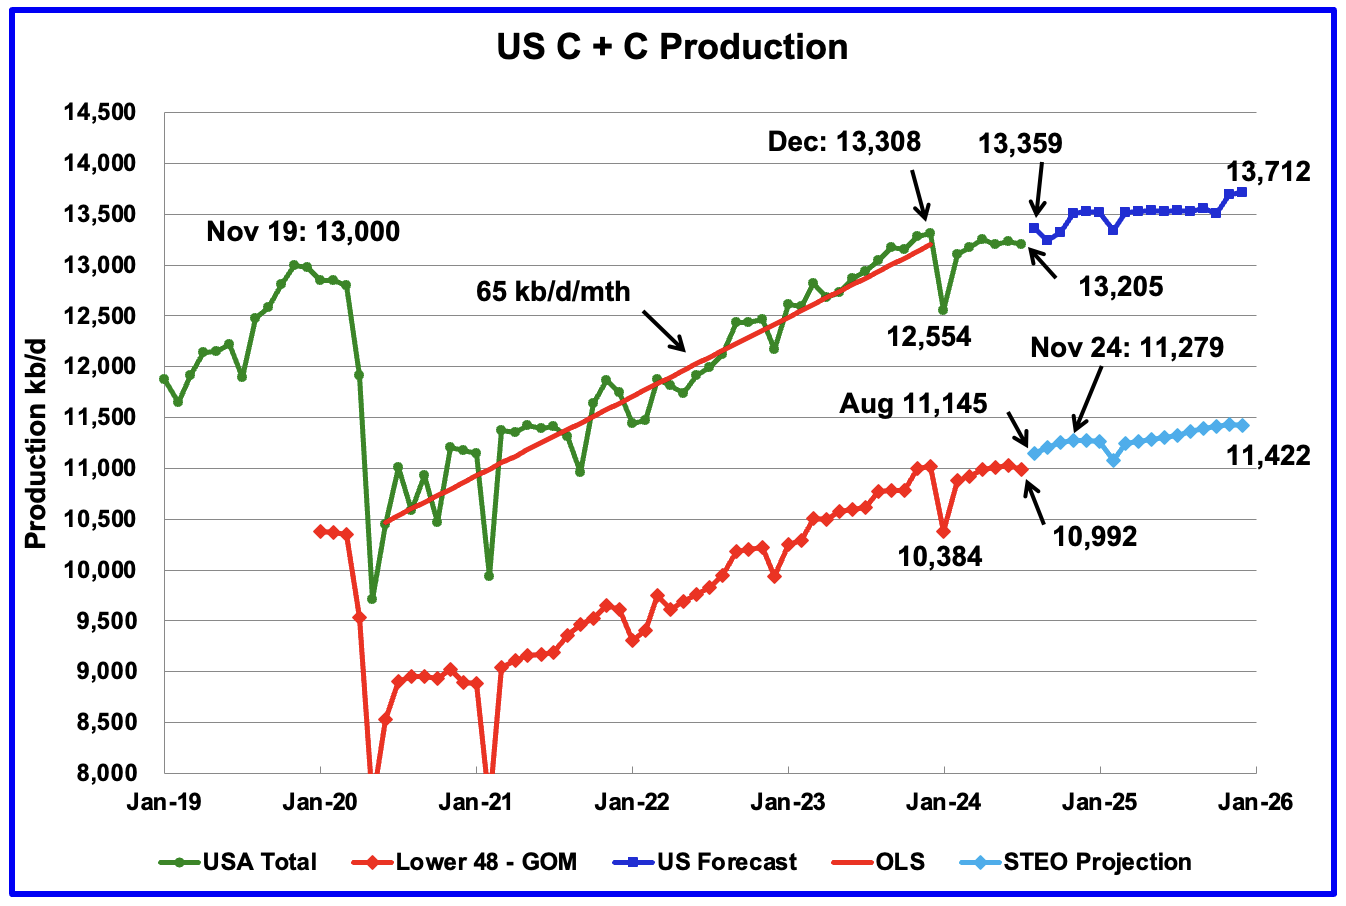
The October EIA/STEO has made a significant change from its previous forecast to US oil production going forward. Compare the two production charts above. The EIA is now predicting flat US oil production from November 2024 to October 2025. This is a significant reduction from earlier forecasts of around 300 kb/d.
From August 2024 to December 2024 oil production is estimated to increase by 277 kb/d. Production growth slows after November 2024.
44 responses to “June Non-OPEC & World Oil Production”
Thanks Ovi, great post. The EIA has world production increasing by over 3.5 million barrels per day by November 2025, 13 months from today. I just flat don’t believe that. Why do they make such absurd predictions?
It’s all propaganda Ron.
I think it’s more being “safe” than propaganda. They think you need X barrels per $ GDP, the GDP is project to be $Y and they predict X*Y barrels.
Any prediction that the geology could change or that that demand would change would be an additional assumption and thus “unsafe”.
In a changing world safe predictions look a bit silly.
Ron,
I agree, great post by Ovi, he is awesome.
They may think demand will increase that much from June 2024 to November 2025. I agree with you that seems very unlikely, my expectation is perhaps an 800 to 1000 kb/d increase over that 17 month period. What is also strange is the the EIA forecasts lower oil prices in 2025 compared to 2024, it is unclear why output would rapidly increase in a low oil price environment, doubtful that supply would increase strongly if oil prices are low. It also seems that demand for oil has not been very strong and there is little indication that this will change over the short term.
I noticed that last month’s estimate for World C plus C in Nov 2025 (peak output) was about 500 kb/d higher than this month’s forecast, the US forecast was about 200 kb/d lower this month compared to last month so the other 300 kb/d comes from the rest of the World. The EIA forecasts will continually be adjusted lower over future months to reflect the reality on the ground.
Thank you for this great post Ovid. Hello Ron, hello Dennis, long time not seen (though I’ve bee reading the posts and articles here on a regular base). Hope you are all well.
IMO, the most interesting and most honest change EIA did was to project the US production now on kind of a plateau. This is a game changer, because this plateau will eventually be extended to the whole world, no doubt about this. Finally the peak plateau is recognized even by EIA and its politically / economically motivated pies in the sky projections.
Now we will see if it is going to be a Dennis plateau (+1mb/d) or a Ron plateau (-1mb/d). Or somewhere in between …
Ron/Dennis/Westexasfanclub
Thanks
I think the world is now in a “Demand limited economy” which at max is now closer to a demand of 1Mb/d/yr. Over the next 18 month that could add demand of at max 1.5 Mb/d.
I agree with W regarding the US production projection. It blew my mind when I saw it and it reinforced my focus on the four most productive Permian counties in the US posts. Hopefully over the next few months the data from those counties and District 8 will provide the initial data that made the EIA make that projection.
Ron – This may be too simplistic, but it could be the same reason why it’s unpopular to yell “Fire, run!” In a packed movie theater. Instead of increasing by ~4 MB/d, we have a good idea that it will go the opposite direction.
On Second Thought?
BP Abandons Goal to Cut Oil Output, Resets Strategy
– BP had aimed to cut output by 25% by 2030
– BP eyeing investments in Iraq, Kuwait
– CEO Auchincloss to unveil new strategy in February
LONDON, Oct 7 (Reuters) – BP (BP.L), opens new tab has abandoned a target to cut oil and gas output by 2030 as CEO Murray Auchincloss scales back the firm’s energy transition strategy to regain investor confidence, three sources with knowledge of the matter said.
When unveiled in 2020, BP’s strategy was the sector’s most ambitious with a pledge to cut output by 40% while rapidly growing renewables by 2030. BP scaled back the target in February last year to a 25% reduction, which would leave it producing 2 million barrels per day at the end of the decade, as investors focused on near-term returns rather than the energy transition.
Rival Shell has also slowed down its energy transition strategy since CEO Wael Sawan took office in January, selling power and renewable businesses and scaling back projects including offshore wind, biofuels and hydrogen.
The shift at both companies has come in the wake of a renewed focus on European energy security following the price shock sparked by Russia’s invasion of Ukraine in early 2022.
This article has no data but it does point out that nat gas fueled vehicles can replace some of the diesel fuel vehicle action.
https://oilprice.com/Latest-Energy-News/World-News/Chinas-Diesel-Demand-Likely-to-Have-Peaked-as-LNG-Use-in-Trucking-Soars.html
In the US this already happens on a large scale in the waste hauling industry-
“According to available data, around 25-30% of garbage trucks in the US are currently powered by natural gas, with many new refuse trucks being ordered as CNG (compressed natural gas) vehicles, meaning a significant portion of the industry is transitioning towards natural gas usage….Over 50% of new refuse trucks sold are CNG-powered.”
You know, in 2017, a scientific paper explained that nitrogen depleted microalgae biomass is able to provide 500 L of methane /g of biomass introduced in methanizer during the whole process of methanization (160 days) on the contrary of non nitrogen depleted microalgae biomass. Recycling of methanization digestate for microalgae culture is something known. Conditions for high rate of microalgae biomass production are known. For example, 1 ha of open ponds can provide 90 t of biomass/year and space can be saved with vertical bioreactors. I have made a stupide calculation : with 200000 square kilometers of open ponds, enough biomass could be produced for methanization in order to produce 1000 billions cubic meters of methane or the production of natural gas in USA. In USA and for example in Texas, there is enough wasteland for that. For the record, the extent of Permian oil field is 200000 square kilometers and it doesn’t cover completely Texas.
https://www.energynetworks.com.au/news/energy-insider/natural-gas-as-a-transport-fuel-the-economic-and-environmental-arguments/
“Gas is also used in public transport, especially in CNG bus fleets, where Australia has been described as a world leader,”
Natural Gas powered vehicles can work, if there are predictable routes. My assumption being there aren’t many places to refuel.
EIA: Permian Crude Output Set for Slower Growth in 2025 By Alex Kimani – Oct 14
EIA: Permian output will rise to 6.6 million bpd in 2025.
The expected increase in production is partly due to drilling productivity improvements.
Goldman Sachs: U.S. crude output will increase by 500,000 bpd in the current year, a slower growth clip compared to last year’s increase of more than 1 million bpd.
The oil price rally has reversed again thanks to unrelenting short-selling by money managers. Brent crude futures for December delivery were trading at $77.24/barrel at 11.40 am ET on Thursday, while WTI crude was changing hands at $73.72/barrel.
That marks a sharp fall from last Monday’s 2-month high of $81.12 for Brent and $77.91 for WTI crude. The rally was triggered by Washington’s indication that Israel could strike Iran’s oil facilities.
Short sellers increased their bearish bets against S&P 500 oil and gas stocks in September, with short bets rising to 446.57M in September from 434.71M in August. Short positions on Brent crude have now overtaken long positions for the first time in history. EQT Corporation (NYSE:EQT), APA Corporation (NASDAQ:APA), Valero Energy (NYSE:VLO), Occidental Petroleum (NYSE:OXY), and Devon Energy (NYSE:DVN) are among the most shorted oil and gas stocks.
A lot of the bearish sentiment is being driven by oversupply concerns.
There is a lot more to this article. Click on blue headline to read it.
Amrita Sen on CNBC discussing World OilMarket
– World Oil inventory very low
– Big and Mid size drillers running out of acreage
– Big surprise. Non-OPEC only growing at 300 kb/d. In the chart in the post above, Non-OPEC production is flat from December 2023 to December 2024.
https://www.cnbc.com/video/2024/10/14/the-energy-market-is-very-jaded-from-trading-geopolitics-says-energy-aspects-amrita-sen.html
Permian Producers Face new Headwinds
This article complements the CNBC video above by adding some cost details.
Firms are also using up the better drilling locations. Shale is not a uniform resource. Despite impressive advances in productivity over the past decade, rock quality remains the most important driver of well performance. Operators target high-quality (tier 1) wells first if they can, leaving lower-quality tier 2–4 wells for later, hoping that improvements in drilling and completion technology and efficiency will offset poorer yields.
Less than two-fifths of the 25,000 drilling sites estimated to remain in the Midland basin offer a breakeven below $60/bl over a two-year period, according to a new assessment by Novi Labs using detailed rock quality data and incorporating the impact of infill well spacing patterns (see graph). Results reflect huge geologic variation within the basin and yield a weighted-average breakeven of $74/bl for the potential inventory of undrilled Midland wells. “Average tier 1 rock breaks even on average at $60/bl, but that number for tier 4 rises to $96/bl,” Novi’s Ted Cross says.
For comparison, breakeven WTI prices for drilling a new oil well in the Midland basin ranged from $40-85/bl and averaged $62/bl, according to 87 E&P firms surveyed by the Dallas Fed in March (see graph). Over the past five years, average breakeven prices for new Midland oil wells from the Dallas Fed Energy Survey increased by a just over a third from $46/bl. In 2020, Midland breakeven prices ranged from $30-60/bl.
https://www.argusmedia.com/pages/NewsBody.aspx?frame=yes&id=2617831&menu=yes
These Novi breakeven’s are a lie. Novi is no longer a trustable source for America’s long term energy future. No data-sell outlets are. These breakeven estimates do not include corporate overhead costs per BO, the cost of servicing long term debt per BO (still $200B), or actually paying that debt back (GASP!). Nor do breakeven costs include the cost of P,A & D for 180,000 tight oil wells in the U.S. At negative WaHa gas, with 50% of the production stream gas related, tight oil wells do not pay out in 2 years. Thats a lie. In the oil business you are NOT profitable until you are out of debt and all of your retirment costs are set aside, in money market accounts.
Breakeven is a stupid metric and I cannot believe people with a square centimeter of cranial capacity still rely on breakeven prices to predict the future of oil in the U.S.
The goal is to not breakeven, but in the case of U.S tight oil, to make 3 times the profit margin it does now (at $70) to get out of debt. It can’t do that.
So, for all the anti-oil bullshit on this forum, the dik-dik about renewables, the “we need to get off of fossil fuels as soon as possible, Nick G dung heap,” EV’s, wind and solar this, EV’s that…are you ready for what’s coming down the pike?
No. Not even close. You are, in your puesdo position of moral and intellectual high ground over others, about to feel great financial pain.
Hey, good luck with that!
Wrung dry and spat out!
Well said Mike!
Mike,
Well said. I too am highly skeptical about data sell companies and consultants most of whom have never gotten their hands dirty. All too often the reservoir is depicted as a homogenous sugar cube, instead of reality which is a variable sedimentary structure which can have varying mineralogy, porosity and permeability in addition to undulating layering. The wreckless way that these resources have been exploited only demonstrates man’s short term thinking. A case of greed and egos. What a legacy these clowns are creating.
Now that Enno Peters has left Novilabs, we will no longer get any updates on tight oil output that Mr Peters provided free of charge on the Novilabs blog. From this point forward the average new well productivity of tight oil wells will be difficult to gauge.
You required somewhere to get a plan so as to make a proper energetic transition because permian is not going to be eternal. I have made some proposals about gas production higher in the comments as an answer to hickory by using microalgae biomass production as a base to methanization. What do you think of it?
So, for all the anti-oil bullshit on this forum, the dik-dik about renewables
It isn’t just this forum. IEA calculates that more than twice as much is being invested in renewables as in fossil fuel.
https://www.iea.org/reports/world-energy-investment-2024/overview-and-key-findings
Admittedly, it’s a new development. But as Solzhenitsyn put it, “Blow the dust of the clock. Throw open your cherished heavy curtains. You do not even suspect that the day has already dawned outside”.
Good or bad, renewables are what the world is investing in, not coal gas and oil. Insulting a few people on line won’t change that.
starships, each laugh consumes 1.2K tons of LNG 1K and 100 launch each year, that’s more LNG the world is producing!
Starships replace ICEs as the new type of fuel consumer, similar to 120 years ago, when ICE replace horse wagons, and new type of fuel consumer, ICEreplace old kerosen lighting.
Sheng Wu
Nobody is going to pay for 100 starship launches a year. We aren’t living in a Heinlein novel.
The problem with space is that anything out there is insanely far away and energy costs are just as insane. 2001 A Space Odyssey found an amazing alien artifact on the moon. NASA found nothing.
NASA just launched a spaceship with the longshot hope of finding organic molecules on a moon of Jupiter, roughly 2000 times as far away. Finding an amazing alien artifact is probably trillions of times less likely than finding an organic molecule.
The energy cost of large scale space exploration with chemical rockets is orders of magnitude beyond what the fossil fuel industry can deliver.
I accept these criticisms and insults even though they are all from anonymous sources, naturally.
If you advocate for one form of energy while being totally against another, you are being short sighted, likely from a position of privilege and in the case of a clean transistion to renewables, the valve off one day, the switch on the next day, unrealistic. I am a Texas oil and gas producer who actually advocates strongly for a rational, affordable transition to transportation fuels, one that the entire world can benefit from. I’m just not stupid about it. We are decades away from that. Promoting the false narrative of hydrocarbon abundance is just as dangerous and wishing the end of fossil fuels completely. More so, actually. We need now, and will, need all forms of energy that ALL of society can afford.
As to being insulting, I was. You sir, don’t even live in my country and you rant and rail on our social framework here, our demographics, the way be built our country, how we produce oil and grow food, our entire history…as though we all live outside London in an 800 square foot flat and can ride the bus to get a meat pie every day. I’ve always considered that very insulting, particularly, again, coming from an anonymous source.
Y’all send me a bill for all the psychoanalysis.
Come on man, it wouldn’t hurt to calm down a bit.
The truth is always somewhere in between. What has happened in the world should already prove that.
You’re giving off serious “angry middle aged guy” vibes and it’s just old, tired, and boring, honestly.
The world moves on. Always has, always will. It’s not up to you, it’s up to future generations to decide what they want to do with their lives.
Mike lost it many years ago. I think he is going for the Guinness world record for being wrong on everything things he states for 10 years straight. He wears being ignorant like a 10 year old wears an old war medal. he is the Joe biden of the POB…he passed angry middle age 20 years ago.
OVI keeping it real as always 👍
Another drive-by to see what the collective minds of POB are thinking. Since I don’t follow or read the blog anymore I don’t want to be unfair to any one person. But if you are keeping up with the news, yes indeed we (the collective we) are going nuclear. Nat gas will be the bridge fuel, there is is no end in site for crude oil demand.
Again not to make it personal, but when Elon Musk come out for Trump I wonder if certain folks here have taken the time to re-evaluate their stated positions. For the foreseeable future, hydrocarbons in all their forms will continue to supply the overwhelming energy for an ever increasing demand. Any body with two or more working brain cells knows this.
So to wrap up, nat gas, oil and coal will be needed, used and I think celebrated before any of us move on to greener pasture. Nuclear will be built out on an ever increasing rapid basis. I don’t know what we will do with the useless windmills but I bet if Elon puts his mind to it maybe he can recycle them into parts to make his rockets. Thats what successful people do, they see possibilities not doom and gloom around never corner. But I bet there are not more than a handful of people here that can understand that.
Coffee if you and shallow are still here godbless keep them honest. I am out of here….
Well said, Mr. Shellman.
The Permian reservoir pressure is mostly shot because of density–and that’s important. This whole tight oil gambit depends on tiny fractures the width of a hair allowing egress of hydrocarbons, which is driven by gas-in-solution under pressure. When the pressure falls, and movement through the fissures slows down (especially towards the toe of a 3-mile lateral), larger hydrocarbon molecules hang up, closing down a pathway to the wellbore. When this happens to millions of fissures, that’s all she wrote. This is now happening earlier and worse. From here on it’s going to take quite a bit more than $70 oil to keep the treadmill running.
Nobody who profits from tight oil will admit that we have run through this last precious gift by greedily over-producing, venting and flaring like there’s no anthropogenic effect but still glutting the NG market and also keeping the price of oil at an artificially low level while leaving 90% in the ground. As the old Saudi king said: “My father rode on a camel. I ride in a Mercedes. My son flies on a jet. His son will ride on a camel.”
One of the main reasons oil demand is not increasing very much and prices are low is due to the fact that the global ICE vehicle fleet has passed peak.
https://ourworldindata.org/grapher/car-sales
The number of new ICE vehicles being sold globally has fallen by over 20 million from the peak in 2018. Another factor is fuel efficiency for both trucks and cars is improving also. Each year tens of millions of old less efficient cars and trucks are scrapped. Being replaced by electric and more efficient models, therefore globally fuel demand will start to fall.
My take on that is that reducing personal vehicle use is the so called alternative not EVs. EVs are the next step in profligate energy consumption not an alternative to it.
Leeg. As oil depletes you are going to need both.
Global ICE sales fallen by over 20 million per year since 2018.
https://ourworldindata.org/grapher/car-sales
As the older ICE vehicles are scrapped and more electric vehicles are sold fuel demand will fall. We are probably only a couple of years away from peak fuel demand.
Perhaps, but I suspect it will take longer than a few years since the current fleet of ICE vehicles will be running for a long time. On the other hand I still expect that roughly 90% of new light vehicle global sales will have a plug by 2030. That assumes a big ramp up between now and then. Battery prices are dropping…especially for places that don’t have big tariffs on them.
Can’t come soon enough for the country if the Permian is indeed on a quick decline path, and even if it isn’t.
One of the last things any country wants is to be an oil importer.
That graph counts hybrids as electric. Not really true.
Greenbub,
Plugin hybrids and BEVs are counted as electric, hybrids that cannot be plugged in are not included. A Prius Prime has a range of about 45 miles on battery alone, so a lot of around town driving can be electric, on longer trips the car runs on fuel, with similar efficiency to a Prius. See
https://www.iea.org/data-and-statistics/data-tools/global-ev-data-explorer
in 2023 there were 9.5 million BEVs sold and 4.3 million plugin hybrids for a total plugin vehicle sales of 13.8 million. The non-plugin hybrids are included in the non-electric category and are part of the 62.9 million “non-electric” vehicles sold in 2023.
The total plugin fleet at the end of 2023 was about 40 million, about 3.2% of total light duty vehicle fleet, up from a share of 0.4% in 2018 (4.2 million plugin fleet at the end of 2018, nearly 10 times smaller than the end of 2023.)
It’s also worth mentioning that the two and three wheel vehicle fleets are electrifying faster than cars. In South and Southeast Asia, that’s a big deal. And that is the region where demand growth for oil is expected.
ND Director’ Cut is out. Small (+10,000 bbpd) increase in production. Maybe even smaller than needed to keep ND flat, through the seasons, given we are heading into winter, but not “making hay” enough in the summer. But I guess we will need to wait and see the 12 month changes.
https://www.dmr.nd.gov/dmr/oilgas/directorscut
Didn’t notice much notable in the discussion.
This video about shale is a very good watch.
https://youtu.be/E0WImM0l3rA?feature=shared
The Rig Report for the Week Ending October 18
– US Hz oil rigs dropped by 3 to 431 and are down 28 rigs from April 19. They are up 4 from 13 weeks ago.
– The Texas rig count dropped by 5 to 239.
– Texas Permian rigs dropped by 5 to 195 while the New Mexico Permian rigs were unchanged at 91.
– In New Mexico, Lea and Eddy were unchanged 48 and 43 rigs respectively.
– In Texas, Midland was unchanged at 24 while Martin dropped 1 to 29 .
– Eagle Ford was unchanged at 40.
– NG Hz rigs dropped 1 to 83.
Frac Spread Report for the Week Ending October 18
The frac spread count dropped by 3 to 238. It is also down 31 from one year ago and down by 34 spreads since March 8.
Challenge…your long held assumptions and preconceptions, and your stance. Its a mental practice that shows strength and builds a healthy adaption to reality.
Many people here have looked at non-fossil energy generation and sources as some sort of negative force in our economy. We could hash out all of the various rationales for that stance, but my point of this brief note is not to harp on about those ideas or beliefs.
Rather I want simply point out that I and most others recognize domestic gas and oil products as finite and critical resources. These energy sources should therefore be treated as such, with production and consumption being somehow optimized to prolong the supplies for many generations. That means (or would have meant) putting brakes on production rate and consumption types. We could talk long and hard about braking mechanisms and rationale, but not right here because-
I want to make a point for all to consider.
Non-fossil sources energy production should all be looked at as a basket of mechanisms to enable extending the production span of domestic oil and gas as far into the future as reasonably possible. This is the conservative stance we should all embrace on energy.
And if this embrace of non-fossil energy sources allows us a measure national economic resiliency, diversification, and innovation so much the better. You may have seen the data showing that capital spent on the construction of domestic manufacturing sector has almost tripled over the past 4 years, with much of the spending being in wide ranging energy related fields.
It would a good thing if the history of partisan divide on energy was in the rear view mirror. We all have shared interest in avoiding a state of energy poverty.
Hickory: “It would a good thing if the history of partisan divide on energy was in the rear view mirror. We all have shared interest in avoiding a state of energy poverty.”
I’m not sure your commentary is valid. The greatest surge in domestic oil and gas production in the history of our country just occurred on the watch of the most progressive administration in the history of our Union. We have a Native-American Secretary of the Interior who vowed to protect the environment. We have a Secretary of Energy who vowed on the first day in office to bury fossil fuels.
On the other hand, when Mr. Trump was president, at a time when the pipelines and distribution hubs were full, the Saudis decided to send 22 supertankers loaded with oil to “sell off the boat” in the Houston Loop–and despite Ted Cruz, Harold Hamm, Gregg Abbott and others cajoling Trump to demand that they turn around and take their oil back home for the time being, he refused. Consequently, for the first time in American history producers had to PAY to get someone to take oil off their hands (@$38/bll). Mr. Trump hollers drill baby drill, obviously ignorant of the fact that the Permian drillers have drilled themselves into a NG glut.
Since the time when somebody found a lump of coal and tossed it on a paltry wooden stick fire around which a group of miserable wretches sat, man has been intensely dependent upon the use of fossil fuels. I don’t know whether those people were Democrats or Republicans, but I’ll bet they all enjoyed the fire,
There is a partisan divide, all right, but it’s not what’s driving the oil frenzy. That’s an effort to get the damn stuff out of the ground and sold before it’s declared illegal by the World Health Organization, or the IEA, or some other committee whose members would flat freeze or starve to death if not for fossil fuels.
Trump owns hotels and golf courses.
People who own hotels and golf courses want cheap gasoline prices.
Trump thinks a “fair” oil price is $40 WTI and a “fair” gasoline price is $2.
Trump also loves tariffs. Tariffs screw over farmers more than about any other small business. Farmers are very dependent upon exports.
Yet 95% of people in the oil industry and 85% of farmers will vote for Trump.
Now, I don’t really think the US President affects oil prices much, or has much to do with drilling activity. But, in my view as a stripper well investor, I personally don’t think Trump is that great of a friend to the industry.
I’m not a fan of the Dems on this either, primarily because they lie and call small oil percentage depletion a “Big Oil Tax Break” and because of the way they have handled the methane issue with regard to stripper oil wells. They also said stupid stuff about banning fracking in 2019-20, because the tiny percentage of people who vote in Democratic primaries wanted to hear that.
I really don’t see rural commodity producers having a friend in either party at the top of the ticket.
Grain prices are in the dumper, as are natural gas prices. Oil prices appear to be on their way to the dumper too.
Well said, Shallow.
Gerry,
I was speaking to the long term stance of one party generally seeing non-fossil energy sources as a threat, rather than as an asset in the goal to having fossil fuel supplies last for a long time into the future.
I simply think its good for the overall economy of the nation to have a diverse and stable energy supply system…that is managed for a long run. I look forward to a time where there enthusiasm (regardless of party) for building a resilient system that is not based so dominantly on a depleting resource. Its a fragile position we are in.
We are off to really slow start on the challenge, and need an all hands on deck effort.
New posts are up
https://peakoilbarrel.com/short-term-energy-outlook-october-2024/
and
https://peakoilbarrel.com/open-thread-non-petroleum-october-21-2024/