By Ovi
The focus of this post is overall World oil production along with a more detailed review of the top 11 Non-OPEC oil producing countries. OPEC production is covered in a separate post.
Below are a number of Crude plus Condensate (C + C) production charts, usually shortened to “oil”, for oil producing countries. The charts are created from data provided by the EIA’s International Energy Statistics and are updated to January 2024. This is the latest and most detailed/complete World Oil production information available. Information from other sources such as OPEC, the STEO and country specific sites such as Brazil, Norway and China is used to provide a short term outlook.
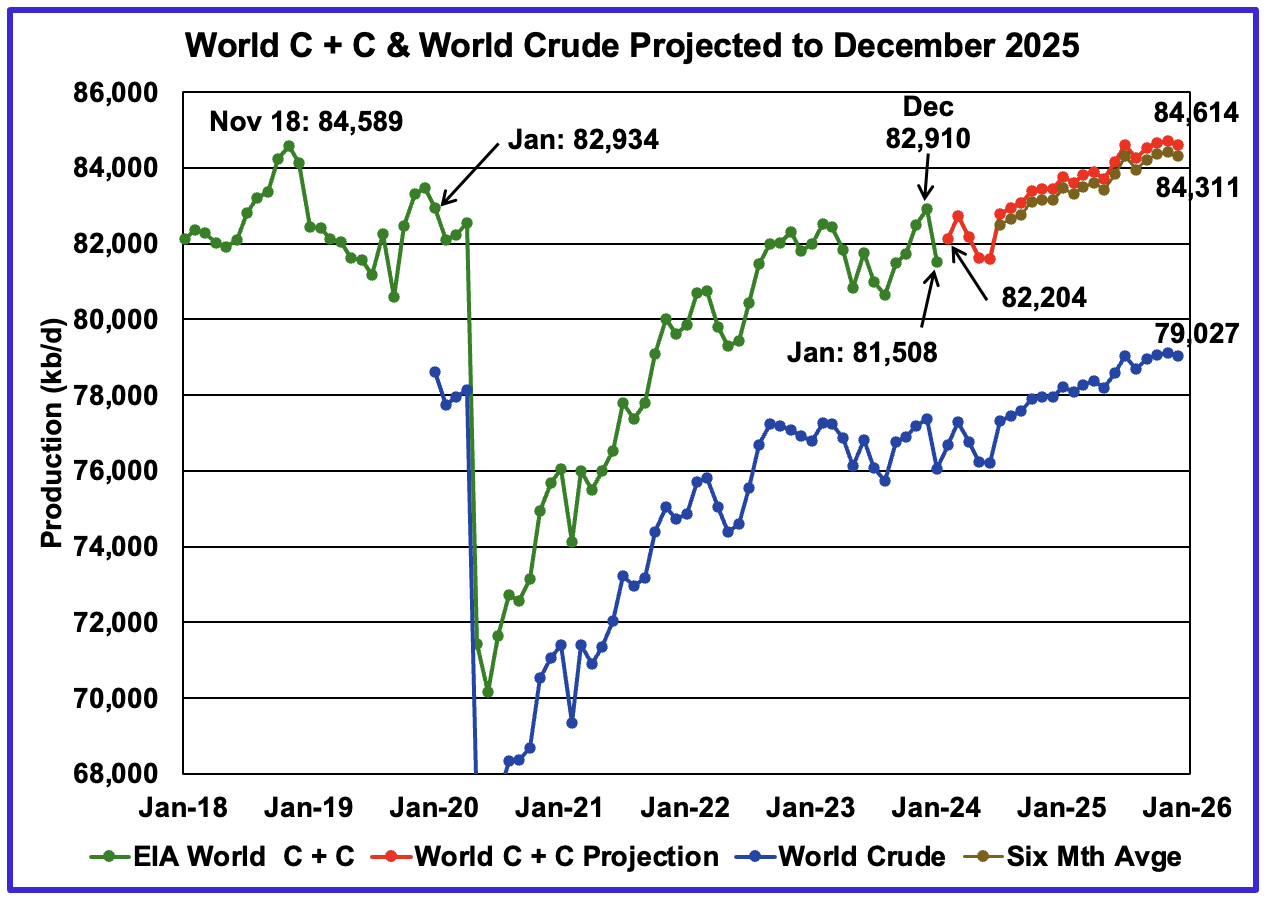
World oil production decreased by 1,402 kb/d in January, green graph. The largest decrease came from the U.S., 762 kb/d. February’s World oil production is projected to rebound by 696 kb/d to 82,204 kb/d.
From December 2023 to December 2025, production is estimated to increase by 1,704 kb/d.
This chart also projects World C + C production out to December 2025. It uses the May 2024 STEO report along with the International Energy Statistics to make the projection.
The red and brown graphs forecast a range for World oil (C + C) production out to December 2025. For December 2025, the production upper limit is 84,614 kb/d while the lower limit is 84,311 kb/d. The December 2025 upper limit forecast is 651 kb/d higher than reported in the previous World update and is also higher than the November 2018 peak.
A note of caution. The May STEO has now switched to reporting/forecasting only Crude, which is also shown in the chart. As a result the red and brown C+C graphs are projections based on the Crude graph. There is a significant change in the ratio (C + C)/C over the last three months of reported crude production relative to the previous three months. This difference makes a significant change to the projection. The red graph uses the average for last three months of data to make the forecast while the brown graph uses the last six months.
The issue is why are the last three month ratios higher than the previous year. Is the increase due to a real increase in condensate over the last three months or is the STEO collecting better information now that they are transitioning to reporting only Crude.
A few more months of data will be required to determine the best way to project C + C production from crude production.
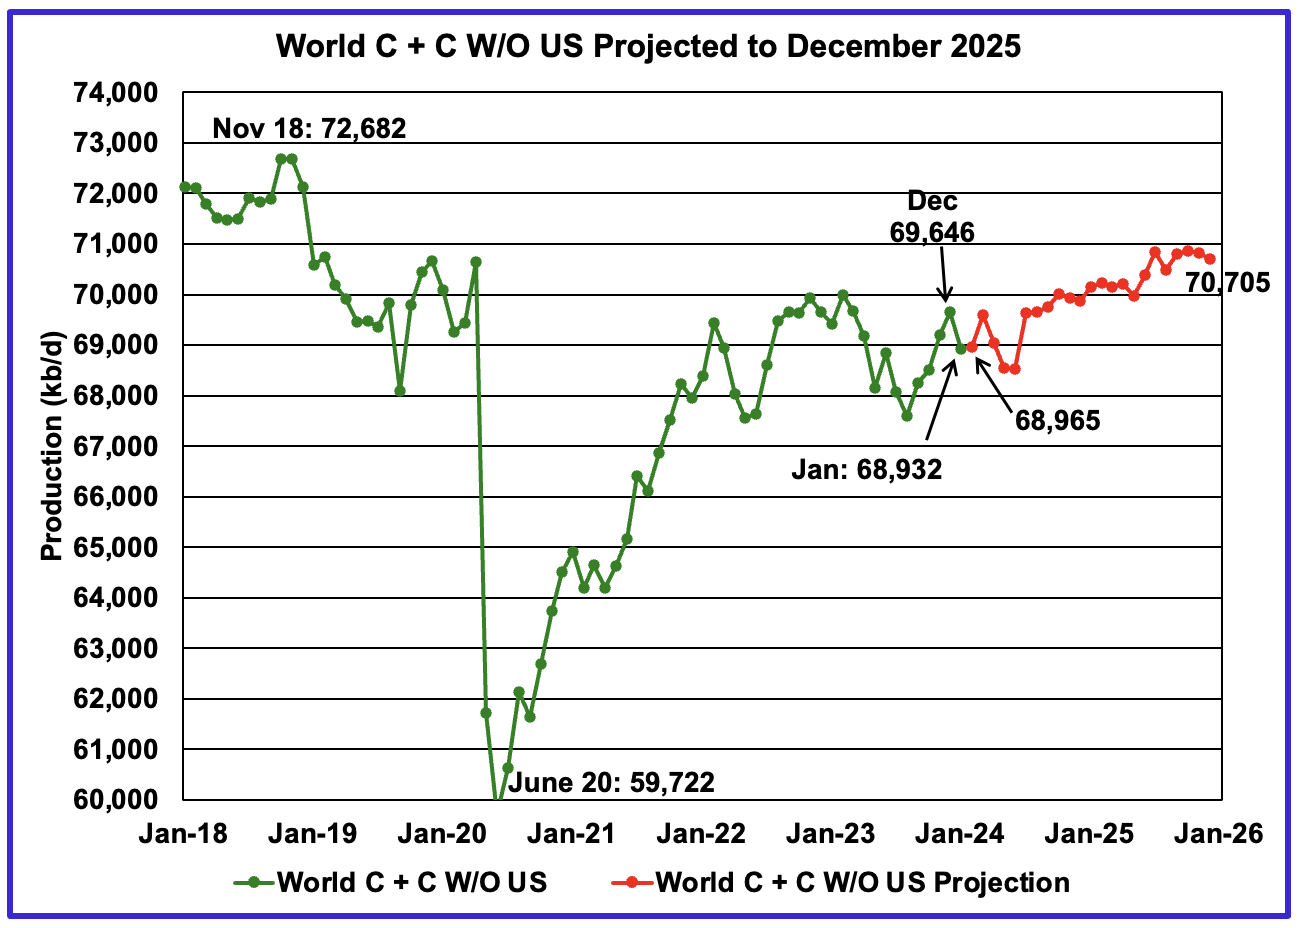
World without US January oil output decreased by 714 kb/d to 68,932 kb/d. February production is expected to increase by 33 kb/d to 68,965 kb/d.
Note that December 2025 output of 70,705 kb/d is 1,977 kb/d lower than the November 2018 peak of 72,682 kb/d.
World oil production W/O the U.S. from December 2023 to December 2025 is forecast to increase by a total of 1,059 kb/d.
A Different Perspective on World Oil Production
Instead of dividing the World oil producing countries into OPEC countries and Non-OPEC countries, this section divides the countries into two groups on the basis of their production capacity. The division will be The Big Three, US, Saudi Arabia and Russia, and The Rest, i.e. the World oil producers W/O the Big 3. The top producer in the Rest, currently Canada, produces close to half of the lowest producer in the Big Three.
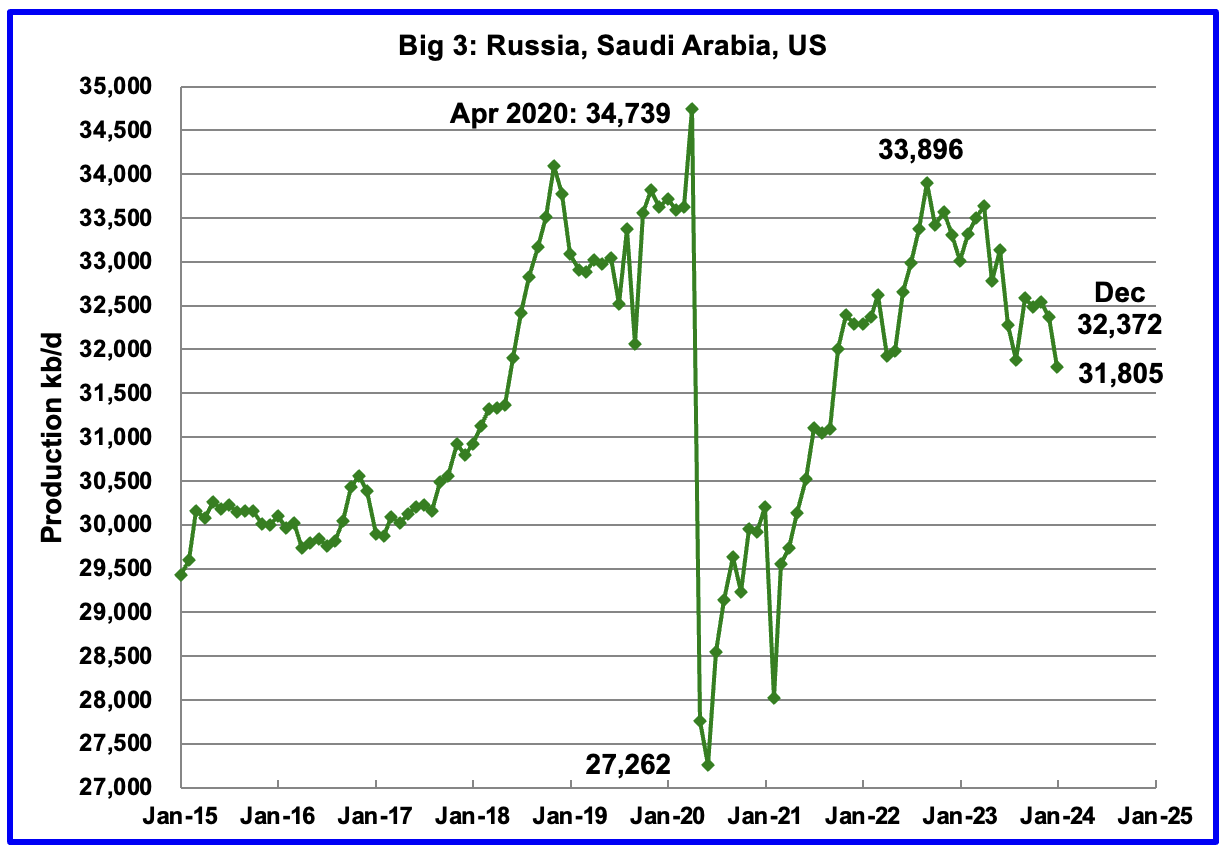
Peak production in the Big 3 occurred in April 2020 at a rate of 34,739 kb/d. The peak was associated with a large production increase from Saudi Arabia. Post covid, production peaked at 33,896 kb/d in September 2022. The production drop since then is primarily due to cutbacks in Russia and Saudi Arabia.
January’s Big 3 production decreased by 567 kb/d to 31,805 kb/d. The US drop was 762 kb/d.
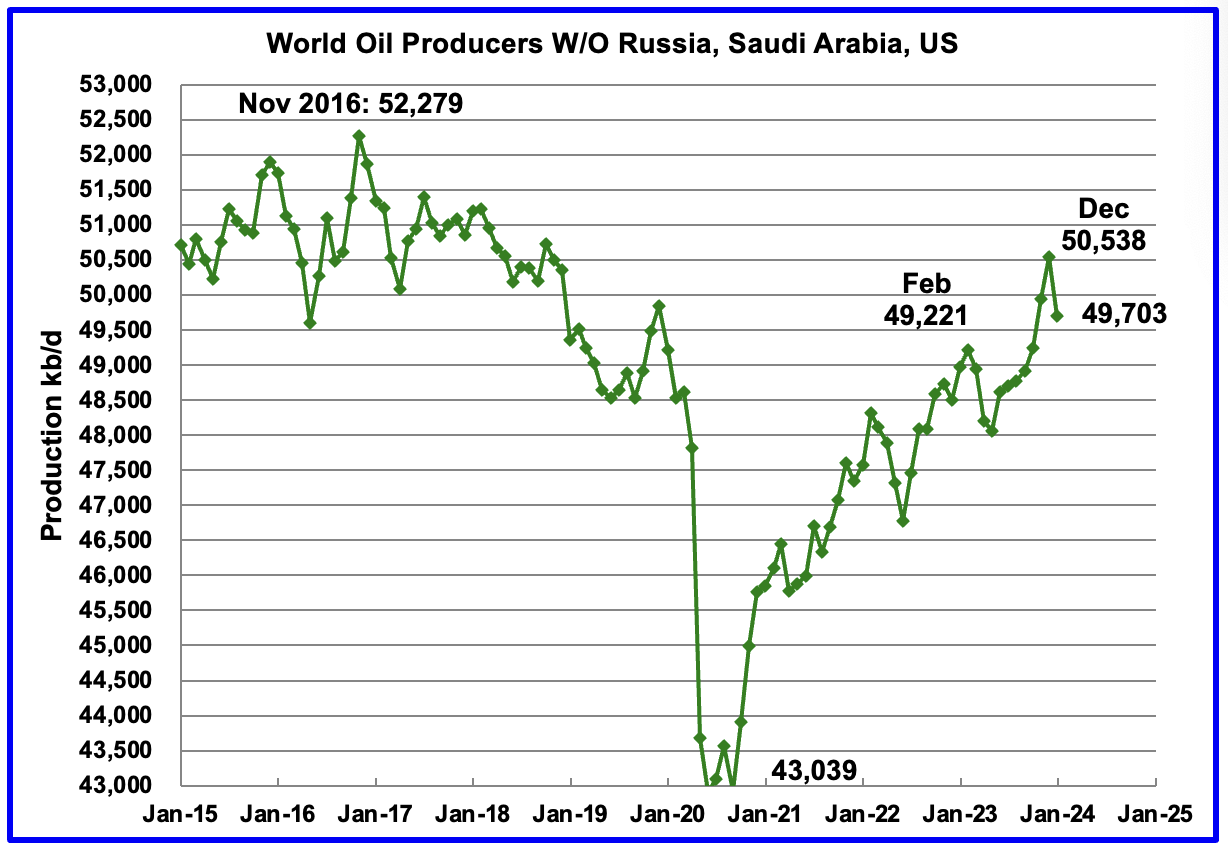
Production in the Rest has been slowly increasing since the low of September 2020 at 43,039 kb/d. Output in December 2023 reached 50,530 kb/d, an increase of 579 kb/d over November and was a new High. January reversed the trend and production dropped by 835 kb/d to 49,703 kb/d. February production is expected to recover from the January drop.

Above are listed the World’s 12th largest oil producing countries. In January 2024, these 12 countries produced 76.4% of the World’s oil. On a MoM basis, these 12 countries decreased production by 1,079 kb/d while on a YOY basis, production dropped by 689 kb/d. Note the large MoM Saudi Arabia increase of 220 kb/d.
Note the large YoY increase in Iranian oil production vs the large Saudi Arabian drop.
January Non-OPEC Oil Production
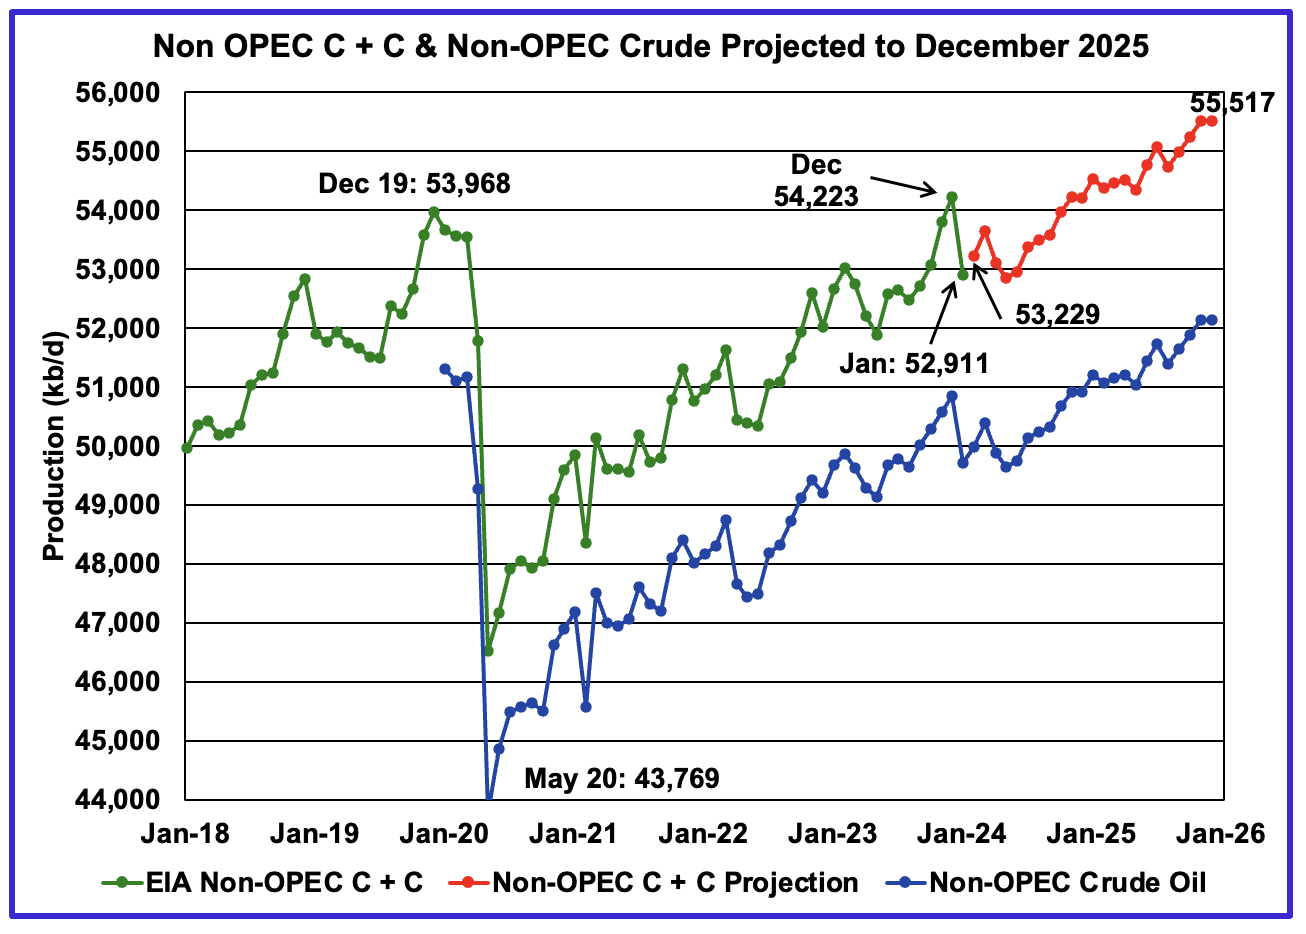
January Non-OPEC oil production dropped by 1,312 kb/d to 52,911 kb/d. The largest decreases came from Canada and the US. Note that Non-OPEC production now includes Angola.
Using data from the May 2023 STEO, a projection for Non-OPEC oil output was made for the period February 2023 to December 2025. (Red graph). Output is expected to reach 55,517 kb/d in December 2025, which is 1,549 kb/d higher than the December 2019 peak of 53,968 kb/d.
The same caution as noted for the World chart comments above apply to this chart.
From December 2023 to December 2025, oil production in Non-OPEC countries is expected to increase by 1,294 kb/d. According to the STEO, the major contributors to the increase are expected to be the US and Guyana.
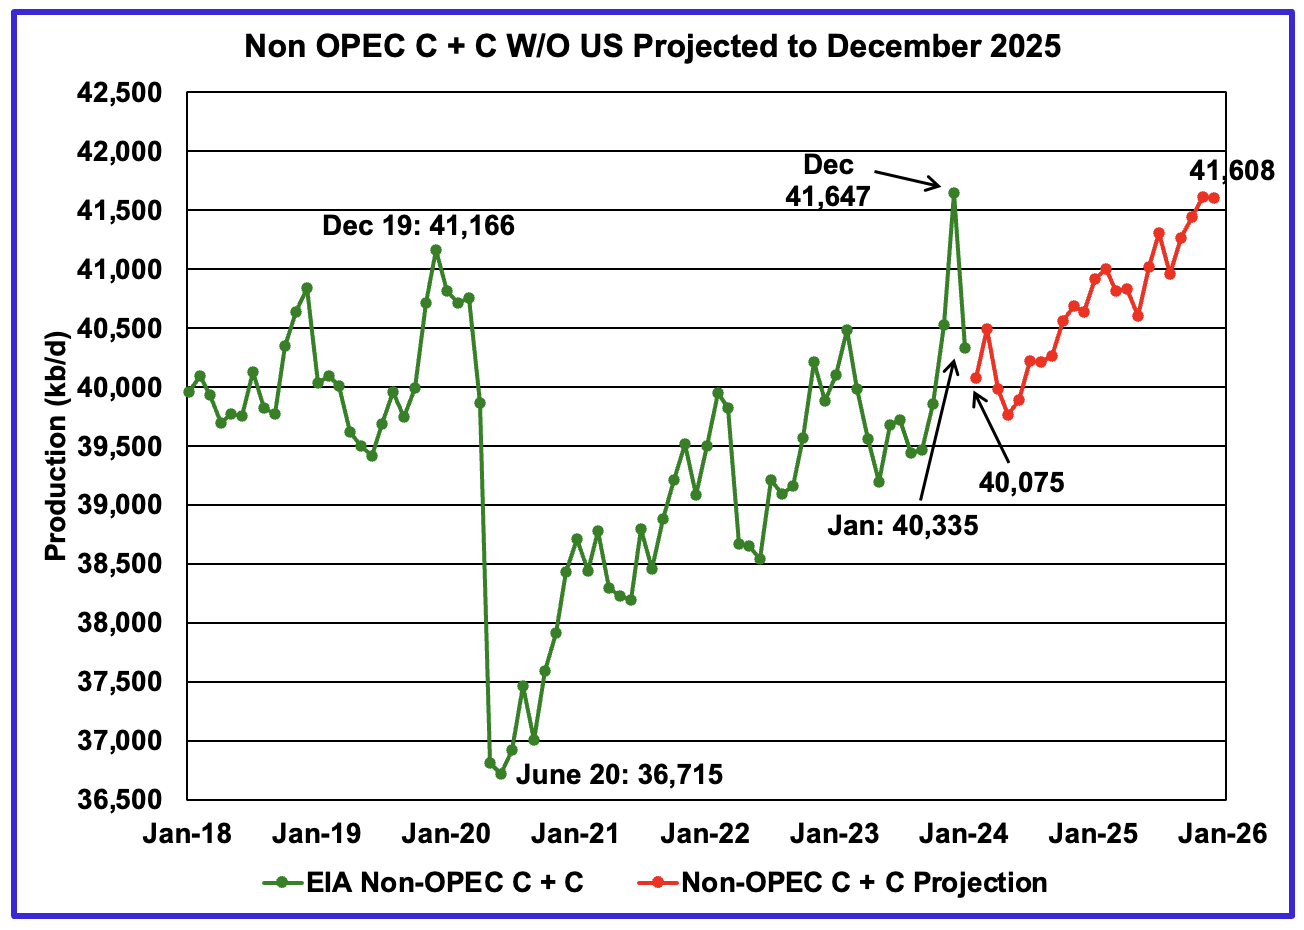
January Non-OPEC W/O US production decreased by 1,312 kb/d to 40,335 kb/d. February production is projected to drop by an additional 260 kb/d from January.
From December 2023 to December 2025, production in Non-OPEC countries W/O the US is expected to drop by 39 kb/d, essentially unchanged.
Over a longer time frame, Non-OPEC W/O US production has bumped up against a 41,000 kb/d barrier. In January 2016, production peaked at 41,170 kb/d. December 2025 estimated production is 438 kb/d higher than January 2016.
Non-OPEC Oil Countries Ranked by Production

Listed above are the World’s 11 largest Non-OPEC producers. The criteria for inclusion in the table is that all of the countries produce more than 1,000 kb/d. Note that Angola has been added to this table.
January’s production decrease for these eleven Non-OPEC countries was 1,363 kb/d while as a whole the Non-OPEC countries saw a production decrease of 1,312 kb/d.
In January 2023, these 11 countries produced 83.3% of all Non-OPEC oil production.
OPEC’s C + C production decreased by 90 kb/d MoM while YoY it decreased by 713 kb/d. World MoM production decreased by 1,402 kb/d while YoY output decreased by 474 kb/d.
Non-OPEC Country Oil Production Charts
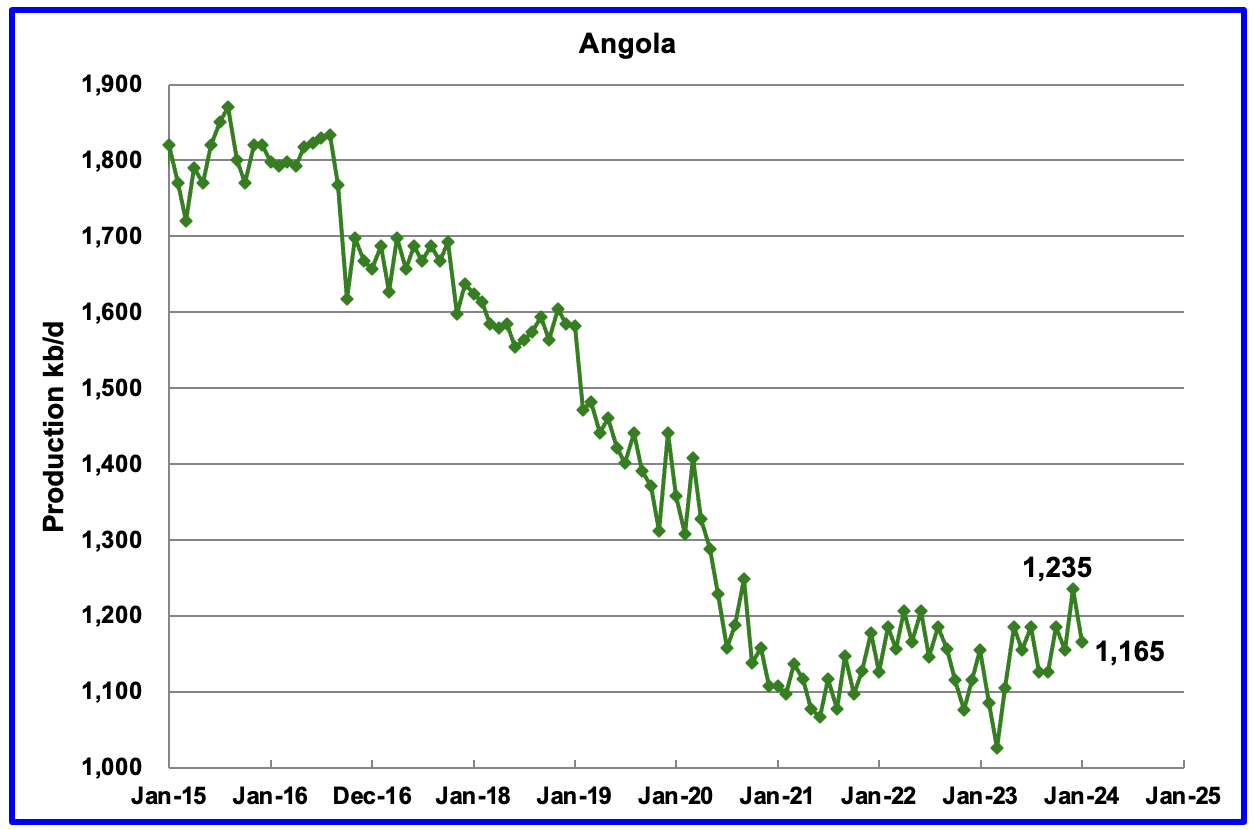
Angola has been added to the Non-OPEC producing countries since they have resigned from OPEC.
Angola’s January production decreased by 70 kb/d to 1,165 kb/d. Angola’s production since mid 2021 appears to have settled into a plateau phase.

The EIA reported that Brazil’s January production decreased by 66 kb/d to 3,519 kb/d.
Brazil’s National Petroleum Association (BNPA) reported that output dropped in both February and March, red markers. March production dropped by 92 kb/d to 3,356 kb/d.
From March 2023 to November 2023, production increased by 563 kb/d. A similar rise in production is not expected in 2024. For 2024 the MOMR is expecting a smaller increase, closer to 120 kb/d while the EIA is forecasting flat output.
Production from Brazil’s off-shore “pre-salt” region has been added to this chart. March’s pre-salt oil production was flat at 2,622 kb/d.
Note that while February’s, pre-salt production was flat, Brazil’s over all production dropped by 92 kb/d.
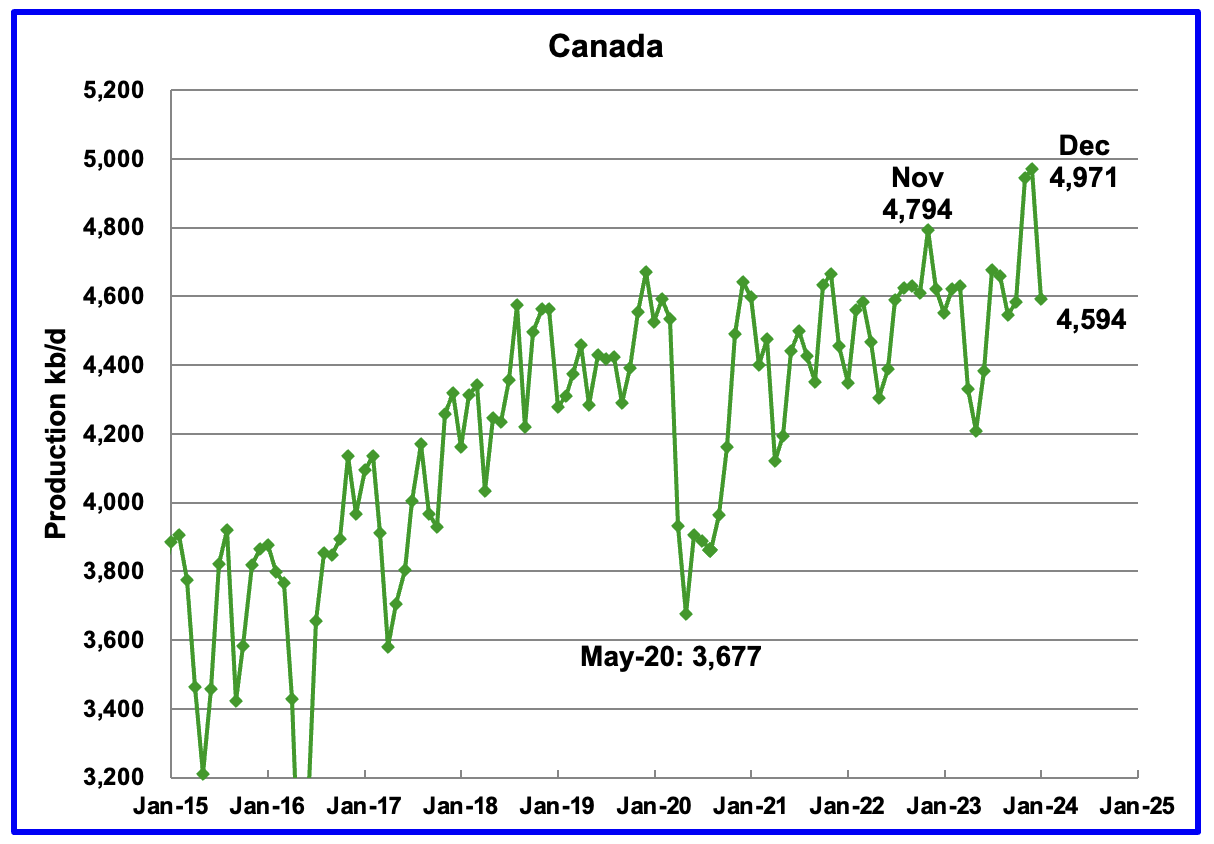
According to the EIA, Canada’s production decreased by 377 kb/d in January to 4,594 kb/d. The drop was related to bad weather and planned maintenance.
The TMX pipeline received final approval to operate on May 1, 2024. The line is currently being filled. The first ship will be taking on oil in the second half of May. According to this article, “It is a game changer for Canada that will have ripple effects around the world.”
“Led by India and China, oil demand in the Asia-Pacific region is projected to increase from 36 million barrels per day in 2022 to 52 million barrels per day in 2050, according to the U.S. Energy Information Administration.”
“More oil coming from Canada will shake up markets for similar world oil streams including from Russia, Ecuador, and Iraq, according to analysts with Rystad Energy and Argus Media.”
The first oil shipments from Canada will go to Reliance Industries in India, “Reliance buys its first Canadian crude from Trans Mountain pipeline, sources say.
It is surprising that they would buy this oil from Canada when India is buying lot of Russian crude.
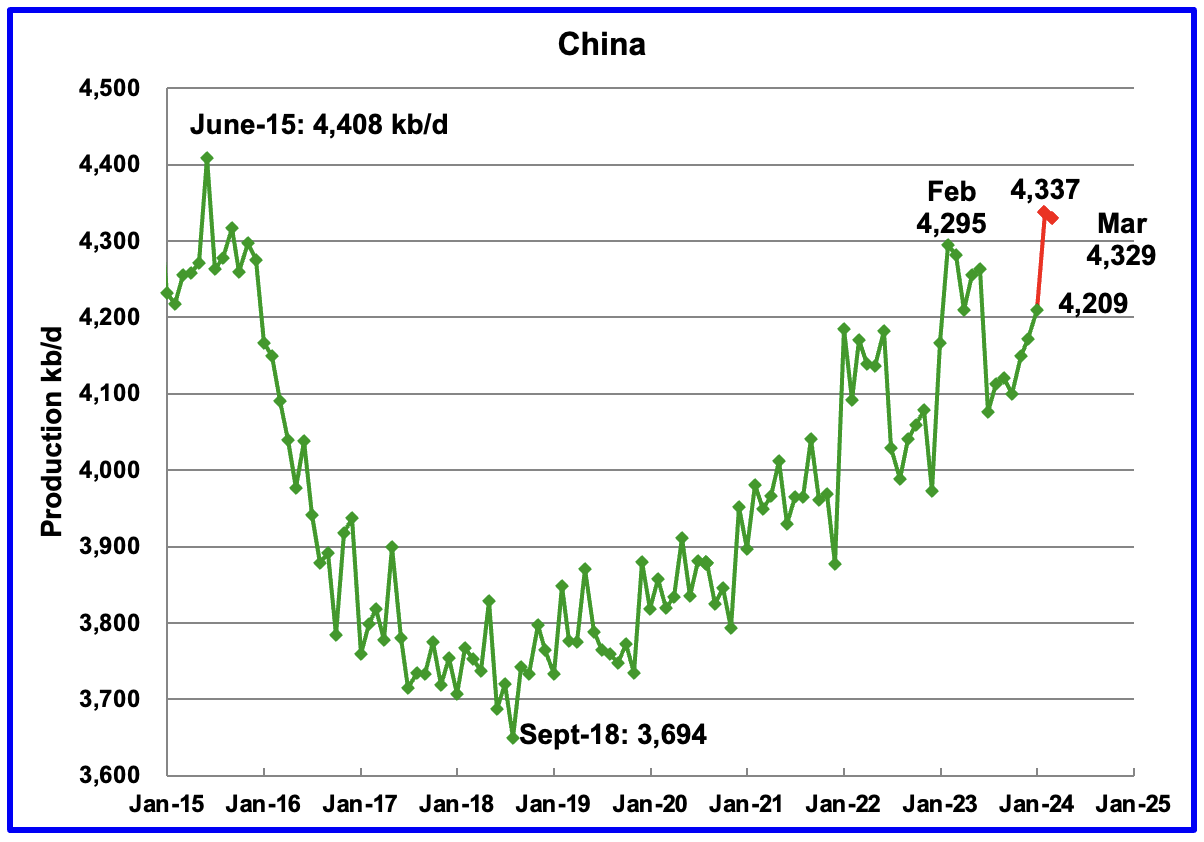
The EIA reported China’s oil output in January increased by 37 kb/d to 4,209 kb/d.
The China National Bureau of Statistics reported an average output for the January/February time period because they did not report January’s production. Using the EIA’s estimate for January and the China NBS estimate for February reveals that February production was close to 4,337 kb/d, a new record high by 42 kb/d. The CNBS reported that March production was 4,329 kb/d, a small drop from February.
While China’s production growth has risen steadily since 2018, it may be approaching its post pandemic high since the YoY increase for 2024 was 42 kb/d vs the 102 kb/d increase in 2023.
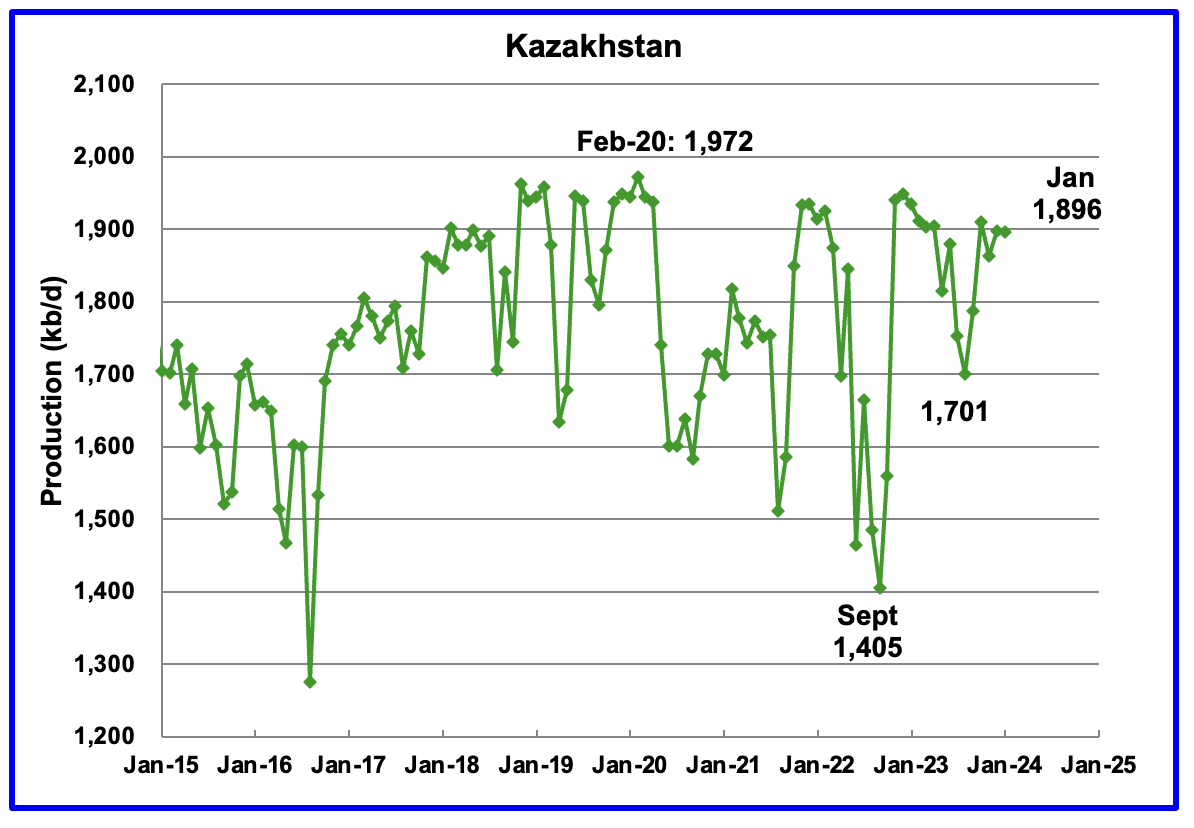
According to the EIA, Kazakhstan’s output decreased by 2 kb/d in January to 1,896 kb/d.
Kazakhstan and Iraq have been under pressure to reduce their production to comply with the OPEC + targets since oil inventories have not been falling as fast as expected. According to this source both countries will reduce their output.
“OPEC+ said following an online meeting on Friday that Iraq exceeded its quota by pumping 602,000 barrels per day in total in the first three months of 2024, while Kazakhstan exceeded its quota by pumping 389,000 barrels per day.
The plans shared by both countries show in detail that the entire overproduction will be fully compensated for by the end of this year, according to OPEC+.”
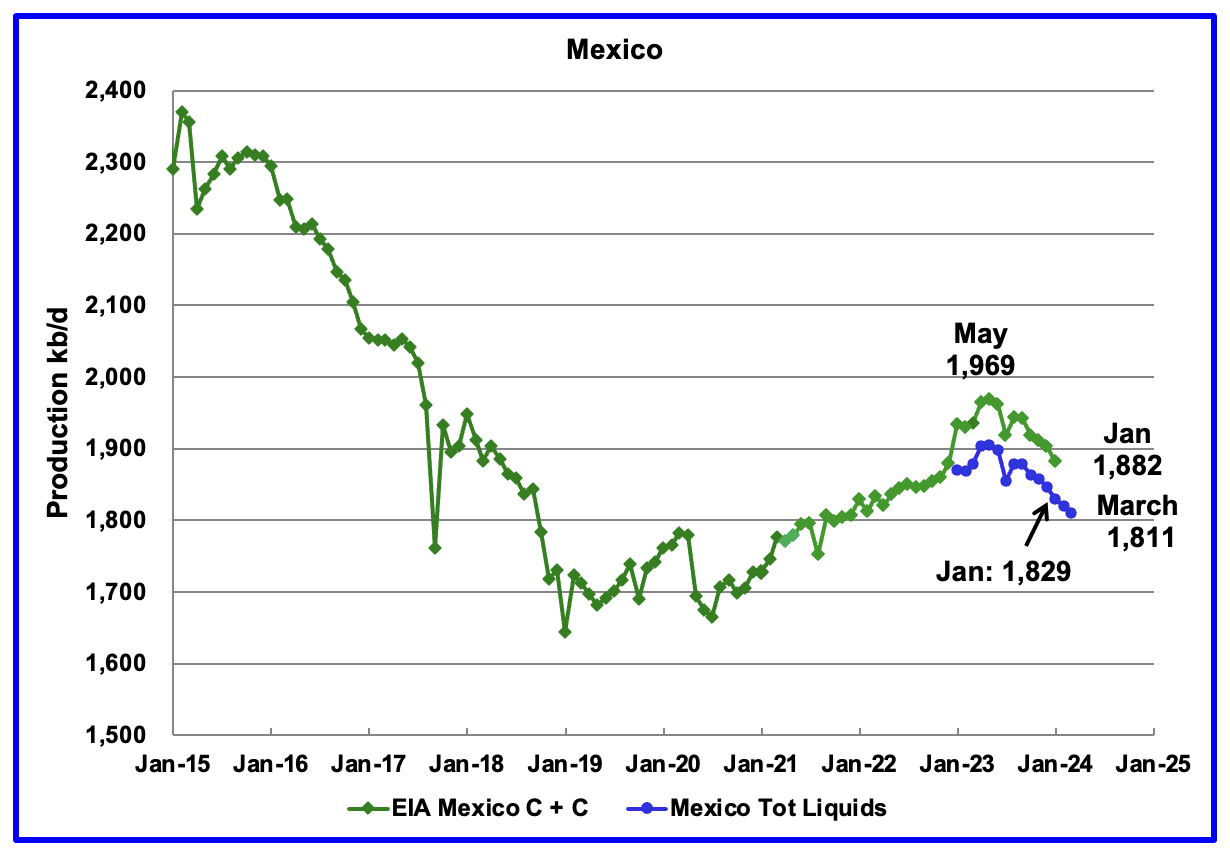
According to the EIA, Mexico’s output decreased by 21 kb/d in January to 1,882 kb/d.
For March, Pemex issued a new and modified oil production report for Heavy, Light and Extra Light oil. It is shown in blue in the chart and it appears that Mexico is not reporting condensate production when compared to the EIA report.
In earlier reports, the EIA would add close to 60 kb/d to the Pemex report. The gap between the EIA report and Pemex is roughly 60 kb/d.

The EIA reported Norway’s January production decreased by 45 kb/d to 1,849 kb/d.
Separately, the Norway Petroleum Directorate (NPD) reported that February’s production dropped 62 kb/d to 1,787 kb/d before rebounding in March to 1,863 kb/d, red markers.
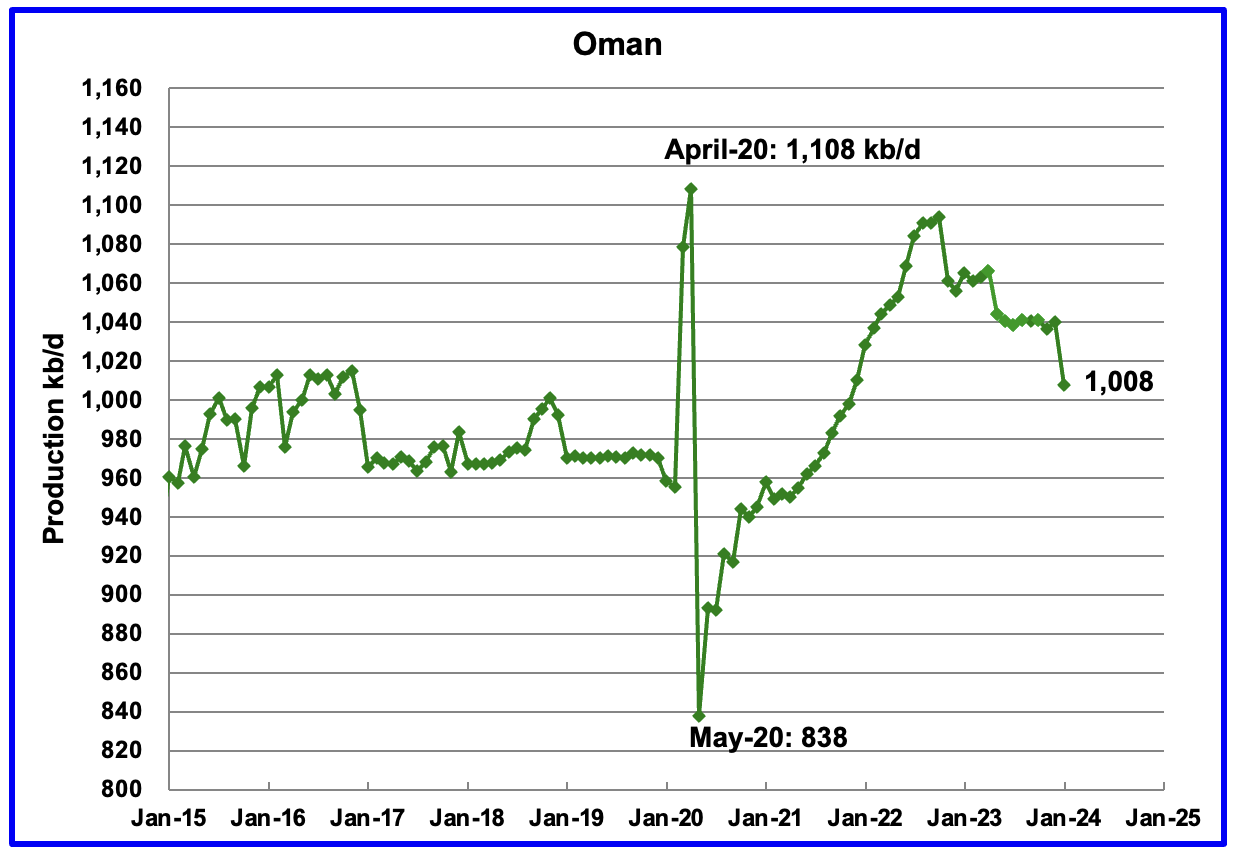
Oman’s production has risen very consistently since the low of May 2020. However production began to drop in November 2022. According to the EIA, January 2024 output was 1,008 kb/d.
According to this source Oman’s February oil production may have fallen below 1,000 kb/d. It is not clear if condensate is included as part of the production.
“The sultanate’s daily average output was 5.9% lower at 1mn barrels per day (bpd) in the first two months of 2024 against 1.063mn bpd in the same period a year ago. The average daily production in February stood at 994,400 bpd, falling below 1mn mark after more than a year.”
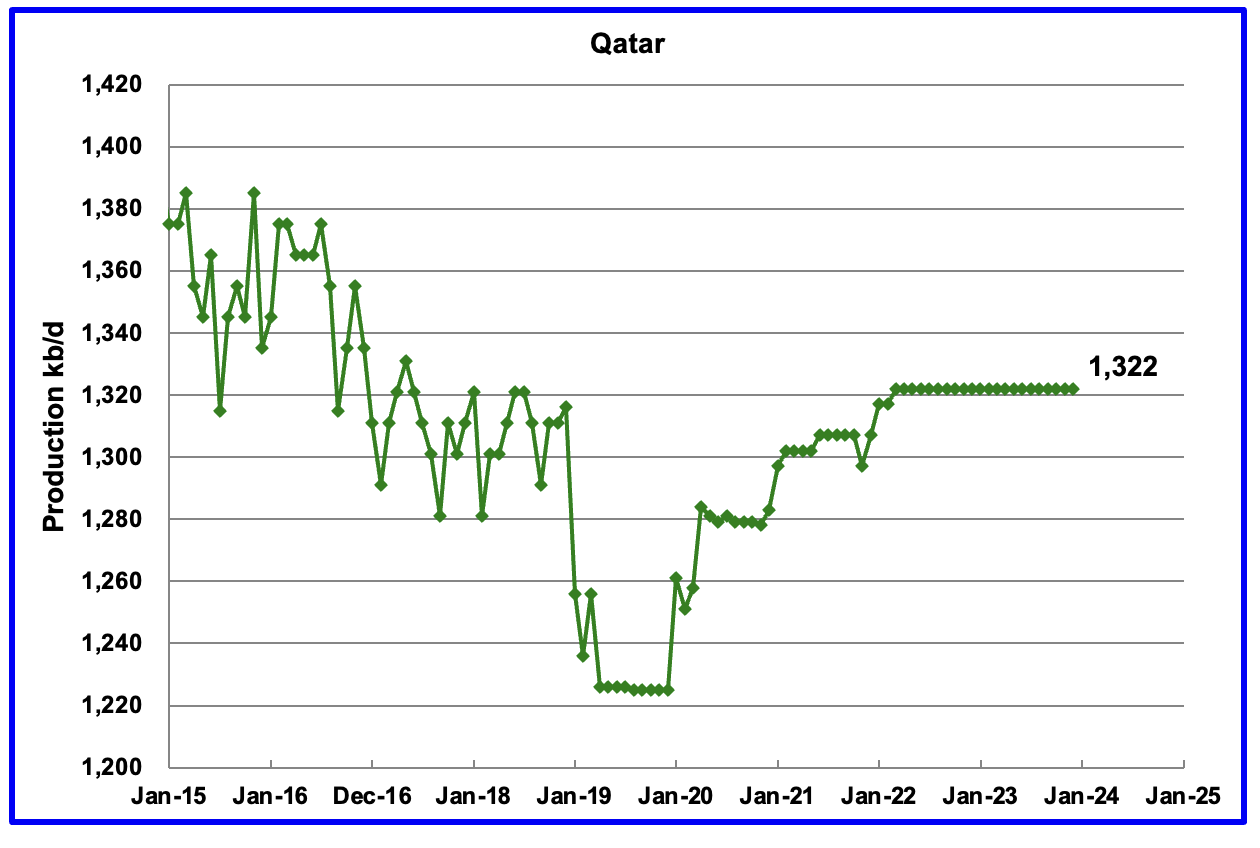
Qatar’s December output was unchanged at 1,322 kb/d, possibly due to lack of updated information.
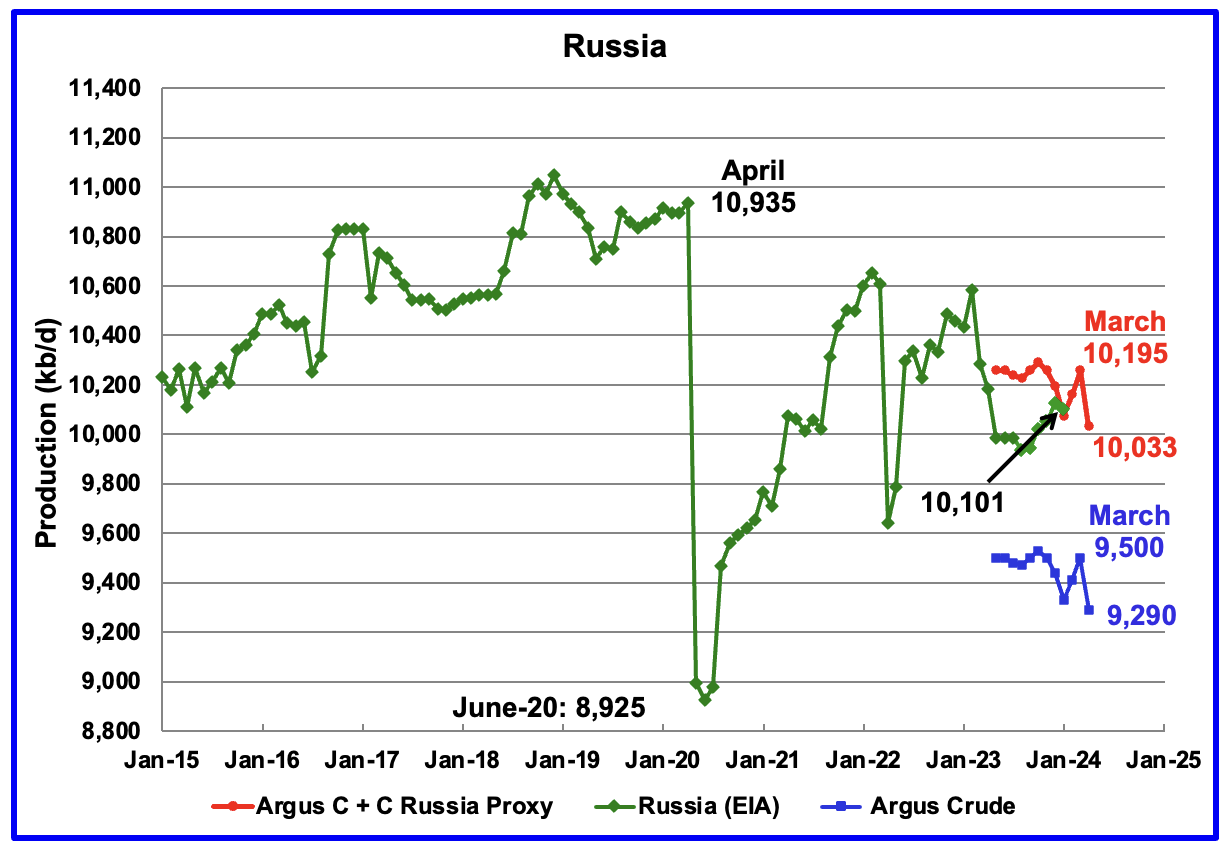
The EIA reported Russia’s December C + C production dropped by 25 kb/d to 10,101 kb/d. Using data from the May STEO report, Russian output is expected to be slightly lower at 10,033 kb/d in Febuary 2024. 9888
Using data from Argus Media reports, Russian crude production is shown from May 2023 to April 2024. For April 2024, Argus reported Russian crude production was 9,290 kb/d, a decrease of 210 kb/d, blue markers. Adding 8% to Argus’ March crude production provides a C + C production estimate of 10,033 kb/d, which is a proxy for the Pre-War Russian Ministry estimate, red markers.
S & P Platts reports that Russian April crude production was also 9,290 kb/d, down 130 kb/d from March, same as the Argus estimate for March.
January is the first month that the EIA has shown a dropping Russian production. For April, the STEO is estimating that Russian production will fall to 9,888 kb/d.
According to this March 25th article, Russia ordered companies to cut oil output to meet OPEC+ target.
“Russia’s government has ordered companies to reduce oil output in the second quarter to ensure they meet a production target of 9 million barrels per day (bpd) by the end of June in line with its pledges to OPEC+, three industry sources said on Monday.”
While Argus and S & P Platts are reporting big cuts in Russian production, the next source claims, “Russia Pumps Oil Above Target as New Voluntary Cuts Enter Force”
(Bloomberg) — Russia cut its crude oil production by less than pledged last month, exceeding the voluntary target agreed in March with OPEC+, according to Bloomberg calculations based on official data.
Daily crude production averaged just under 1.285 million tons last month, said people familiar with data from the Energy Ministry, who spoke on condition of anonymity because the figures aren’t public. That equates to 9.418 million barrels a day, based on the typical 7.33 barrel-per-ton conversion ratio for the nation’s crude.
That means Russia’s crude output in April was about 219,000 barrels below March level, but still some 319,000 barrels above the level specified in its agreement with the Organization of Petroleum Exporting Countries. Moscow had promised to put greater emphasis on production cuts, instead of export reductions, in a joint move to avert a global surplus and shore up prices.
What this all means is that we have to take the promised Russian cuts with a grain of salt. The difference between Bloomberg’s estimate and S&P Platts and Argus is 128 kb/d higher.
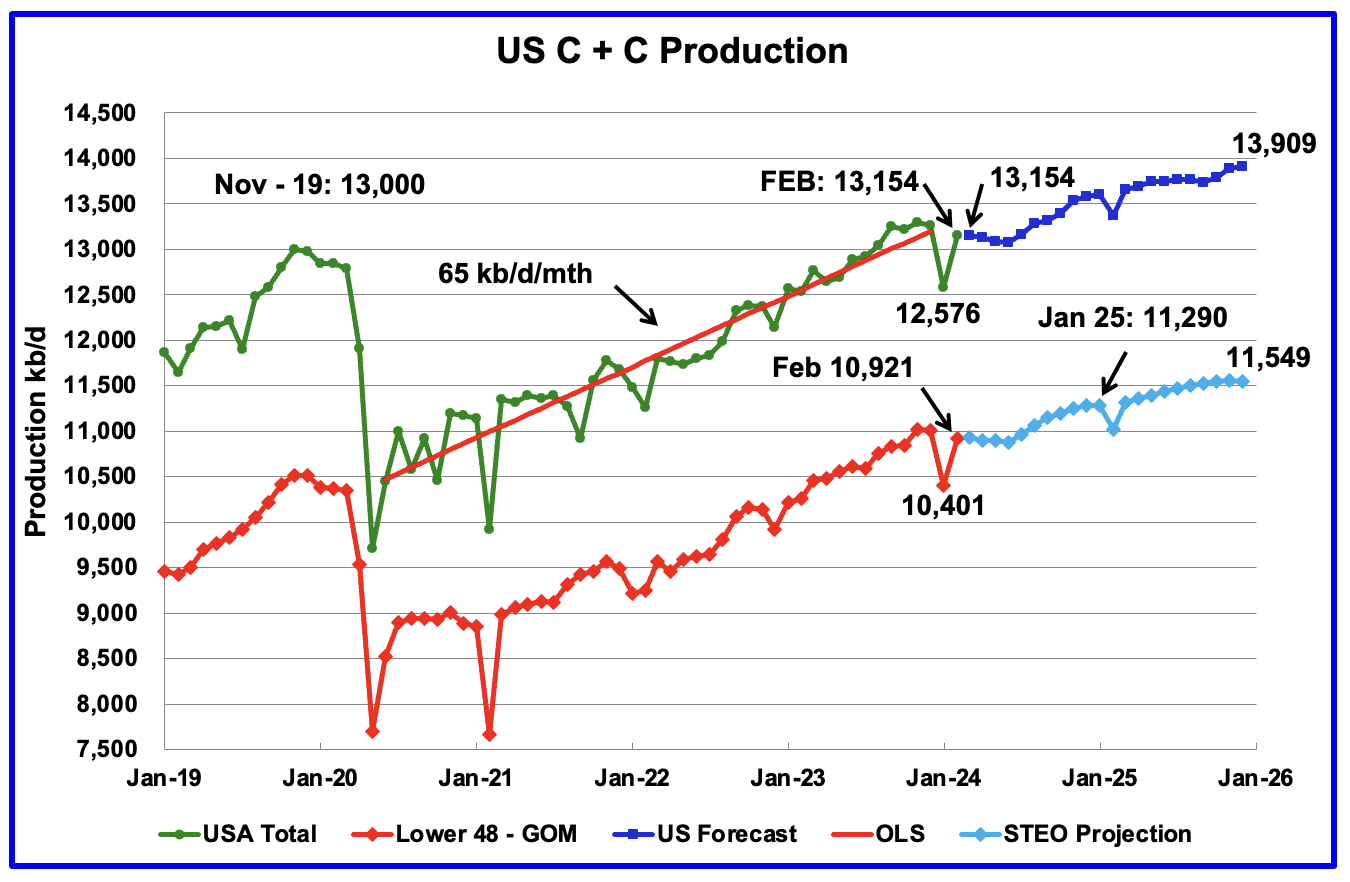
This chart is almost the same as posted in the US February update except that the light and dark blue graphs have been updated using the May STEO.
It seems that each STEO update increases US production in December 2025, especially the Onshore L48.
US December 2025 production has been increased by 5 kb/d to 13,909 kb/d while the L48-GOM has been increased by 65 kb/d to 11,549 kb/d. The last three months in the L48- GOM graph are essentially flat and may be hinting at a coming plateau. December 2025 production in lower than November by 5 kb/d.
“Led by India and China, oil demand in the Asia-Pacific region is projected to increase from 36 million barrels per day in 2022 to 52 million barrels per day in 2050.” plus oil supply dropping towards about half present number and exports towards zero by then, explains a lot of the increasing sabre rattling currently going on and equals global level conflict sometime in the thirties at latest.
Not if we all have EVs by then, thus dropping the need for oil entirely. You didn’t consider that did you, Georgie?
Kleiber, isn’t energy just an oil derivative…? Just sayin’….
Statement of the year:
“dropping the need for oil entirely”
don’t even know where to begin with that one…
Y’all have uncalibrated sarcasm detectors.
You’d be surprised, that statement could be found from several folks here…
Touché.
China’s crude imports plateaued around 10.5 million pre Covid. Currently they are onboarding large amounts of petrochemical manufacturing, which is likely to draw an equivalent amount from other nations, so not likely to be a net gain globally. More than 50% of vehicle sales will be BEV sometime this year. The population has peaked. Manufacturing is moving elsewhere. I don’t know where your forecast is coming from but it seems unrealistic.
India simply doesn’t have the geographic space to become a car culture. It is warm there. Getting around by bus, scooter or rickshaw is established and it will be easy to convert these things to electric.
Right now oil is around $80. OPEC is sitting on 2-3 million barrels of extra production. We are six years passed the last peak in oil. Established oil markets like Japan and Western Europe are aging and driving less.
China is electrifying vehicle markets in Brazil, Poland, Thailand, South Africa, etc. Any potential energy crisis appears at least one to two decades away.
https://www.spglobal.com/commodityinsights/en/market-insights/latest-news/oil/050923-china-data-april-crude-imports-drop-16-to-104-mil-bd
I don’t want to sound belittling. Billions of people don’t have the energy they need to live a decent life. But that has much more to do with our economic system than energy availability.
The energy crisis is absolutely here in Europe already. Don’t know what to tell you, the cost of living crisis factors heavily on energy for heating and production. Hollowing out heavy industry and now hitting the end consumer is not an indicator of a sound market in the supposed developed nations.
That’s not to discount your economics argument, which is absolutely core to this too. But let’s not kid ourselves that things are peachy because people literally can’t get oil or gas products. The economics has forced many into energy poverty at the same time as others have taken advantage of EVs and solar installations etc.
Perhaps I should have said there is no new energy crisis on the horizon, just the same one we’ve always had.
There are several deep flaws with our economic system. Perhaps most fundamental, resources are priced as if they are limitless and infinitely substitutable. Because of this idea of infinitude, goods are not priced at their social marginal utility. It should be much cheaper to acquire energy to heat your home or cook your food than to pour into the gas tank of your sports car for a cruise around town. But goods are not priced this way. I welcome any thoughts on how to change this situation. Here in the US the idea of being able to use things how you desire no matter it’s impact on others is so deeply entrenched, I have given up any hope of its changing. So my observations on any coming energy crisis do not reflect my moral beliefs of how things should be, only how they appear to be based on the current situation. That is, the wealthy will continue to prosper, and the poor will stay that way.
That said, there are gross, almost unbelievable, inefficiencies in our current energy paradigm that will be partially corrected by electrification. A doubling of efficiency in transport is easily possibly, maybe even an order of magnitude. I would not discount too heavily what brilliant inventions 8 billion human brains can accomplish.
Hear here, Stephen! Of course 8+ billion of us will also consume one helluva lot of poorly priced (as you rightly point out) resources. Climatologically, of course, we’ve already burned enough FF to screw ourselves going fwd, and we ain’t stopping.
Your old friend Dan
Steve from Virginia made this point so very well many years ago…. You call it ‘Marginal Utility’ and I like that phrase.
For my money it’s Chad Haag who does the best job of explaining just why this remains invisible to us in general with his discussion of the Deep Meme.
I guess you better be pointing all that out to the EIA who made the projection.
Now that I know who said it, I will consider it.
In Brazil the second Mero field FPSO started in December but had only averaged about one production well in March. Typically they add one producer per month so ramp up should end around September. The third FPSO is due on station at the end of May so is likely to reach plateau in Spring next year. The Campos basin has gone back into decline after a couple of field redevelopments and one new FPSO, so this year will likely see overall decline. Next year there are five large FPSOs due and will be at various stages of ramp up so a big increase towards around 4000 kbpd maximum. But that might be the end of growth and the challenge will be to hold a plateau. There are a couple of FPSOs per year due to 2029, but they get smaller. Discoveries outside the Santos region have been disappointing and have tailed off there as well, tie-backs don’t seem to contribute as much in these basins as the North Sea or GoM for example.
What is going on with Iran’s oil production? According to opec is around 3.4 million and for EIA is averaged more than 4 million for the past 2 months. What is a likely explanation for this discrepancy? Shadow fleet transporting oil not accounted for as discussed in this forum few months ago?
OPEC reports crude only, EIA numbers are usually crude and condensate. Iran has a huge amount of natural gas, and hence condensate, from the South Pars field, which recently started up latest phase. Could that explain it?
In Norway Johan Sverdrup is showing signs of entering decline as water breakthrough starts (its nameplate capacity is so large that even a small percentage is a large absolute number). All other fields, such as Troll, which was the immediately previous largest producer before gas blowdown of the oil rim reservoir was started, except a couple recent start ups, are also in decline. Johan Castberg (about 30 MSm3/d) is due to start up at the end of this year. It might be able to offset decline for a year or so but then the final tail for Norwegian oil will become apparent.
I’m currently in the north west of England and a place I frequent on the coast has two new gas rigs in the Liverpool Bay. They used to have one further out, so seeing these two much closer to the shore was interesting. Is there some big push for prospecting for gas fields right now because of the rise in importance and loss of growth in historical ones? I’d have thought most places around the British Isles were already tapped or exhausted by now.
There must be some interesting decisions to be made at the end of field life because of the time cost of the decommissioning expenses. Marginal developments may be more attractive if they allow a delay in spending for platform removal etc. But then the tax would also need to be considered – i.e. you’d need to be making a profit to be able to claim the taxes back from the end of life costs (or maybe just going bust once the decommissioning is due is the optimum). Not that it should particularly interest anyone but Morecambe Bay was the first oil and gas project I ever worked on in the seventies, when we didn’t even know how to produce a phase diagram for the gas.
Interesting. I recall hearing the stranded assets in the North Sea would cost oil and gas more than they have in capital left to decommission, meaning they’d just walk away. Forget if the gov’t reneged on that arrangement to try and sweeten the deal of more field openings.
The rigs I talk of are off the coast of Southport, and since growing up nearby, I only ever saw one in the distance. The two very much closer ones and a tanker made me wonder what was up since I’d heard nothing about fields outside the North Sea area.
EDIT: I should probably just do better web searches.
https://standupforsouthport.com/revealed-mystery-behind-the-huge-drilling-rig-spotted-off-southport-beach/
Mexico, China, Kazakhstan and Oman all look like they may have run out of oomph in trying to increase production and/or maintain a plateau. With frontiers like Suriname, Senegal and Sierra Leone providing smaller projects than were expected and the pipeline of projects in Brazil, GoM and the North Sea tailing off after 2025 what will Guyana, Namibia and a couple of OPEC producers be able to do, if anything, to halt a possibly precipitous decline after that?
It baffles me that anyone thought these projects were going to appreciably alter the trajectory. If the combined clout of the US, Russia, Iran and KSA wasn’t going to do it, what were these guys supposed to do?
It would seem a huge chunk of expansion in recent years was heading off decline and helped by the pandemic and other headwinds. If everyone was doing gang busters economically, it would be even more obvious. Or maybe it’s this way because of the energy situation. Certainly Germany is illustrating the latter through voluntary stupidity.
Yup, short-term supply is effected by past long-term consumer sentiment, ie demand. Years of short supply will bankrupt future demand (and it will remains so) in spite of explosive new supply growth, such as seen by new fracting tech.
Lots of great comments, George. RE China, there was this tidbit:
” BEIJING, May 6 (Reuters) -Production at China’s first national level shale oil demonstration project reached a record of 215,000 metric tons, or 2,800 tons per day, CCTV said on Saturday.
Production at the Jiqing field in the western region of Xinjiang, operated by state-owned CNPC [RIC:RIC:CNPC.UL], is expected reach 1.4 million tons in 2025, the report said.
China’s oil majors have invested heavily in developing more technically challenging fields such as ultra-deep reserves and shale oil in a bid to reverse declining production from mature fields.”
OPEC+ output falls 210,000 b/d as Russia makes deeper cut; quota compliance still lagging
OPEC+ pumps 41.04 mil b/d in April
Russian output falls 130,000 b/d on month
Iraq, Kazakhstan remain well above quota
OPEC+ crude production fell 210,000 b/d month on month to 41.04 million b/d in April, the Platts OPEC+ survey by S&P Global Commodity Insights found, as Russia began to implement a deeper output cut amid a string of Ukrainian drone attacks on its refineries.
However, the decrease is unlikely to be enough to allay tensions over compliance, with Russia missing its target, and Iraq and Kazakhstan continuing to produce significantly above their quotas.
OPEC+ production is at its lowest since August, not including Angola, which quit the group in December.
OPEC produced 26.63 million b/d in April, down 30,000 b/d from March volumes. Its non-OPEC allies led by Russia added 14.41 million b/d – down 180,000 b/d on month.
The bulk of the declines came from Russia, which committed to implement a deeper output cut from April, and faced disruptions linked to Ukrainian attacks on its refineries and flooding in some oil producing areas.
Russia lowered production by 130,000 b/d to 9.29 million b/d in April, missing its target of 9.099 million b/d, the survey found.
Still, this is its lowest level since May 2022, shortly after Russia’s invasion of Ukraine shocked energy markets.
Russia is the only member of the group that is increasing its voluntary cut from April, having pledged to gradually convert what previously were export cuts into actual production cuts by the end of the second quarter, bringing its quota in line with fellow OPEC+ co-chair Saudi Arabia’s.
Saudi Arabia continued to comply with its quota, cutting output by 10,000 b/d to 8.98 million b/d in April, the survey found.
There is a lot more to this article, including charts. Click on the blue link to read.
Ron
It is interesting how the headlines of S & P Platts and Argus focussed on the Russian production drop. In the Bloomberg headline below, it focuses on how Russian production is above target. According to Bloomberg, Russia is pumping 128 kb/d more than Argus and S & P Platts are reporting. Bottom line is we really don’t know how much Russia is pumping.
https://www.bnnbloomberg.ca/russia-pumps-oil-above-target-as-new-voluntary-cuts-enter-force-1.2070508
Ukraine’s strategy of hitting Russian oil refineries is working
Ukraine’s strikes on Russian oil refineries are doing what oil sanctions have failed to achieve: reducing the Kremlin’s income from oil production, limiting its supply of fuel for the army and pushing up domestic prices, but without affecting the international markets for oil. Despite US fears, the effect of the attacks will be to drive international oil prices down, not up.
Since the drone war started earlier this year, new long-distance drones have struck at least 20 targets deep in Russian territory, causing fires and threatening to put refineries out of action for weeks as increasingly difficult to effect repairs are carried out.
The attacks do not destroy refineries. Thanks to the legacy of the Cold War, most refineries were built to withstand attack and have air defences, as bne IntelliNews reported in an article looking at how much damage Ukraine’s drone attacks on oil refineries can do.
Nevertheless, Russia’s oil products production has fallen by an estimated 14% between January and March as a result, causing shortages for the civilian population, if not for industry and the military; Russia has significant over-production capacity to enable exports and only an estimated 40% of its refineries are in range. But the attacks have already caused the domestic prices for oil and diesel to surge.
There is a lot more to this article. Click on the blue link to read.
Surprised Biden hasn’t stepped in to tell them to stop again, at least publicly.
According to the article the attacks are affecting Russia’s domestic price for fuel more than the price of crude/exports.
Ron
I wonder if this is a planned strategy to attack refineries vs Gas/oil/water separating plants. If they were to hit GOW plants that would drive up the price of crude and reduce cash going to Russia. That would really hurt Russia and the US via the price of crude. Now that the US realizes hitting refineries doesn’t affect the price of crude that much, they are ok with attacking refineries.
Ovi, I doubt if there is any planned strategy other than to deny Russia income, upset the population, and turn them against the war. I hope that strategy is working. This war is costing Putin and Russia dearly, both in income, war material, and human lives.
Aramco’s Q1 2024 Results: Saudi Arabia is at a Dangerous Tipping Point
Crude oil ‘spare capacity’, according to the accepted definition in the markets from the Energy Information Administration is, “the volume of production that can be brought on within 30 days and sustained for at least 90 days”.
Saudi Arabia’s version of these terms is markedly different, and therefore wrong. The Kingdom uses the terms ‘capacity’ and ‘supply to the market’ to mean not just production from the wellheads of their own oilfields but also using crude oil supplies held in storage at any given time in the country. It also appears to mean to Saudi Arabia any oil supplies that can be withheld from rolling term-contracts and re-directed into those stored supplies. During the 2014-2016 Oil Price War, Saudi nearly drained its storage facilities of oil and cut back on oil supply contracts with non-priority clients. And it also seems to mean any oil supplies of similar crude grades to its own that Saudi Arabia can buy from other OPEC members – either directly or through brokers – that it can then pass off as its own supplies. According to the E.U. source, a source in the U.S. energy security complex, and three senior oil broking sources exclusively spoken to by OilPrice.com over the past decade, Saudi Arabia bought in significant supplies of crude oil from Iraq and other countries not just over the 2014-2016 Oil Price War, but also after the September 2019 attacks by the Iran-backed Houthis on its Abqaiq and Khurais oil facilities, and during the brief 2020 Oil Price War as well. Ironically, given that Tehran was behind the 2019 attacks, some of the oil bought by Saudi Arabia through brokers believing it to be from Iraq, was actually ‘rebranded’ oil from Iran instead, according to a source who works very closely with Iraq’s Oil Ministry.
Thanks, Frugal, for posting what I have been preaching for 20 years. Exaggeration is a way of life in the Middle East. They all do it. I am shocked that some people are now beginning to realize that all those exaggerated reserve numbers are pure fiction.
The May OPEC MOMR is just out with crude production data for April. Just this month, they started reporting the OPEC+ crude oil production numbers. The OPPEC 12 was down 48 kbpd. The 10 + members were down 198 Kbpd for a total of minus 246 kbpd for OPEC+. Big losers were Russia, down 154 kbpd and Kazakstan, down 50 kbpd. No one had any huge gains.
The Middle East is the birthplace of bartering & haggling. Why people have such a difficult time believing that they would lie or exaggerate about goods they’re trying to sell?
Especially to foreigners of a different religion……..
All religions are built on lies (of the mythical variety)
“Religion is poison”
-Mao
“All religions are built on lies (of the mythical variety)”
You mean Jesus doesn’t want me to give away all my money and possesions as he says repeatedly in the Gospels?
Were Matthew, Mark, Luke and John grifters??? Highly educated (relative to the time), literate, Greek speaking writers (Jesus’s followers would have spoken Aramaic)
who emphasised that people should be content with being poor and not keep their money.
I just watched a video on the Saudi Neom or The Line mega-project: https://www.youtube.com/watch?v=Ak4on5uTaTg
This is not the kind of project I would invest in with the approach of peak oil.
For a number of years OPEC was really reduced to Saudi Arabia and possibly Kuwait, that is to say the other members of OPEC all cheated on their quotas while the Saudis did not. If the returns on the Neom project are less than expected, I conjecture that the Saudi’s will be short of cash and thus will produce flat out regardless of what quotas OPEC agrees to if this is not already the case.
Using the system described below, I get scores between 10-14, moderate signals that peak oil is occurring. Curious how others might score this?
“Creating a scoring system to rate the likelihood that peak oil has not occurred involves evaluating each factor on a scale from 1 to 5, with 1 indicating a weak signal and 5 indicating a strong signal. Here’s a suggested scoring framework:
1. **Increasing Production**:
– 1: Production is declining.
– 2: Production is stagnant.
– 3: Slight increase in production.
– 4: Moderate increase in production.
– 5: Significant, steady increase in production.
2. **New Discoveries**:
– 1: Very few or no new discoveries.
– 2: Few, small discoveries.
– 3: Moderate, but not game-changing discoveries.
– 4: Several substantial discoveries.
– 5: Many large, economically viable discoveries.
3. **Technological Advances**:
– 1: No significant advances.
– 2: Minor improvements.
– 3: Moderate technological progress.
– 4: Significant advances improving extraction.
– 5: Major breakthroughs revolutionizing extraction.
4. **Stable or Declining Extraction Costs**:
– 1: Extraction costs are rising sharply.
– 2: Moderate increase in costs.
– 3: Stable costs.
– 4: Slight decrease in costs.
– 5: Significant decrease in costs due to technology.
5. **Stable or Growing Reserve Estimates**:
– 1: Reserves are consistently revised downward.
– 2: Slight decrease in reserves.
– 3: Stable reserves.
– 4: Slight increase in reserves.
– 5: Significant increase in reserves.
6. **Market Stability**:
– 1: Oil prices are highly volatile and increasing.
– 2: Moderate price volatility and increase.
– 3: Stable prices with slight fluctuations.
– 4: Prices are stable with minimal fluctuations.
– 5: Long-term price stability and predictability.
7. **Investment Trends**:
– 1: Major divestment from oil exploration/production.
– 2: Decreasing investment.
– 3: Stable investment levels.
– 4: Increasing investment.
– 5: Significant, sustained increase in investment.
### Example Scoring
Let’s hypothetically rate each factor based on current data (Note: Actual data might vary):
1. **Increasing Production**: 3 (slight increase)
2. **New Discoveries**: 2 (few, small discoveries)
3. **Technological Advances**: 4 (significant advances)
4. **Stable or Declining Extraction Costs**: 3 (stable costs)
5. **Stable or Growing Reserve Estimates**: 2 (slight decrease in reserves)
6. **Market Stability**: 3 (stable prices with slight fluctuations)
7. **Investment Trends**: 3 (stable investment levels)
### Calculation
Total score = (3 + 2 + 4 + 3 + 2 + 3 + 3) = 20 out of 35.
### Interpretation
– **0-7**: Very strong signals peak oil has occurred.
– **8-14**: Moderate signals peak oil has occurred.
– **15-21**: Mixed signals, leaning towards peak oil not having occurred.
– **22-28**: Moderate signals peak oil has not occurred.
– **29-35**: Very strong signals peak oil has not occurred.
In this example, a score of 20 suggests mixed signals, leaning towards the idea that peak oil may not have occurred yet. For a more accurate assessment, you would need to update the scores with the latest data.”
Kengeo,
My assessment is 2, 2, 3, 3, 3, 2, 2 or 17 total at present.
Thanks Dennis – there’s a wide range depending on how you score it, I basically get a possible range of 7 to 21, would be interesting to see the assessment for every 5 years ~1995 to 2025, imagine it would be a downward trend, maybe starting around 30-something and dropping by ~2-3 every 5 years…
Thanks Kengeo,
I am getting the same as Dennis ~ 17.
18.
I am grading these on short term prospects, since the timeframe in consideration was not specified.
The answer would be different if we were speculating about conditions 3 or 5 years from now.
Hickory,
I was looking at what has happened over the past 5 years or so and my expectations for the next 5 years (but with more focus on history as my predictions are often incorrect). Initially I had 20 (2, 2, and then all 3s) but I revised. Probably 17-20 would be my personal 90% confidence interval.
Well my score will jump considerably if this headline is true (500 Gb discovery):
“Russia Discovers Massive Oil and Gas Reserves in British Antarctic Territory”
https://oilprice.com/Energy/Crude-Oil/Russia-Discovers-Massive-Oil-and-Gas-Reserves-in-British-Antarctic-Territory.html
If it’s there, that is some truly inaccessible oil. Or maybe the British, the Argentines, and the Russians will figure out a joint venture. Lmao.
This is interesting. The shale patch is much less hedged at the moment than in the past. If prices continue to drift lower, the impact will be more immediate.
https://oilprice.com/Energy/Energy-General/Under-hedged-US-Shale-Patch-Exposed-To-Falling-Oil-Prices.html
Russian Oil Revenue Hit as Exports Drop to 5-Month Low, IEA Says
By Bloomberg News
May 15, 2024 at 3:00 AM CDT
Russia’s April exports of crude and petroleum products dropped to levels last seen in late-2023 amid Ukrainian drone attacks and planned output cuts, putting pressure on the nation’s oil revenues, according to the International Energy Agency.
The country exported a total of 7.3 million barrels a day last month, down 6.4% from March, the Paris-based agency said in its monthly report published Wednesday. That’s Russia’s lowest oil exports in five months, the IEA estimates show.
Looks like Ukraine’s attacks are having an effect.
North Dakota oil production numbers for March has just come in. Production was down 22,946 barrels per day from February.
ND Monthly Oil Production Statistics
The Rig report for the week ending May 17
– US Hz oil rigs decreased by 3 to 451. This is the second big drop in as many weeks.
– Texas Permian was down 3 to 197 while NM was unchanged at 102.
– In New Mexico, Lea county dropped by 1 to 48 and Eddy added 1 to 54.
– In Texas, Martin dropped 2 to 33 and Midland was unchanged at 21.
– Eagle Ford added 2 to 48
– NG Hz rigs were unchanged at 93. (Not shown)
Second week in a row of moving rigs from the Permian to the Eagle Ford.
Frac Spread report for the week ending May 17
The frac spread count rose by 5 to 263 and is up 1 from one year ago. The chart continues to indicate the frac spread count will bounce between 250 and 275 going forward.
Normally the Eddy county production chart below is posted as part of the US update. However the March production drop is so extraordinary, 167 kb/d, that I felt it should be posted to see if anyone had any deeper insight regarding the large drop. This large drop almost guarantees that NM will see a production drop in the EIA’s June update.
Note that in the last US update the county production charts included monthly rig count data shifted by 7 to 8 months and speculated on a possible correlation between the rig count and production. In this case the rig count has been shifted forward by 8 months. Note that rig counts are being used because accurate data is available and very few DUCs are being completed.
On the shifted rig time scale the average weekly rig count dropped from 49 in February to 40 in March and this must be the primary reason for the drop in production.
In the next GOR chart, the GOR jumps from 5.29 in February to 5.65 in March. This implies a very rapid pressure drop and the associated drop in oil production.
While it appears from the rig count that production will drop further in the next few months, the interesting question to ask is will production rise to the February level as the rig count rises back to 50 in October on the shifted time scale.
Note “Feb OCD Projected” is actually “March OCD Projected”. Just missed to update it.
The New Mexico data was downloaded on Thursday and a small update was added Friday.
https://wwwapps.emnrd.nm.gov/ocd/ocdpermitting/Reporting/Production/CountyProductionInjectionSummary.aspx
Eddy GOR chart
Just checked the NM site and it was updated this Saturday morning. Never seen that before.
Looks like Eddy county production will be flat for March. However it may decline next month if it continues to follow the rig count.
This article shows graphs indicating that global ICE vehicle sales peaked in 2017.
The data used does not include 2 and 3 wheel vehicles, and anything without a plug is placed in the the ICE category as it should be (even if it is a ‘hybrid’).
It think this peak will hold… so far there has not been a new post-Covid peak.
https://cleantechnica.com/2024/05/18/peak-ice-fleet-is-closer-than-we-believe/
https://www.ndtv.com/world-news/russia-says-ukraine-launched-62-drone-attacks-oil-refinery-halted-5700501
Ukraine launches huge 62 drone and ATACMS attack halting Russian refinery
“Slavyansk refinery is a private plant with a capacity of 4 million metric tons of oil per year, about 1 million bpd.”
naaah, that’s not true. more like 80kbpd
That is correct using 7.33 barrels/metric tonne, 365 days per year, and 1000 kb per million barrels, thanks for pointing this mistake out.
4*7.33/365*1000=80 kb/d.
Here’s some interesting info today from EIA, that can help us quantify gasoline displacement by EVs, that was discussed up in this thread.
https://www.eia.gov/todayinenergy/detail.php?id=62083
So for 2023 (this is USA), they have 7,500 GWh consumed by EVs. Allowing that the EV drive-train is 5x more efficient than ICE, that only comes down to 74 kbpd of gasoline displaced. Considering that this is final gasoline (inclusive of ethanol and butane), and that gasoline is lighter, with lower volumetric energy density, the oil displaced is less (probably 60 kbpd or less).
This is immaterial. Gasoline consumption reported by EIA (refinery product, prior to oxygenate and additional butane blending) is close to 8.5 MMbpd, so we are talking less than 1% displacement. This has been a non-factor so far, much less impact than the ethanol mandate or the raised CAFE mandates had earlier this century.
If they are measuring electricity consumption only at EV chargers that would be a major error since probably 90%+ is done at home. Hard to see how you could reliably break out that number from typical residential consumption. Even so, 1% is not immaterial. Prices are set at the margin. If consumption goes down by 1% and supply goes up by 1%, that will eventually create big price moves.
7500 GWh, for a tesla we use about 250 Wh per mile in a M3 or about 1 kWh consumed in 4 miles, a GWh would be one million kWh so we could travel 4 million miles with a GWh and 30 billion miles using 7500 GWh.
Let’s compare to an average vehicle that has a fuel efficiency of 40 MPG (Camry Hybrid) 30 billion miles divided by 40 would be 750 million gallons of gasoline or 17.85 million barrels, divide by 365 days an that is 48 kb/d of reduced gasoline use, even less than the 80 kb/d estimate, note that the US light duty vehicle fleet probably does not have an average efficiency of 40 MPG, probably more like 25 MPG. In the US there were only about 2.4 million registered EVs, if we assume all of then were operating for all of 2023 (probably not the case) and each drove on average 12,000 miles per year we would have about 29 billion miles driven, similar to my estimate for miles driven. Also about 0.86% of all registered vehicles are EVs in the US so this would match up well with the 80 kb/d estimate, if we assume average fleet efficiency of 25 MPG the numbers match well, and I agree not significant yet.
Thanks Dennis!
The 30B miles driven by EV checks out. US miles driven a 3.3T per year, so again less than 1%
Your welcome, thanks for pointing this out I had missed that EIA post. You are definitely correct that the US has a long way to go. Keep in mind at the World level there are 40 million EVs on the road as of Dec 2023. So 40 million times 10k miles is 400 billion miles. Assuming 30 MPG World average for efficiency (for cars replaced) amounts to 317 million barrels per year, or 868 kb/d of reduced demand for gasoline or diesel due to the ICEVs replaced by plugin vehicles. Again this is only 1.5% of World total gasoline and diesel consumption, eventually it may become big enough to see a reduction in demand at the World level.
Kdimitrov.
The good news is that once petrol supplies go into inexorable decline there will be/is a robust global EV fleet and manufacturing capability to replace the fade out.
Already it looks like the peak year for global ICE vehicle sales was 2017.
We now have all kinds of vehicles coming on the global market-
https://electrek.co/2024/05/16/vinfast-vfs-secures-nearly-30k-pre-orders-new-10000-vf-3/
JODI data for the USA through March. It is JODI data, so they might be off by a bit.
New posts up.
https://peakoilbarrel.com/opec-update-may-2024/
and
https://peakoilbarrel.com/open-thread-non-petroleum-may-20-2024/