By Ovi
The focus of this post is an overview of World oil production along with a more detailed review of the top 11 Non-OPEC oil producing countries. OPEC production is covered in a separate post.
Below are a number of Crude plus Condensate (C + C) production charts, usually shortened to “oil”, for the oil producing countries. The charts are created from data provided by the EIA’s International Energy Statistics and are updated to February 2025. This is the latest and most detailed/complete World oil production information available. Information from other sources such as OPEC, the STEO and country specific sites such as Brazil, Norway, Mexico, Argentina and China is used to provide a short term outlook.
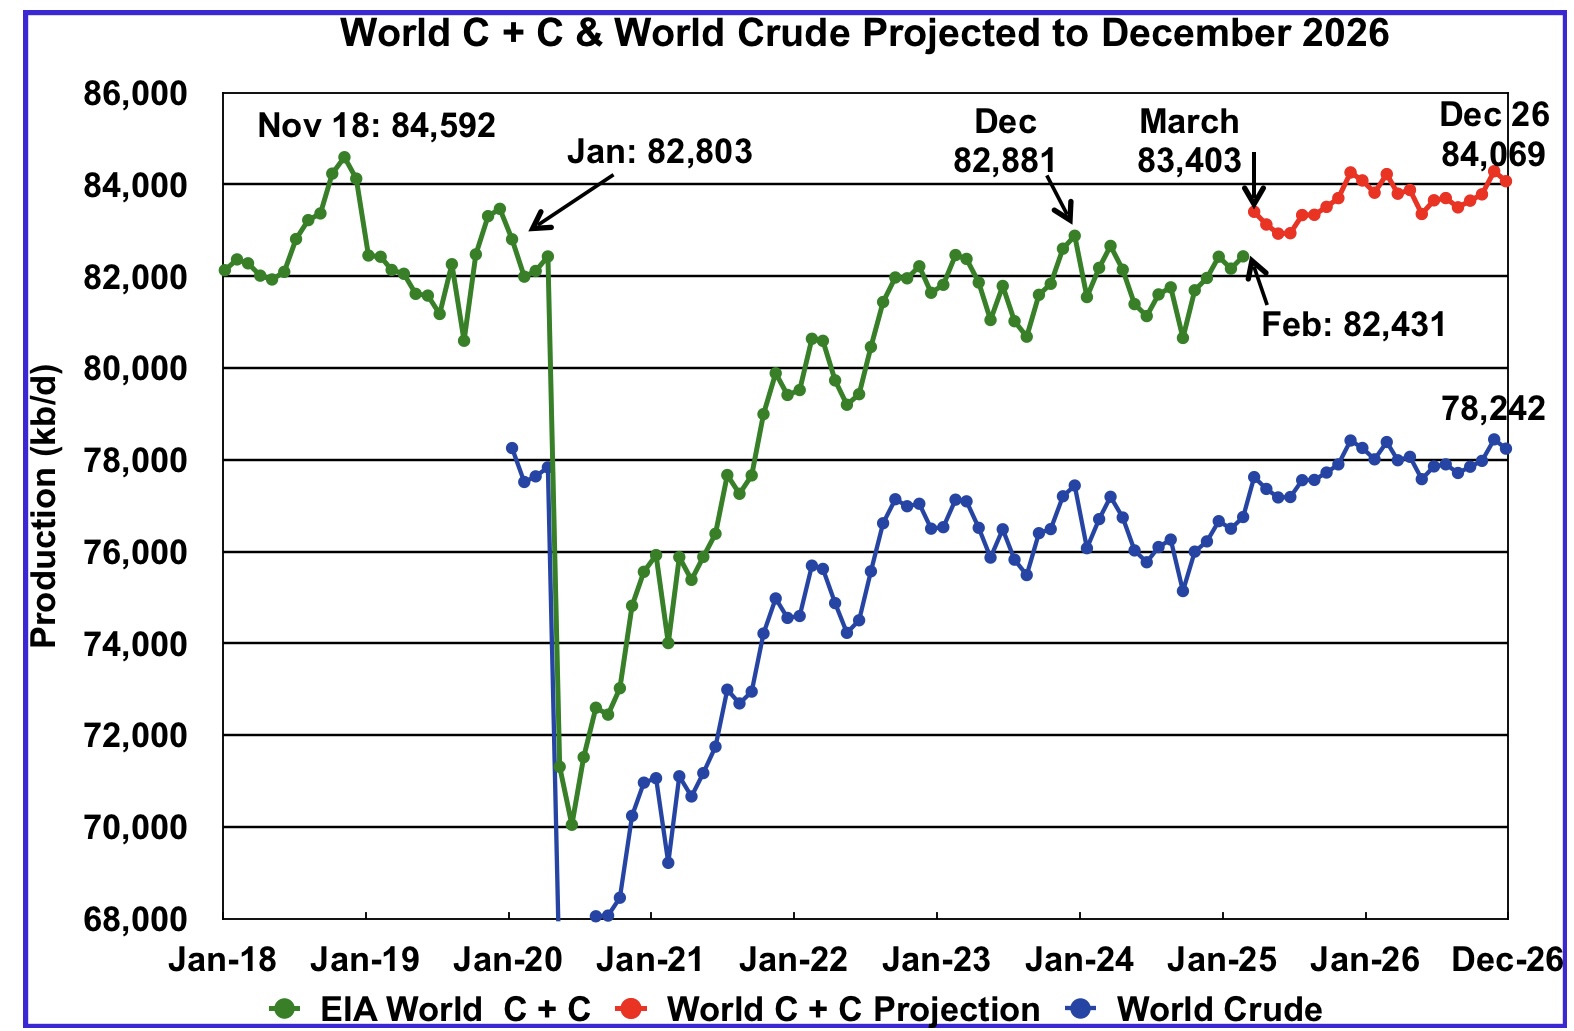
World oil production increased by 267 kb/d in February to 82,431 kb/d, green graph. The largest increase came from the Kazakhstan, 254 kb/d largely ‘offset by Canada’s drop nof 232 kb/d. March World oil production is projected to increase by 972 kb/d to 83,403kb/d.
This chart also projects World C + C production out to December 2026. It uses the June 2025 STEO report along with the International Energy Statistics to make the projection.
For December 2026, production is projected to be 84,069kb/d. The December 2026 oil production is lower than the November 2018 peak by 523 kb/d. December 2026 production has been revised up by 249 kb/d from the previous report.
From December 2023 to December 2026, World oil production is estimated to increase by 1,188 kb/d.

February’s World oil output without the US increased by 168 kb/d to 69,191kb/d. March production is expected to increase by 724 kb/d to 69,915 kb/d.
The STEO is forecasting that December 2026 crude output will be 70,716kb/d. Note that the December 2026 output is 1,969 kb/d lower than the November 2018 peak of 72,685 kb/d.
World oil production W/O the U.S. from March 2025 to December 2026 is forecast to increase by a total of 801 kb/d.
A Different Perspective on World Oil Production
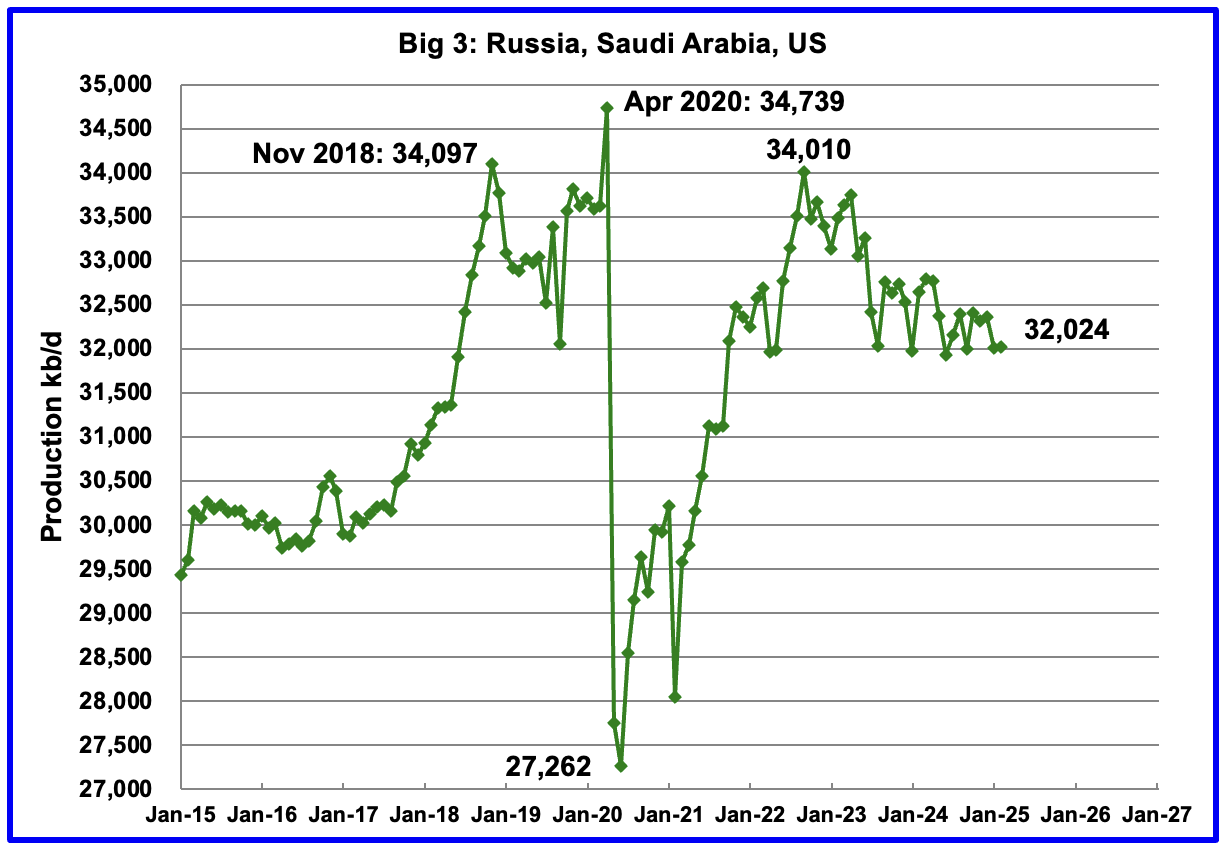
February’s Big 3 oil production increased by 19 kb/d to 32,024 kb/d. Production in February was 1,986 kb/d lower than the September 2022 post pandemic high of 34,010 kb/d. OPEC has announced it will start increasing production in May so the 1,986 kb/d drop should start to get smaller.
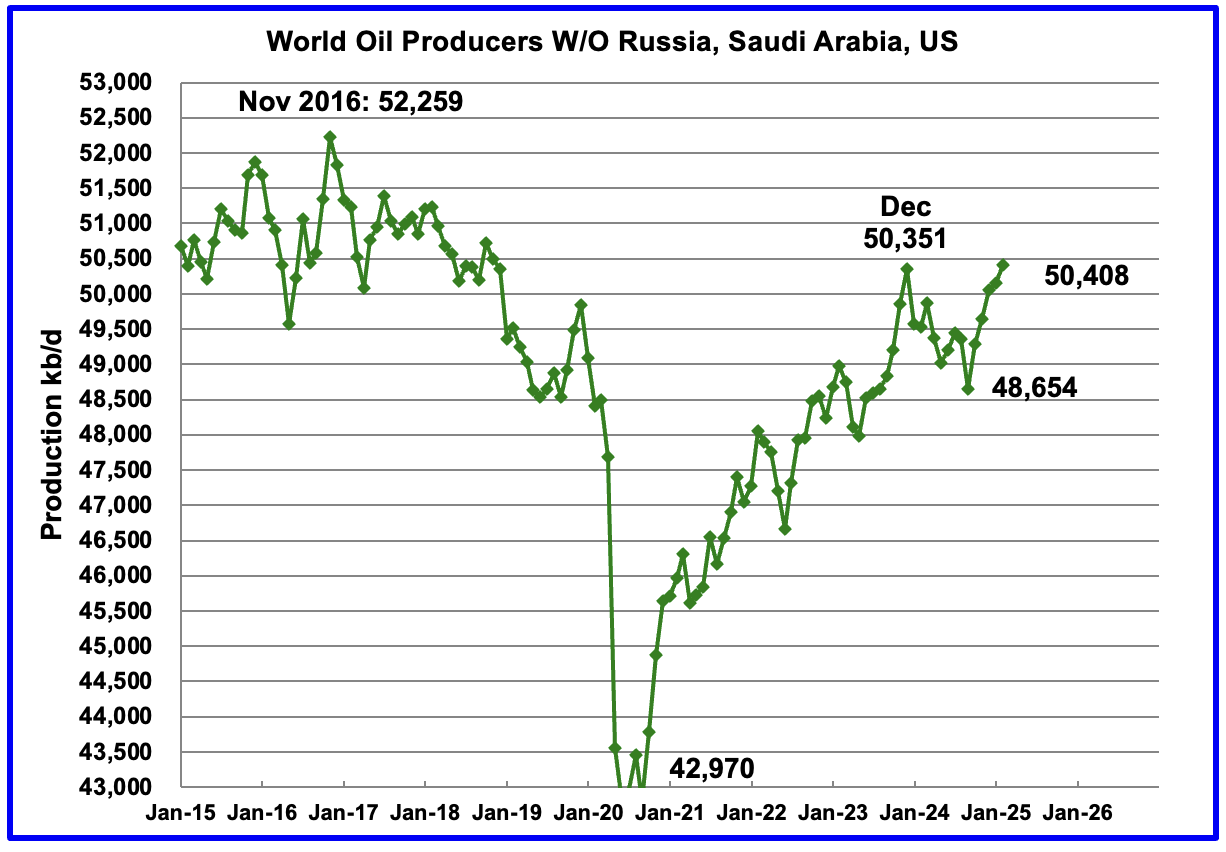
Production in the Remaining countries had been slowly increasing since the September 2020 low of 42,970 kb/d to December 2023. Production has risen for the last five months and output in February increased by 248 kb/d to 50,408 kb/d and is now 57 kb/d higher than December 2023.
Countries Expected to Grow Oil Production
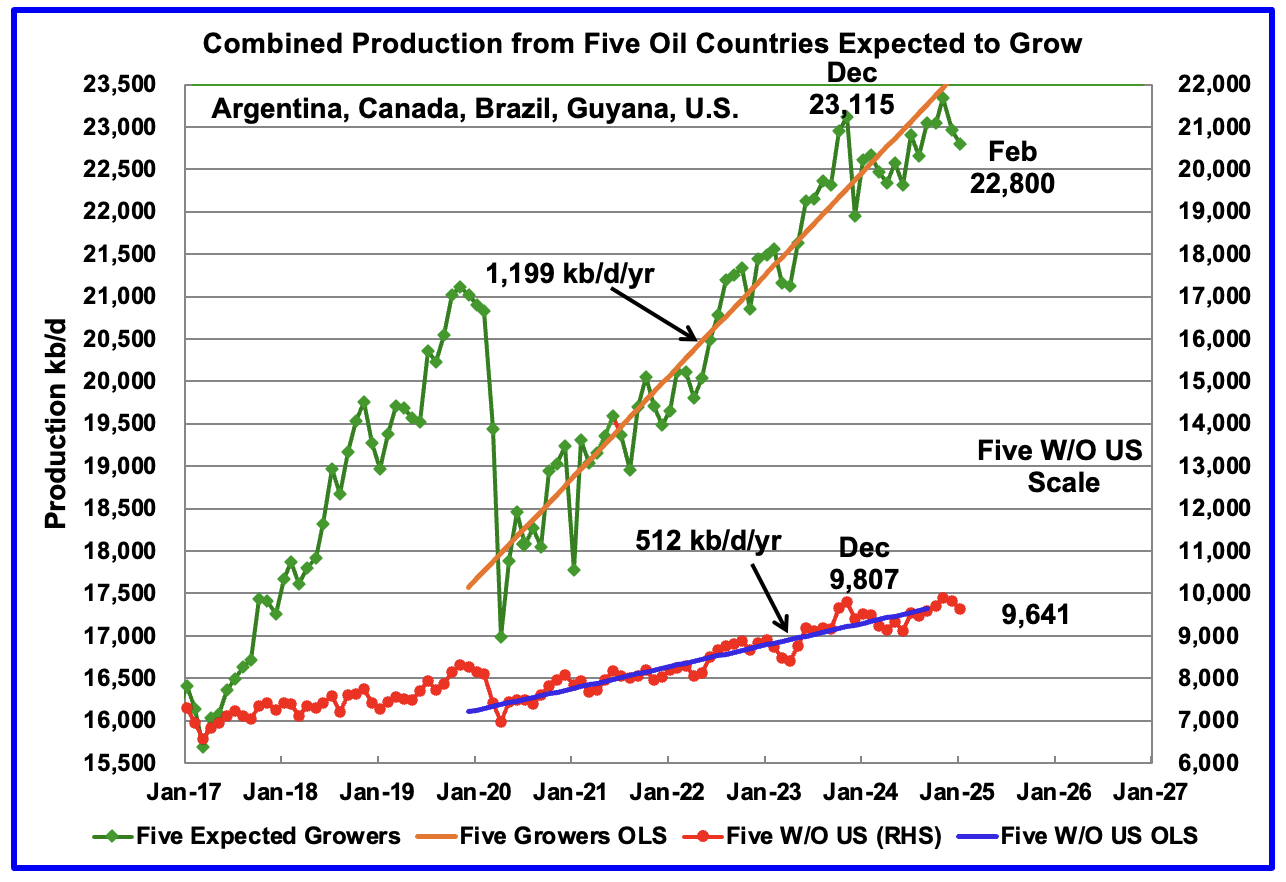
This chart was first posted a few of months back and shows the combined oil production from five Non-OPEC countries, Argentina, Brazil, Canada, Guyana and the U.S., whose oil production is expected to grow. These five countries are often cited by OPEC and the IEA for being capable of meeting the increasing World oil demand for next year. For these five countries, production from April 2020 to August 2024 rose at an average rate of 1,199 kb/d/year as shown by the orange OLS line.
To show the impact of US growth over the past 5 years, U.S. production was removed from the five countries and that graph is shown in red. The production growth slope for the remaining four countries has been reduced by 687 kb/d/yr to 512 kb/d/yr.
February production has been added to the five growers chart, down 163 kb/d kb/d to 22,800 kb/d. For the Five growers W/O U.S. January production dropped to 9,641 kb/d, down 192 kb/d from January 2025 and is 166 kb/d lower than December 2023.
The OLS lines have not been updated and will not be updated going forward unless additional production data provides a strong indication that production is rising/changing.
Production up to December 2023 may be a situation where the past is not a good indicator of the future. In this case it may be more important to focus on what has happened to production after December 2023 rather than before.
Countries Ranked by Oil Production
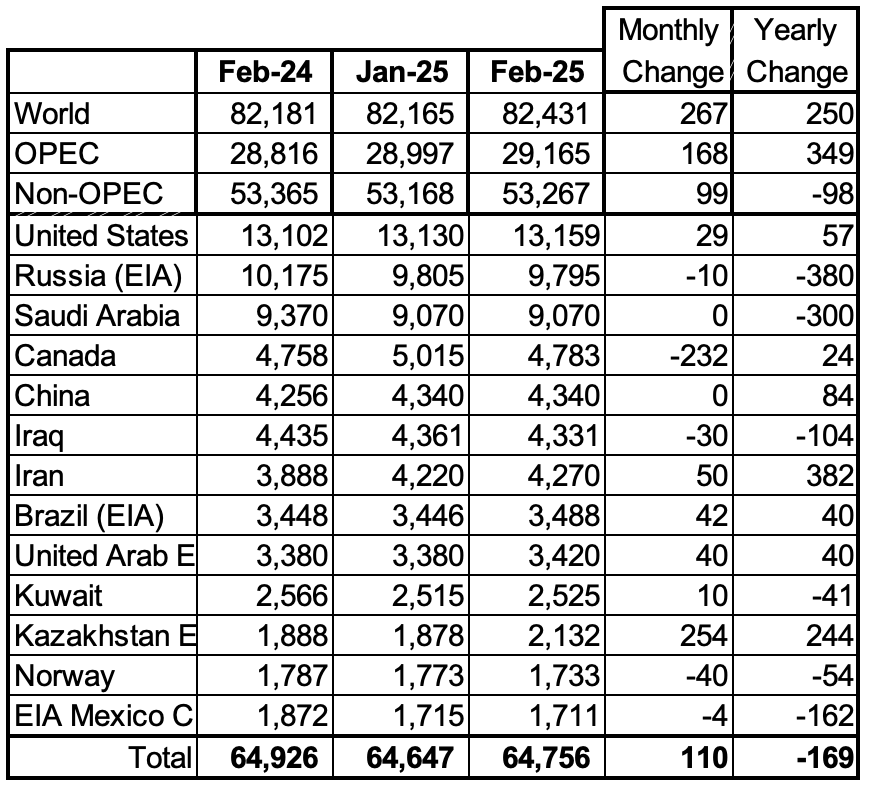
Above are listed the World’s 13th largest oil producing countries. In February 2024, these 13 countries produced 78.6% of the World’s oil. On a MoM basis, production increased by 110 kb/d in these 13 countries while on a YOY basis, production dropped by 169 kb/d.
February Non-OPEC Oil Production Charts
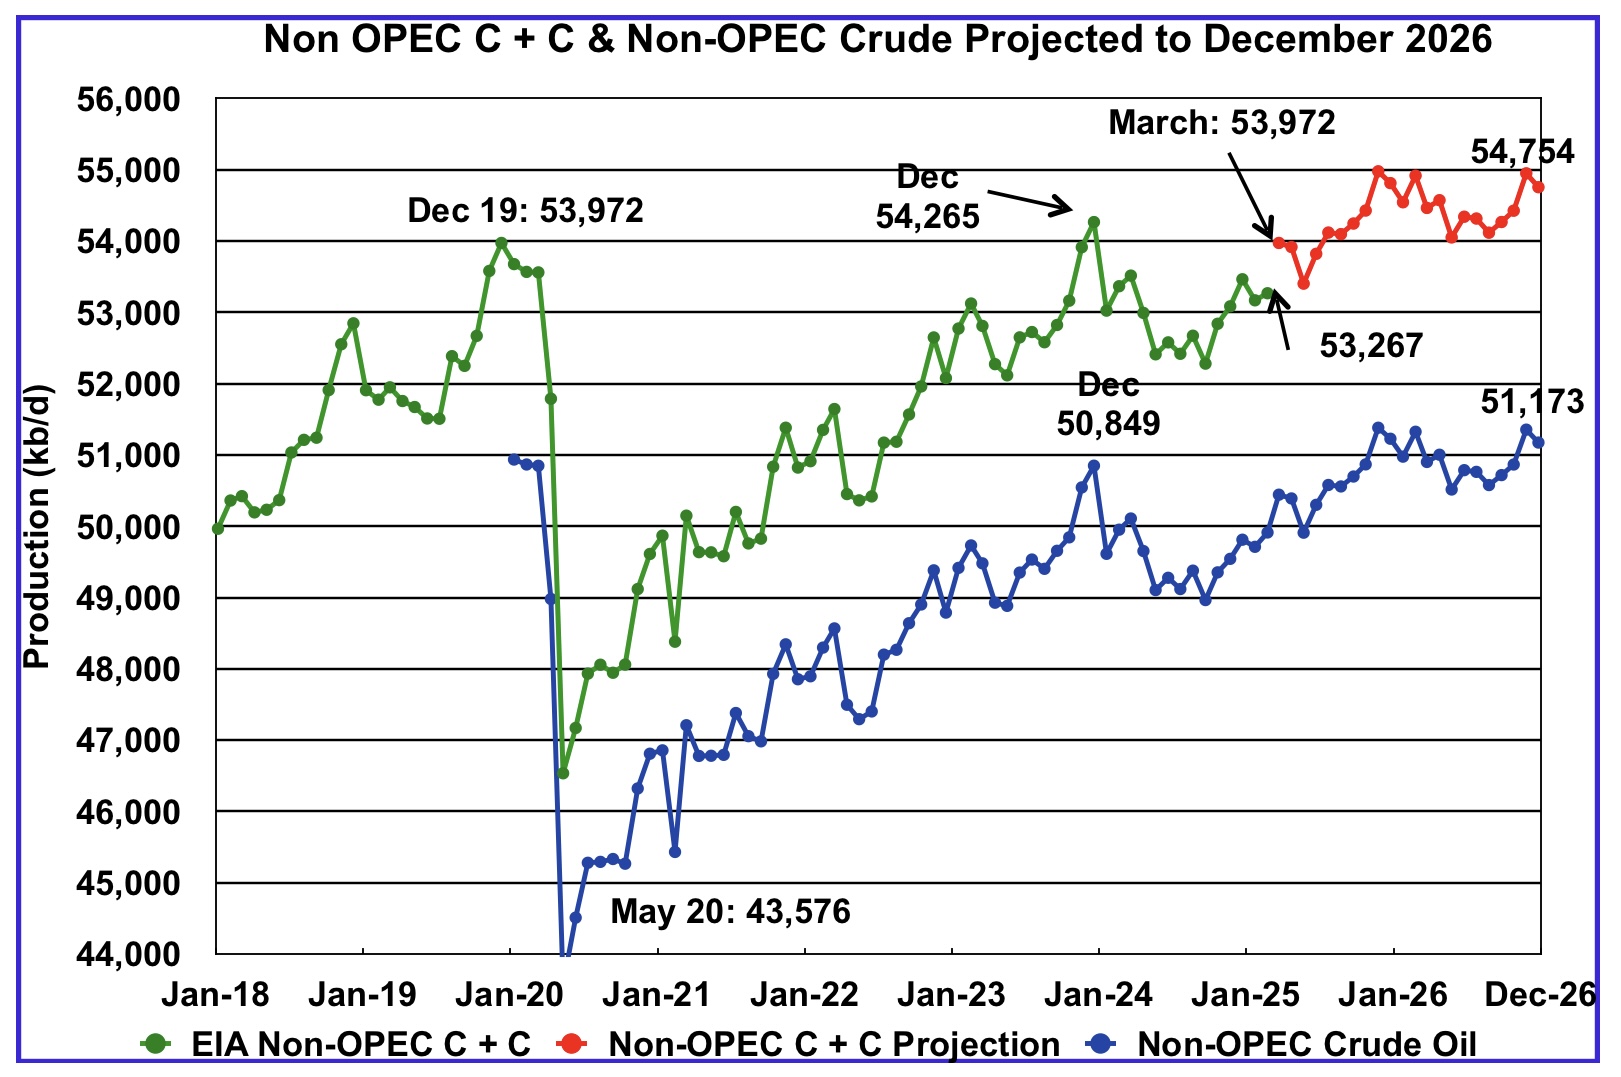
February’s Non-OPEC oil production increased by 99 kb/d to 53,267 kb/d. March is expected to add 705 kb/d to 53,972 kb/d.
Using data from the June 2025 STEO, a projection for Non-OPEC oil output was made for the period February 2025 to December 2026. (Red graph). Output is expected to reach 54,754 kb/d in December 2026.
From March 2025 to December 2026, oil production in Non-OPEC countries is expected to increase by 782 kb/d.
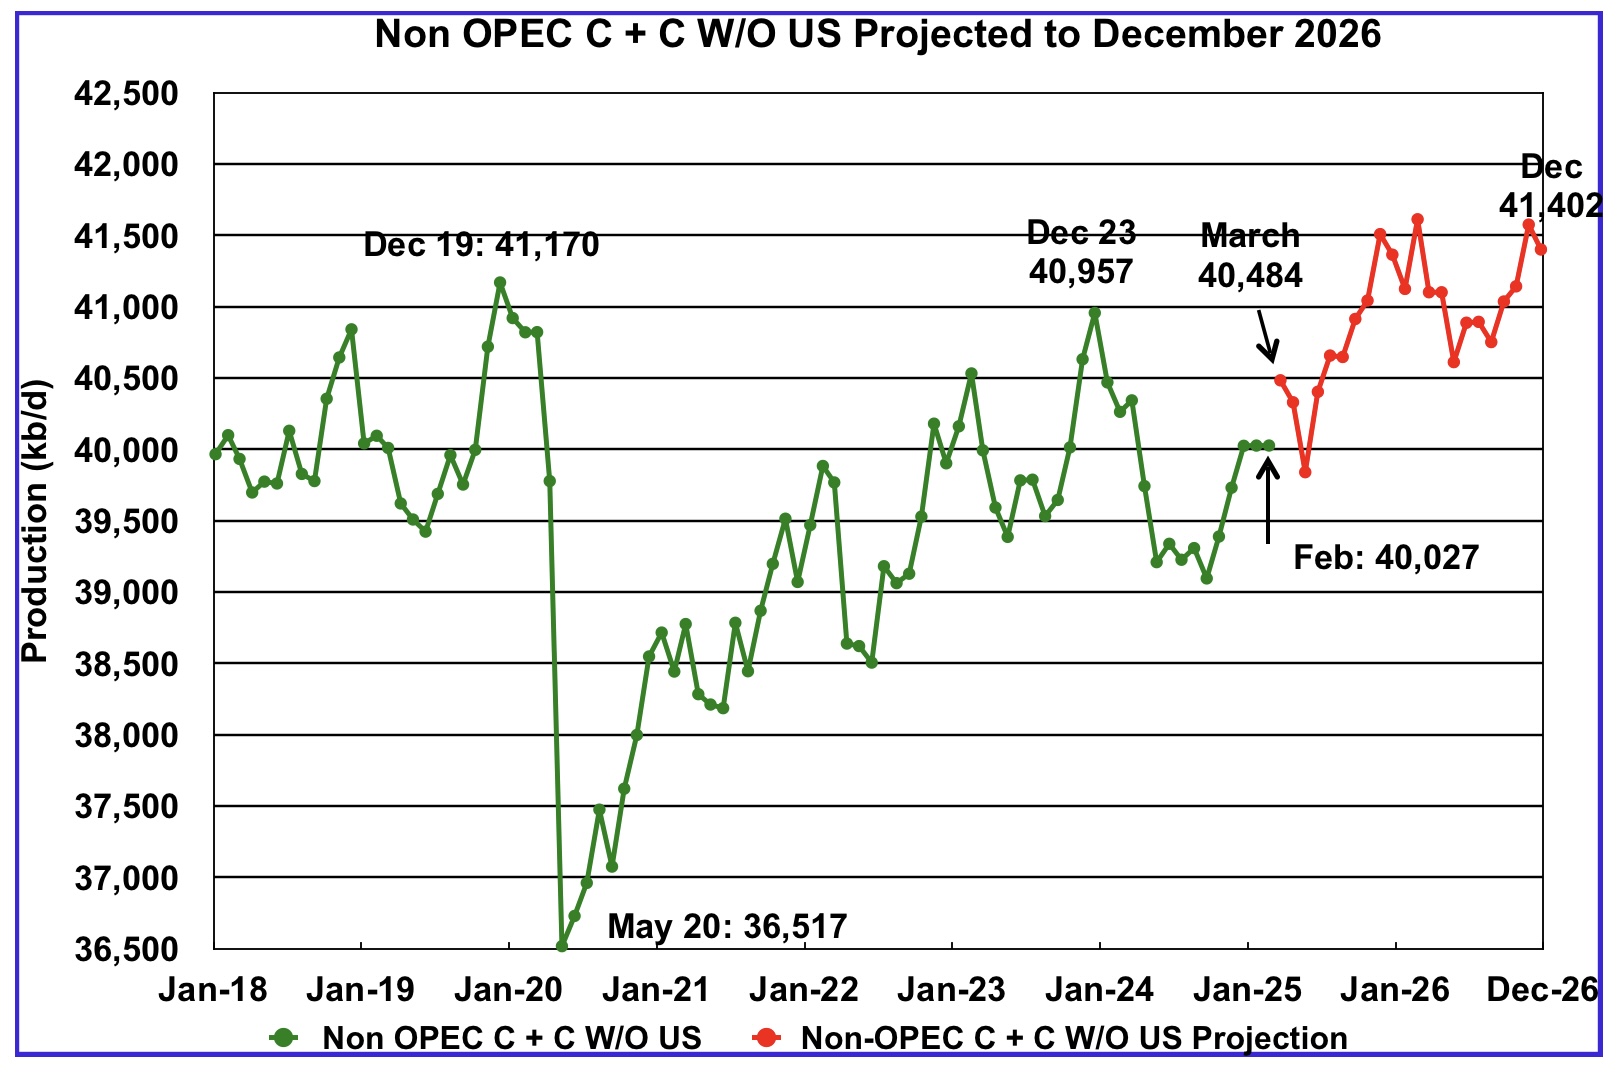
February’s Non-OPEC W/O US oil production was unchanged at 40,027 kb/d. March’s production is projected to rise by 457 kb/d to 40,484 kb/d.
From March 2025 to December 2026, production in Non-OPEC countries W/O the U.S. is expected to increase by 918 kb/d. December 2026 production is projected to be 230 kb/d higher than December 2019, essentially no growth over seven years.
Non-OPEC Oil Countries Ranked by Production
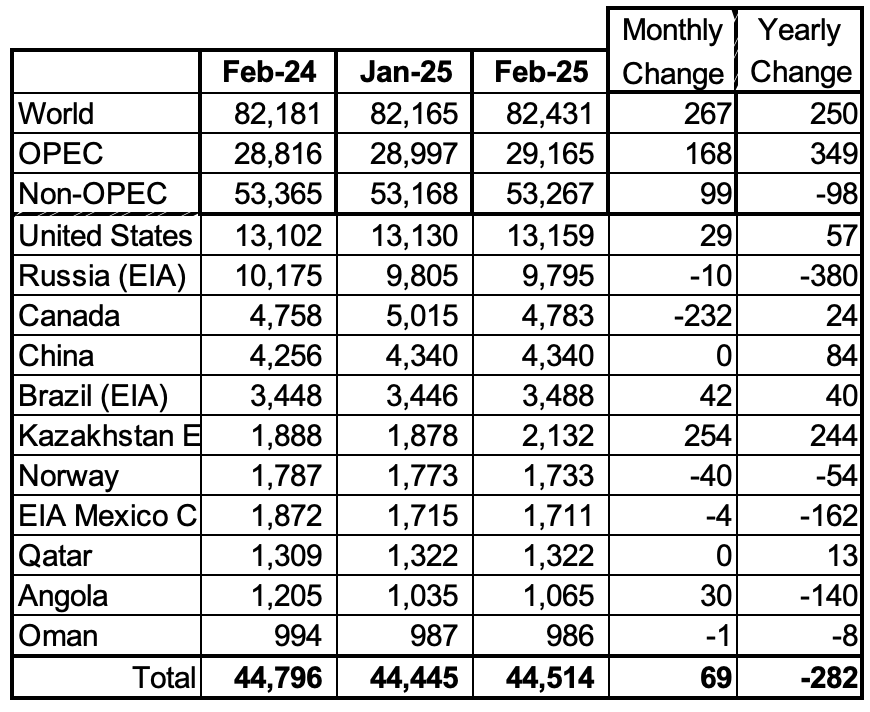
Listed above are the World’s 11 largest Non-OPEC producers. The original criteria for inclusion in the table was that all of the countries produced more than 1,000 kb/d. Oman has recently fallen below 1,000 kb/d.
February’s production increased by 69 kb/d to 44,514kb/d for these eleven Non-OPEC countries while as a whole the Non-OPEC countries saw a yearly production decrease of 98 kb/d to 53,267 kb/d.
In February 2024, these 11 countries produced 83.6% of all Non-OPEC oil.
Non-OPEC Country’s Oil Production Charts
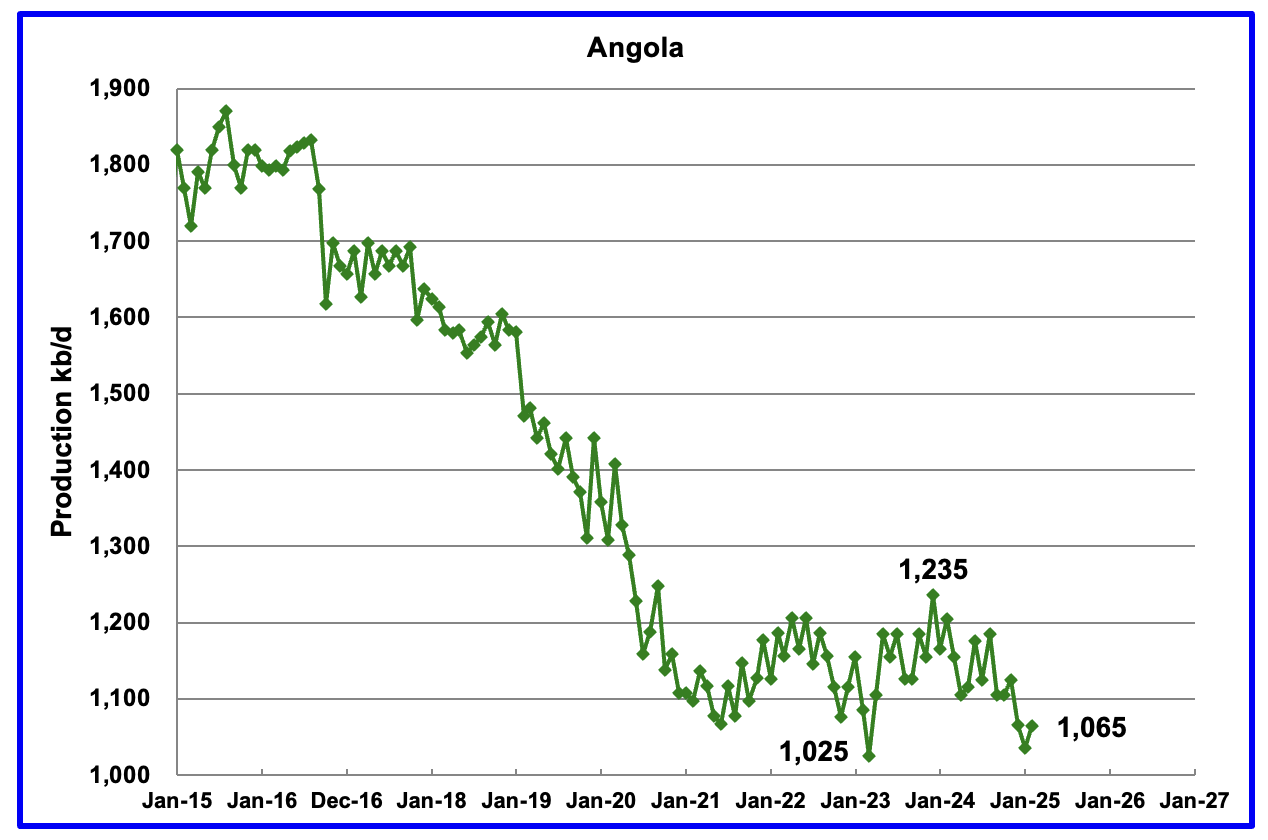
Angola’s February production added 30 kb/d to 1,065 kb/d. Since early 2022 Angola’s production settled into a plateau phase between 1,100 kb/d and 1,200 kb/d. However December to February brought a drop below the lower plateau.
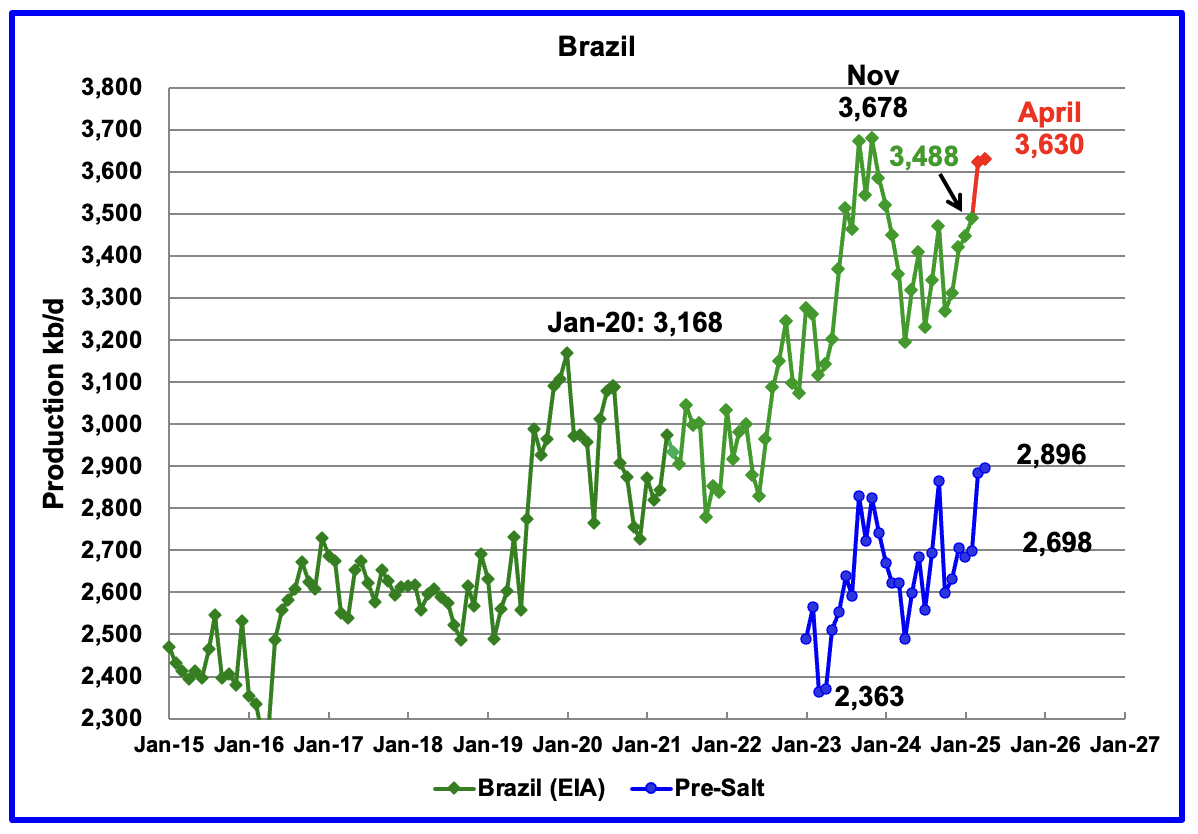
The EIA reported that Brazil’s February production increased by 42 kb/d to 3,488 kb/d.
Brazil’s National Petroleum Association (BNPA) reported that production increased in March and April to 3,630 kb/d. The pre-salt graph tracks Brazil’s trend in the oil graph. For April, pre-salt production increased by 13 kb/d to 2,896 kb/d, a new high.
The February to March increase could be related to the addition of the two new floating platforms. The December OPEC report states that two new floating production storage and offloading (FPSO) platforms came online in November. It also mentions operational issues and slow ramp-ups in several offshore platforms continue to be an issue. Perhaps this explains the delayed March production ramp up.
The April OPEC report states that the March crude increase was “supported by production ramp-ups from recently operated FPSOs.
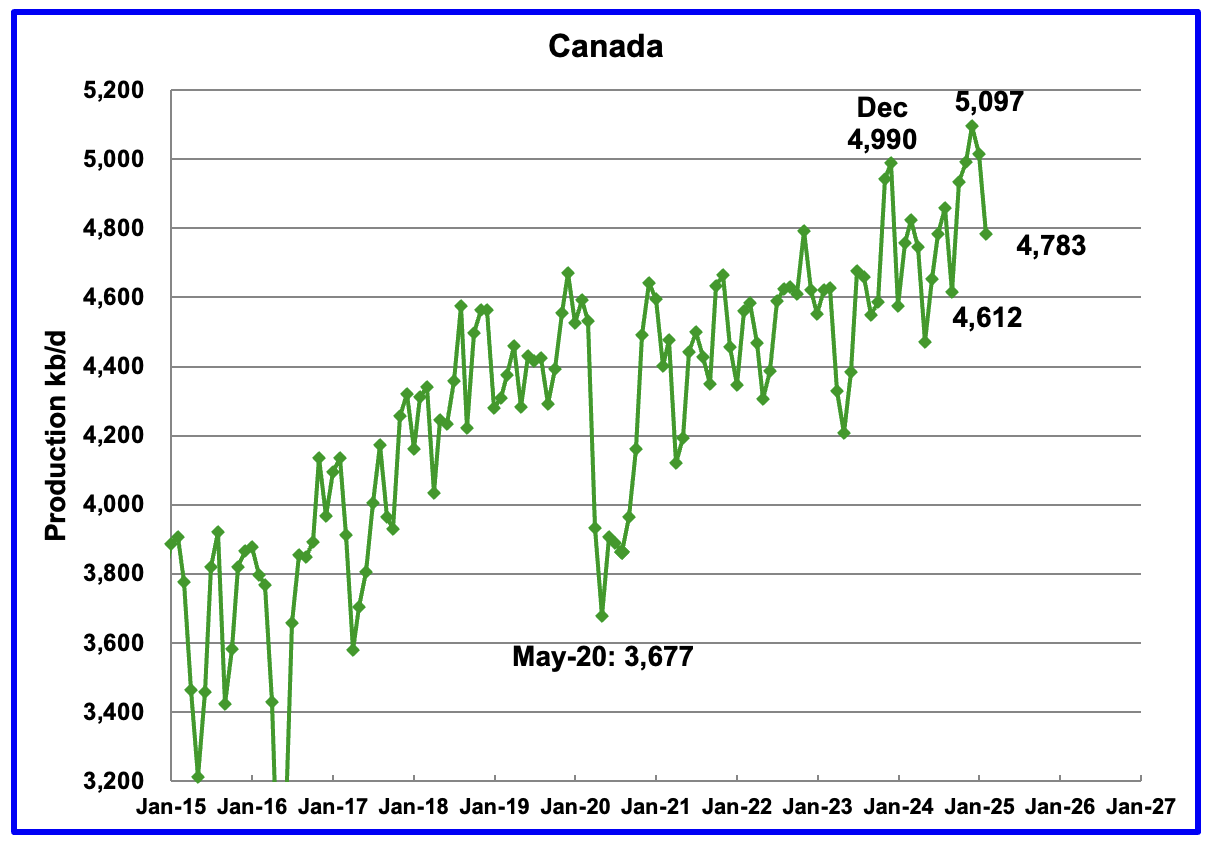
Canada’s production decreased by 232 kb/d in February to 4,783 kb/d after hitting a new high of 5,097 kb/d in January. Oil sands operations in February in the very cold Fort McMurray region are very difficult.
The Alberta premier is asking that the new Prime Minister Carney ease the anti oil sands policies of the previous government. The Alberta premier is asking for another pipeline to the west coast. However according to this Article the BC premier is not supportive of the plan.
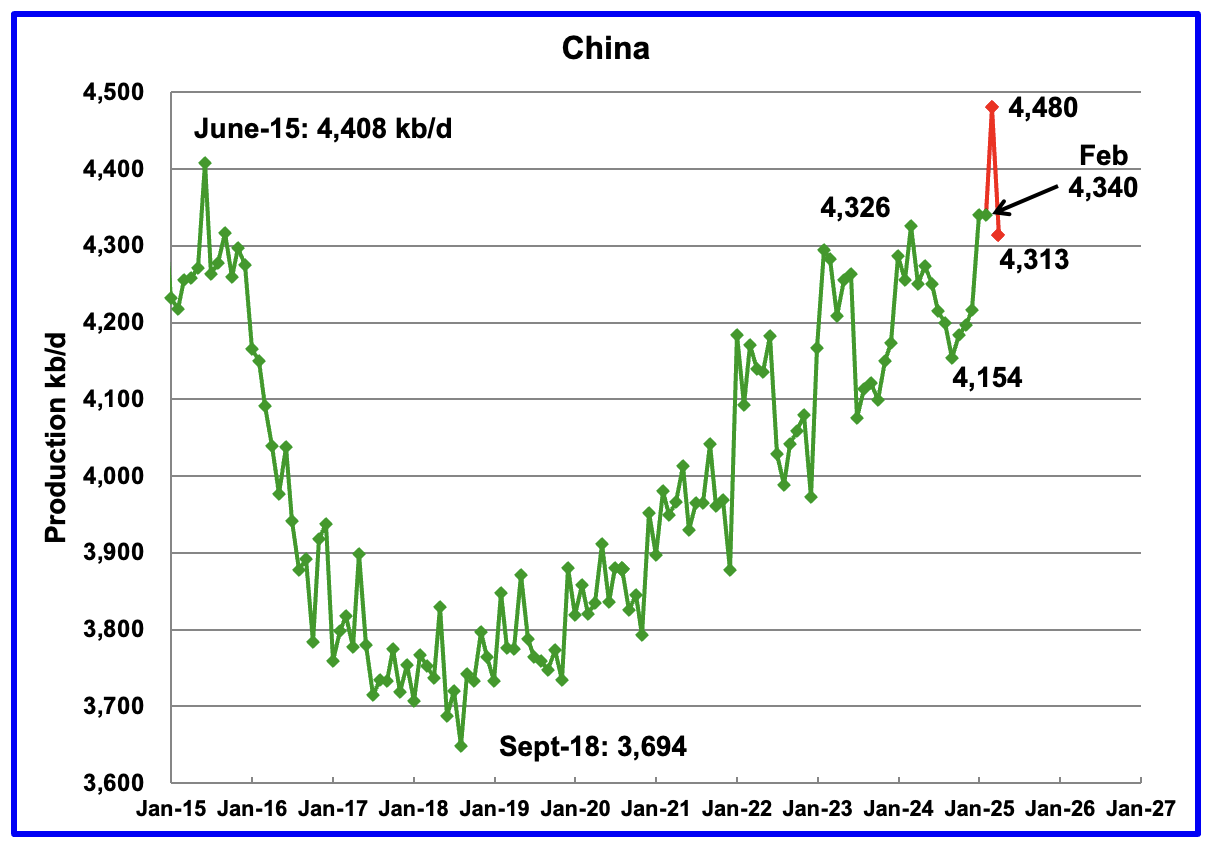
The EIA reported China’s February oil output was unchanged 4,340 kb/d.
The China National Bureau of Statistics reported production for March and April. The Bureau reported that March oil production surged to a new high of 4,480 kb/d before falling in April back to 4,313 kb/d. Previous highs have not seen such a huge drop the following month.
On a YoY basis, China’s February production increased by 84 kb/d from 4,256 kb/d.
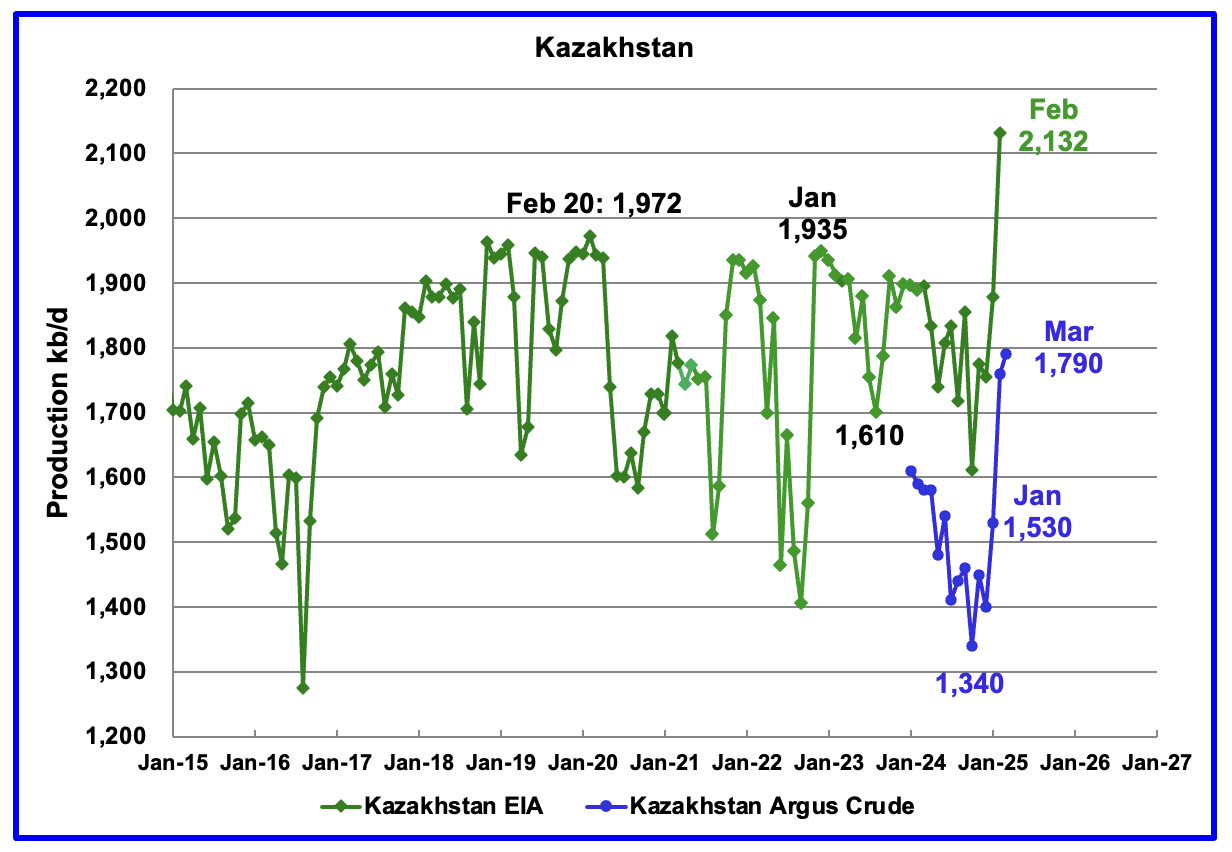
According to the EIA, Kazakhstan’s oil output increased by 254 kb/d in February to 2,132 kb/d, a new record high.
Kazakhstan’s recent pre-salt crude oil production, as reported by Argus, has been added to the chart. In October pre-salt crude production dropped by 120 kb/d to a low 1,340 kb/d. Since then production has risen by 450 kb/d. February/March production came in at 1,790 kb/d due to a New Field coming online. Note this is crude whereas the EIA’s numbers are C + C.
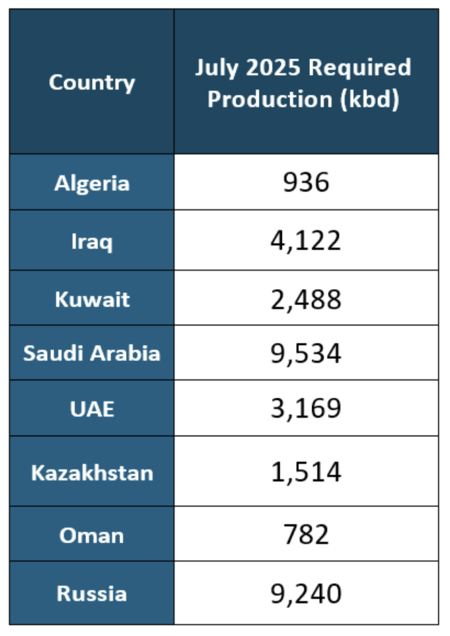
Kazakhstan’s July OPEC crude production target is 1,514 kb/d. At 1,790 kb/d, Kazakhstan is 276 kb/d over their target. According to this Article, Kazakhstan says it has no plans to cut oil production this month (May) after massively exceeding its Opec+ target in March.
Since Kazakhstan’s reduction promises have not materialized, OPEC announced it would “accelerate plans to revive halted supplies in May/June/July, with an increase triple the size originally scheduled of 411 kb/d in each of May/June/July”.
OPEC is trying to send a message to Kazakhstan to comply with its production target, but they are not listening.
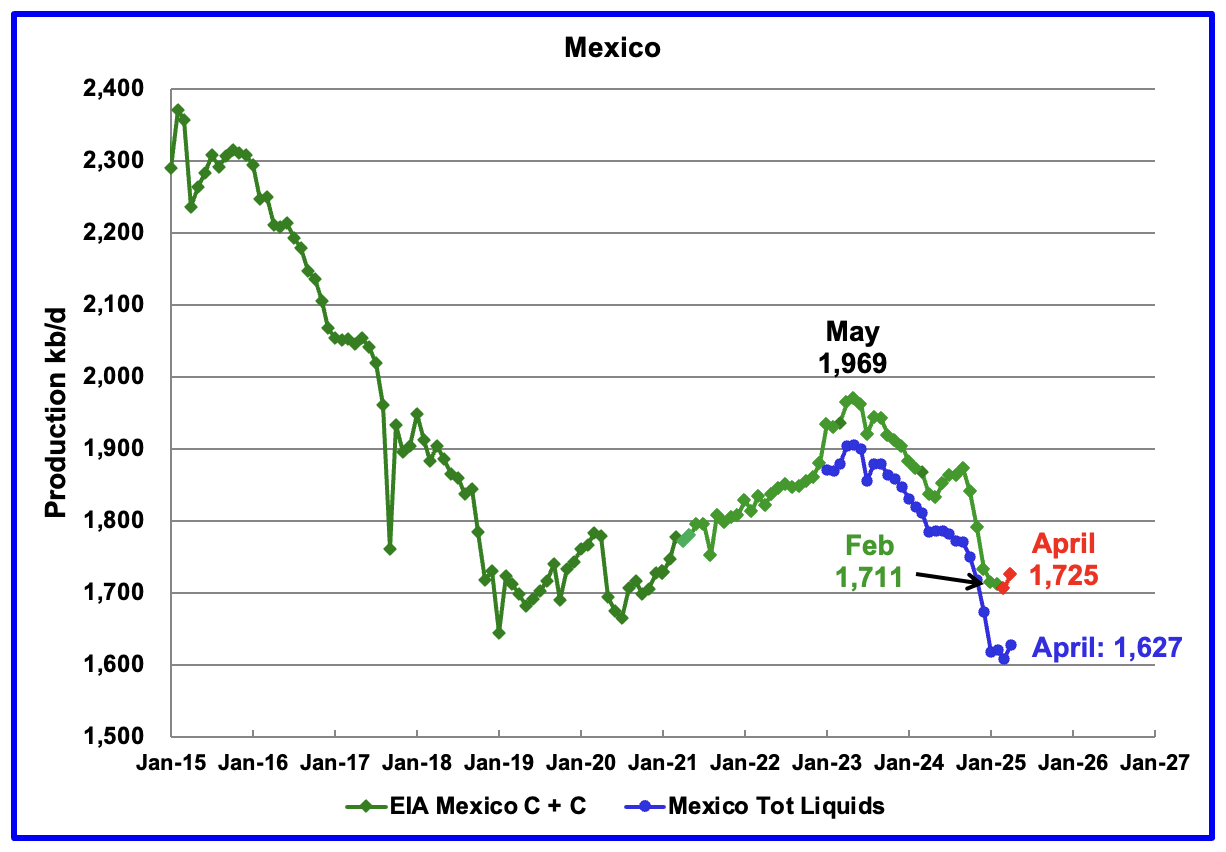
According to the EIA, Mexico’s February output dropped by 4 kb/d to 1,711 kb/d.
In June 2024, Pemex issued a new and modified oil production report for Heavy, Light and Extra Light oil. It is shown in blue in the chart and it appears that Mexico is not reporting condensate production when compared to the EIA report.
In earlier reports, the EIA would add close to 55 kb/d of condensate to the Pemex report. However for October and November it was increased to 122 kb/d and 117 kb/d respectively. For December, the condensate addition returned close to its original increase of 55 kb/d. The February addition was 98 kb/d.
For March and April production, 98 kb/d have been added to Pemex’s production to estimate Mexico’s March and April C + C production, red markers. Note that Mexico’s production for the last four months has stabilized at slightly more than 1,600 kb/d according to Pemex.
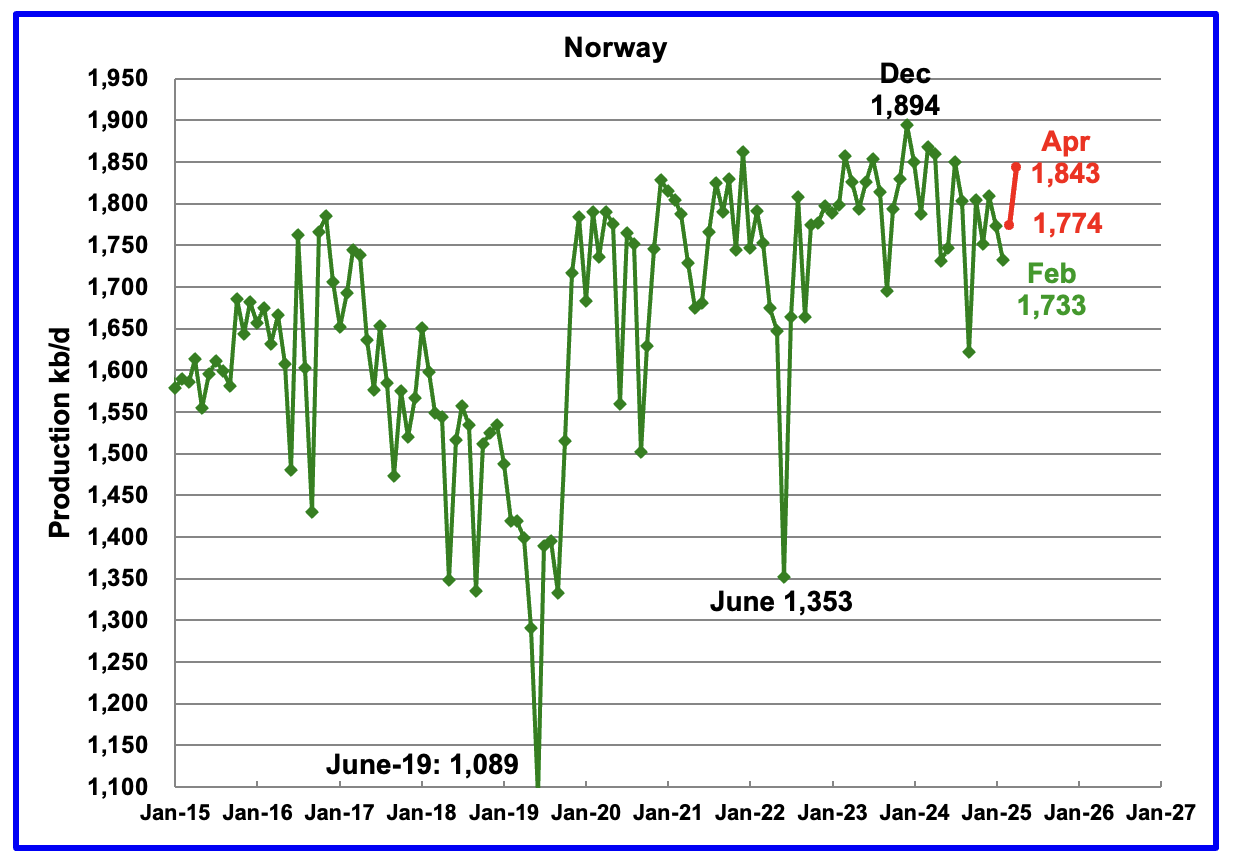
The EIA reported Norway’s February production declined by 40 kb/d to 1,733 kb/d.
Separately, the Norway Petroleum Directorate (NPD) reported that March production rose by 41 kb/d to 1,774 kb/d and April added another 69 kb/d to 1,843 kb/d, red markers.
The Norway Petroleum Directorship reported that April’s oil production was 3.5% above forecast.
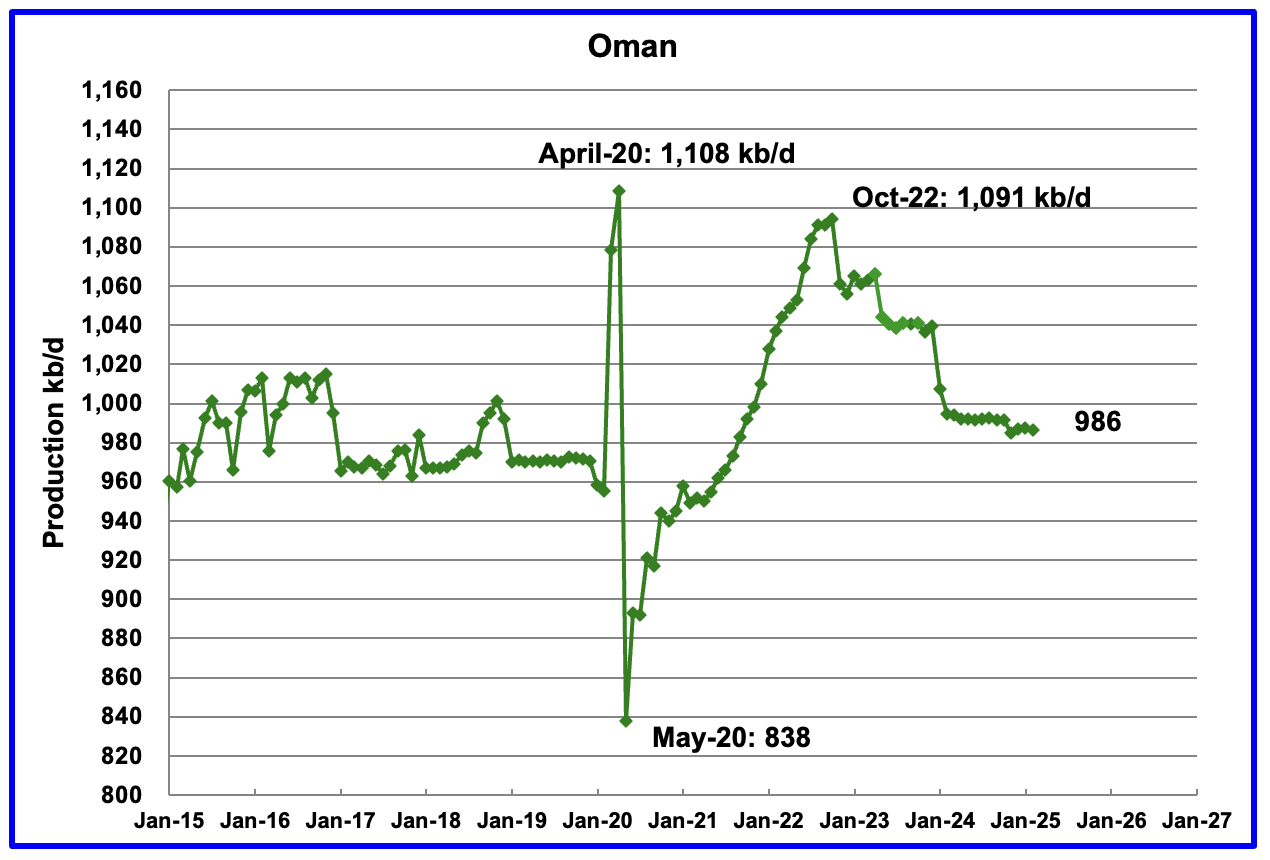
Oman’s production had risen very consistently since the low of May 2020. However production began to drop in November 2022. According to the EIA, February’s output dropped by 1 kb/d to 986 kb/d.
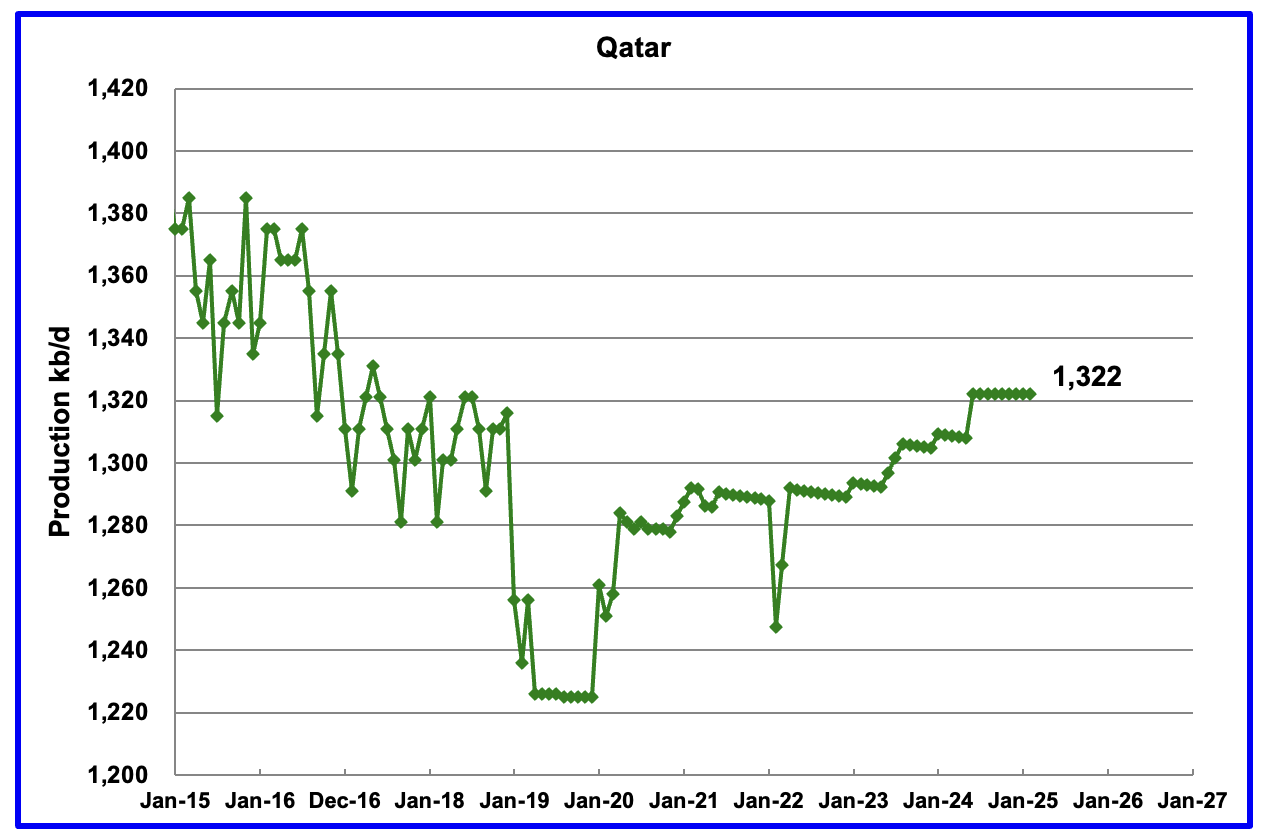
The EIA had been reporting flat output of 1,322 kb/d for Qatar since early 2022. However the EIA revised down all of the previous production data up to April 2024. May 2024 production reverted to 1,322 kb/d. Qatar’s February output was reported again to be 1,322 kb/d.

The EIA reported Russia’s February C + C production dropped by 10 kb/d 9,795 kb/d and was down 465 kb/d from March 2024.
Using data from Argus Media reports, Russian crude production is shown in the blue graph. For March 2025, Argus reported Russian crude production was 8,970 kb/d. Adding 8% to Argus’ March crude production provides a C + C production estimate of 9,688 kb/d for Russia, which is a proxy for the Pre-War Russian Ministry estimate, red markers.
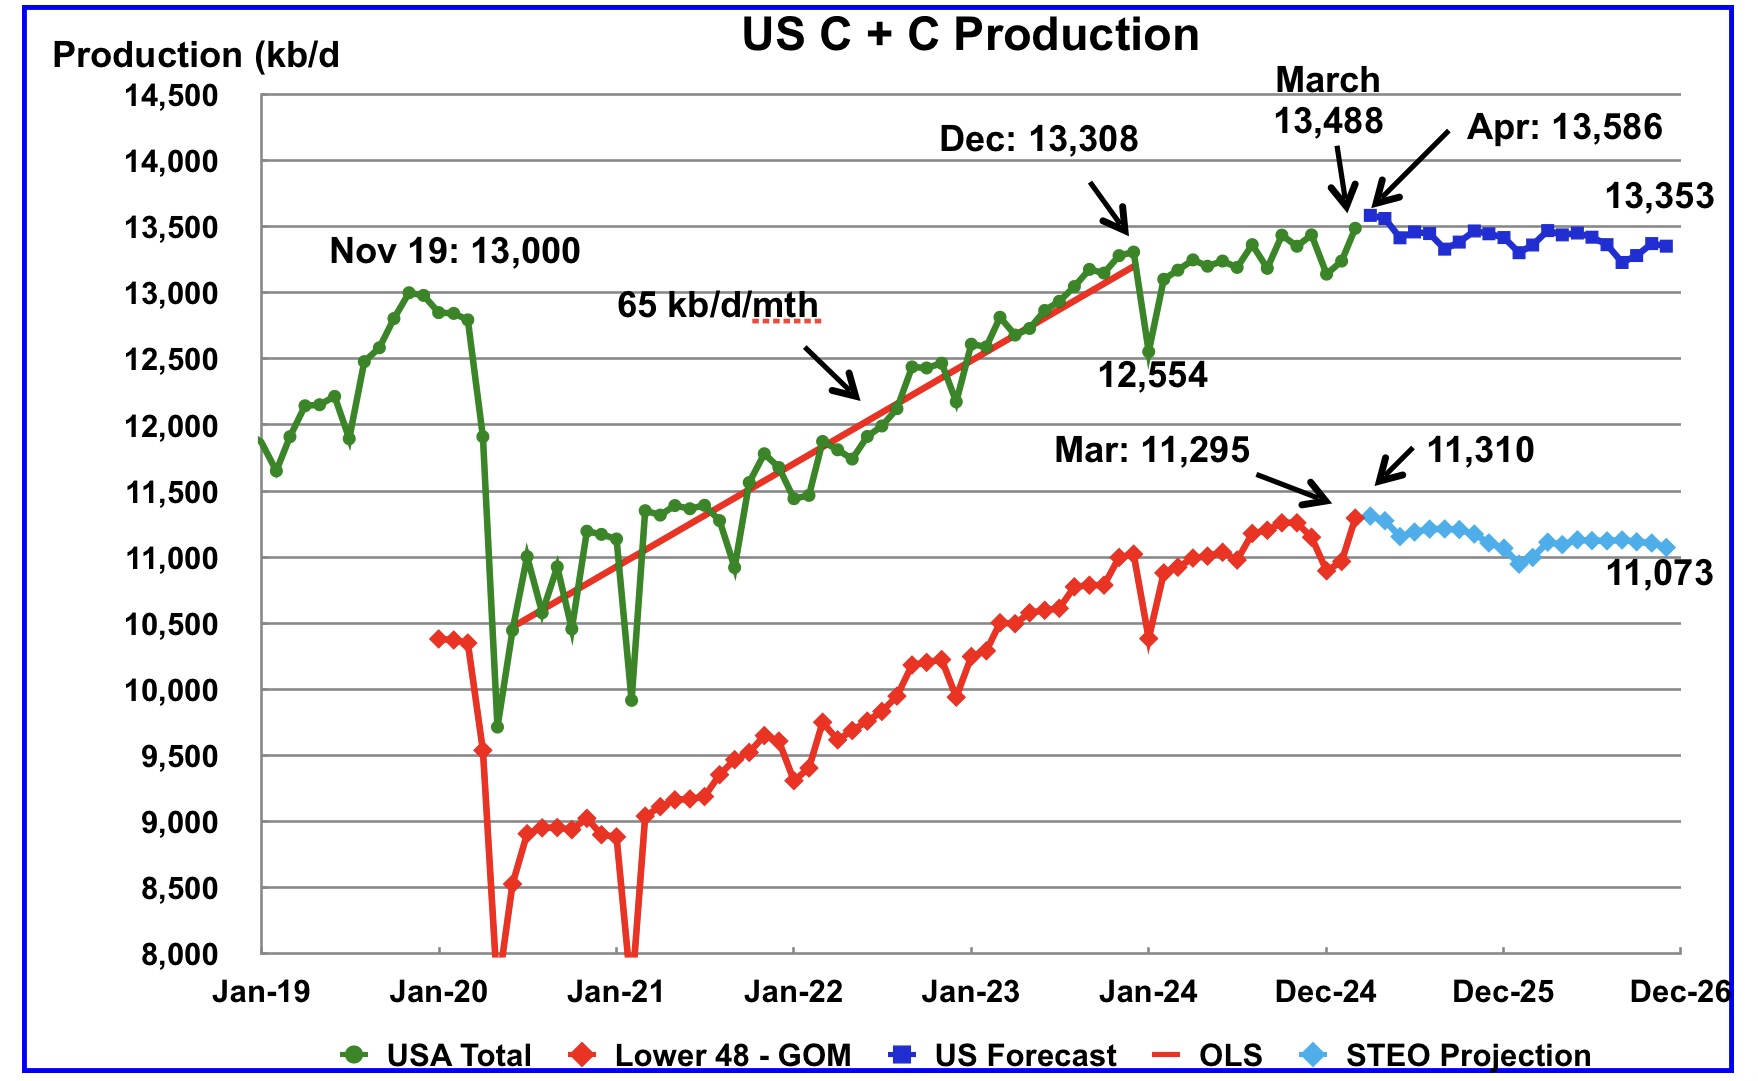
This US production chart is very similar to the one published last week in the US update post. However the STEO portions of the two graphs have been updated using the June 2025 STEO.
Production in December 2026 is expected to 13,353 kb/d. Production starts dropping in May.
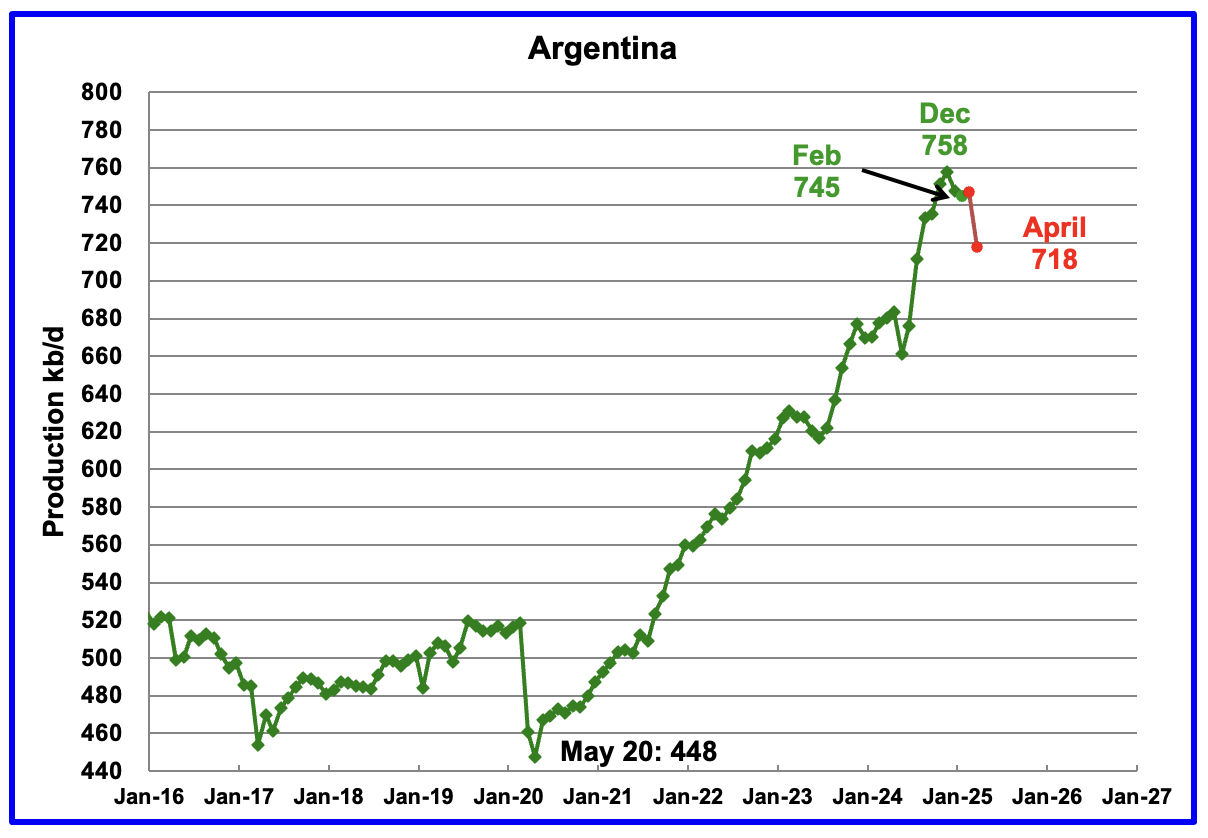
Normally, Argentina’s oil production is not reported because its production is lower than 1,000 kb/d. However production has been steadily rising over the last five years due to the startup of shale oil and gas production in the Vaca Muerta basin.
For February, the EIA reported Argentina’s production dropped by 3 kb/d to 745 kb/d.
The Argentinian Energy Secretariat reported oil production in March rose by 2 kb/d to 747 kb/d and dropped by 29 kb/d to 718 kb/d.
Is Argentina’s production growth about to slow on its way to an expected 1,000 kb/d a few years down the road?
Great job Ovi. Thank you.
The new STEO looks more reasonable, but I think flat output in April and May at roughly the March 2024 level is a bit more likely with the June 2025 to Dec 2026 part of the forecast looking fairly realistic for the oil prices forecast in the STEO.
On Kazakhstan, they could remain a member of OPEC plus like Mexico that does not have an output quota or could choose to leave OPEC plus if they decide being a member has no benefit.
Dennis
Thanks.
Not sure if you are referring to the US or the whole STEO. I agree the US part of the STEO looks more reasonable.
Looking at the World production jump for March, there are sizeable jumps for Kazakhstan, China and Brazil. Canada could rebound in March from its weather related February drop. It could be a one month wonder. The large jump also shows up in thec rude chart.
As for Kazakhstan, one has to wonder why they joined OPEC . What benefits do they get by joining.
Ovi,
I was only referring to the projection fro US C plus C, for the World things are less clear.
Israel Attacks Iran… Oil Goes BOOM!
It looks like things are about to get a lot more interesting, above and beyond the Orange Clown Show taking place in DC.
Also… I forgot to mention… Gold also Goes BOOM!
steve
Steve, you have been spot on regarding Gold.
SHALLOW,
I actually thought we would see a bit of a correction in the gold price back in Q3-Q4 2024, but then Trump got elected, and dangled the Tariff issue.
This caused serious havoc in the Gold Futures Market, as Banks that tend to be short due to hedging could suffer 25% losses if Tariffs impacted gold. So, massive Gold Flows from the LBMA and elsewhere into the New York COMEX occurred, driving up the EFP—Exchange For Premium and thus much higher prices.
This Imbalance continues, and now, adding more juicy “War” Geopolitics, we could see much higher Gold prices, and maybe Silver. But at some point, I do think we will see U.S. and global economic weakness Q3-Q4 2025, that could negatively impact the Broader Markets, Energy, and the metals.
But, before then… who the hell knows what is going to happen when we add more WAR fireworks to the Orange Clownshow Uncertainty.
steve
Did Andre The Giant predict an attack on Iran for them trying to assassinate Donald Trump?
Yes, Yes, he did….he did
OVI break out the predictions!