Note: Just as I was finishing this post North Dakota published their production numbers for May 2014. North Dakota production was up over 36,000 barrels per day on 227 new well completions according to The Director’s Cut. I will have a post on all that tomorrow.
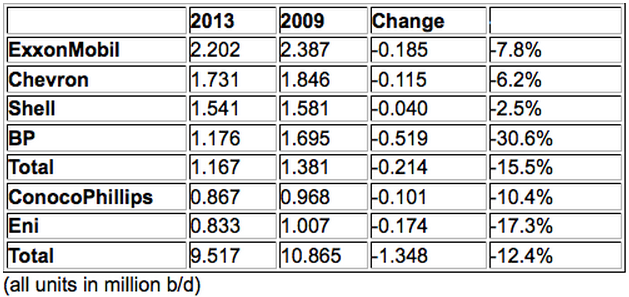
The EIA’s Drilling Productivity Report has just came out. Below are a few charts gleaned from that report. The World’s seven largest publicly owned oil companies have peaked. Their combined production has declined 12.4% since 2009.
The Drilling Productivity Report shows, or tries to show, the true decline rate of shale oil and gas. I usually only track the oil however.
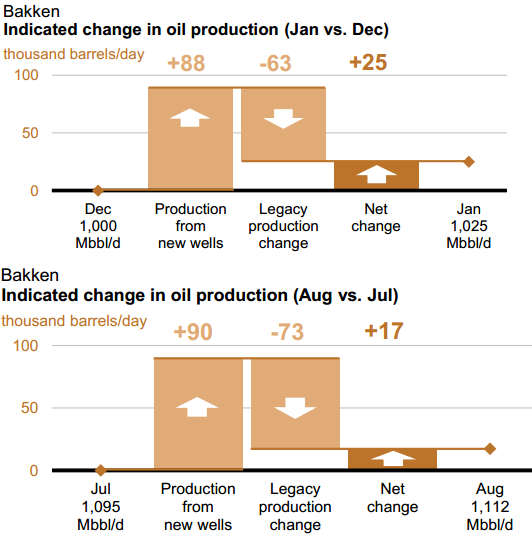
In January the EIA estimated that Bakken production from new wells would equal 88 kb/d. They estimated that the declines of all older wells would equal 63 kb/d leaving net production at 25 kb/d.
In August they estimate that Bakken production from new wells will equal 90 kb/d or 2 kb/d above January new well production. They estimate that the decline from older wells will equal 73 kb/d, an increase of 10 kb/d from January, leaving a net increase in production of 17 kb/d.
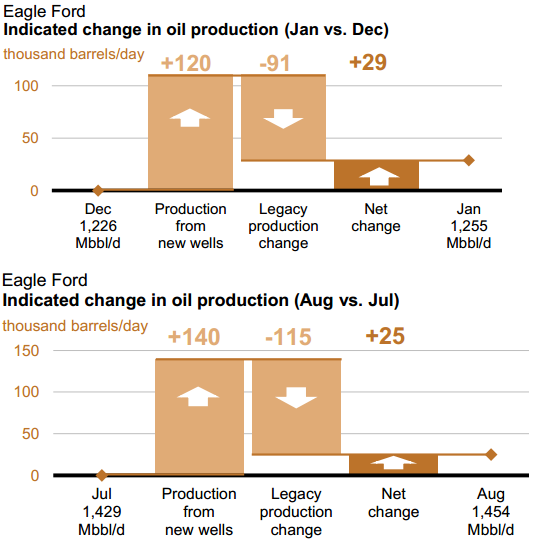
Eagle Ford fared a bit different. In January they thought new well production would increase by 120 kb/d while older wells would decline by 91 kb/d leaving net production 29 kb/d. In August they expect production from new wells will equal 140 kb/d, a whopping 20 kb/d over January numbers. However decline from older wells will have increased to 115 kb/d, 24 kb/d more than it was in January, leaving net production up 25 kb/d. So in spite of the 20 kb/d increase over January new well production, net production will still be 2 kb/d lower than January.
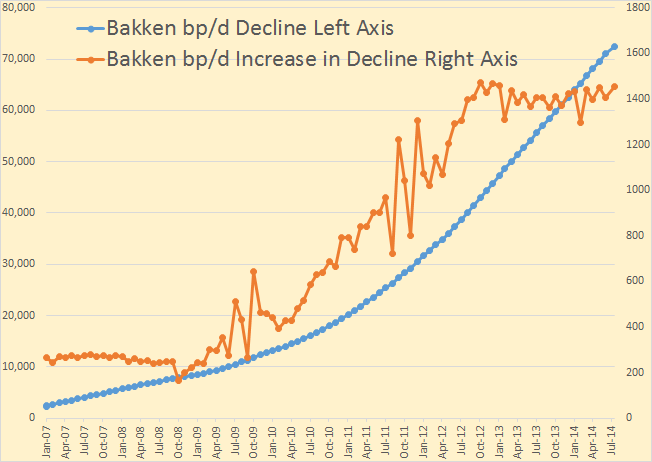
Looking a little closer at the Bakken and Eagle Ford decline and the decline trend
The decline is of course a negative number but I have plotted it here in absolute positive values. The Blue line is the Bakken monthly decline in barrels per day. In August the Bakken old wells declined by just under 73,000 barrels per day and that number is increasing, every month, by just over 1,400 barrels per day.
Eagle Ford oil production is declining at 115,000 barrels per day and that decline rate is increasing by about 2,500 barrels per day every month.
The point of this whole exercise is that the Red Queen is having to run a little faster each month just to keep production level. And in the last few months she has been doing a fairly good job of doing that. But that job will get harder and harder each month.
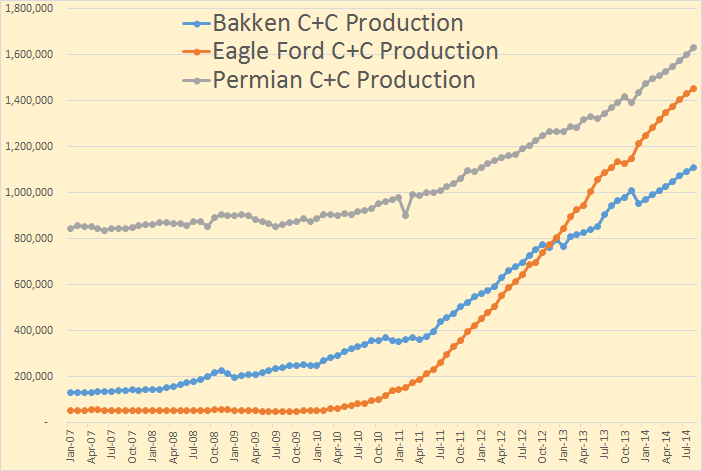
Shale is basically three plays, Baken, Eagle Ford and Permian. Though the Permian is a lot of conventional oil the EIA classifies it all as Shale or Light Tight Oil.
In the Bakken everything after April is just an estimate by the EIA and for Eagle Ford and the Permian the last 12 months they show is an estimate. Their numbers will be revised to the correct number when they finally get the data in.
The seven largest publically owned oil companies have all peaked. Their combined production is down 1.248 million barrels per day or 12.4% in the four years from 2009 to 2013. That’s a decline of 3.1% per year. BP seems to have suffered the most, down 30.6%.

Wow, Holy platforms Robin, BP flow rates 2009-2013 down 30%+ A quad hammer, North Sea, MENA, Russia & GOM (?) Beyond Oil?
For those interested,
Article from ZeroHedge about BP’s oil estimates:
http://www.zerohedge.com/news/2014-07-14/bps-latest-estimate-says-worlds-oil-will-last-533-years
BP is claiming the world has 53.3 years to transition off Oil.
At current rate of extraction, which is geologically not possible…
So if I look closer to the trend, Shale Oil will peak early in 2015…
Hi Ron
Super stuff – can I ask, is that table at the end of your own summation (I assume it is) or is it from another piece? It is a cracking summary.
thanks
Naw, it’s not my doing. I got it from here:
3 Russian Energy Majors Bucking The Declining Production Trend.
I should have put the link in the post but just overlooked it.
seekingalpha got it from Platts: (so no need to register on seekingalpha)
table
http://www.platts.com/news-feature/2014/oil/western-oil-production/western-oil-production
text – from Feb 14, 2014
http://www.platts.com/news-feature/2014/oil/western-oil-production/index
Also from Platts, on their “The Barrel Blog” – the Delaware Basin (part of the Permian).
http://blogs.platts.com/2014/07/14/oil-delaware-basin/
I find it interesting that the pipeline company can’t find enough customers to sign up to justify building a pipeline. Would this infer that there’s just not that much (more) oil to be had there – over a significant enough time period? Perhaps the existing pipelines that used to flow entirely conventional oil can handle (most all) of the new LTO? Hmmm – would this infer that dreams of enough new production to enable oil independence and exporting oil form the US are just daydreams?
BP is claiming the world has 53.3 years to transition off Oil.
Is that the same BP that had a 30.6% decline in production over 5 years? If the world has 53.3 years of reserves, I’ll bet BP is not going to be there producing it. They should be honest about it, and state the world has about 2.5 centuries of oil. The problem is – that we can’t get most of it out of the ground at a profit!
Not to nitpick but it is over 4 years. From the end of 2009 to the end of 2013 is only four years.
BP also divested itself of some Russian assets….
I have updated my North Dakota oil production spreadsheet at http://goo.gl/2DyVeV with the latest data. I intend to continue updating the spreadsheet at that link each month after the new data come out.
Yo, Wes guy.
Somewhat intriguing column of daily oil/well. We should probably ignore the pre fracking years.
The year 2011 saw that number/column blast through 60s, 70s and most of 80s bpd.
Been in the 90s for 2 years now. One nudge to 100+ but back to the 90s.
This 2 year time frame is when frack stage count increased and what’s his name shows 60+% and rising of production is coming from wells < 18 months old.
Ain't gonna use the word suspicious, but here's the thing.
We have the sweet spot running out perspective to the downside. We have stage count increases and proppant improvement to the upside in that timeframe. We have the new multi-well pad approach to the upside. We won't see any impact from the gas disposal reqmt for drilling permits for a few months so ignore that. But we have rather a lot of other factors in play upward and downwards — but that column is in the 90s for 2 years.
Thanks Wes,
Using Data from your spreadsheet I have created a few charts using a logarithmic scale on the vertical axis for Output in b/d. A fast rate of increase from 2007 to 2009 (factor of 10 increase in 2 years), then a slower rise from 2009 to 2012 (about a factor of 7 increase over 4 years or about 3 times slower than the earlier period) and slower still in 2013 (where it will take 3 years to double if the average rate of increase from Dec 2012 to May 2014 continues) about 2 times slower than the 2009 to 2012 period.
I forgot the chart to go with the comment above.
Another chart with the trailing 12 month moving average output in barrels per day(b/d) with a log (base 10) scale on the vertical axis. This smooths the seasonal output variations.
Too bad there is no way to get a comment published along with the articles written by the inestimable MR LYNCH at Forbes and other such sites.
I would enjoy seeing him spin this.
”The World’s seven largest publicly owned oil companies have peaked. Their combined production has declined 12.4% since 2009.”
I have published several comments this month at the Forbes site. I believe that I did have to join first. Initially it was quite confusing.
http://www.forbes.com/sites/michaellynch/2014/07/07/peak-oil-4-the-urban-legend-of-inadequate-discoveries/
Hi OFM,
I imagine he would say that most oil is not produced by publicly traded oil companies.
http://www.forbes.com/sites/christopherhelman/2012/07/16/the-worlds-25-biggest-oil-companies/
At article above the largest 25 oil companies are covered. Many of the largest are National Oil Companies.
The 7 largest publicly traded oil companies produced only 9.5 Mb/d in 2013 of 76.5 Mb/d of World C+C output or about 12.4%, these companies are not nearly as important as they once were.
The problem is that the public companies are the only ones who we can be reasonably confident about data from. NOCs are free to lie about anything they want since there is no one to audit anything they say.
I know that and you know that and so probably does any body who follows peak oil.
But you can bet your last can of beans that the public has not the slightest clue that about ninety percent of known oil belongs to various governments.
Anon is dead on in saying that we cannot trust govt claims about reserves.
The implications of this decline in production among the biggest privately owned oil companies should be staggering to any individual trained in business management but not especially conversant about peak oil.
I can hardly imagine any better indication- in business terms- that the world is in big trouble as far as oil is concerned .The name of the game after all is perpetual growth or death in the business world.
Any body with an MBA who is not stopped in his tracks by the implications of this decline must have gotten that MBA off the back of a pack of matches.
Any country that exports significant amounts could hold the world hostage to extortion these days.
Ron, I know it’s a bit wonky, but I would love to see the production charts graphed with a log normal transformation for production — that would better show the change in the rate of production. Don’t expect it, but would find it interesting.
You mean something like the below. I would not have a clue as to how to do that with the data I can glean from the net. And if I did I would not know what the hell I was looking at.
No, I mean that instead of using bpd on the Y axis, you use log(bpd). This makes increments represent equal percentage increases rather than equal nominal increases. It turns an exponential curve into a straight line. And it turns straight lines into sloping curves. It’s particularly useful when viewing a stock price chart because a change from 50 to 100 will look the same as a change from 100 to 200.
Hi Calhoun,
Are you just looking for a semi-log plot so we can see if the production is growing exponentially (it would appear as a straight line on a semi-log plot.)?
yep, did I get the terminology wrong?
Maybe we will be surprised at how strong the Red Queen’s legs are.
So, if I’m interpreting all this correctly, bakken production is increasing at a decreasing rate, is that right?
Yes, the rate of Bakken increase is slowing as a relatively finite amount of drilling has to overcome ever-rising increases in existing production declines (due to how rapidly and terminally these wells decline).
This so far does not mean the Bakken is declining but it does mean that growth is slowing. It’s no longer a stable or increasing exponential curve.
Eventually – probably some time in 2015 – the Bakken will no longer be physically able to complete new wells fast enough to overcome the bleed from everything they’ve already drilled.
Hi Calhoun,
The plot for the Bakken using a log scale (base10) for output is below. Things have slowed a little since
2012. Note this is data from the EIA’s DPR which is for all of the Bakken (Montana and North Dakota) and the data after Jan 2014 is somewhat suspect in my opinion. NDIC data would look a little different.
I posted some other charts (semi-log) using Wes’s NDIC data (thank you Wes) up thread under Wes’s comment.
http://news.nationalgeographic.com/news/energy/2014/07/140710-ss-badger-coal-fired-steamship/
Mac,
My family and I have sailed on the little bit of history called the SS Badger. What a great short cut, rather than spending a day driving around the southern tip of Lake Michigan we pulled up on the Michigan side of the lake after a days drive, we were heading back from Boston. Parked the car at the wharf. Walked onboard, got shown our rooms and slept the night on board. In the morning the crew drove the car onboard, we sat down to a formal breakfast, and watched the crew slip the ropes as we left port. 4 hours latter we arrived in Wisconsin.
A great little side trip, and beats the freeway any day of the week.
“bakken production is increasing at a decreasing rate”
Inferring new drilling sites are moving away from the initial sweet spots?
Not necessarily. As the number of producing wells increases, so will the total decline from one year to the next from existing wells increase.
Running out of sweet spots results in less new production. The point Ron has been making is that what has been driving the change of the trend is the increase in the declines from existing wells. Production could flatten and start falling even before they run out of sweet spots to drill.
Exactly.
The US produced 5.0 mbpd of C+C in 2008. Let’s assume that the decline rate from existing wells in 2008 was 5%/year. So, we needed 250,000 bpd of new production to offset declines. As gross overall production increases, the volumetric decline also increases, but the underlying decline rate is increasing, as an increasing percentage of total production comes from tight/shale plays. If we use a (conservative) assumption that the underlying decline rate from existing wells in 2013 was 10%/year (when production hit 7.4 mbpd), we needed about 740,000 bpd of new production to offset declines. So, based on the foregoing, a 50% increase in production, plus an increase in the underlying decline rate, caused the estimated volumetric decline from existing production to triple, from 250,000 bpd per year to about 740,000 bpd per year.
At a 10%/year decline rate from existing wells, in order to maintain current production for 10 years, 100% of current production has to be replaced in the 10 year period.
Of course, this is why Peaks Happen. It’s when, not if, that production from new wells can no longer offset the declines from existing wells. But that’s also the argument.
Finite Earth Folks assert that the finite sum of discrete sources of oil that peak and decline will also peak and decline, while the Cornucopians assert that the finite sum of discrete sources of oil that peak and decline will show an almost perpetual* increase in production.
And then there is what I call “Net Export Math.”
A Texas RRC Commissioner described oil and gas resources as being “Virtually limitless.”
Ablokeimet Wrote:
“Not necessarily. As the number of producing wells increases, so will the total decline from one year to the next from existing wells increase.”
There are financial issues at play to consider. LTO drillers borrow a lot of money to support drilling operations. For the moment, investors are throwing money at them to drill. If the drillers can no longer show strong growth, its unlikely investor will continue to throw money at them. What happens to drilling if they can no longer borrow more money to drill?
If the average well remains unchanged (sweet spots never run out) the peak won’t arrive for quite a while, this is quite unlikely, somewhere between 10,000 and 15,000 wells we will probably see lower average well output and at that point the peak will arrive.
In the scenario below I assume 160 wells per month are added from May 2014 to Dec 2020 with no decrease in the EUR of the average new well (not a realistic scenario in my opinion).
Above I said,
“somewhere between 10,000 and 15,000 wells we will probably see lower average well output and at that point the peak will arrive.”
This was very poorly written.
To clarify, I mean that when the number of producing wells in the North Dakota Bakken/Three Forks reaches between 10,000 and 15,000 producing wells that the estimated ultimate recovery (EUR) of the average new well is likely to decrease (if it has not already begun), such a decrease in new well EUR is necessary for the peak to arrive before May 2020 if the drilling rate remains at about 1900 new wells completed per year.
Someone on TOD said “BP’s TNK is the Russian subsidiary that the company is selling to pay for the Macondo blowout.” So the -30% in BP’s production is not as bad as it looks. (TOD, March 27, 2013 – 5:23pm)
I should have read your post more carefully before commenting, Ron. The 2009->2013 timeframe has nothing to do with the BP->TNK transaction. Anyway: the above graph shows a peak, and that’s what we are all looking for, isn’t it? 😉
So basically if the producers stopped drilling the Bakken it would be down to a minimal output within two years. Not a reliable source at all. From what I read the saturation point for the ND Bakken is about 36000 wells. Could easily be half of that if the undrilled areas are low producers. If that is the case then drilling could proceed for another three years at the current drilling rate. After that some refracking might occur but production would be downhill.
I noticed that the increase in Bakken decline (a derivative of decline) has no upward slope from the second half of 2012 to the present. Is that only due to the increasing percentage of older wells or are there a lot of closed wells being added in as zero change in decline rate?
My usual shale gas comments:
Hi Allan H,
In almost every oil field in the world if the drilling of new wells were to stop, then output would decline, there may be a few exceptions to this rule, but in most of the mature supergiant fields without new wells being drilled field decline rates would be much higher.
If your point was that much more drilling is required in the LTO plays to keep output from decreasing relative to conventional oil fields, that is undoubtedly correct.
More to the point is the limits of field size and quality will shortly limit drilling at all. The questions of how many wells can be drilled in total and how many wells that will be profitable are the ones that need to be asked now. A drilling time range of three to six more years is not very consoling to those who want fuel 10 to 20 years in the future and the Bakken is only producing 100,000 bpd.
This.
Drilling has real-world physical constraints. Available equipment, weather, good real estate.
well a few things for @Ron Patterson to think about first off there is no such thing as peak oil for a high enough price we can manufacture it in a lab unlimited amounts of it “of course at a net negative eroei”
but the ultimate best way to look at it is whats the maximum price of oil the global economy can support at one time pre 2008 it required oil prices at around 80 or less to keep the economy growing at 3 percent or so
but post 2008 we’ve entered a diffrent phase the economy can grow at 2 percent or so with oil less then say 120 usd thinks partly due to energy efficiency gains
but there comes a point where the price of producing the oil starts to trigger a recession like in 2008
the ultimate unknown in figuring out the global maximum amount of oil production is what price can people handle
also you should have someway for people to email you on this site anyway goodluck
gabriel morrow wrote:
“but there comes a point where the price of producing the oil starts to trigger a recession like in 2008”
The West never left the 2008 recession. Western gov’t printed money (QE) and used other financial gimmicks to mask the recession. There is no real growth. China has a simular fate as it pumped up its credit bubble to the max to sustain growth.
“but the ultimate best way to look at it is whats the maximum price of oil the global economy can support at one time pre 2008”
Probably between $50 and $70 per bbl. Anything higher creates a drag on the economy. The Western economy (US,EU) ended growth in 2007. However the economic growth from 2000 to 2007 was attributed to a credit bubble as Western Central banks lowered interest rates and forced banks to lower lending standards in order to fuel economic growth. The last time there was true economy growth was probably pre-1997. In 1997-1998 Greenspan lowered interest rates so that business could complete their Y2K projects on time. After Y2K greenspan started raise rates again which took the punch bowl away and helped pop the DotCom bubble.
well i agree with you that economic growth has only been because of money printing post 2008
the question then becomes how big can the fed balance sheet become before the cost of growing it becomes so great it destroys the dollar
The money never left the Fed. Printed, handed to Primary Dealers, redeposited at the Fed as Excess Reserves by the PDs.
Excess Reserve growth at the Fed, on which they pay 0.25% interest, has increased an amount only about 200 billion less than the total amount of QE since 2009.
The printed money will cause inflation stuff and BUY GOLD stuff is crazy. That money never got into the economy.
Printed, handed to Primary Dealers, redeposited at the Fed as Excess Reserves by the PDs.
Only a tiny fraction of money is actually printed. It is just a computer entry. And that is how it is transferred also.
Watcher Wrote:
“The money never left the Fed. Printed, handed to Primary Dealers, redeposited at the Fed as Excess Reserves by the PDs…The printed money will cause inflation stuff and BUY GOLD stuff is crazy. ”
The Fed is also keeping interest rates very low. Lower than the real inflation rate. The Low cost interest rate loans are fueling stock buybacks, Subprime auto loans, and even Shale Drilling. The Fed also prints money to allow banks and other lenders to offer low interest rate loans. The Fed also has huge currency swaps which masks how much money enters circulation. The Fed also fuels gov’t spending by purchasing US treasuries which are spent by the gov’t, and this does end up in the economy. The Feds MBS purchase has propped up housing prices and fueled a Hedge Fund buying/borrowing binge to drive up home prices and rents.
The Fed can never normalize interest rates as the US gov’t has borrowed itself into insolvancy. Even at current rates, the Federal gov’t interest payments are about $425 Billion a year. If they normalized the interest payments would easily rise above a $1 Trillion per year.
You can still have Peak Oil with high cost. If existing stuff is declining faster than new, difficult and/or war-torn new stuff can be brought online, the aggregate amount produced *will* drop. And at a certain point of depletion, no realistic amount of technology or effort can extract enough to reverse a decline.
A good example is the North Sea. Two very sophisticated countries with no security issues and production just keeps falling.
And that’s if the tech broadly exists. If something is too expensive to look viable at forecast prices, no one is going to bother with the tech in a capitalist system. Even if Monterrey could produce 1M bpd by 2020 if you started work right now, that won’t do any good if prices that would make it appealing don’t occur before 2018.
Hello everyone,
This month a couple of different teams have published research on carbon based catalysts for the electrolysis of water–see the links below. As I have noted here before, there is a great deal of work being done in this field.
Best,
Tom
http://www.sciencedaily.com/releases/2014/07/140709105014.htm
http://www.sciencedaily.com/releases/2014/07/140714104100.htm
Heads up.
Libya is claiming oil production rise.
There is a sub story in 2 parts. Part 1 is the only thing flowing is oil from the tanks at the ports the rebels agreed to let open. The rebels holding the fields themselves aren’t flowing.
Part 2 is way more interesting. The Libyan government apparently lost their airport in Tripoli over the past 48 hrs. They are asking for international military intervention, despite having not managed a free election in 3 years. It’s not clear who they are asking.
THAT is what is taking oil price down. In keeping with the Watcher Doctrine, price doesn’t matter. If you have to have the oil, it will be secured BY FORCE.
That was true under the Carter Doctine and the Petrodollar. No Petrodollar anymore = not solely our problem anymore.
Notice US lack of involvement in Syria, Iraq, etc., while the Russians and Chinese are heavily involved.
Fed QE was all about preparing the US for much higher priced oil via the end of the Petrodollar, IMO.
US oil and gas production is impossible without either very high priced oil or 0% interest rates. If very high priced oil came first (see summer 2008), the US economy collapses.
So QE keeps rates at 0% so shale resources can be developed/built, along with export infrastructure, etc. Then, when the time is right (QE taper?), the Petrodollar is officially ended…no more US printing IOUs for oil.
Oil moves towards say $200/barrel or more…but unlike what happened in 2008, US economy doesn’t suffer but merely transitions towards energy independence…via a massive reducti0n in demand and an equally massive increase in production.
What massive increase in production? The US is more than 9M bpd short of energy independence at the peak of shale production – and that’s taking the EIA’s 2016 estimated peak, which is…generous. That’s a shortfall close to an entire Saudi Arabia.
The Monterrey Shale (two-thirds of the LTO “reserves”) is a bust. Not technologically feasible and not economical at anything resembling current prices; it’s possible a lot of it has a negative EROEI. So that’s not coming online, if ever, until well after the other shale fields peak. Conventional production has been in decline for decades. Alaska is depleted and Alaska’s NPR turned out to be mostly natural gas, not oil. Whoops.
And that’s just the US trying to be an autarky. We can’t grow if China, India and Europe are suffering massively from their oil supplies plunging.
The US has increased production at the fastest rate (in bpd) in 150 years in the past two years. I am not advocating that its highly sustainable, merely that it has been driven by high oil prices & Fed induced ZIRP.
Give me $250-300/barrel in USD & I will give you a US that is oil independent.
Will this crash the global economy? Only if the USD is still the world’s sole oil currency. See today’s BRICS bank announcement if you think that the USD will forever remain the world’s sole oil currency.
All the world needs to do to find a new Saudi Arabia of supply is get US drivers largely off the roads…they use 8-10% of global supplies.
Give me $250-300/barrel in USD & I will give you a US that is oil independent.
Darn right! That would make gasoline about $10 a gallon. That should drop demand down to about what we are producing in the USA right now.
How do you figure what currency people are using has anything to do with what happens when China and India literally cannot get the oil that they need? These are not mature development countries that can theoretically consume less on some abstract supply-demand idea.
You need to think through the implications of the scenario you’re proposing a bit more.
What currency people use has everything to do with the supply/demand situation in a time of peak oil.
Economic orthodoxy of the past 80 years has been “in an economic crisis, devalue your currency to gain share of the global economy” – ie beggar-thy-neighbor. The fallacy in this thinking is that the resultant rise in price of energy and in particular oil will be met with matching rise in oil supplies.
In peak oil, the price of oil will rise but supplies won’t much. If that’s the case, then beyond a certain point, the economic winners will no longer be those that weaken their currency most, but rather, those that strengthen their currency most relative to oil in order to provide cheaper oil to its citizens than all other.
In plain terms: If you’re a Mideast oil exporter and the BRICS tell you “we’ll pay you for your oil in gold” while the US tells you “we’ll pay you in USD’s of which we are printing $4b more per day”, who would you rather sell your oil to?
If you don’t think this makes sense, then I am pleased to offer you a job in my house as a general servant. The pay is 1 billion dollars per year. The catch is that they are Zimbabwe dollars.