Comments not related to Oil and/or Natural Gas Production in this thread. Thank You.
Category: Uncategorized
OPEC May Production Data
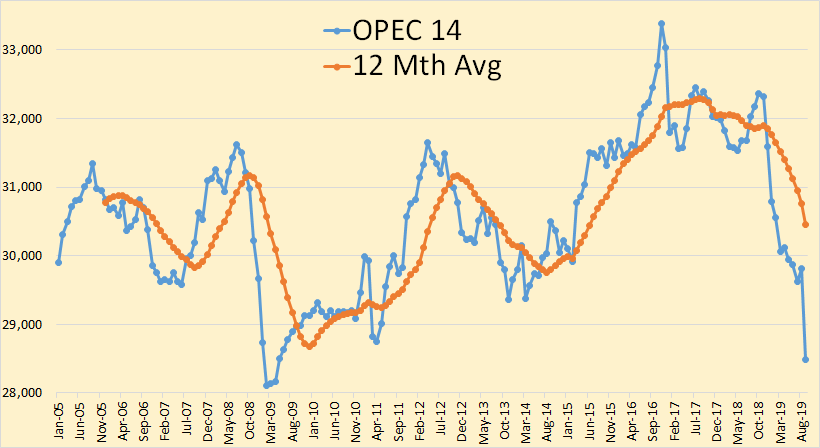
The below charts, unless otherwise noted, were taken from the OPEC Monthly Oil Market Report. The data is through May, 2019 and is in thousand barrels per day.
OPEC crude only production was down 236,000 barrels per day in May but that was after April production had been revised upward by 82,000 bpd.
Iranian April production was revised upward by 43,000 bpd and Saudi Arabia April production was revised upward by 24,000 bpd.
Open Thread Non-Petroleum June14, 2019
Comments not related to oil or natural gas production in this thread.
Oil Shock Model Scenarios
Many different oil shock model scenarios have been presented over time at Peak Oil Barrel. Information on the Oil Shock Model, originally developed by Paul Pukite can be found in Mathematical Geoenergy. The future is unknown, so future extraction rates from conventional (excludes tight oil and extra heavy oil) oil producing reserves are unknown. Also not known are future oil prices which will affect the amount of tight oil and extra heavy oil that is ultimately produced.
For tight oil I have created three scenarios corresponding to a low, medium and high oil price scenario. Likewise I have created three scenarios for extra heavy oil which correspond to the same low to high price scenarios used for the tight oil scenarios.
The mean estimates by the United States Geological Survey (USGS) for technically recoverable resources in tight oil plays combined with reasonable economic assumptions and data gathered from www.shaleprofile.com are used to model tight oil output. The EIA’s AEO 2018 reference oil price scenario is used for the high oil price case and the low scenario uses the AEO reference price case up to the date when it reaches $70/b in 2017$ and assumes oil prices remain at $70/b for all future dates. The medium oil price scenario is the average of the low and high price cases.
World Oil Production, February 2019 Data.
The data for the charts below are from the EIA’s Monthly Energy Review. I will update this post Friday, May 31st with March data for the USA and charts for several states when the EIA’s Petroleum Supply Monthly is published. All data is through February 2019 and is thousand barrels per day.
World C+C production was down only slightly in February, dropping only 87,000 barrels per day to 82,389,000 bpd.
It is my contention that World, less USA peaked in November 2016 with the 12 month average peaking in 2017.