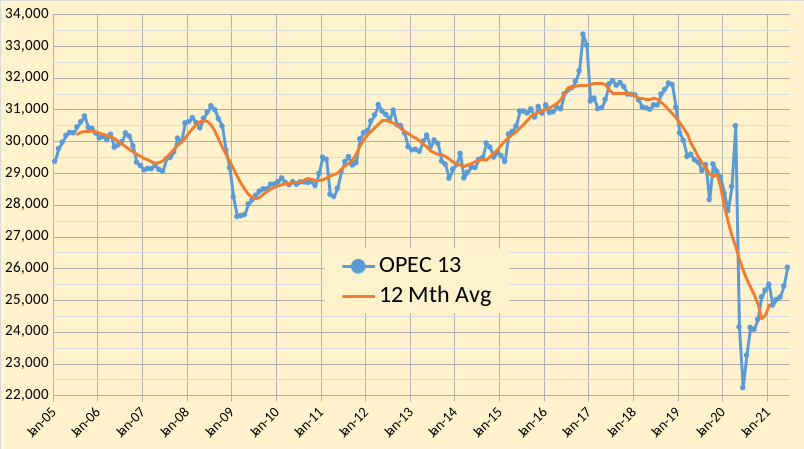
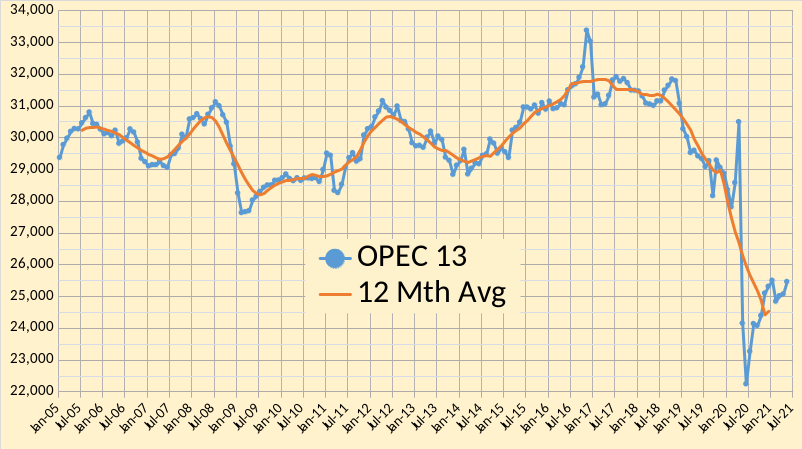
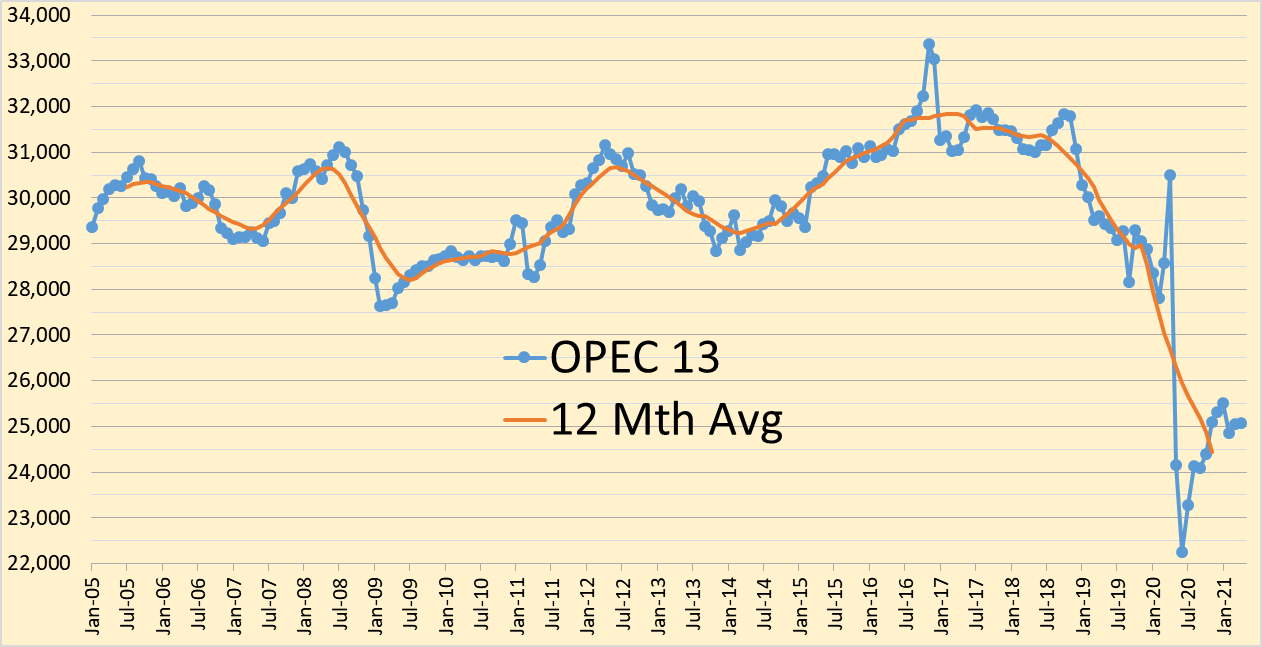
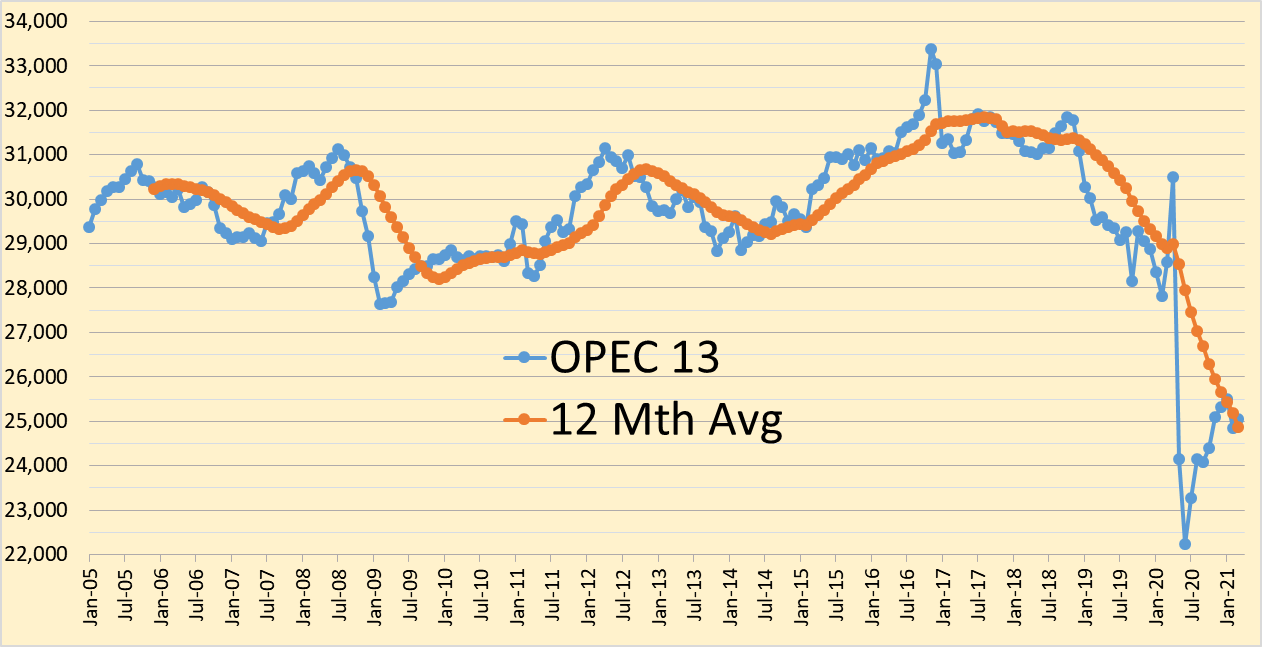
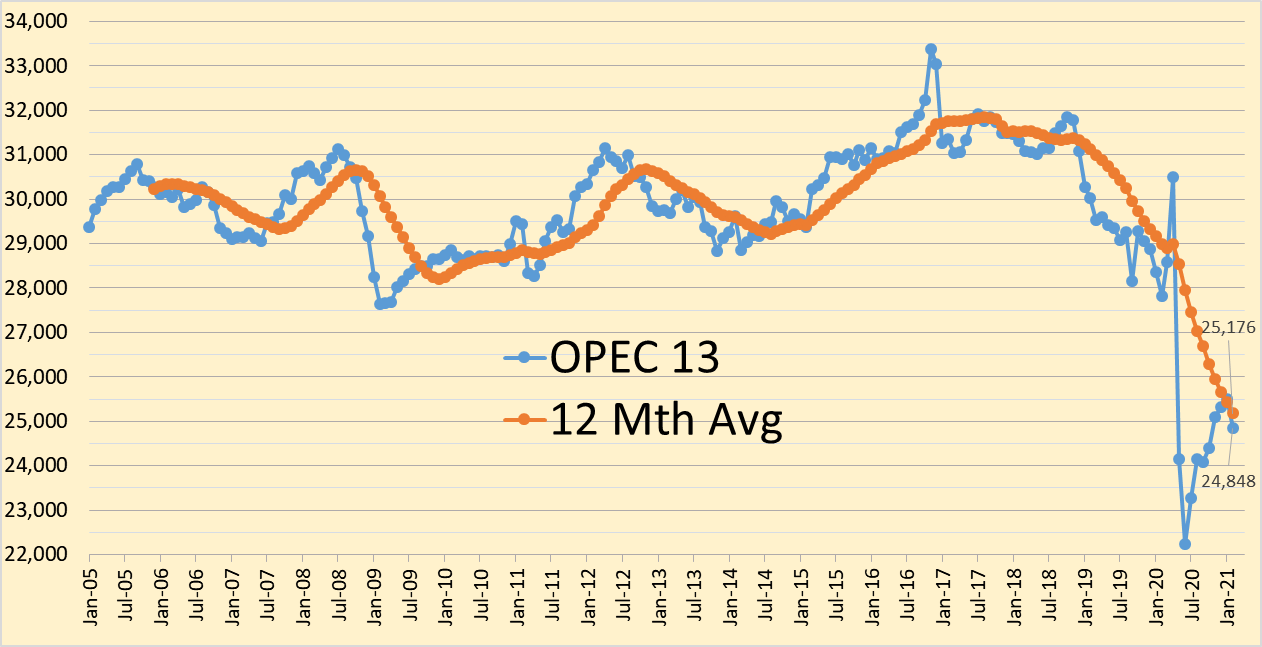
The OPEC Monthly Oil Market Report for April 2021 was published this past week. The last month reported in each of the charts that follow is March 2021 and output reported for OPEC nations is crude oil output in thousands of barrels per day (kb/d).

The OPEC Monthly Oil Market Report for April 2021 was published this past week. The last month reported in each of the charts that follow is March 2021 and output reported for OPEC nations is crude oil output in thousands of barrels per day (kb/d).
The OPEC Monthly Oil Market Report for March 2021 was published this past week. The last month reported in each of the charts that follow is February 2021 and output reported for OPEC nations is crude oil output in thousands of barrels per day (kb/d). The numbers at the left side of the graphs show February 2021 output (and in some cases the trailing 12 month average output).
The OPEC Monthly Oil Market Report for January 2020 was published this past week. The last month reported in each of the charts that follow is January 2021 and output reported for OPEC nations is crude oil output in thousands of barrels per day (kb/d).
OPEC Monthly Oil Market Report for December 2020 was published this week. The last month reported in each of the charts that follow is December 2020 and output reported for OPEC nations is crude oil output in thousands of barrels per day (kb/d).
This update reports data from the Monthly Oil Market Report (MOMR) published by OPEC on December 14, 2020. The latest data point in each chart presented is November 2020 and output is thousands of barrels per day (kb/d).
OPEC output in October was revised 14 kb/d higher than reported in the October MOMR to 24,402 kb/d. November 2020 OPEC output increased by 707 kb/d to 25,109 kb/d.
Read More