November Non-OPEC Oil Production Jumps

A post by Ovi at peakoilbarrel

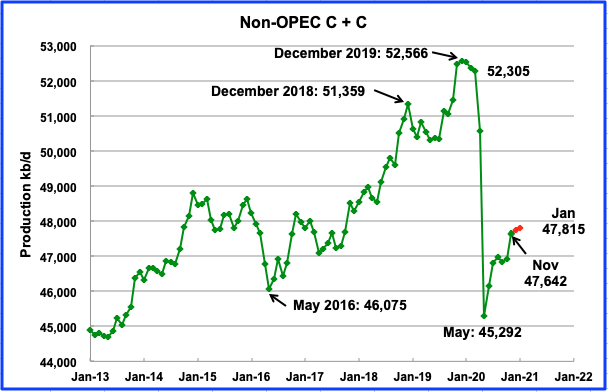
Below are a number of oil (C + C ) production charts for Non-OPEC countries created from data provided by the EIAʼs International Energy Statistics and updated to November 2020. Information from other sources such as OPEC, the STEO and country specific sites such as Russia and Norway is used to provide a short term outlook for future output and direction for a few countries and the world.

This November post will primarily update the charts from the October report that was posted late on Saturday, February 20. The comments in the October post were up to date as of February 19 and so will be largely copied over to this post and updated where appropriate.

Read More

October Non-OPEC Oil Production Resumed Climb

A post by Ovi at peakoilbarrel

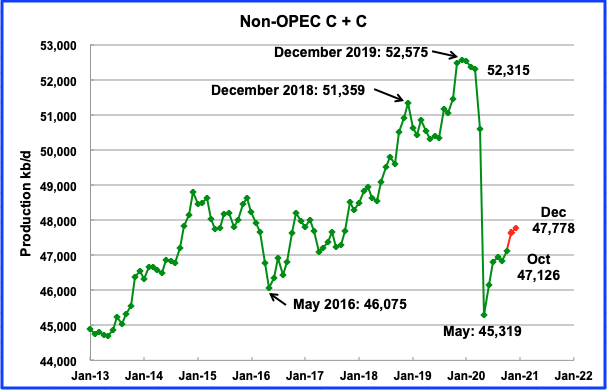
Below are a number of oil (C + C ) production charts for Non-OPEC countries created from data provided by the EIAʼs International Energy Statistics and updated to October 2020. Information from other sources such as OPEC, the STEO and country specific sites such as Russia and Norway is used to provide a short term outlook for future output and direction for a few countries and the world.

Note. I have just been informed that the EIA published their November report early. Normally they post the update at the end of the month. I will update this post ASAP and publish a November one. Sorry

Read More

UK North Sea Summary Part II: Reserves, Recent Production and Future Projections

A Guest Post by George Kaplan

Reserves

The OGA issues UK oil and gas reserve values each year, but only in total, not for individual fields as is done in Norway, Mexico, GoM and Brazil (which reports by basin rather than field). The reserves are not backdated to discovery date so it’s not possible to generate anything like a true creaming curve, but they are split into categories of proved, probable and possible, and, since 2015, contingencies. Operators in the UK North Sea have up to five years to announce estimated resources in discoveries so there may be uncertainties for recent years, unlike in the Norwegian section where estimate must be declared as soon as they are known.

Read More

Non-OPEC September Oil Production Flat

A post by Ovi at peakoilbarrel

Below are a number of oil (C + C ) production charts for Non-OPEC countries created from data provided by the EIAʼs International Energy Statistics and updated to September 2020. Information from other sources such as OPEC, the STEO and country specific sites such as Russia and Norway is used to provide a short term outlook for future output and direction for a few countries.

Read More