US January Production Drop Surprises

A guest post by Ovi

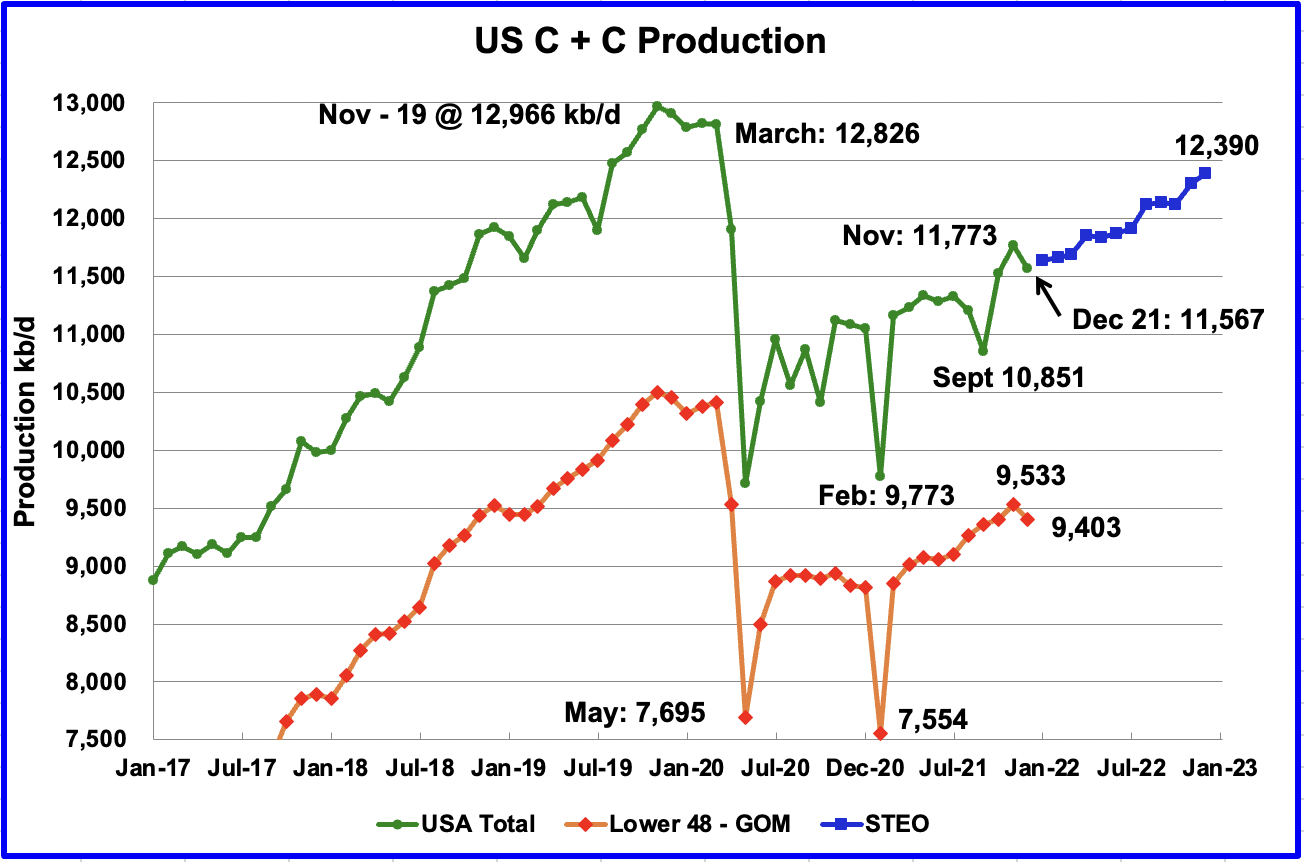
All of the oil (C + C) production data for the US state charts comes from the EIAʼ’s Petroleum Supply monthly PSM

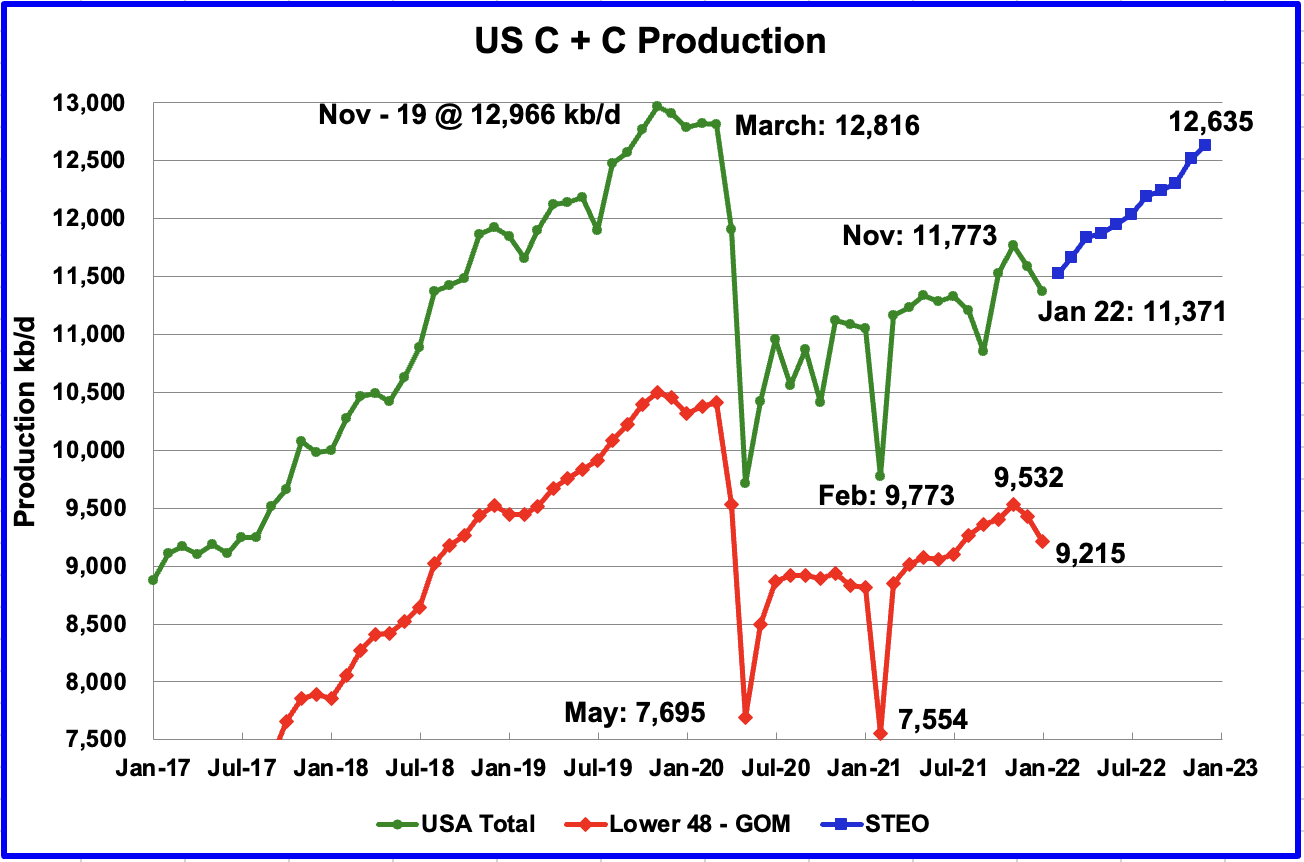
U.S. January production decreased by a surprising 216 kb/d to 11,371 kb/d. In December production dropped by 206 kb/d. The main declining states were Texas 120 kb/d, New Mexico 31 kb/d, and ND 24 kb/d.  Of the top 10 states, only Colorado increased its production.

Read More

November Non-OPEC Oil Production Ticks Up

A guest post by Ovi

Below are a number of oil, crude plus condensate (C + C ), production charts for Non-OPEC countries created from data provided by the EIA’s International Energy Statistics and updated to November 2021. Information from other sources such as OPEC, the STEO and country specific sites such as Russia, Brazil, Norway and China is used to provide a short term outlook for future output and direction for a few countries and the world.

Read More

Collapse: A Decadal Scenario

Guest post by orgfarm

Part 2 of 3

The “Sixties”

Severe food and energy shortages intensify in 2060, and ignite national fear and anger. State survival now depends on seizing the last reserves of vital resources – primarily fossil-fuel – making war inevitable.  Alliances form, nations act with righteous determination, conflict erupts around the world.

Read More