Comments not related to Oil and Natural Gas production in this thread.
Author: Ron Patterson
USA Oil Production
The Real Reason Why US Oil Production Has Peaked
Raymond James recently estimated that over the last three years the U.S. decline rate for oil has doubled from 1.6 to 3.2 million barrels per day. The drilled but uncompleted well inventory (“DUC”) is back to normal, so the number of wells being drilled and the number of wells being completed is now about the same. We need over 12,000 new horizontal oil wells completed each year to hold production flat and the number of completed wells will need to go up each year.
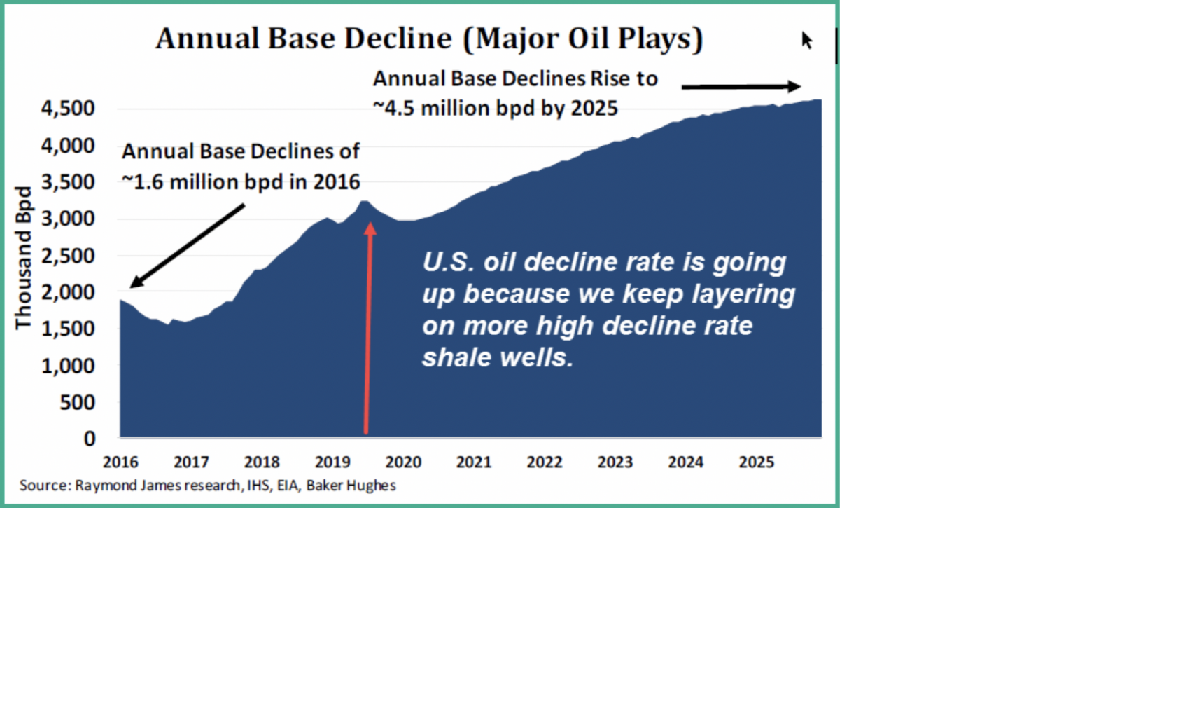
The U.S. Energy Information Administration (“EIA”) forecast at the beginning of this year was that the U.S. shale oil plays were just getting started and that production would increase by at least 2 million barrels of oil per day (“MMBOPD”) each year for several more years.
Read MoreOPEC July Production Data
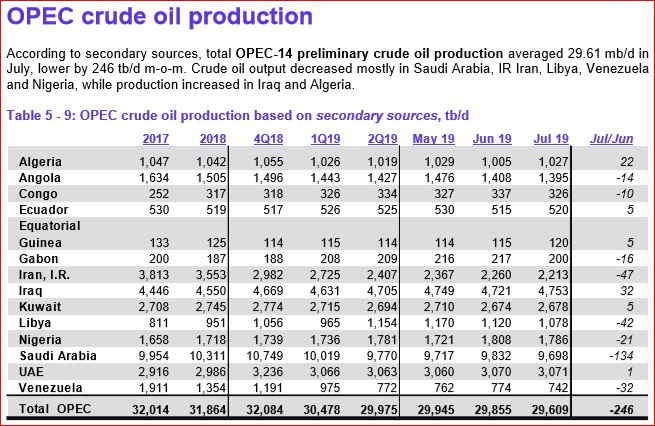
All data below, unless otherwise specified are from the latest OPEC Monthly Oil Market Report. All data is through July and is thousand barrels per day.
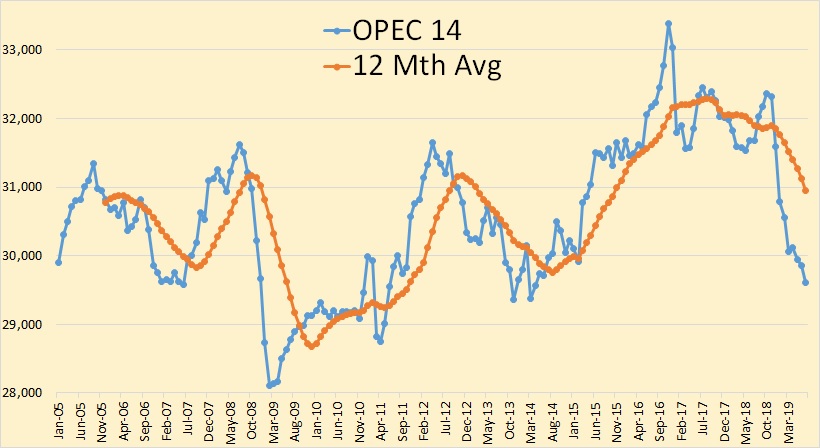
OPEC crude oil production was down 246,000 barrels per day in July’
USA and World Oil Production
The USA data below was taken primarily from the EIA’s Petroleum Supply Monthly while some were taken from the EIA’s Monthly Energy Review.
I have some bad news to report. The EIA no longer published World production data or Non-OPEC production data. This data had previously been published in the Monthly Energy Review.
The Monthly Energy Review’s data was one month behind the Petroleum Supply Monthly but now they jumped two months and are now one month ahead of the Petroleum Supply Monthly. They now publish the previous month’s numbers, June in this case, but now publish only US data. The Petroleum Supply Monthly is unchanged.
EDIT: The Petroleum Supply Monthly does publish some, incomplete, world data… through April or one month behind their USA data. I will use that with an explanation and comments next month.
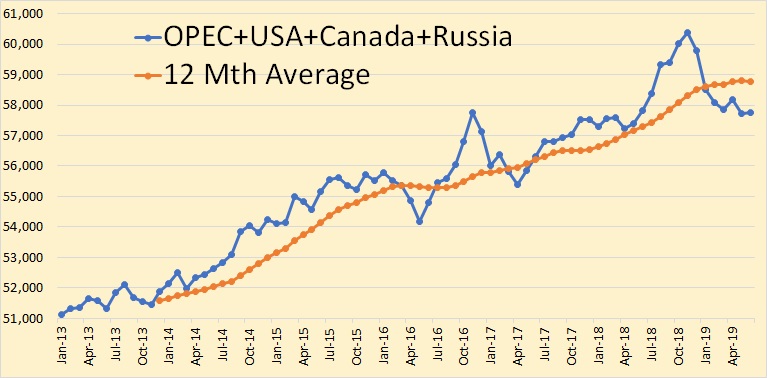
The closest I can come to World oil production, through June, is the combined production of OPEC, Russia, the USA, and Canada. This is 70% of total World Production.
OPEC June Crude Oil Production
The following June OPEC data is based on the latest July OPEM Monthly Oil Market Report and is in thousand barrels per day.
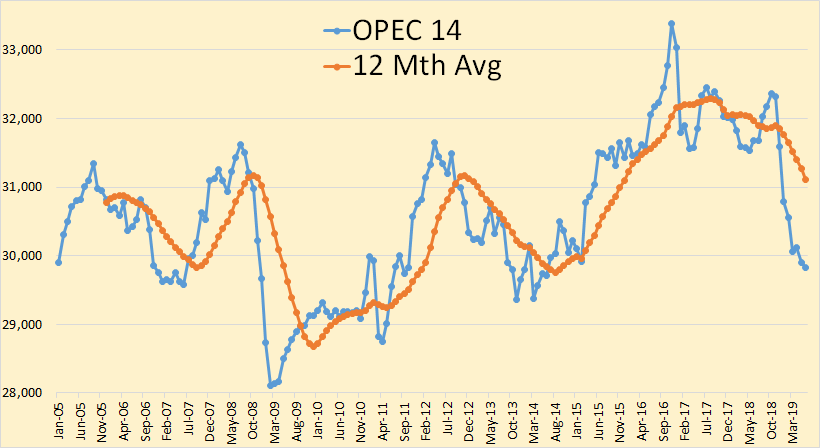
OPEC 14 crude only production was down 68,000 barrels per day in June.
