Revisiting the IEA’s World Energy Outlook 2013

I was going over the IEA’s World Energy Outlook 2013 and noticed a few things you might find interesting. Exactly what is their opinion on Peak Oil? Here, cut and pasted from the report.

IEA 2

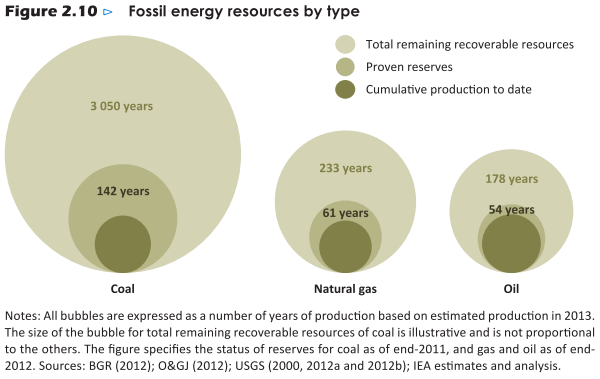
 Got that? The URR is great enough to delay any peak until after 2035. Here is one of their graphs that indicate how much they think is left, coal, gas and oil.

IEA 1

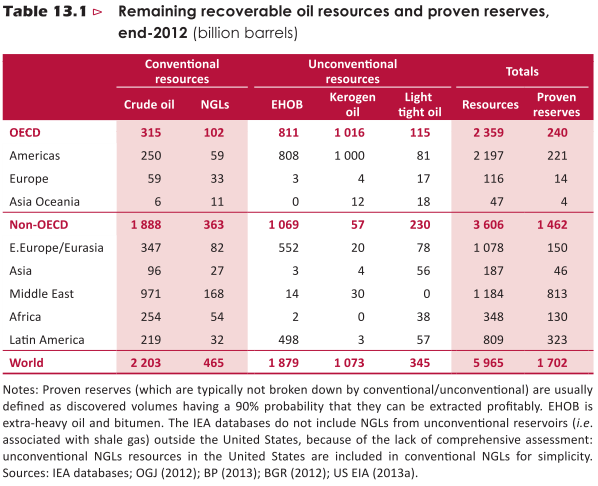
Okay 54 years of proven reserves. That puts the peak out to well past mid century. Likely well past 2100 if you count those remaining recoverable resources. And just who has all this oil?

IEA 10

2.2 trillion barrels of conventional crude oil resources. However only 1.7 trillion barrels of that has a 90% probability of being recoverable. Of this the Middle East has the lions share, 971 billion barrels of resources with a 90% probability of recovering 813 billion barrels of that.

Read More

Texas RRC Crude and Condensate Data, Is Eagle Ford Peaking?

This page Texas Oil and Gas Production was last updated on February 18. However the data on this page has been updated. And the January production has been updated also: Oil and Gas Production Data Query then check “Lease”, “Both”, Statewide and then punch in the appropriate dates. Then when the next page comes up click on “Monthly Totals”. This brings up the updated monthly totals for Crude, Casinghead Gas, Gas Well Gas and Condensate.

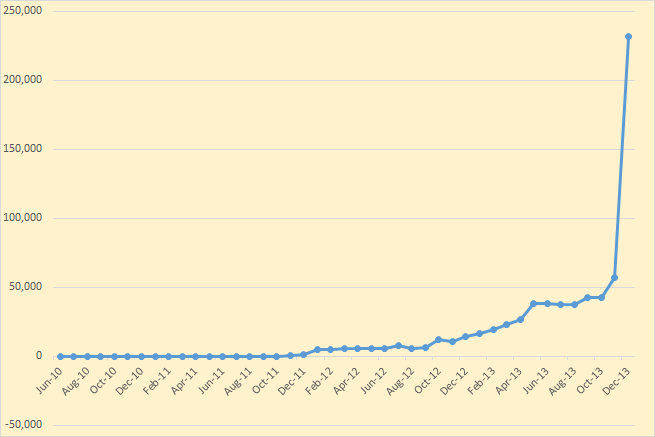
There were revisions going back to July 2010 but only 2013 had any major revisions though there were some 2012 revisions also as the chart below shows.

Texas Revisions

The earlier revisions were smaller and there were some of them that were negative. That is the figures were revised downward.

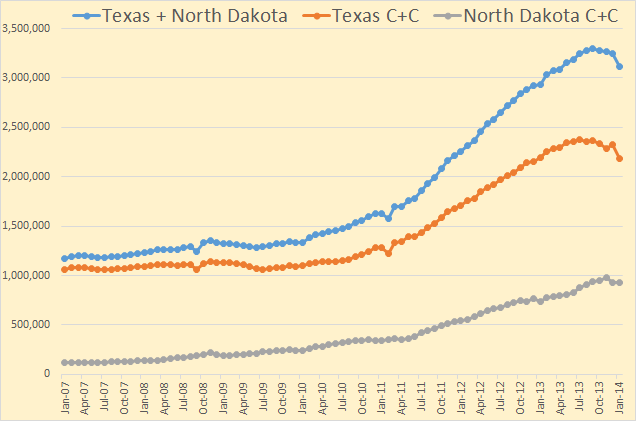
This chart compares Texas with North Dakota. This is all Texas not just Eagle Ford. The last data point for all is January 2014.

Texas + North Dakota

Though there is a lot of conventional production in Texas, the increase is nevertheless about all tight oil. And these two states produce perhaps 95% of all tight oil produced in the United States. And that is about 2  million barrels so far if the Texas RRC is close.

Read More

Bakken Update with January Production Numbers

Second Update: I am still waiting for the Texas Railroad Commission monthly update. I had hoped it would be out today. However I will have a new post out tomorrow evening, March 21, whether they update tomorrow, or not. I have some good graphs from Jean Laherrere and one from Roger Blanchard that I will post.

Okay Another Update: Dennis Coyne has just posted me the numbers and link for Texas Condensate production. Now we can finally figure out what is going on in Texas.

More tomorrow

The North Dakota January production data is out for The Bakken and All North Dakota. Bakken production was up by 6,031 bp/d to 871,672 bp/d. But that was after December production was revised up by 2,744 bp/d. All North Dakota production was up by 6,446 to 933,133 bp/d. But that was after December production was revised up by 3,460 bp/d.
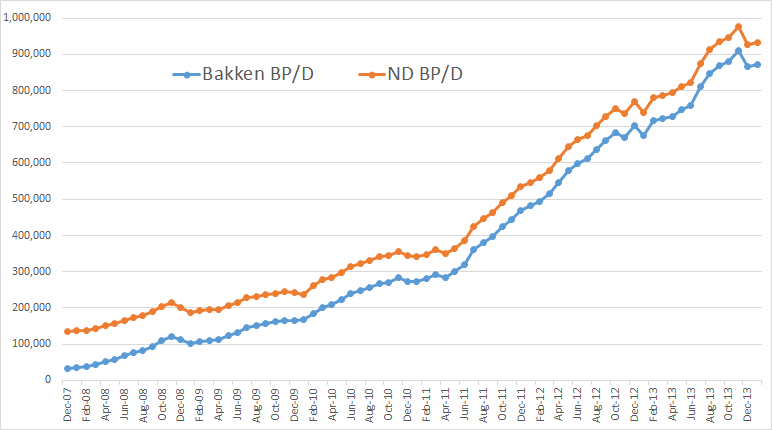
Bakken Barrels Per Day

From the Director’s Cut

The drilling rig count was down from Dec to Jan and the number of well completions
dropped from 119 to 60. Days from spud to initial production decreased 10 days to 122.

Investor confidence appears to be growing. There are over 100 wells shut in for the Tioga gas plant conversion in an attempt to minimize flaring, but the biggest production impact story continues to be the weather. January temperatures were only 6 degrees below normal with only 3 days too cold for fracturing work, and there were no major snow events, but 12 days had sustained wind speeds too high for well completion work.

At the end of Jan there were about 660 wells waiting on completion services, an increase of 25.

North Dakota wells increased by 59 to 9,734 while Bakken wells increased by 92 to 6,926.
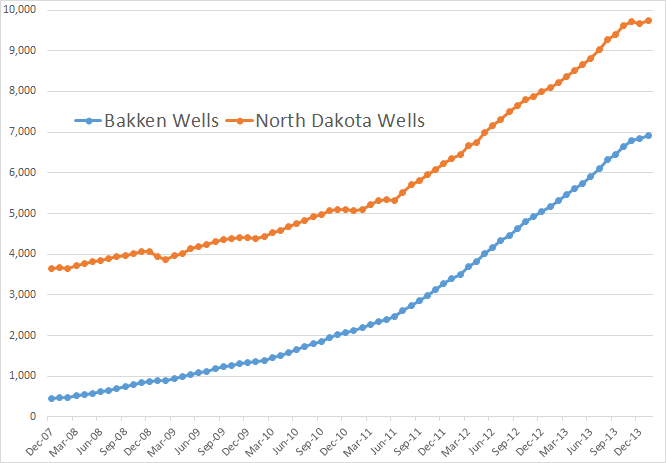
Bakken Wells

Perhaps it is just bad weather but there is definitely a slowdown in number of wells.

Read More

The EIA’s Drilling Productivity Report, Ghana and China

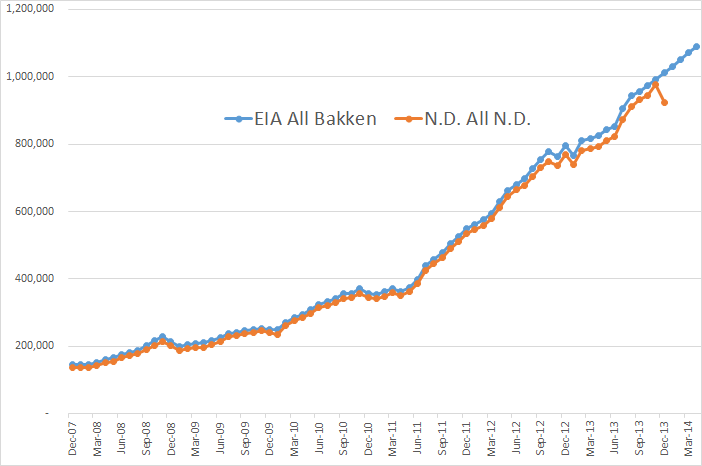
The EIA’s latest Drilling Productivity Report has been published. I found some strange things in the report. For the Bakken, their data does not jive with that posted by North Dakota. I have plotted the two together. The North Dakota includes all North Dakota but not the Montana part of the Bakken. The EIA data includes all the Bakken but not the non-Bakken part of North Dakota. Almost a wash but not quite. Montana produces slightly more than the non-Bakken part of North Dakota, but not very much. Anyway…

EIA New Bakken Report

I thought for sure that the EIA would hear that Bakken Production was down about 50,000 barrels per day in December. But Nooooo… they have the Bakken up by over 20,000 barrels per day in December, a difference of 70,000 bp/d. But up until the last two or three months they follow the North Dakota data pretty close so we can hope they update their data in a few months.

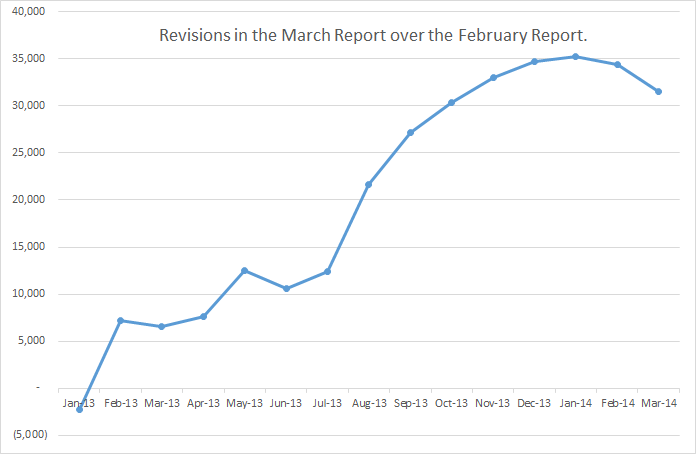
However all LTO production was revised upward in this last report. The chart below is the barrels per day that all tight oil was revised upward.

April Revisions

Doesn’t the strange shape of that chart raise suspicions? December production was revised upward by 34,672 bp/d when it actually should have been revised downward by perhaps twice that amount. January production was revised upward by 35,243 barrels per day. I doubt very much that this was the actual case.

Read More