Comments not related to oil and natural gas production in this thread, please.
Author: Ron Patterson
OPEC March 2020 Production Data
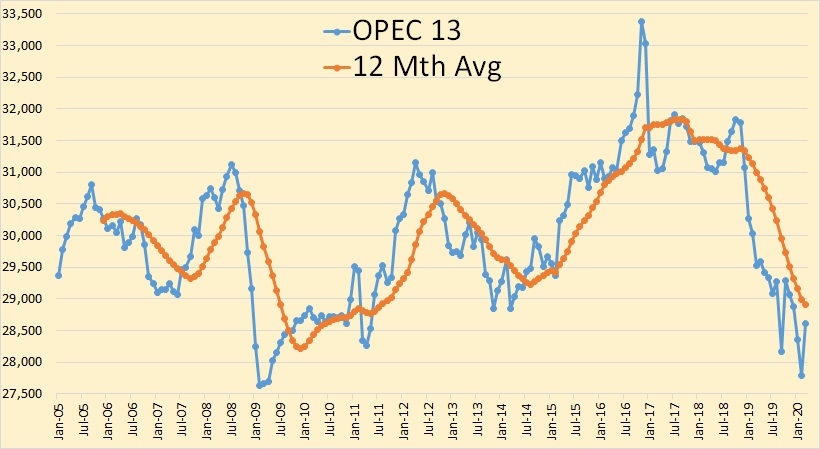
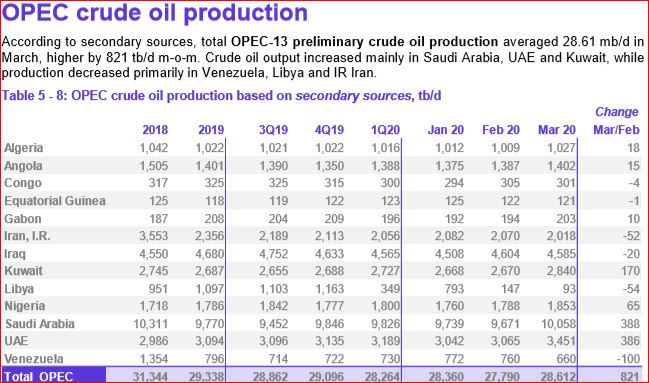
All OPEC data reflected in the charts below are from the April edition of the OPEC Monthly Oil Market Report. https://momr.opec.org/pdf-download/ The data in in thousand barrels per day and all data is through March 2020.

Though OPEC 13 was up 821,000 barrels per day in March it was still the fourth lowest month in 9 years.

Iran, Libya, and Venezuela are exempt from the agreed on cuts. These three were down a combined 206,000 barrels per day. Those subject to cuts, were up a combined 1,026,000 barrels per day.
Read MoreOPEC February Production Data
All OPEC data below is from the OPEC Monthly Oil Market Report. It is thousand barrels per day and is through February 2020.

The OPEC data no longer includes Ecuador. OPEC 13 was down 546,000 barrels per day in February.

The only major decliners were Libya and Saudi Arabia.
Read MoreOpen Thread Non-Petroleum, March 27, 2020
Comments not directly related to oil and natural gas production should be in this thread. Thank you.
OPEC January Production Data
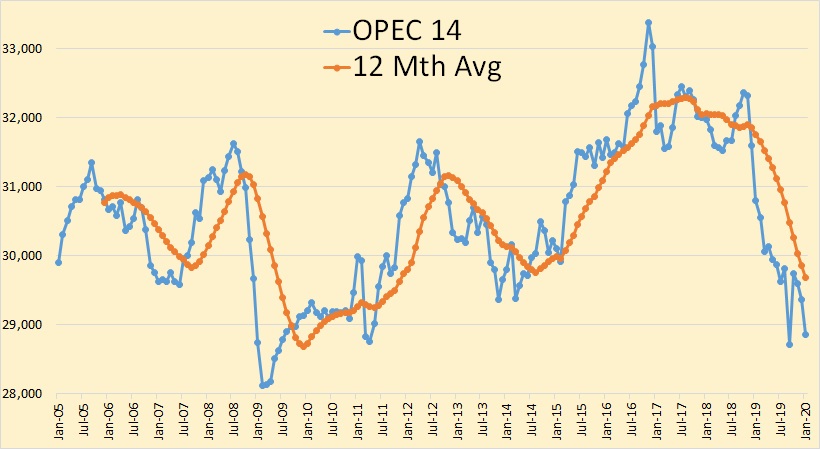
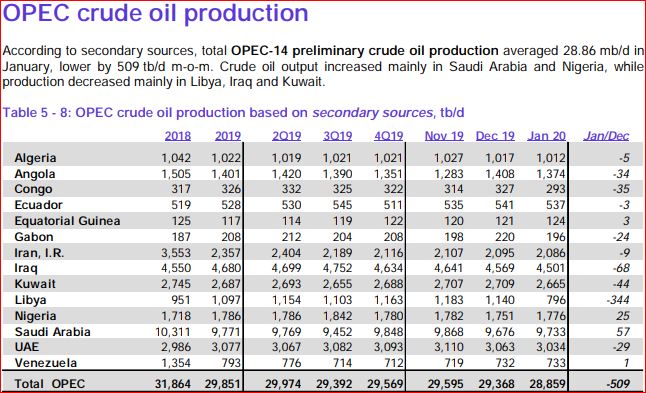
All OPEC data below is from the February edition of the OPEC Monthly Oil Market Report. The data thousand barrels per day and is through January 2020. OPEC Monthly Oil Marker Report
OPEC 14 crude oil production was down 509,000 barrels per day in January. And that was after December production was revised down 86,000 barrels per day.
OPEC announced a couple of months ago that Ecuador was leaving the cartel. However they were still included in January’s data. I have no idea what’s going on.
Read More
