A Closer Look at OPEC

Taking a closer look at OPEC. All OPEC and price data below is through December. All production data is in thousand barrels per day.

Iran and Libya have had serious political disruptions in their production numbers. Simply adding them to the OPEC numbers distorts the picture. To try to figure out what has been happening to OPEC we need to look at OPEC without Iran and Libya.
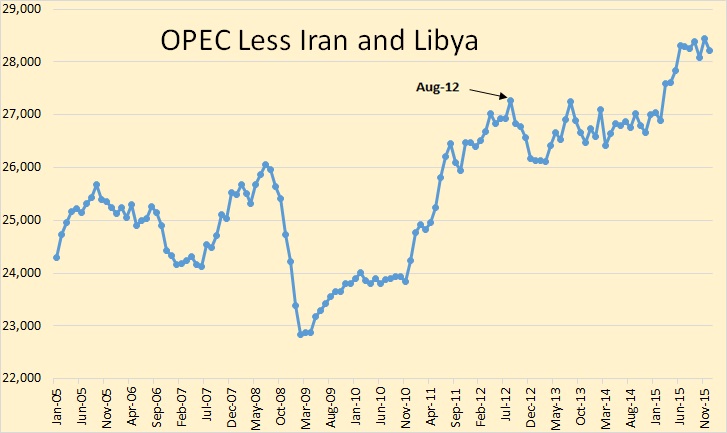
OPEC Less Iran and Libya

Here is OPEC less Iran and Libya, or the OPEC 10 if you will. I have marked August 2012 as what I call the “Price Peak”. Not the peak in oil prices but the production peak that was brought about by the increase in the price of oil. That price increase began in early 2009 and by March 2011 was well above $100 a barrel. And the price of oil did not drop below $100 a barrel until late August 2014.
Read More

OPEC, except for Iran, Has Peaked

The OPEC Monthly Oil Market Report is out. OPEC took a hit in December, down 205,000 barrels per day. After examining the past and present production numbers, I believe that OPEC, except Iran, has peaked. That is, the combined production from all the other OPEC nations, has peaked. And any additional production from Libya is likely to be in tiny increments that won’t make much difference in the big picture. Other OPEC nations may show a slight increase from their current level. But the combined production from all the other 11 OPEC nations, 12 if you count Indonesia, has peaked.

Of course there will be some small increases from the other 11 OPEC countries from time to time but overall, in 2016 and beyond, I believe it will OPEC will be from flat to down, with a greater chance of being down. That is we are at, or near, the peak right now. There might be a slight uptick of their combined production in the coming months but not enough to get excited abut.

All Data in the charts below is through December and is in thousand barrels per day.

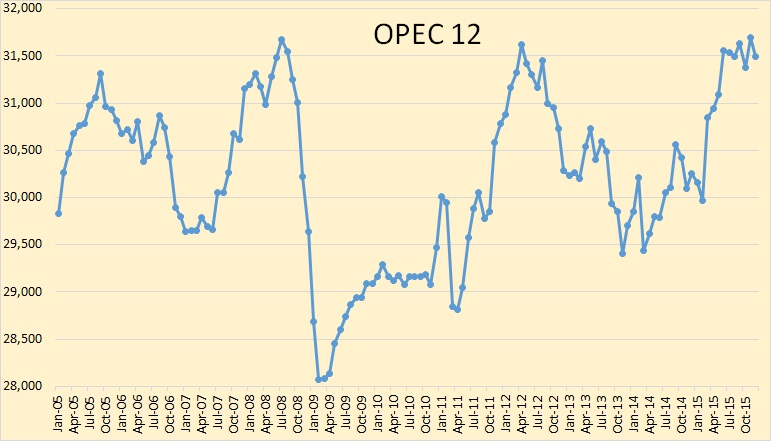
OPEC 12

OPEC production, in the chart above does not include Indonesia. OPEC 12 was down 204,000 barrels per day.

Read More

Texas Oil and Gas Production Declining

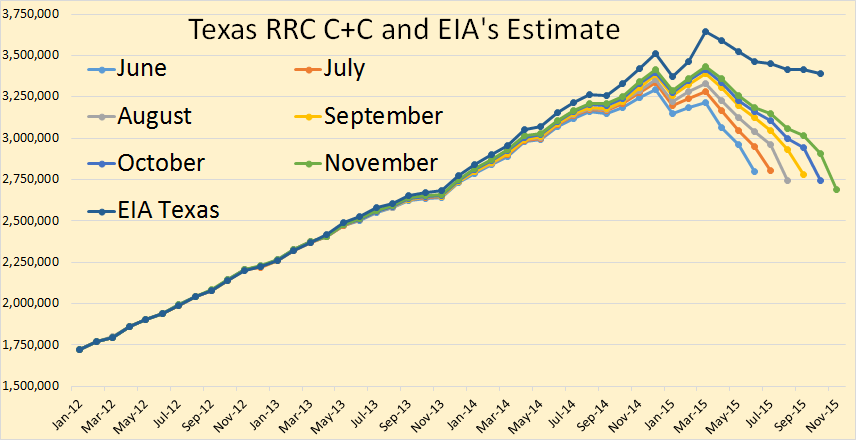
The Texas RRC Oil and Gas Production Data is out. This data is  always incomplete. But we can get some idea of what the trend is by comparing it with previous months. This is what I have done in the charts below. If the latest months data is below the previous months data then the trend is down. But if the latest months (incomplete) data is above the previous months (incomplete) data the trend is up.

All RRC data is through November 2015 but the EIA data is only through October. The oil data is in barrels per day.

Texas C+C

The trend is definitely down. The scale makes it difficult to gauge the month to month change but I have the exact month to month change here in barrels per day. Of course this only gives you a general idea of what is happening. The final change could be either less or greater than the numbers indicate here. But the EIA data should be very close.

Jun. to Jul.  7,245
Jul. to Aug. -63,827
Aug. to Sep. 34,507
Sep. to Oct. -33,486
Oct. to Nov. -52,802
Jun. to Nov. -108,363

EIA Dec. to Oct. -121,000

Read More

International Rig Counts Still Falling

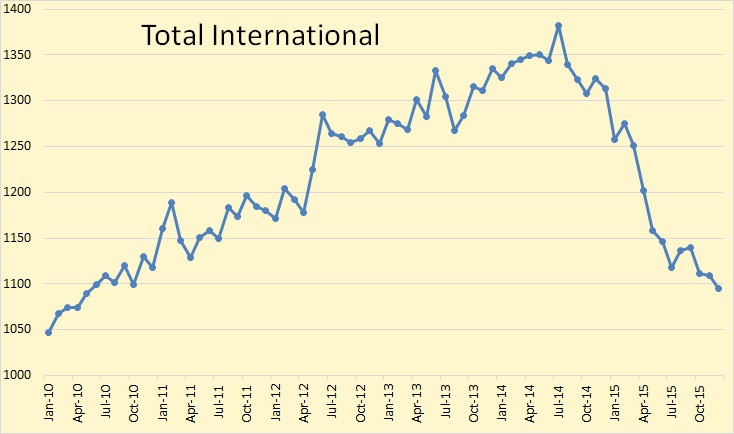
The monthly Baker Hughes International Rig Count came out a few days ago. Baker Hughes international rig counts do not include US, Canada, FSU countries or on shore China. All rig count data here is through December 2015 and includes all rigs, gas, oil and misc.

BH Total Intl.

Total international rig count was down 14 rigs from November to December. From December 2014 to December 2015 rig count was down 218 rigs or 16.6 percent.

Read More