By Ovi
The focus of this post is an overview of World oil production along with a more detailed review of the top 11 Non-OPEC oil producing countries. OPEC production is covered in a separate post.
Below are a number of Crude plus Condensate (C + C) production charts, usually shortened to “oil”, for oil producing countries. The charts are created from data provided by the EIA’s International Energy Statistics and are updated to April 2024. This is the latest and most detailed/complete World Oil production information available. Information from other sources such as OPEC, the STEO and country specific sites such as Brazil, Norway and China is used to provide a short term outlook.
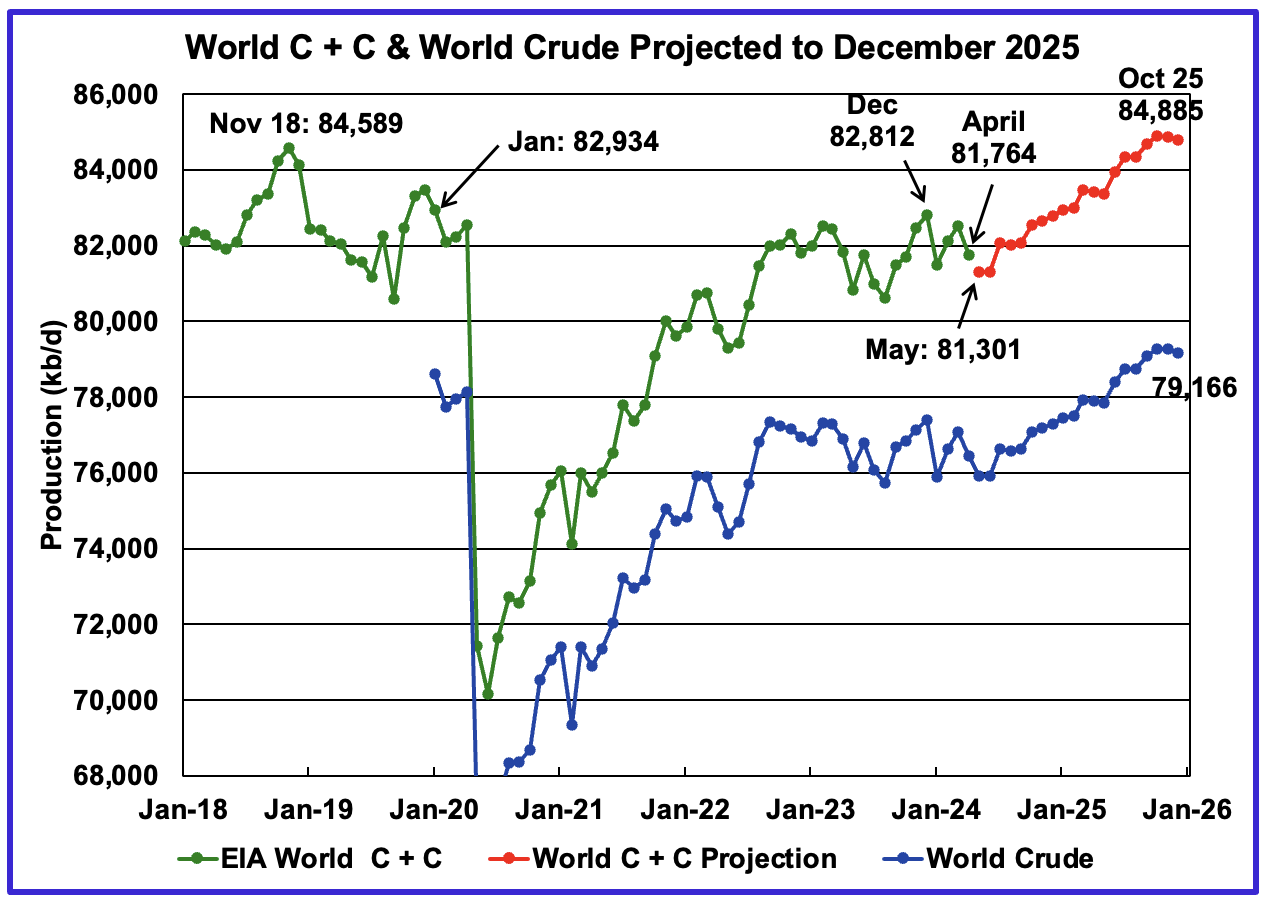
World oil production decreased by 765 kb/d in April to 81,764 kb/d, green graph. The largest decreases came from Brazil 162 kb/d and Russia 130 kb/d. May’s World oil production is projected to drop by 461 kb/d to 81,301 kb/d largely due to a drop in Non-OPEC production.
This chart also projects World C + C production out to December 2025. It uses the August 2024 STEO report along with the International Energy Statistics to make the projection. The red graph forecasts World oil (C + C) production out to December 2025 using the STEO’s crude oil report.
For December 2025, production is expected to be 84,782 kb/d. It is preceded by an October 2025 peak of 84,885 kb/d. The December 2025 production is 216 kb/d lower than estimated in the previous post.
From May 2024 to December 2025, World oil production is estimated to increase by 3,584 kb/d.
A note of caution. The August STEO is now reporting/forecasting only Crude production which is also shown in the chart. As a result the red C+C graph is a projection based on the crude production graph.
There is a significant change in the ratio (C + C)/C over the last six months of reported crude production relative to the previous six months. The average (C + C)/C ratio for the latest 6 months is 0.7% higher than the previous six months. While this is a small difference percentage wise, it makes a significant change to the December 2025 production projection of close to 600 kb/d. The red graph uses the average for last six months of data to make this forecast. This report will now use a fixed latest six month average going forward to try to detect any seasonal variation in the ratio.
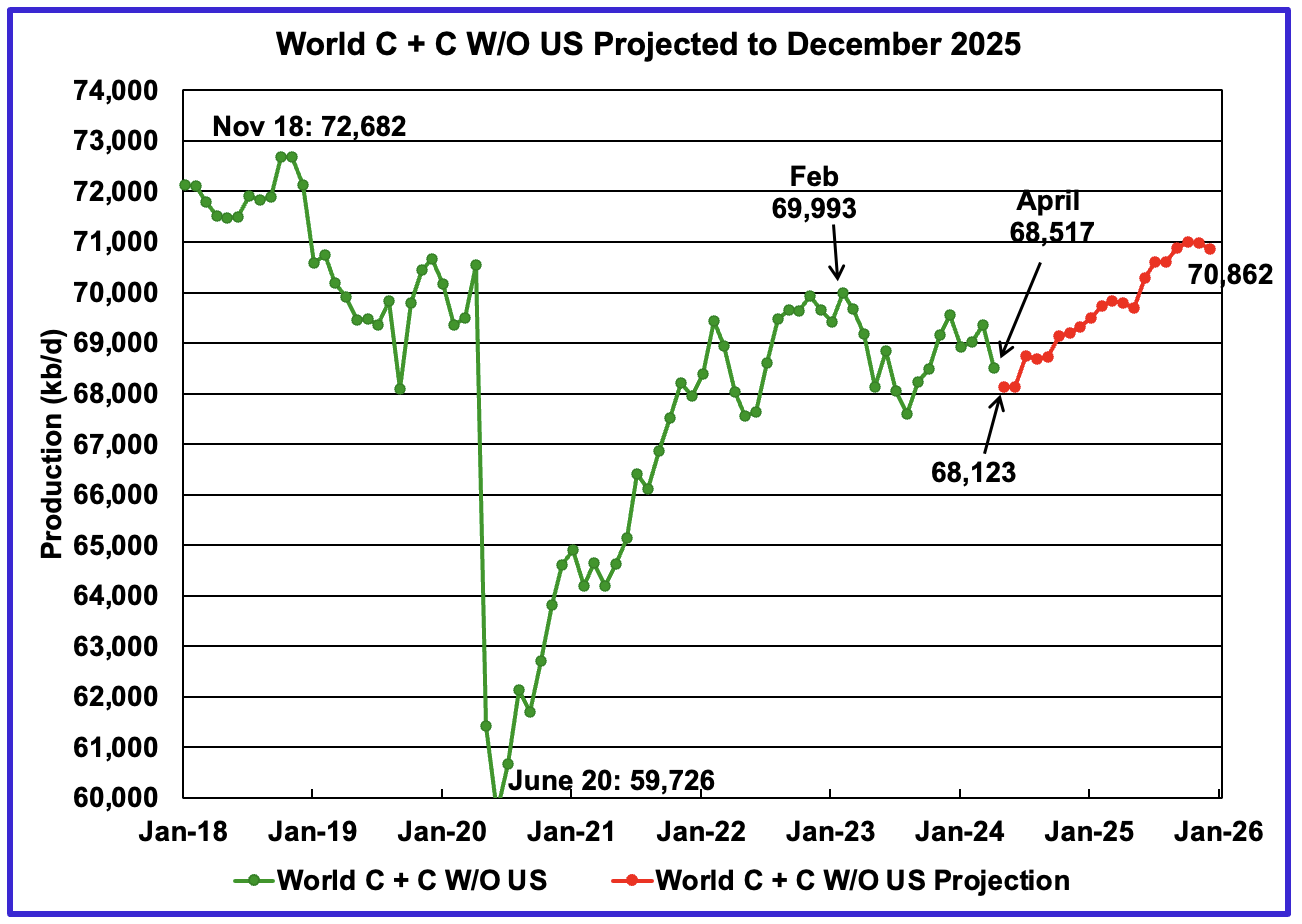
World without US April oil output decreased by 837 kb/d to 68,517 kb/d. May production is expected to drop by 394 kb/d to 68,123 kb/d and stay essentially flat for June before beginning to recover in July.
Note that December 2025 output of 70,862 kb/d is 1,820 kb/d lower than the November 2018 peak of 72,682 kb/d. The December 2025 production of 70,862 is also 127 kb/d lower than reported in the previous post.
World oil production W/O the U.S. from May 2024 to December 2025 is forecast to increase by a total of 2,739 kb/d.
A Different Perspective on World Oil Production
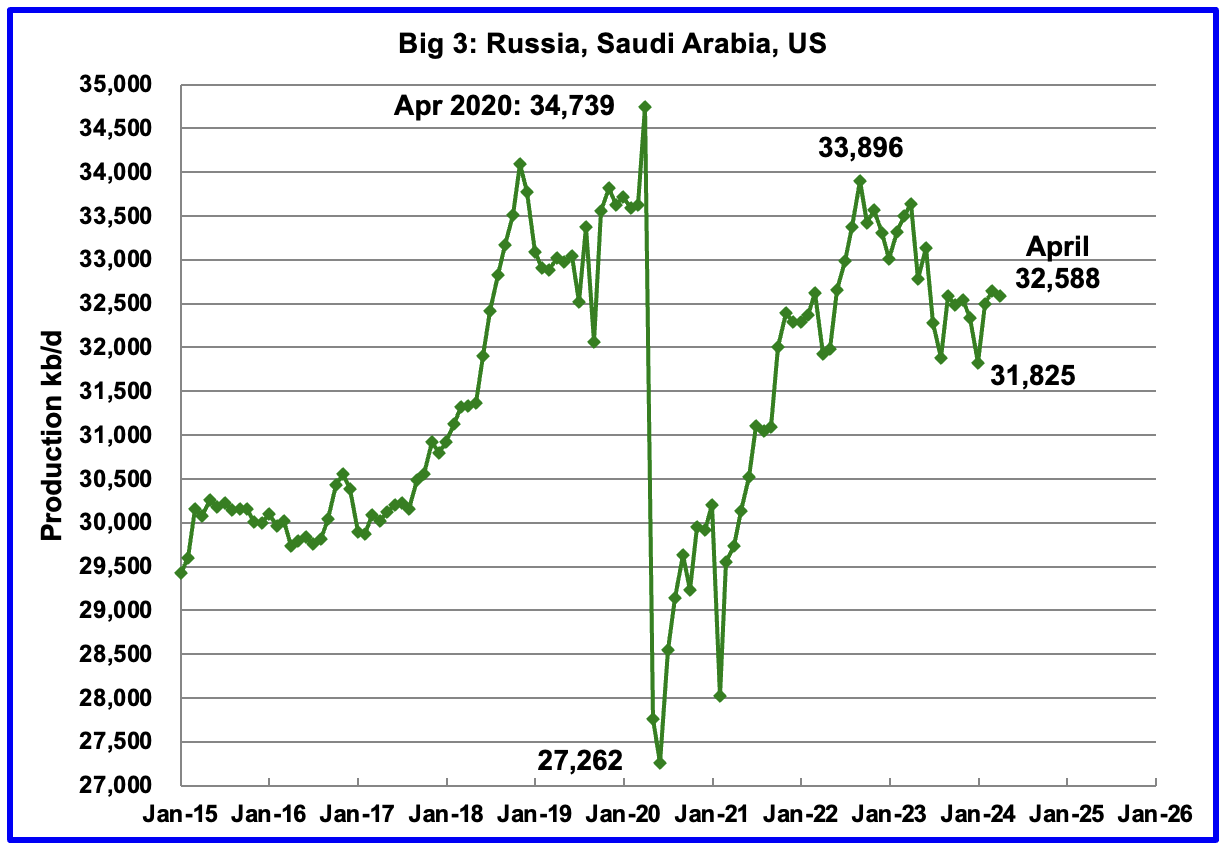
Peak production in the Big 3 occurred in April 2020 at a rate of 34,739 kb/d. The peak was associated with a large production increase from Saudi Arabia. Post covid, production peaked at 33,896 kb/d in September 2022. The production drop since then is primarily due to cutbacks/decline in Russia and Saudi Arabia.
April’s Big 3 oil production decreased by 59 kb/d to 32,588 kb/d. April’s production is 1,308 kb/d lower than the September 2022 post pandemic high of 33,896 kb/d. Adding in the current Saudi Arabia 1,000 kb/d cut would raise production to 33,588 kb/d, just 308 kb/d lower than September 2022 production. Saudi Arabia along with other OPEC + countries will begin to reverse their cuts in October 2024.
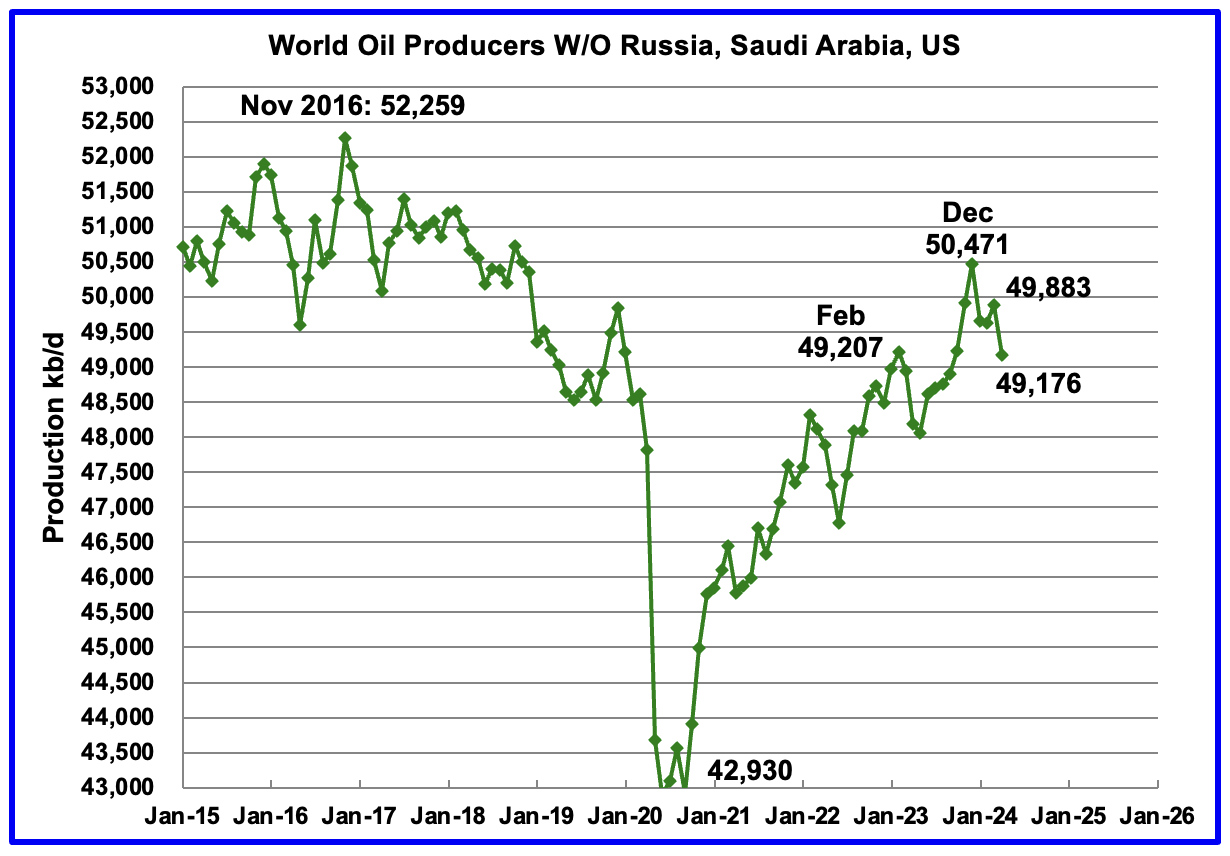
Production in the Rest had been slowly increasing since the September 2020 low of 42,930 kb/d. Output in December 2023 reached 50,494 kb/d, a new post covid high. However January and February production reversed the increasing trend and production dropped by 849 kb/d over those two months before rebounding to 49,883 kb/d in March. April production decreased by an additional 707 kb/d to 49,176 kb/d. The overall drop from December 2023 is 1,295 kb/d.
Countries Ranked by Oil Production
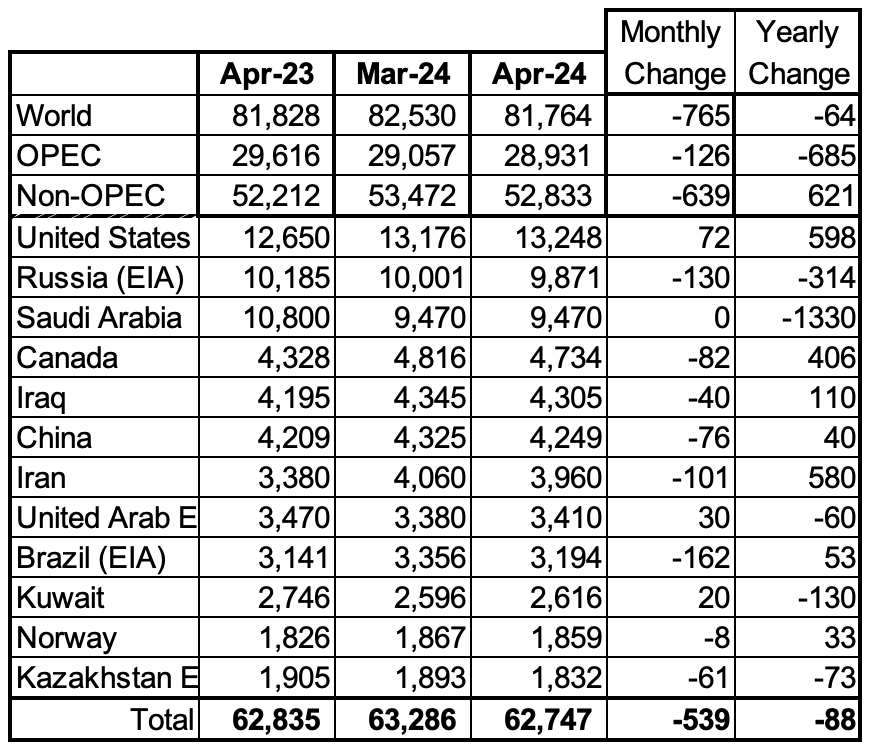
Above are listed the World’s 12th largest oil producing countries. In April 2024, these 12 countries produced 76.7% of the World’s oil. On a MoM basis, production decreased by 539 kb/d in these 12 countries while on a YOY basis, production dropped by 88 kb/d.
Note the large and very similar YoY increase in Iranian and US oil production, 580 kb/d vs 598 kb/d.
April Non-OPEC Oil Production
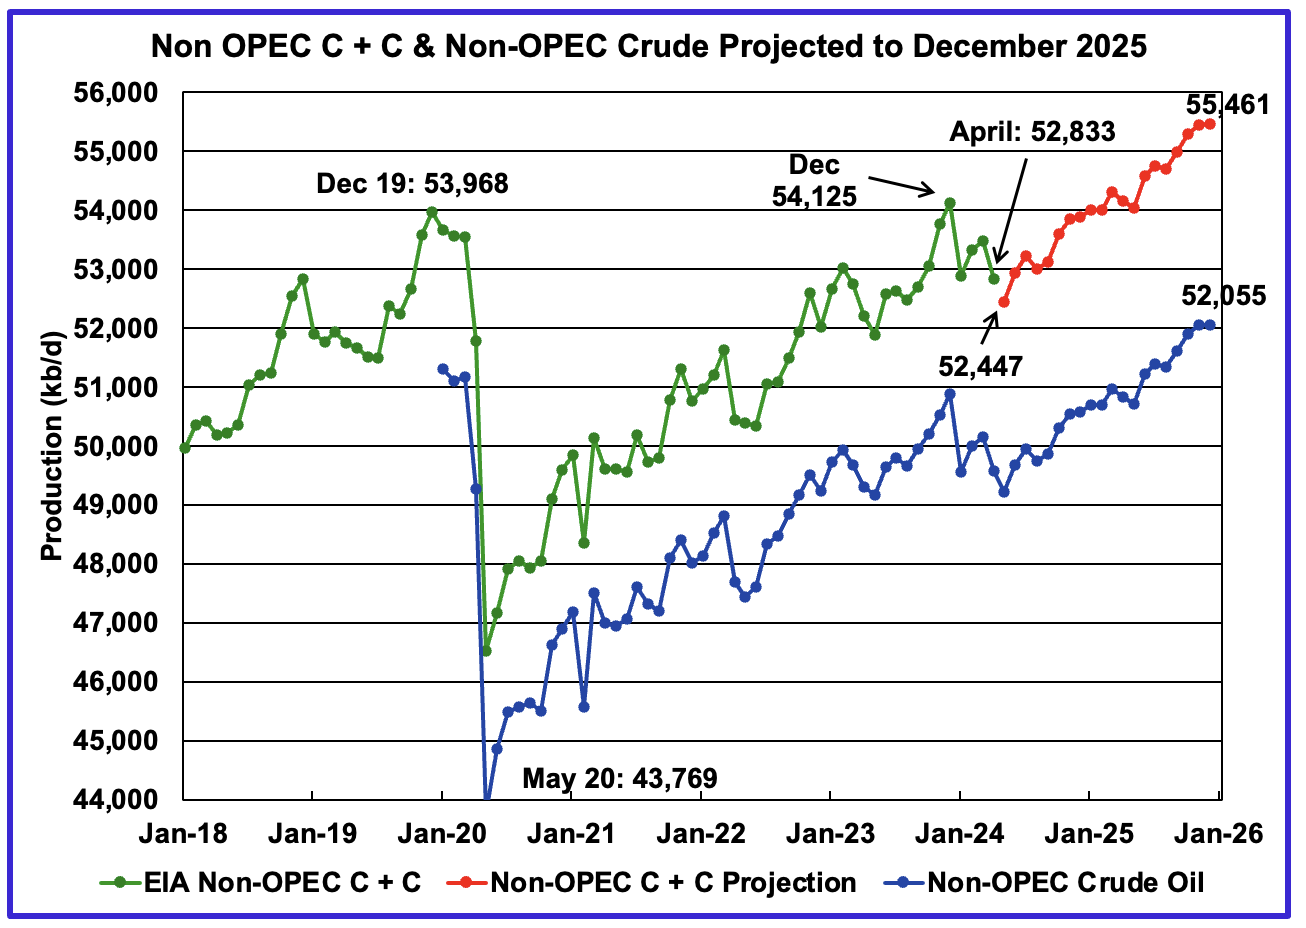
April Non-OPEC oil production decreased by 639 kb/d to 52,833 kb/d. The largest decreases came from Brazil and Russia. Note that Non-OPEC production now includes Angola.
Using data from the August 2023 STEO, a projection for Non-OPEC oil output was made for the period May 2024 to December 2025. (Red graph). Output is expected to reach 55,461 kb/d in December 2025, which is 1,493 kb/d higher than the December 2019 peak of 53,968 kb/d. The projected December 2025 production is 214 kb/d lower than projected in the previous post.
The same caution as noted in the comments for the World chart above apply to this chart.
From December 2023 to December 2025, oil production in Non-OPEC countries is expected to increase by 1,336 kb/d.
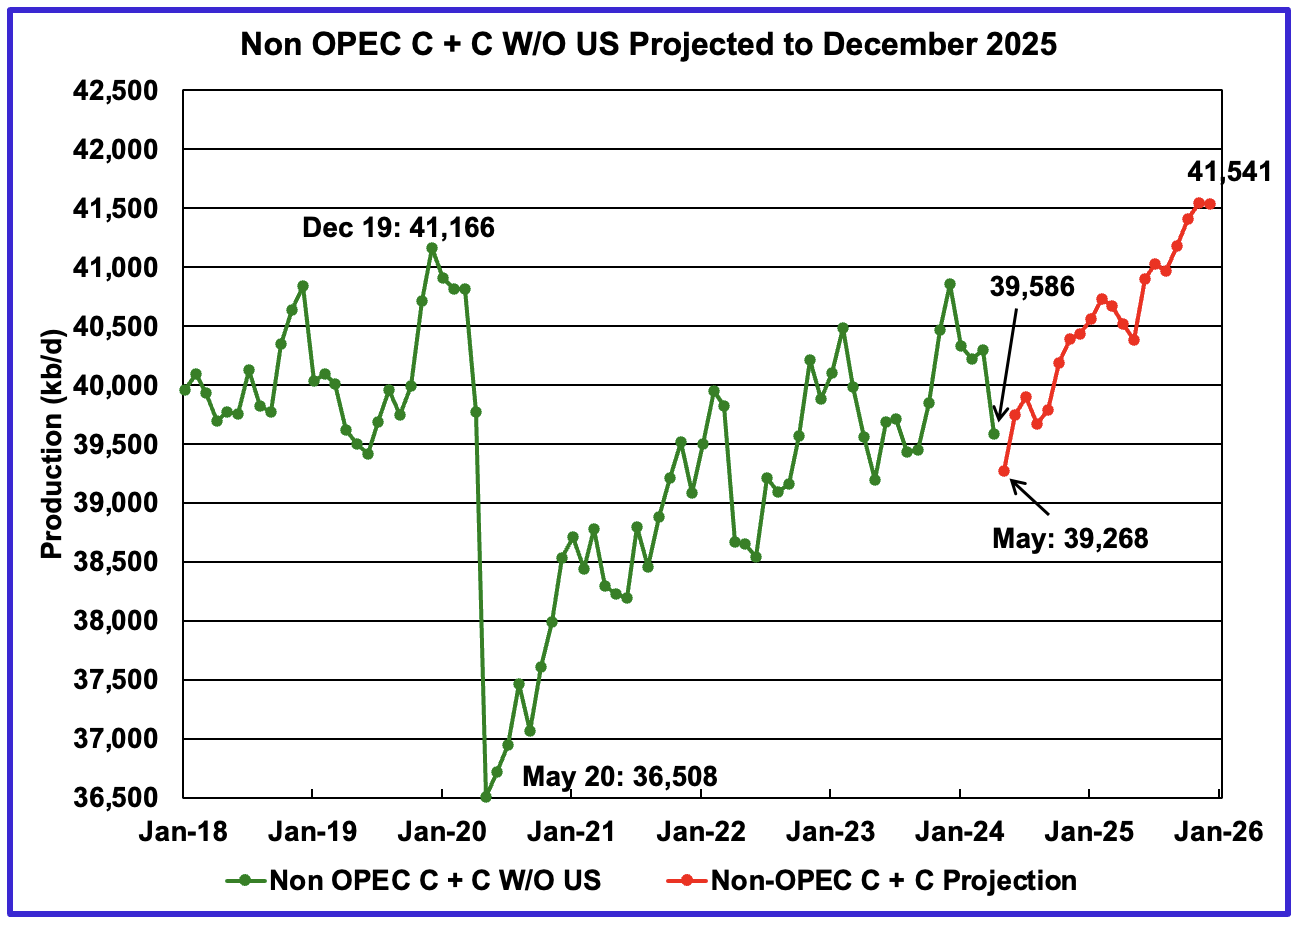
April Non-OPEC W/O US production decreased by 711 kb/d to 39,586 kb/d. May’s production is projected to drop a further 318 kb/d to 39,268 kb/d.
From May 2024 to December 2025, production in Non-OPEC countries W/O the US is expected to increase by 2,273 kb/d. December 2025 production is projected to be 375 kb/d higher than December 2019.
Non-OPEC Oil Countries Ranked by Production
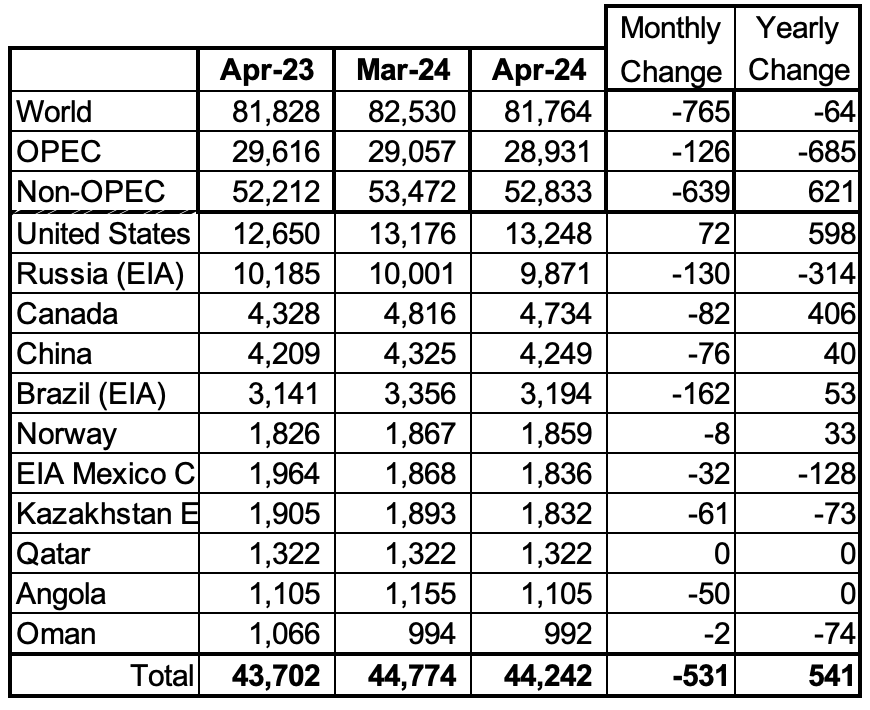
Listed above are the World’s 11 largest Non-OPEC producers. The criteria for inclusion in the table is that all of the countries produce more than 1,000 kb/d. Note that Angola has been added to this table.
May production decreased by 531 kb/d to 44,242 kb/d for these eleven Non-OPEC countries while as a whole the Non-OPEC countries saw a monthly production decrease of 639 kb/d.
In May 2024, these 11 countries produced 83.7% of all Non-OPEC oil production.
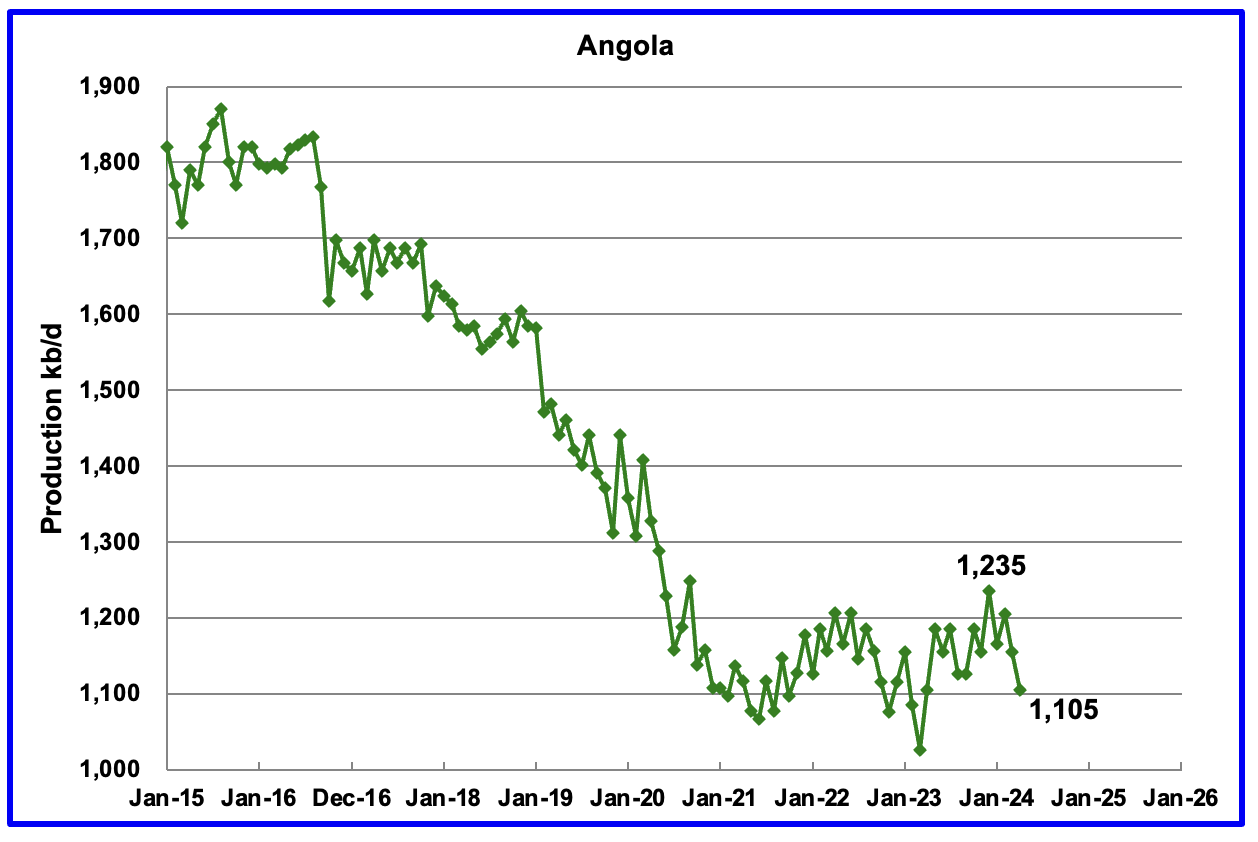
Angola has been added to the Non-OPEC producing countries since they withdrew from OPEC.
Angola’s April production decreased by 50 kb/d to 1,105 kb/d. Angola’s production since early 2022 appears to have settled into a plateau phase.
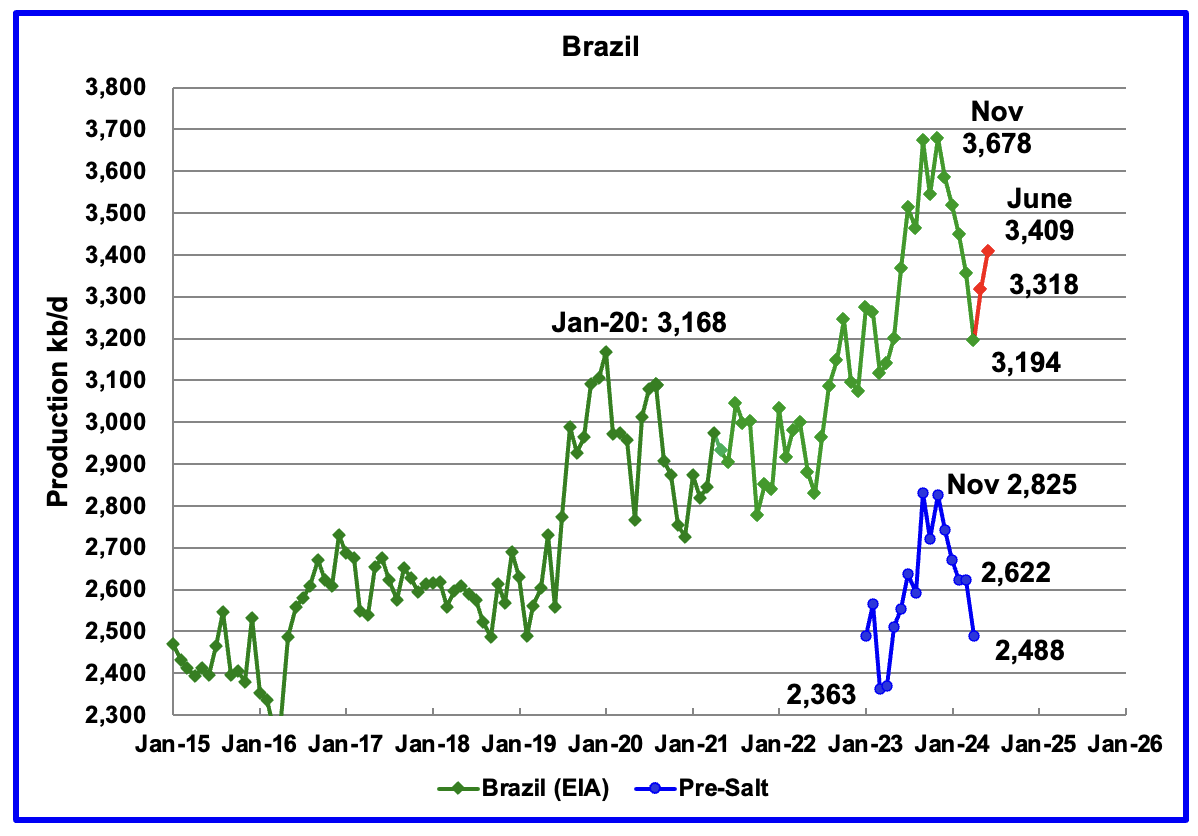
The EIA reported that Brazil’s April production decreased by 162 kb/d to 3,194 kb/d.
Brazil’s National Petroleum Association (BNPA) reported that output recovered in May and June to 3,409 kb/d. The BNPA has stopped updating the pre-salt production. The last report is for April.
The drop in production up to April was primarily due to extensive maintenance and production is expected to recover to previous levels going forward. According to OPEC: “The Brazilian state-controlled Petrobras FPSO unit, Maria Quiteria, is expected to start production in 4Q24 – earlier than previously expected – following its deployment at the Parque das Baleias integrated project.
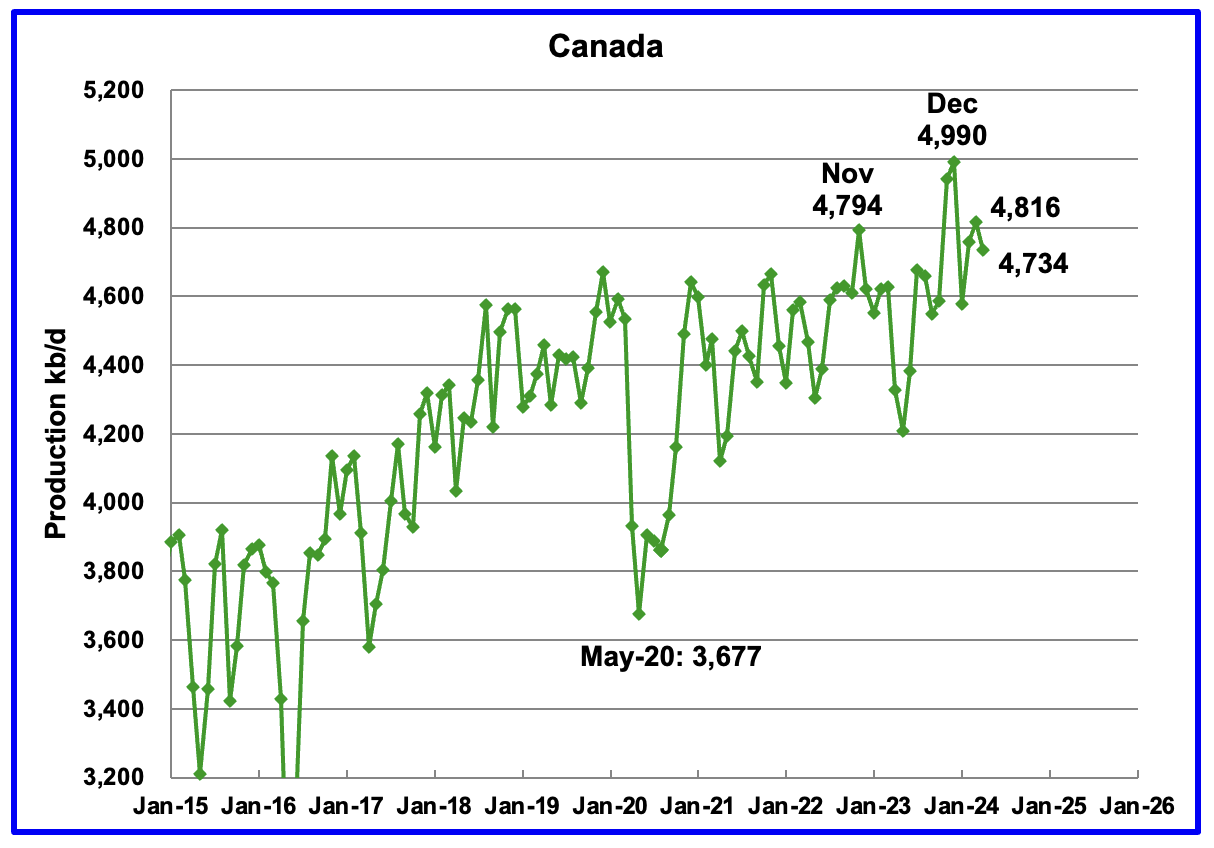
Canada’s production decreased by 82 kb/d in April to 4,734 kb/d.
The TMX pipeline received final approval to operate on May 1, 2024. The line is currently operational and no problems have been encountered. The heavy oil discount that Canadian producers were expecting has materialized in the $13/b to $14/b range according to this article.
The discount on Western Canada Select (WCS) heavy crude versus the North American benchmark West Texas Intermediate (WTI) narrowed on Wednesday:
* WCS for September delivery in Hardisty, Alberta, settled at $13.35 a barrel below WTI, according to brokerage CalRock, having settled at $13.60 a barrel under the U.S. benchmark on Tuesday.
* Exxon Mobil restarted select units at its 251,800 barrel-per-day refinery in Joliet, Illinois, three weeks after it lost power following a storm. Joliet is a major consumer of Canadian heavy crude.
Fires in Northern Alberta continue to affect some oil production facilities.
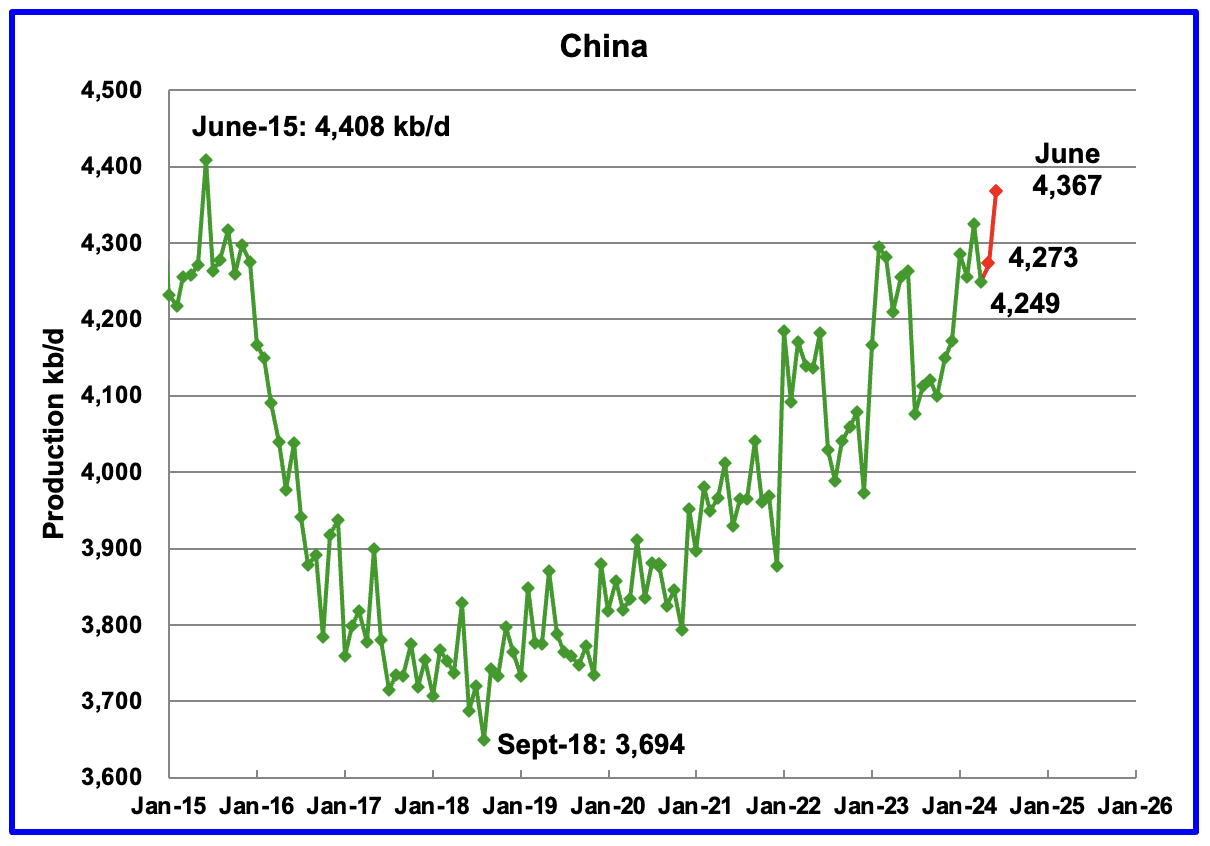
The EIA reported China’s oil output in April decreased by 76 kb/d to 4,249 kb/d.
The China National Bureau of Statistics reported production for May and June. May added 24 kb/d to 4,273 kb/d and June added 94 to 4,367 kb/d. June production is just 41 kb/d short of the previous June 2015 high of 4,408 kb/d.
According to OPEC, for 2024 “Natural decline rates are anticipated to be offset by additional growth through more infill wells and EOR projects. Chinese majors are set to maintain high upstream Capex in 2024 to meet the growth requirements stated in the 2019 Seven-Year Exploration and Production Increase Action Plan.”
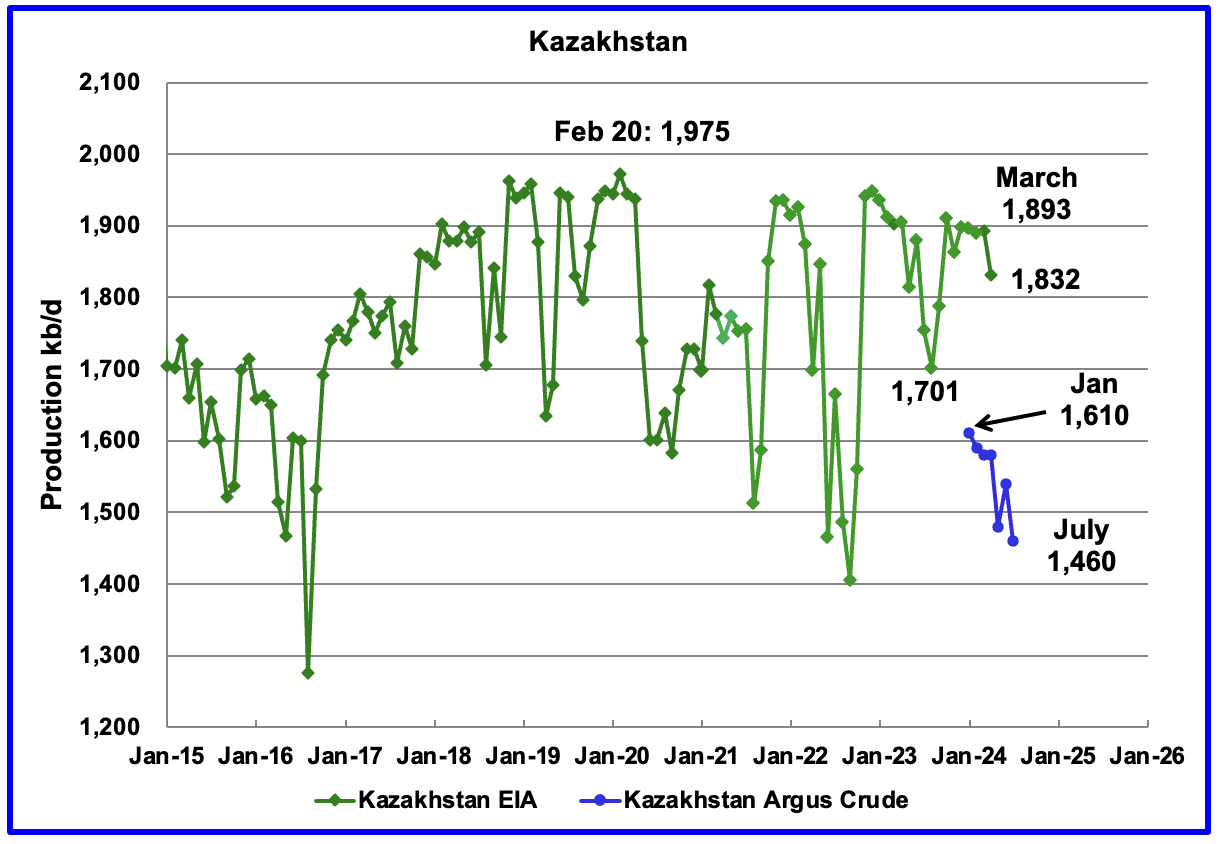
According to the EIA, Kazakhstan’s oil output decreased by 61 kb/d in April to 1,832 kb/d. Kazakhstan’s recent crude oil production, as reported by Argus, has been added to the chart. In July crude production dropped by 80 kb/d to 1,460 kb/d.
Kazakhstan and Iraq have been under pressure to reduce their production to comply with the OPEC + targets since oil inventories have not been falling as fast as expected. According to this source both countries will reduce their output. However according to this source the OPEC+ oil production cheats show little sign of making compensation cuts.
Since January, Kazakhstan crude production has dropped by 150 kb/d to 1,460 kb/d. Their target is 1,470 kb/d.
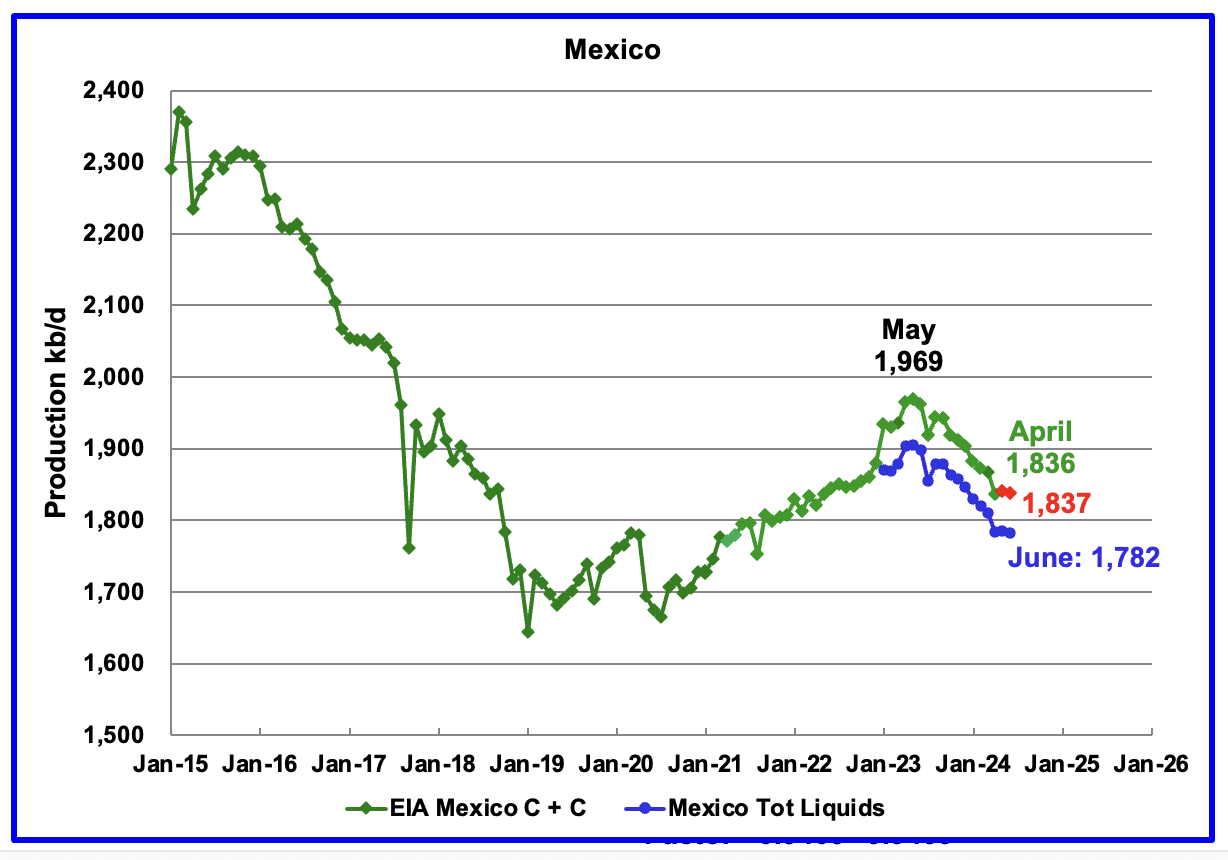
According to the EIA, Mexico’s output decreased by 32 kb/d in April to 1,836 kb/d.
For June, Pemex issued a new and modified oil production report for Heavy, Light and Extra Light oil. It is shown in blue in the chart and it appears that Mexico is not reporting condensate production when compared to the EIA report.
In earlier reports, the EIA would add close to 55 kb/d to the Pemex report. The gap between the EIA report and Pemex on average has been close to 55 kb/d over the last 6 months. Condensate of 55 kb/d has been added to the Pemex report to estimate Mexico’s June production of C + C 1,837 kb/d, red markers.
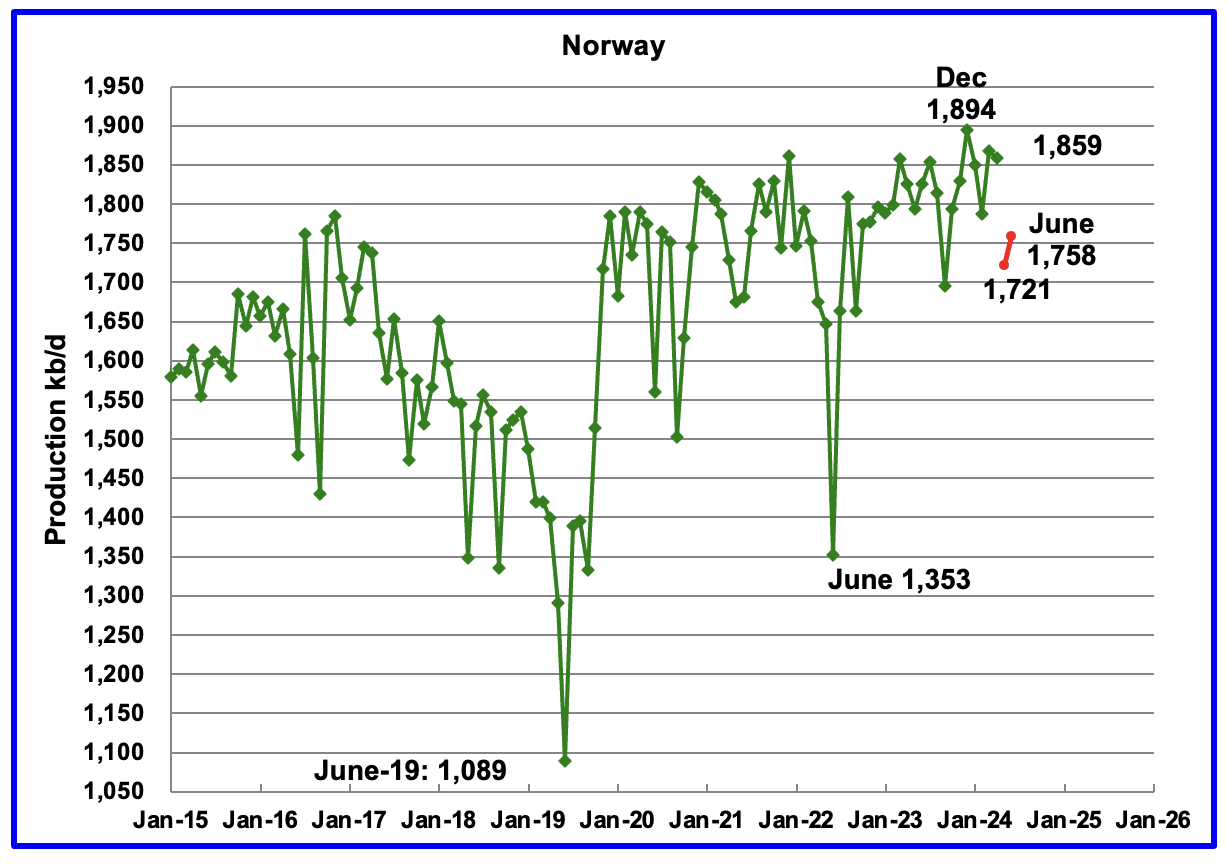
The EIA reported Norway’s April’s production decreased by 8 kb/d to 1,859 kb/d.
Separately, the Norway Petroleum Directorate (NPD) reported that May’s production decreased by 138 kb/d to 1,721 kb/d, red markers. June’s production rebounded by 37 kb/d to 1,758 kb/d.
The Norway Petroleum Directorship stated that June’s production was more than 0.5% above forecast.
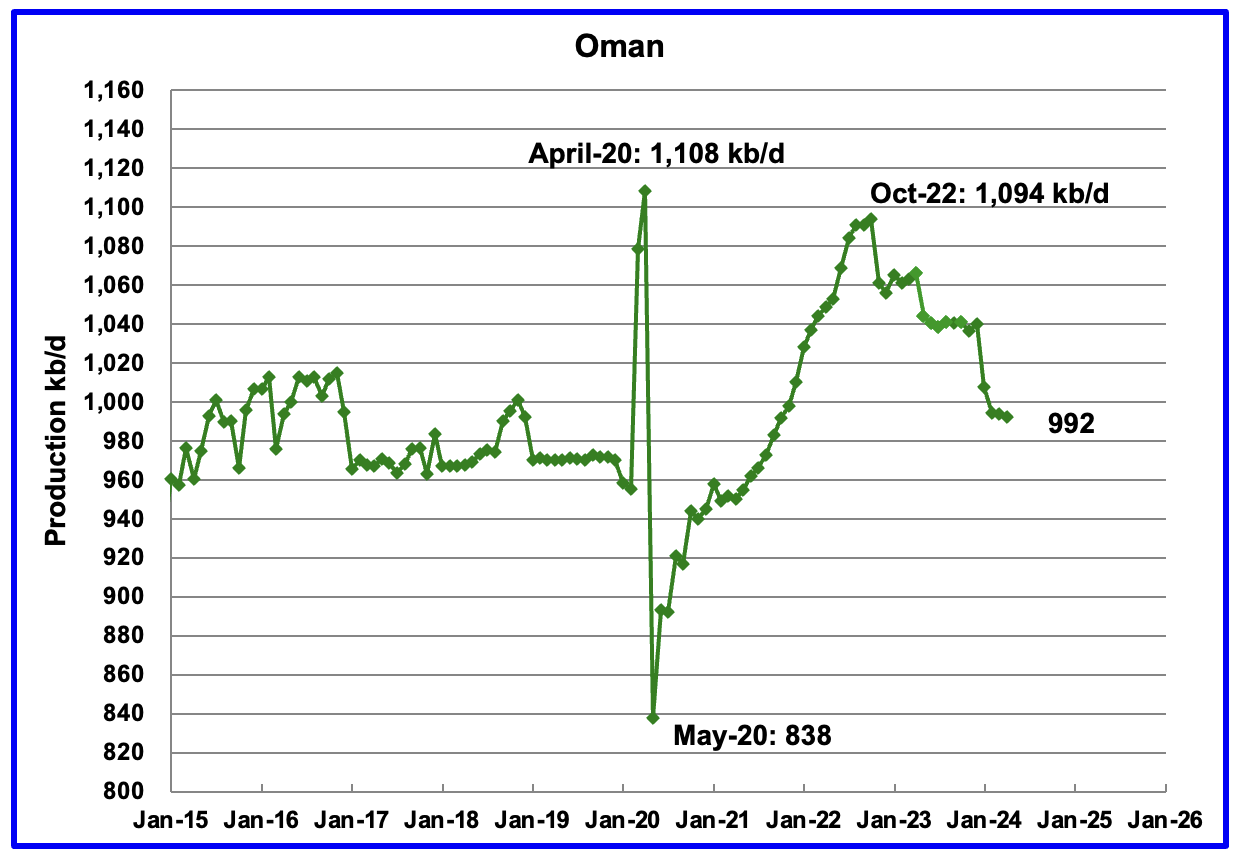
Oman’s production has risen very consistently since the low of May 2020. However production began to drop in November 2022. According to the EIA, April’s output dropped by 2 kb/d to 992 kb/d.
Oman produces a lot of condensate. The OPEC MOMR reports that crude production in June was 768 kb/d, 224 kb/d lower than the EIA’s C + C.
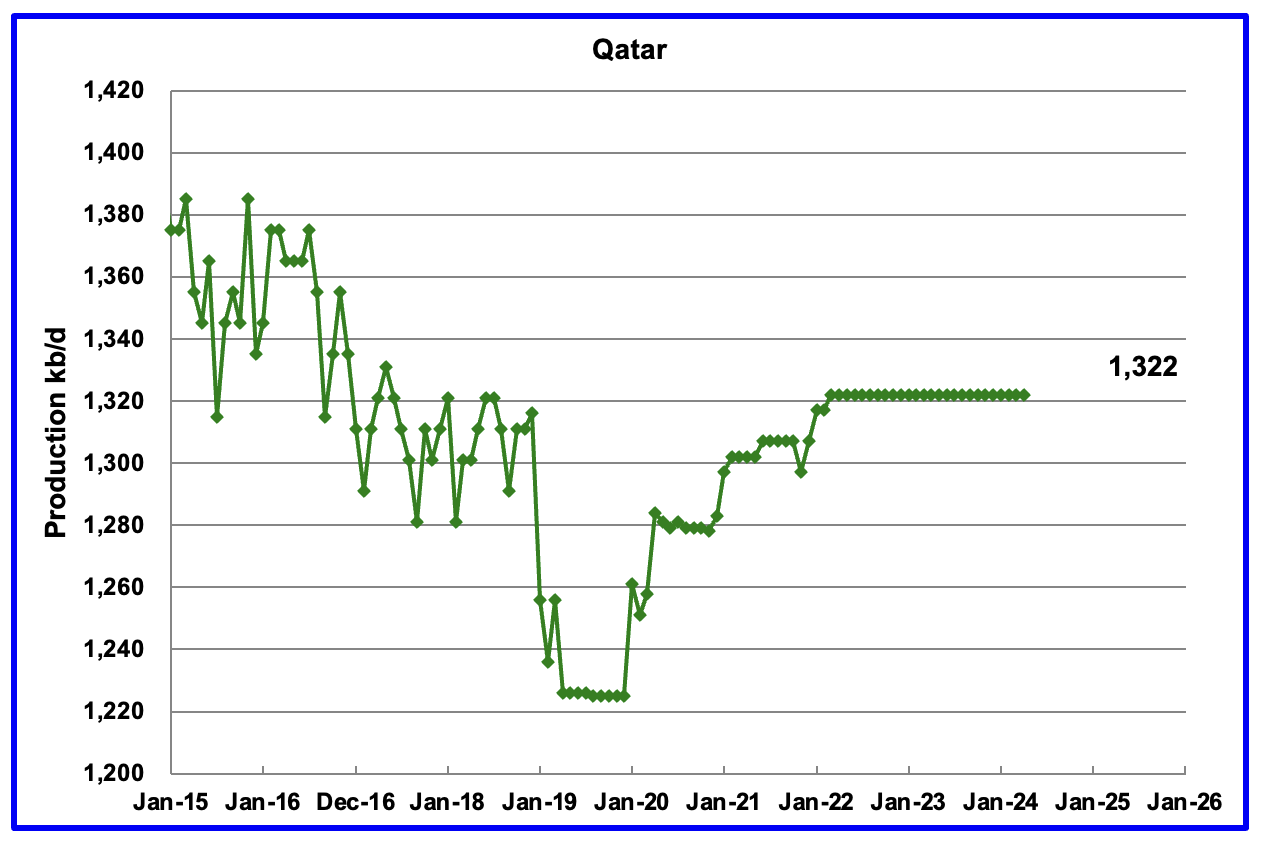
Qatar’s April output was unchanged at 1,322 kb/d, possibly due to lack of updated information.
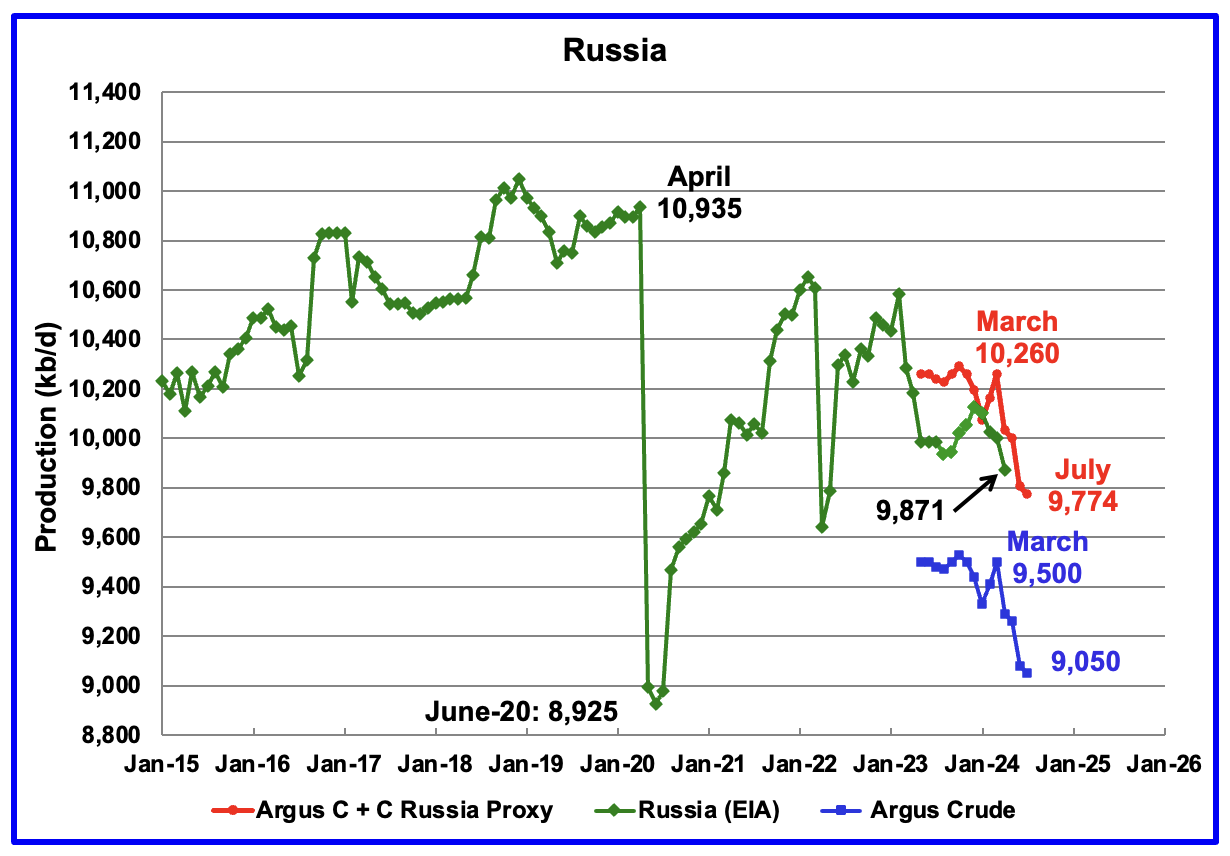
The EIA reported Russia’s April’s C + C production dropped by 130 kb/d to 9,871 kb/d.
Using data from Argus Media reports, Russian crude production is shown from May 2023 to July 2024. For July 2024, Argus reported Russian crude production was 9,050 kb/d, a decrease of 30 kb/d from June, blue markers. Adding 8% to Argus’ May crude production provides a C + C production estimate of 9,774 kb/d for Russia, which is a proxy for the Pre-War Russian Ministry estimate, red markers. Argus revised its previous June production estimate down by 60 kb/d from 9,140 kb/d to 9,080 kb/d.
In pre-war times, the Russia Energy Ministry production estimate used to be 400 kb/d higher than the EIA estimate. For April, the Argus proxy estimate is 192 kb/d higher.
“S & P Platts reports that Russian July crude production was 9,100 kb/d, unchanged from June. This is 50 kb/d higher than reported by the Argus report. For June, Platts is reporting Russian production as being 20 kb/d higher than Argus.
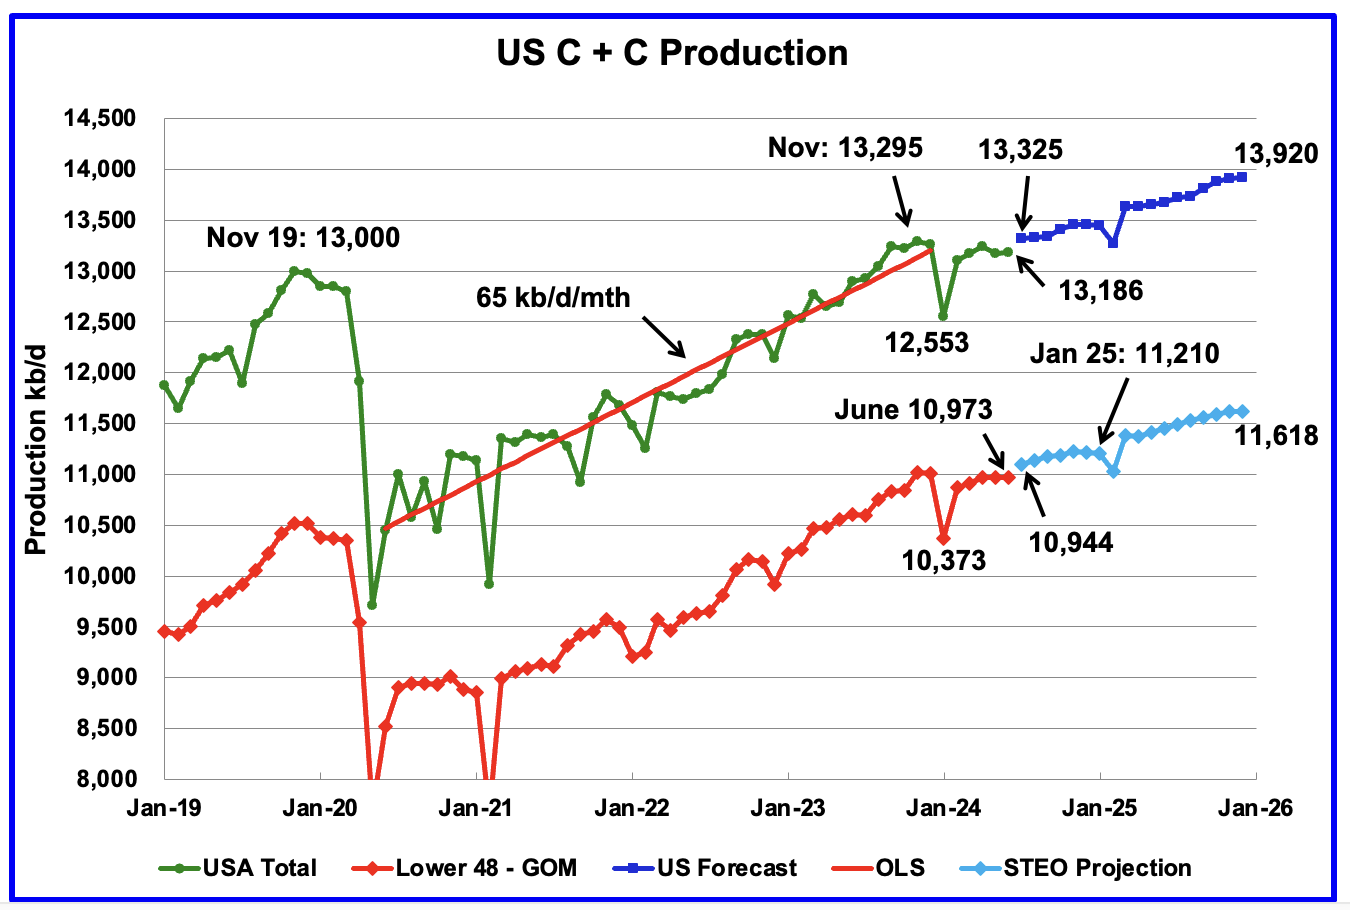
This chart is almost the same as posted in the US May update except that the light and dark blue graphs have been updated using the August STEO. After a small production increase of 10 kb/d in June to 13,186 kb/d, US production is expected to rise slowly till the end of 2025.
It seems that each STEO update increases US production for December 2025, especially the Onshore L48. However for this report, US production for December 2025 was reduced by 81 kb/d to 13,920 kb/d
For the August update, the STEO decreased Onshore L48 December 2025 production by 108 kb/d to 11,618.
76 responses to “April Non-OPEC and World Oil Production Drops”
Another great job Ovi!!
https://www.oilystuff.com/forumstuff/forum-stuff/don-t-forget-legacy-decline
Legacy decline!
Andre the Giant,
The legacy decline is included in my scenarios, not clear how the EIA does there models, my guess is that hey assume the rig count will increase in the future. No doubt Mr Shellman thinks rig counts will decline as core areas are fully drilled and producers move to the goat pastures where average well productivity is lower.
Scenario below assumes no wells completed after April 2024 so it represents legacy decline for Permian basin. Output falls by about 47% from April 2024 to December 2025.
Legacy decline about 2500 kbpd over 12 months for Permian Basin tight oil.
Mr Shellman estimates around 2700 kbpd so in the same ballpark for annual legacy decline for Permian basin in 2024.
I did not remember correctly Mr Shellman’s estimate for Permian Basin tight oil legacy decline in 2024, it was roughly 2400 kbpd, I also double checked my own estimate based on my model and get about the same as Mr Shellman, 2400 kbpd for tight oil legacy decline in the Permian.
https://www.linkedin.com/pulse/2024-best-year-yet-us-shale-productivity-novi-labs-l6cwe/
2024 best productivity?
Sheng wu,
Not when normalized for lateral length. Nobody is making new rock, longer laterals simply mean fewer potential new well locations, productivity normalized for lateral length tells us more. In addition the 2024 wells are more widely spaced on average which also suggests fewer potential new wells with high productivity.
Andre The Giant
Thanks, much appreciated.
I have been trying to track global legacy decline for 3 or 4 years now and occasionally post an updated chart. Let me be clear, the chart shows “Net decline = Increase due to drilling – gross decline”. To get a better idea of “gross decline” I chose 51 countries from the EIA international statistics that were small producers that didn’t do much infill drilling and countries that were showing a long term decline.
In the attached chart one can see that something happened to the declining trend post Covid. The OLS line from Jan 2008 to March 2020 has a decline rate of 416 kb/d/yr. The OLS line from May 2020 to April 2024 has a decline rate of 103 kb/d/yr. A 75% drop in decline rate.
Unfortunately I have no way to explain this difference. Maybe 4 years is too short a time frame. However a similar low decline rate in the pre-covid data is not obvious,
With the current production in those 52 countries close to 10,000 kb/d, the 103 kb/d/yr decline corresponds to a 1% annual decline rate. By most standards and reports this is a very low decline rate. Regardless this translates in to roughly 1,000 kb/d yr on a global scale. Recall though there is some “In fill drilling” in this data.
More pessimistic Permian scenario, but maybe not pessimistic enough for some.
This scenario combines short term optimism and longer term pessimism for Permian basin.
I need to predict oil prices more often to prove just how difficult it is. Lol!
It’s difficult to make predictions, especially about the future.
-Niels Bohr, or Yogi Berra
Shallow sand,
For the past year the price range for WTI has been $70 to 90 per barrel. Future probably 50 to 150,
Chevron delivers industry first in ultra-high pressure oil field
By Reuters
August 12, 202411:00 AM PDTUpdated a day ago
HOUSTON, Aug 12 (Reuters) – Chevron (CVX.N)
, opens new tab has achieved a technological breakthrough, producing first oil from a U.S. Gulf of Mexico field under extreme subsea pressures, the energy company said on Monday.
Its $5.7-billion project, called Anchor, ushers in an era of production from deepwater areas that had long been off-limits, because of the lack of equipment able to cope with pressures of up to 20,000 pounds per square inch.
Advertisement · Scroll to continue
Chevron and partner TotalEnergies (TTEF.PA)
, opens new tab expect the Anchor development to produce for 30 years.
At its peak, the floating platform will pump up to 75,000 barrels of oil and 28 million cubic feet of natural gas a day. The field is about 140 miles (225 km) off the coast of Louisiana.
“This industry-first deepwater technology allows us to unlock previously difficult-to-access resources and will enable similar deepwater high-pressure developments for the industry,” said Chevron Executive Vice President Nigel Hearne.
Advertisement · Scroll to continue
Another U.S. oil company, Beacon Offshore Energy, aims to replicate Chevron’s 20,000-psi feat at its Shenandoah deepwater field, also off the coast of Louisiana. That project has been delayed, with first oil expected in the second quarter of 2025.
BP (BP.L)
discovered the Gulf of Mexico’s first 20,000-psi field, called Kaskida, in 2006, but the subsea technologies of the time did not allow development. Until now, subsea technologies have largely been capped at pressures of 15,000 psi.
But last month, BP greenlit development of the field, citing new developments. It plans to leverage subsea equipment designs and achieve first Kaskida oil production in 2029.
Chevron’s development will have seven subsea wells tied to the Anchor floating production platform. The subsea field is estimated to hold up to 440 million barrels of recoverable oil and gas.
“This Anchor milestone demonstrates Chevron’s ability to safely deliver projects within budget in the Gulf of Mexico,” said Bruce Niemeyer, head of Chevron’s Americas oil and gas production.
The Reuters Power Up newsletter provides everything you need to know about the global energy industry. Sign up here.
Reporting by Gary McWilliams; Editing by Clarence Fernandez
Our Standards: The Thomson Reuters Trust Principles.
, opens new tab
Read Next
Exploration & ProductioncategoryIEA trims 2025 oil demand outlook as China offsets global gains
Grid & InfrastructurecategoryUS shale companies produce more crude using fewer rigs
Transport FuelscategoryOil falls more than $1 as attack fears fade
Grid & InfrastructurecategoryTalen focused on data center demand as it considers axing crypto business
SustainabilitycategoryUkraine approves $20 billion plan to increase renewable energy production by 2030
Sustainable MarketscategoryUS utilities poised to ride data center demand wave in second half
AD
AD
Oil Surplus Looms If OPEC+ Hikes Supplies, IEA Data Show Bold mine.
(Bloomberg) — Global oil markets are poised to swing from a deficit to a surplus next quarter should OPEC+ proceed with plans to boost supplies, data from the International Energy Agency showed.
Oil inventories are currently depleting as a result of peak summer driving demand, but should stabilize in the final quarter of the year, the Paris-based agency said in a report.
That would likely tip into an overhang if the OPEC+ cartel presses ahead with provisional plans to bring back idled output starting in October, the report indicated. Oil consumption in China, the biggest importer, fell for a third month in June, the IEA said.
“Despite the marked slowdown in Chinese oil demand growth, OPEC+ has yet to call time on its plan to gradually unwind voluntary production cuts starting in the fourth quarter,” according to the agency, which advises major economies.
Led by Saudi Arabia and Russia, OPEC+ has outlined a roadmap to revive about 543,000 barrels a day during the final quarter of the year, but stresses the plans could be “paused or reversed” depending on market conditions. A decision may arrive in coming weeks.
Crude prices have gyrated recently as the summer driving surge and concerns over escalating geopolitical tensions in the Middle East vie with signs of faltering economic growth in China. Brent futures are trading near $80 a barrel.
“For now, supply is struggling to keep pace with peak summer demand, tipping the market into a deficit,” the IEA said. “As a result, global inventories have taken a hit,” with stockpiles declining in June by 26.2 million barrels.
‘Meaningful Shift’
Unusually, growing demand in developed economies such as the US has been compensating for slackness in China and other emerging nations, the IEA observed.
“A meaningful shift in drivers is becoming apparent,” the agency said. “The US economy, where one-third of global gasoline is consumed, has outperformed peers, with a resilient service sector buttressing miles driven.”
One third of all gasoline comsumed is consumed in the USA? I did not know that.
That relative excess gasoline consumption (since US is about 4% of global population) is astounding.
I suppose it reflects the idea that we have lots of excess wealth to spend on driving around. Other people seem to be able to live with dramatically less transport fuel.
Believe it or not, people can also live without flying around. At all.
The US is not a nation that is going to take too well to driving around less, given you guys literally built whole cities around the automobile. Europe has shorter distances to travel and more public transport at least, although even that is failing given defunding in some nations due to cars.
No question: the US is a traffic shithole. I don’t travel largely for that reason. Our road used to be a quiet country road. Now it’s hideous, full of ugly, noisy pickups driven by republicans. Peak oil can’t come fast enough to suit me, but Dennis’s forecasts appear to portend that I’ll be dead before TSHTF.
Google AI says it’s 43%. It’s “Car Week” here in Monterey County. Thousands of Maseratis Bentleys and Ferraris. Driving as fast as they f*cking can between stop signs 100 meters apart.
I posted about this some time back but in a different metric. The US consumes about 1 million tonnes of gasoline per day -or 360 million tonnes per year. The gasoline global production is still just over 1.1 billion tonnes, so the US is about 1/3 of the global production.
The US is not the worst per Capita in terms of barrels of oil per Capita. For that you have to go to the middle east where energy profligacy is worse.
The EU inc UK consumes about 80 million tonnes of gasoline per year with a bigger population of about 1.5x US and slightly smaller land area depending what is included. However the diesel consumption is about 240 million tonnes of which over 1010 million tonnes is for light vehicles. In spite of 4 years of BEV sales volumes becoming measurable, the current penetration of BEV cars in the EU is tiny. New BEV sales are around 15% of new cars sold. Needless to say volumes of gasoline and diesel have not changed noticeably, and in the case of gasoline slightly increased in 2023.( Obviously volumes dropped during Covid but quickly recovered)
Outsized gasoline consumption mostly down to the incredibly dumb city planning in America.
In DFW, cars are everywhere, all the time. It’s literally unbelievable. You would not even imagine that this much metal and fuel exists in the whole world.
Coming from Norway to the US, it’s just so much driving. Very little public transport. And the fuel efficiency driving of americans are terrible! Everyone speeds up and then brakes hard, even though there is a red light in front of them. I have been honked at so many times just for driving responsibly.
When we are back to horse and carts. america will have bigger horse teams and carts for sure!
And worst of all, people love idling. They start up their cars, and then sit watching their phones for 15 minutes or longer before they start driving!
How many new cars have the anti-idling instant ignition feature? Its been around for many years now
Hillside Spring
I hear what you are saying. But I also think one size does not fit all. The US and also Australia must have a relative higher rate of transportation consumption per capita due to the wast distances on land. In the 1890-1900s in South Dakota, not that long ago, Norwegian immigrants traveled from from their farms with horse and carriage forcing them to stay overnight just for shopping. All according to Edvard Hoem’s books regarding immigrants at the time. One of the big grievances in the books came from a saddle maker complaining about the future trends.
In that perspective, electric transportation with small vehicles or with public transport, can help a lot of places regardless of the infrastructure planed for. There is competition from sea transport or just the efficiency of long distance diesel trucking. Compact cities can be built, but suburbs are great to live in as well. Depends on consumption levels and quality of life overall. And what is the ability to pay for it all? A complex story.
“america will have bigger horse teams and carts for sure”
America has the largest coal reserves on the planet.
Hitler proved those can be liquified and start a war with them.
There will be no horse buggies in U S of A for a long time even if people are starting to melt.
North Dakota continues to decline. They were down 22,519 barrels per day, May to June.
Click on graph to enlarge.
Attached are two statements comparing the OPEC and IEA statements regarding demand growth for 2024.
IEA: “Demand is set to rise by less than 1 mb/d in both 2024 and 2025. This is largely unchanged from last month’s Report and far slower than last year’s 2.1 mb/d growth as comparatively lacklustre macroeconomic drivers come to the fore.”
So for 2024, the IEA is expecting demand growth of “less than 1 mb/d”
OPEC: “The world oil demand growth forecast for 2024 is revised down slightly by 135 tb/d from the previous month’s assessment to now stand at a healthy 2.1 mb/d, well above the historical average of 1.4 mb/d”
“In the non-OECD, oil demand is forecast to increase by around 1.9 mb/d, y-o-y, driven by China with support from Other Asia, India, the Middle East and Latin America”
So the comparison is between OPEC’s 2.1 mb/d vs the IEA’s “Less than 1 mb/d”
We will know shortly who is batter predictor because OPEC plans to start unravelling its cuts at the beginning of October. Let’s see if OPEC initiates the cuts are delays them to January 2025.
Ovi,
As I have said before, it seems OPEC may not believe the demand estimates in the MOMR, as they continue to hold back output. Their demand estimates seem to just be wishful thinking.
Though the same argument could be made about the IEA and EIA estimates and those agencies hope demand will be low and perhaps it won’t be.
Could be that the best guess might be the average of the 3. We can only speculate.
Dennis
The EIA and the IEA seem to agree that the demand increase for 2024 will be close to 1 mb/d. For Q3 and Q4, I think OPEC is betting on a big stock draw that will be filled in Q4 by OPEC’s first step in their reversal plan.
I think they will proceed with their first step, regardless the price for Brent. Whether the second step is taken will depend on the price for Brent.
What has upset the OPEC/Saudi plan is the close to 600 kb/d increase is Iranian production in 2023. I think the market has digested that increase because there was a small draw in July. Going forward Iranian production increase should slow compared to last year.
It will interesting to watch how it all develops over the next few months. Throw in the unexpectedly good US gasoline consumption numbers and we have a big puzzle to figure out.
Ovi and Dennis,
The big wildcard for demand is China. Their petroleum data is very opaque and the private tracking agencies are giving mixed reports. In the totality of data, however, it does look like China demand is hiccuping…
It’s a very big swing country. If demand growth is 4-5% – still low by historical standards – that’s 600-800 kbpd increment. However, if it is down 300kbpd as some estimate, then here’s you 1 Mbpd swing…
Kdimitrov,
Sounds reasonable, if the sales numbers reported for plugin vehicles is accurate it might explain some of the slower growth in gasoline demand in China. The reporting on consumption is delayed and often revised.
Kdimitrov,
China’s gasoline consumption growth slowed quite a bit after 2016 as shown on log scale chart below. Also from 2016 to 2023 the average annual rate of growth in gasoline consumption was only about 100 kb/d in China based on data from the Energy Institute’s Statistical Review of World Energy.
The average exponential annual rate of growth from 2005 to 2015 for China’s gasoline consumption was about 8.3% per year. The exponential annual growth rate from 2016 to 2023 was 2.6% per year.
Of course this could change in the future.
China population has peaked….population looks pretty well correlated with gasoline consumption.
Total population of China from 1980 to 2023 with forecasts until 2029-
Hickory,
From 2005 to 2019 there was a pretty good correlation between China’s population and gasoline consumption, but the relationship broke down from 2020 to 2023 (red markers in chart below with an R squared of 0.02 over that period for population vs gasoline consumption.) Also the relationship was very different from 1982 to 2001 when economic growth was not as rapid in China. Over that earlier period each increase of 1 million in population resulted in about a 2.4 kb/d increase in gasoline consumption vs the roughly 20 kb/d increase in gasoline consumption for every 1 million increase in population that occurred from 2004 to 2019.
Probably real GDP is a better indicator than population for this type of analysis.
I think it is wonderful that China has decided to fuel its cars with coal….indirectly of course. Leaves more gasoline for us in north america.
It is true that about 2/3rds of China electricity is from coal burning.
The comment points out that as petrol gets into permanent short supply that many countries will turn to coal to power electric vehicles unless they have other sources of electricity.
Like nat gas, geothermal, solar, nuclear, wind, and hydro.
The race is on.
Got grid?
China real GDP vs gasoline consumption 1994 to 2018
China population vs gasoline consumption
Now that population in China has peaked, and they are making/buying a lot of electric vehicles, we shouldn’t expect much if any growth in gasoline consumption in China going forward. Regardless of GDP trajectory.
China has about 35 years of coal left. They can ramp up the use of coal just so they can have EV’s. Sure their coal imports will increase dramatically over the next decade.
Coal to chemicals is big business also.
So how much of the world is depending on China producing what is needed to buildout solar, wind and battery technology to transition?
For most of the world the transition will be to poor. Not to EV’s
From a China point of view while for the 40 or so years they have been using their coal to keep their people employed manufacturing for the West. At some point that has to end.
The West might have exported its manufacturing base but China will run out of manufacturing capacity as coal reserves start to dwindle towards zero.
I’d argue that once diesel becomes scarce in supply. China doesn’t actually have 35 years of coal reserves left.
Only question is how much time. How much time before the big three oil exporters Saudi Arabia, Russia and the US oil exports go to zero. I think you have to readjust the coal reserves that are viable without the same amounts of oil inputs.
Let’s just say you could produce the coal without oil inputs. How much of the coal in place would have to be used to get it out of the ground and to market. You’d rapidly increase the burn rate without the oil inputs. Leaving way less than 35 years of coal reserves.
Hickory
It is true that about 2/3rds of China electricity is from coal burning.
https://www.carbonbrief.org/analysis-chinas-clean-energy-pushes-coal-to-record-low-53-share-of-power-in-may-2024/
More like about half. Of course this is May data and consumption is seasonal. But over the last 18 months they are averaging new solar installations at a rate of about 4 GW a week, so it is hard for other sources to keep up.
Annual 2023 result.
The CCP does much better than the west with wind and solar. They just mandate a constant wind speed and longer hours of sunlight. Having a command economy is a great benefit
I j t
Courtesy of Iran (via their Houthi proxies)-
“Tankers and container ships that have been avoiding the Red Sea route are set to burn additional 500,000 barrels per day (bpd) of fuel oil this year due to the longer alternative route via the Cape of Good Hope in Africa, commodity trading giant Trafigura has estimated.”
The Rig Report for the Week Ending August 16
– US Hz oil rigs were unchanged at 434 and are down 25 rigs from April 19. This week is tied with January 2023 when the count was 434 and rising after the Xmas break. It is up 7 from 4 weeks ago.
– The Texas rig count was down 3 to 231 rigs and is down 95 from January 2023.
– Texas Permian rigs dropped by 2 to 185 while the New Mexico Permian was unchanged at 101.
– In New Mexico, Lea has held steady at 50 rigs for the last 10 weeks while Eddy held steady at 50. Since March 29, the average number of rigs operating in the NM Permian has been 101 for the last 21 weeks.
– In Texas, Midland and Martin were unchanged at 18 and 30 respectively.
– Eagle Ford dropped 2 to 42.
– NG Hz rigs rose by 1 to 86. (Not shown).
Typo in EF graph. EF should be 42: -2 to be consistent with the text.
Frac Spread Report for the Week Ending August 16
The frac spread count dropped by 6 to 234 and is down by 22 from one year ago. It is also down by 38 spreads from March 8.
I don’t read this blog much anymore as I was not getting any return on my time but could not help but drop by and say “I TOLD YOU SO” once again. Nat gas is the future, there will be a transition to nuclear at some point, pipelines (MLPS) are up 20% this year. Expected increase in nat gas demand for data centers and LNG will keep them strong for the foreseeable future. Domestic Oil and and gas companies are helping “Make America great again”. It’s good to be the king👑
https://www.spglobal.com/commodityinsights/en/market-insights/latest-news/natural-gas/081624-grid-challenges-make-dedicated-gas-generation-best-option-for-data-centers-kinder-morgan
TT said:
Trying to snatch victory from defeat. There’s an obvious reason it was referred to as “Peak Oil” and not “Peak NG”.
Peak Oil.
Wasn’t the price of oil predicted to be over $200 by now.
http://theoildrum.com/node/3623
Didn’t you predict peak oil for 2014?
Saudi Arabia should have been down to 7 million barrels per day and U.S, down to 5.
The experts on theoildrum also predicted $15 and more for natural gas prices.
Loadsofoil,
Anything can be anything when dealing with economic game theory. Facts are as they are.
Reading some of the old comments posted on theoildrum has given pause for thought.
CERA was often castigated by the “experts” on theoildrum.
http://theoildrum.com/story/2006/11/15/83857/186
Looks like Daniel Yergin was right all along and there will indeed be a plateau in oil production lasting for 10 years. By the time global oil production starts to decline permanently, the number of electric cars being sold will have reached 60 to 70 million per year, making Peak oil irrelevant.
You don’t seem to understand that an uncertainty of 10 years is statistically inconsequential when considered in the context that the first oil well was drilled in 1859. There were those that said that the oil age would last for many centuries, yet you are saying that the estimate of it lasting 160 ± 10 years was way off? Hard to admit defeat, eh?
Pukite
Firstly many experts on theoikdrum predicted a peak around 2008 which is 16 years and counting.
http://theoildrum.com/node/3623
Secondly there is a vast difference between the prediction of a total liquids peak in 2008 at 87 million barrels per day falling to 78 in just 8 years and the actual reality of a plateau around 2030 at 110 million barrels per day.
Thirdly a C and C predicted peak in 2005 of 74 falling to 45 million by now simply showed up those who made these predictions as lacking real geological knowledge of the subject.
Having had conversations with you on the Oildrum I am not surprised you can’t except how wrong you were
The LOO said:
That’s psychological projection against your own knowledge inadequacy. Oil can be created from other sources, many of which require extra energy. No need to be under the illusion that the increase is coming from conventional crude oil sources.
Figure from: https://www.sciencedirect.com/science/article/abs/pii/S0306261921011673
> “Peak oil and the low-carbon energy transition: A net-energy perspective”
Its a really good article to read and re-read, in order to digest the implications-
“We determine the energy necessary for the production of oil liquids (including direct and indirect energy costs) to represent today 15.5% of the energy production of oil liquids [year 2021 publication], and growing at an exponential rate: by 2050, a proportion equivalent to half of the gross energy output will be engulfed in its own production.” !!!
The demise of The Oil Drum blog was partly because they couldn’t squeeze any more out of the symmetric bell-shaped Hubbert curve. The models in Mathematical Geoenergy and those used more frequently here take under consideration the fat tails in real data with uncertainty.
Right, oil isn’t even a great source of energy, which is why electricity is almost always generated with other methods. The oil industry thinks of itself as the energy industry. Rick Perry famously thought the Department of Energy (which he led) was mostly interested in oil. They are mostly interested in nuclear power.
Oil is primarily used as a method of storing energy in a moving vehicle. Oil competes with batteries, not with coal. For the time being, batteries don’t offer much competition, especially in larger vehicles. But batteries have moved from consumer electronics to lawn care products and two wheelers, and increasingly passenger cars.
If (or when) oil runs out, the question will whether it makes more sense to refill a battery or synthesize oil (or hydrogen or methanol) to store energy in vehicles.
Loadsofoil,
It was not only the folks at the Oil Drum that underestimated US L48 output. The chart below has the EIA’s AEO 2010 reference scenario for US L48 onshore output compare with actual data for 2007 to 2023. Many experts did not foresee the rapid increase in tight oil output back in 2008 to 2010, including the EIA, IEA, and OPEC.
Dennis
I concerned myself only with predictions by those on the Oildrum and how ignorant their responses were to CERA study.
The supposed experts on the Oildrum consistently made the most negative predictions about every oil producing country. The net result was the belief that by now global CandC production would have fallen to below 50 million barrels per day. They are not knowledgeable geologists they were just playing with numbers.
The real oilmen on the other hand were overcoming obstacles and working on solutions. The result being global oil production nearly double what the computer desk experts said.
Loadsofoil.
The point is that the experts at the EIA also got things wrong. If you want an oil man’s perspective try
https://www.oilystuff.com/
The owner of that blog has over 50 years experience producing oil as an independent oil producer in Texas, he does not think there is loads of oil, at least not in the US.
I agree many predictions at the Oil Drum were too pessimistic in hindsight. There were many different opinions and not all agreed that Hubbert Linearization was a useful tool for predicting future output.
It may be that demand falls more than supply in the future, sustained low oil prices would indicate that oil demand has peaked before oil supply, I expect this in the 2030 to 2035 time frame.
The truth is somewhere in between.
It’s kind of like saying “I’m not dead yet” or “the reports of my death are greatly exaggerated”
Congrats for being among the living, truly! But still…I doubt you’ll be the first person to live forever.
It’s like that.
The prediction was for an undulating plateau from 2030 to 2050, if we look at C plus C, the undulating plateau will likely be about 15 years from 2015 to 2030. It may be that electric cars reduce the need for crude by enough to avert catastrophe. Difficult to say, many, including the EIA underestimated how quickly unconventional resources would be ramped up back in 2007.
Ethiopia EV adoption is an interesting thing to watch-
https://www.cnn.com/2024/08/17/climate/ethiopia-evs-gas-car-ban-climate/index.html
Keep in mind that the country is on track to be the 10th biggest in 25 years.
And that they are in the process of bringing a huge amount of hydroelectricity capability on line.
And that they have no domestic oil…thus having a huge incentive to go strong towards electrification of transport. And they are.
I am pretty surprised that Ethiopia actually did implement this policy.
There are a number of benefits: People are not going to be accustomed to fossil fuel vehicles. Fewer electrical buses, taxis and cars can actually do the job in urban areas. I wonder if there are plans for long distance electrical transport and to what extent. Textile and assembly industries can run on electrical power. The fossil usage in agricultural, heavy transportation and comsumption of products made from fossil fuels can be a study case for how the energy transition can work in practise. Measuring benefits and weaknesses.
They had a big incentive, that being the cost of fuel importation.
Secondly, the wide availability of all sorts of EV models, from China in particular, made the policy viable.
Good additional points.
I think the assumption of Africans not being educated enough has to go. There is a large continent there, and they have education enough. The time of uneducted dictatorships ruling alone is fading away all the time.
Another Permian Sale
Oil producer APA explores $1-billion sale of Permian assets, sources say
APA’s move to offload the drilling sites comes as the Houston-based company looks to revamp its operations to focus on its shale operations, while attempting to reduce its $6.7-billion debt pile in part through asset sales.
The drilling assets are in different sub-sections of the Permian Basin, namely the Northwest Shelf, the Northern Shelf, and the Central Basin Platform in New Mexico and Texas. The sites produce more than 22,000 barrels of oil equivalent per day combined, of which roughly 60% is oil, the sources said.
I just want to add a retrospect comment regarding the oil price.
A lot of people were frustrated regarding the fluctuating oil price in the years from 2015-2020. The price was often too low and too volatile to plan for. I complained about it at the time and so did not surprisingly others (like shallow sands). The main argument was that it was inefficient in any sense to not have a stable oil price to plan for. And I must say the democratic administration delivered on that point exactly. Even if the dollar got too strong at times (which it could be argued it did outside the US), the oil price was stable above 70 dollars a barrel. The producers have costs and revenues in dollars, so a strong dollar is ok abroad. That was very beneficial for energy investments that we are now riping the fruits from. In the form of stability. A very unnoticed achievement for many maybe, but I don’t think it would have been possible without the support from the Biden administration.
Post COVID and post 2022 reaction to Russian invasion of Ukraine, it has been a stable and generally fair oil price.
One issue, gasoline is more expensive than it should be. Should be around $2.80 where I live, instead it’s $3.50. Crack spread has been higher.
I see WTI is currently below $72. So we are pushing towards the “too low” price.
As for us, we need $100 WTI sustained for quite awhile to drill. But we are old and conservative.
We shall see.
New posts are up
https://peakoilbarrel.com/short-term-energy-outlook-august-2024/
and
https://peakoilbarrel.com/open-thread-non-petroleum-august-21-2024/
I have just finished building this site http://peakoilchart.com with the help of which you can group the oil production of several countries. For example, here http://peakoilchart.com/peak-oil-chart?excluded=236.40.106 we can visualize the oil production plateau. The graph shows the total oil production with the exception of the USA, Canada and Iraq.
In addition to information about oil, you can also find information about gas, coal, electricity, for example, this graph http://peakoilchart.com/gas/production?tab=chart&excluded=236.182.105.45.13 shows the gas production plateau.
The site is currently only tested with mozila firefox, if problems occur with other browsers, please test with firefox.