By Ovi
All of the Crude plus Condensate (C + C) production data, oil, for the US state charts comes from the EIAʼs Petroleum Supply monthly PSM which provides updated information up to November 2024.
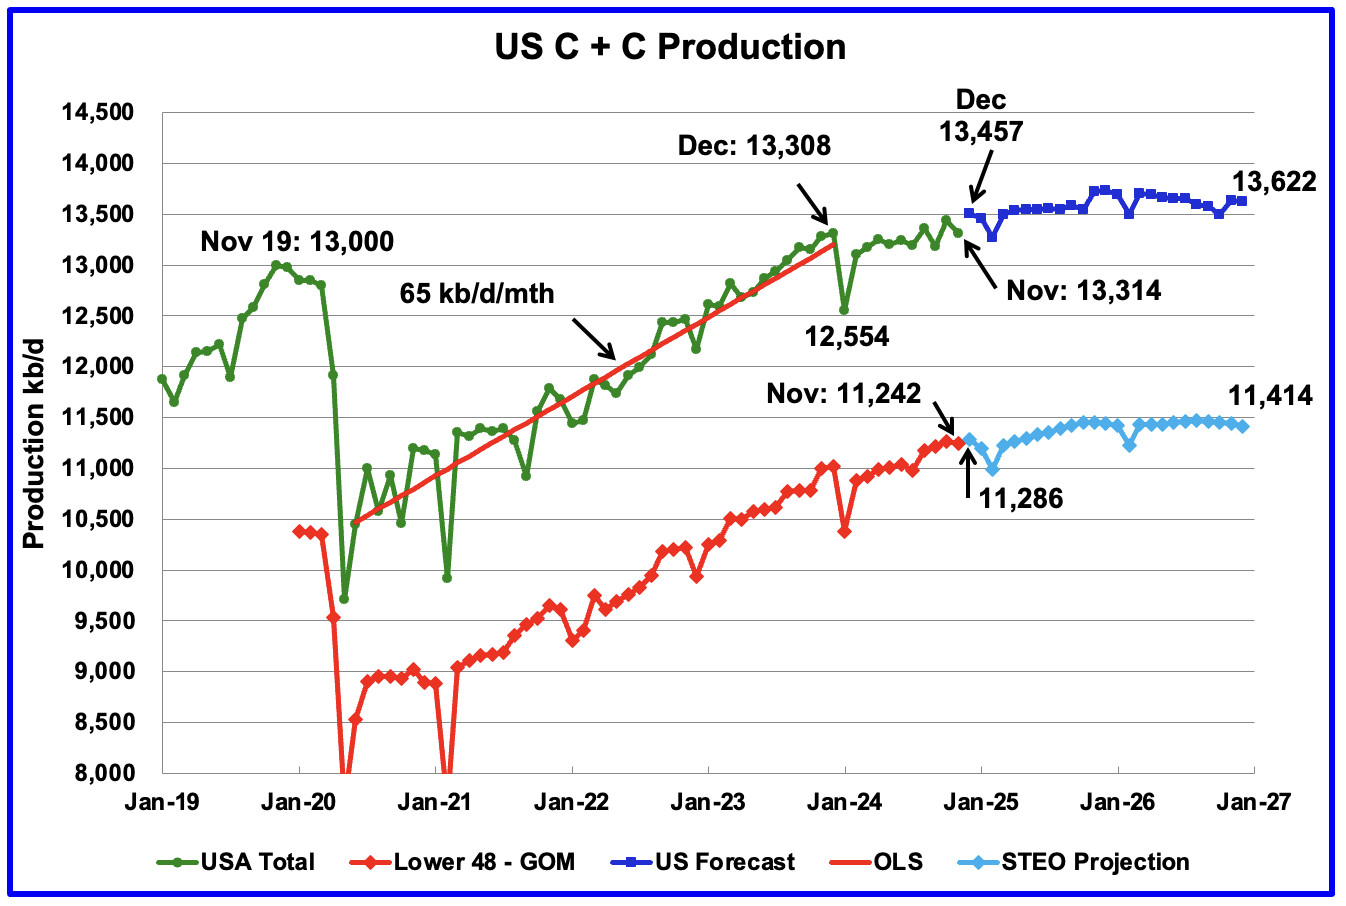
U.S. November oil production decreased by 122 kb/d to 13,314 kb/d, only 6 kb/d higher than December 2024. The largest decreases came from Texas, 70 kb/d, New Mexico 38 kb/d and the GOM 108 kb/d.
The dark blue graph, taken from the January 2025 STEO, is the forecast for U.S. oil production from December 2024 to December 2026. Output for December 2026 is expected to reach 13,622 kb/d. From December 2024 to December 2026 production is expected to grow by 165 kb/d. Most of the increase occurs in the last two months of 2026.
The light blue graph is the STEO’s projection for output to December 2026 for the Onshore L48. November Onshore L48 production decreased by 23 kb/d to 11,242 kb/d. From December 2024 to December 2026, production is expected to increase by 128 kb/d to 11,414 kb/d. Note how production is essentially flat starting in late 2025 to December 2026.
U.S. Oil Production Ranked by State
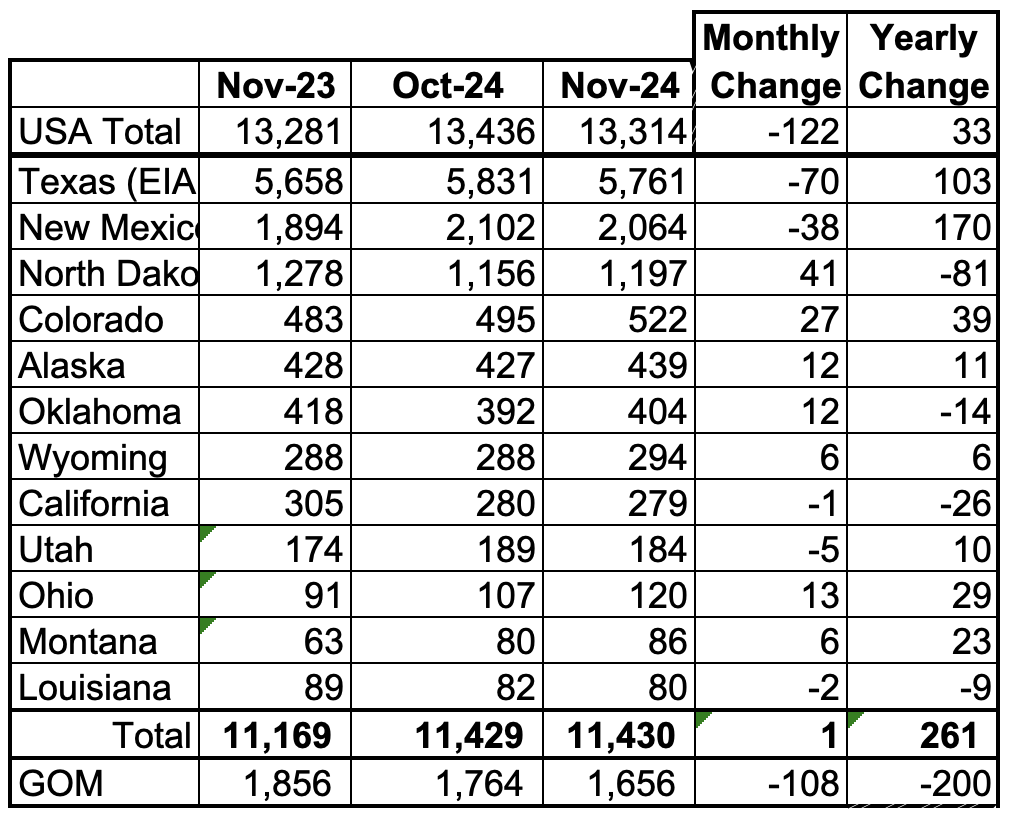
Listed above are the 12 US states with the largest oil production along with the Gulf of Mexico. Montana has been added to this table this month since its production exceeded Louisiana’s production and we wish to keep tracking Louisiana. These 12 states accounted for 85.9% of all U.S. oil production out of a total production of 13,314 kb/d in November 2024.
On a MoM basis, November oil production in these 12 states rose by 1 kb/d. On a YoY basis, US production increased by 33 kb/d.
State Oil Production Charts
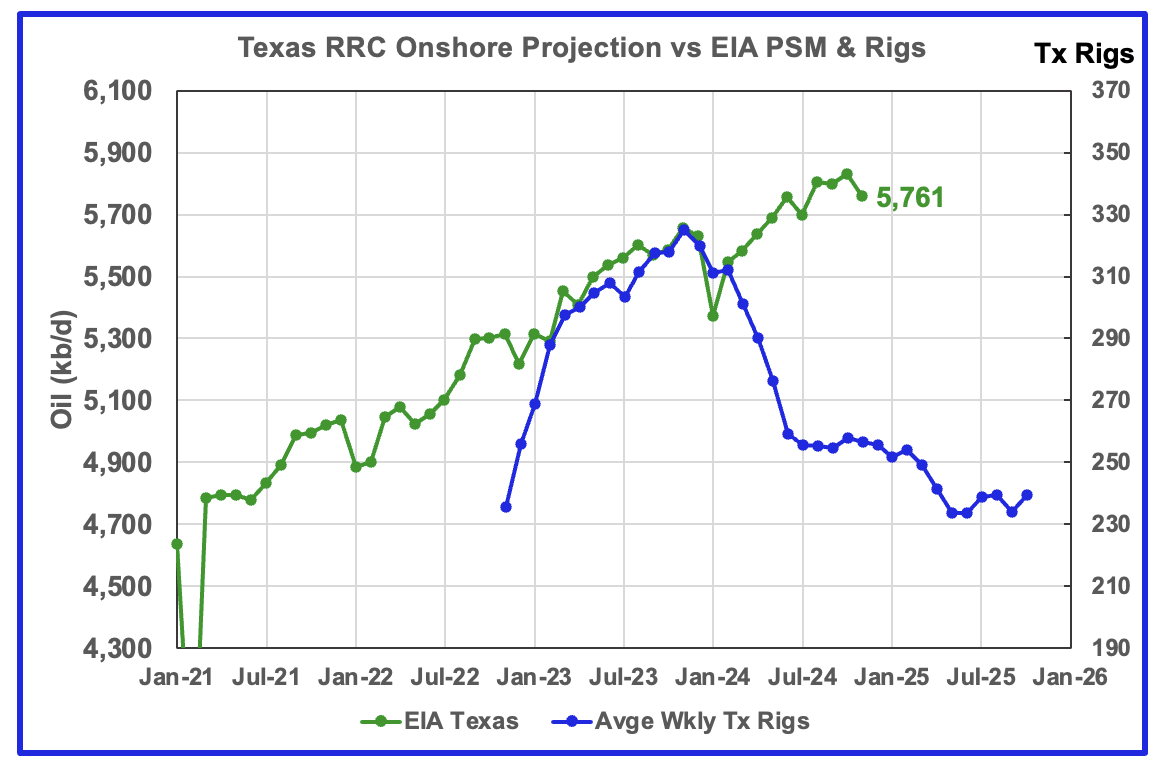
Texas production decreased by 70 kb/d in November to 5,761 kb/d. YoY production is up by 103 kb/d.
The blue graph shows the average number of weekly rigs reported for each month, shifted forward by 10 months. So the 276 rigs operating in July 2023 have been shifted forward to May 2024. From February 2024 to July 2024, the rig count dropped from 312 in time shifted February 2024 to 256 in July 2024. That drop of 56 rigs has had no impact on production up to now.
From February 2024 to October, production rose even though the rig count continued to fall. However November production saw a drop, similar to July’s. Is this the first indication of a slower growth period for Texas oil production going forward.
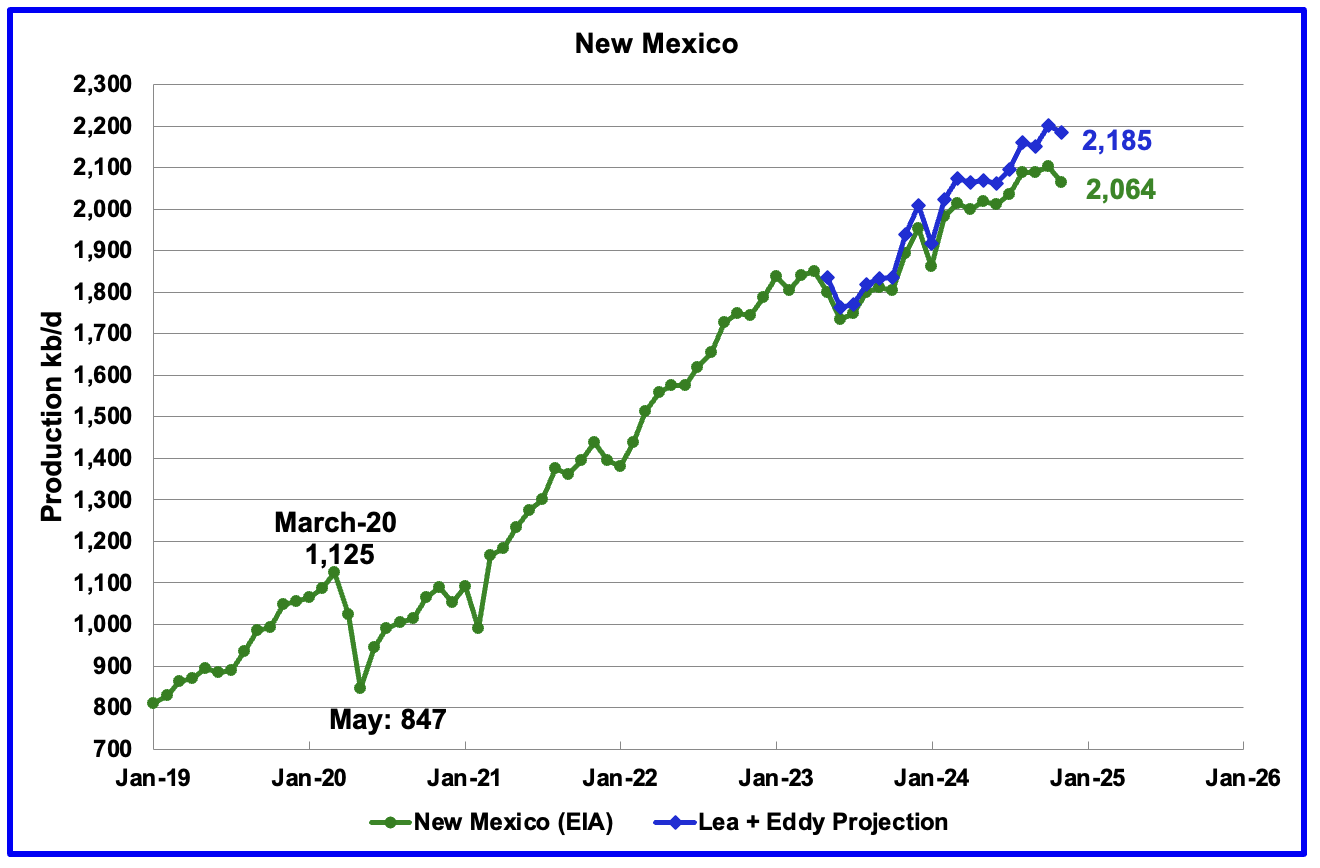
According to the EIA, New Mexico’s November production dropped by 38 kb/d to 2,064 kb/d.
The blue graph is a production projection for Lea plus Eddy counties. These two counties account for close to 99% of New Mexico’s oil production. The difference between the October and November preliminary production data provided by the New Mexico Oil Conservation Division was used to make the projection. A 1% correction was added to the Lea plus Eddy projection to account for their approximate fraction of New Mexico’s oil production. The projection estimates November production decreased by 17 kb/d to 2,185 kb/d. The decrease is related to a November production decrease in Eddy county and is discussed further down in the Permian section.
Note how the four blue markers parallel the green markers at the beginning of March 2024. Lea County updated their production back to January 2023 which caused the projection to shift away from the EIA’s production. The gap between those four markers is close to 60 kb/d. Note how the blue markers almost parallel the EIA’s production starting in March 2024.
More oil production information for a few New Mexico and Texas counties is reviewed in the special Permian section further down.
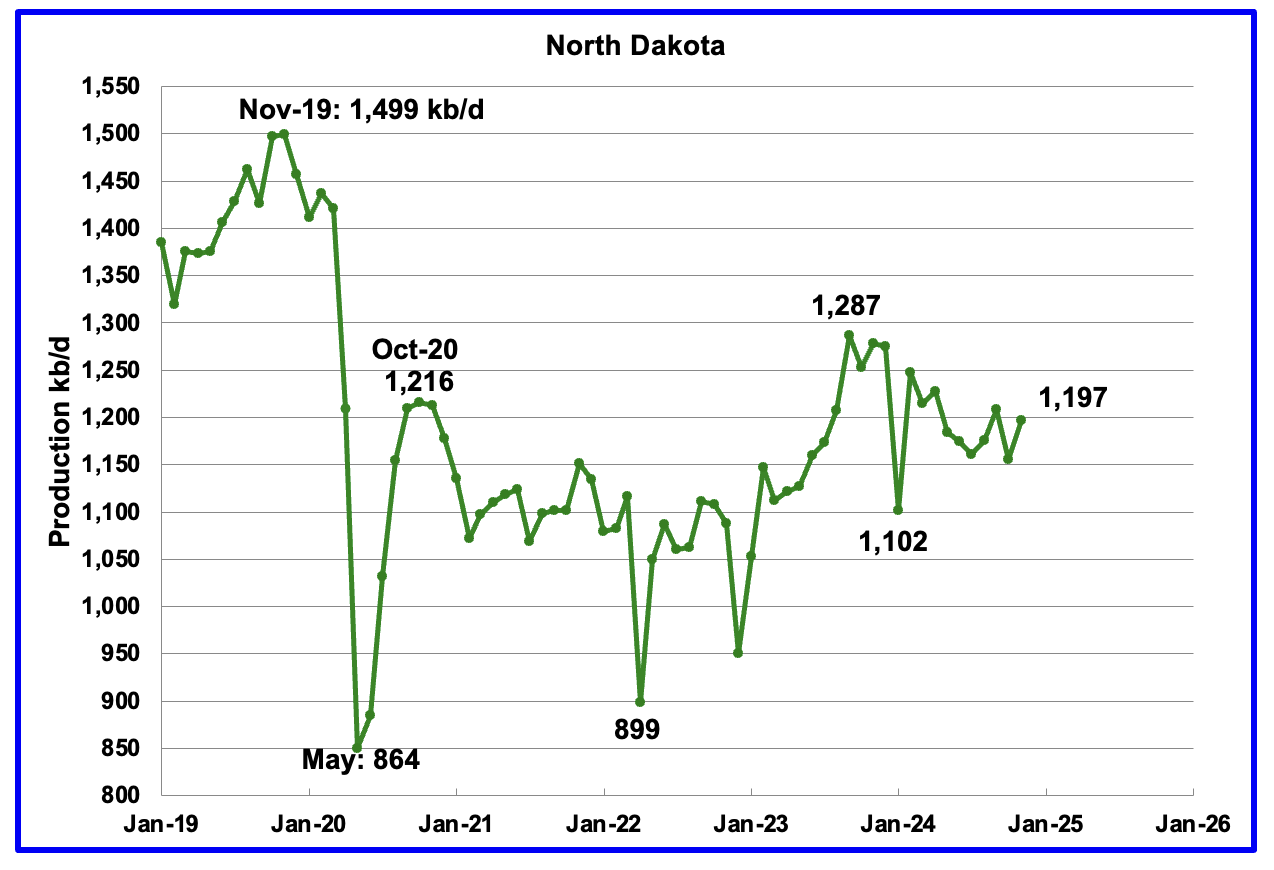
November’s output increased by 41 kb/d to 1,197 kb/d. Production is down by 90 kb/d from the post pandemic peak of 1,287 kb/d. The North Dakota Department of Mineral resources reported November production was 1,221 kb/d.
According to this article, the Director of the North Dakota Department of Mineral Resources expects oil production in the state to remain relatively steady for 2025 and the price of oil to remain steady for the near term.
“Anderson said he also expects the rig count and number of frac crews in 2025 to remain steady, with expected month to month fluctuations.
The rig count decreased slightly to start the year. He said a potential reason was related to the numerous mergers throughout the basin – new operators looking for capital efficiency gains.
“Mergers and acquisitions continue to occur, and it is expected that integrations of these companies will occur over the coming year,” Anderson said.“
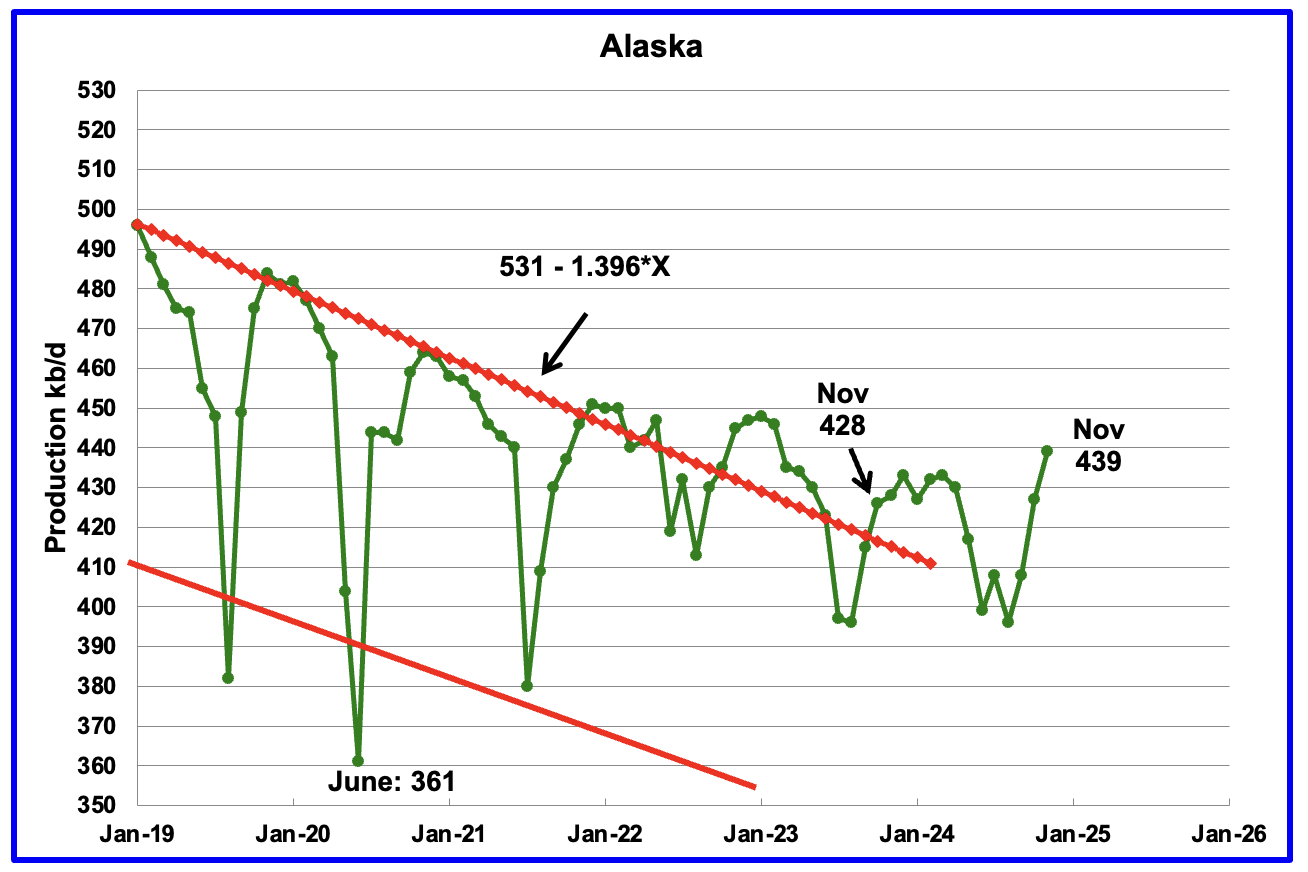
Alaskaʼs November output rose by 12 kb/d to 439 kb/d while YoY production rose by 11 kb/d. The increase in production is an indication that summer maintenance is complete and production is recovering. Average weekly November production from Alaska EIA reports are almost the same at 438 kb/d while December is approaching 436 kb/d.
The Alaska Department of Natural Resources reports production of 14.335 million barrels of oil or 478 kb/d vs the EIA’s 436 kb/d. The difference could be that Alaska is also counting NGPLs as part of oil.
Alaska must have brought new fields online to consistently have YoY and monthly production gains which have broken away from the earlier dropping production trend red lines.
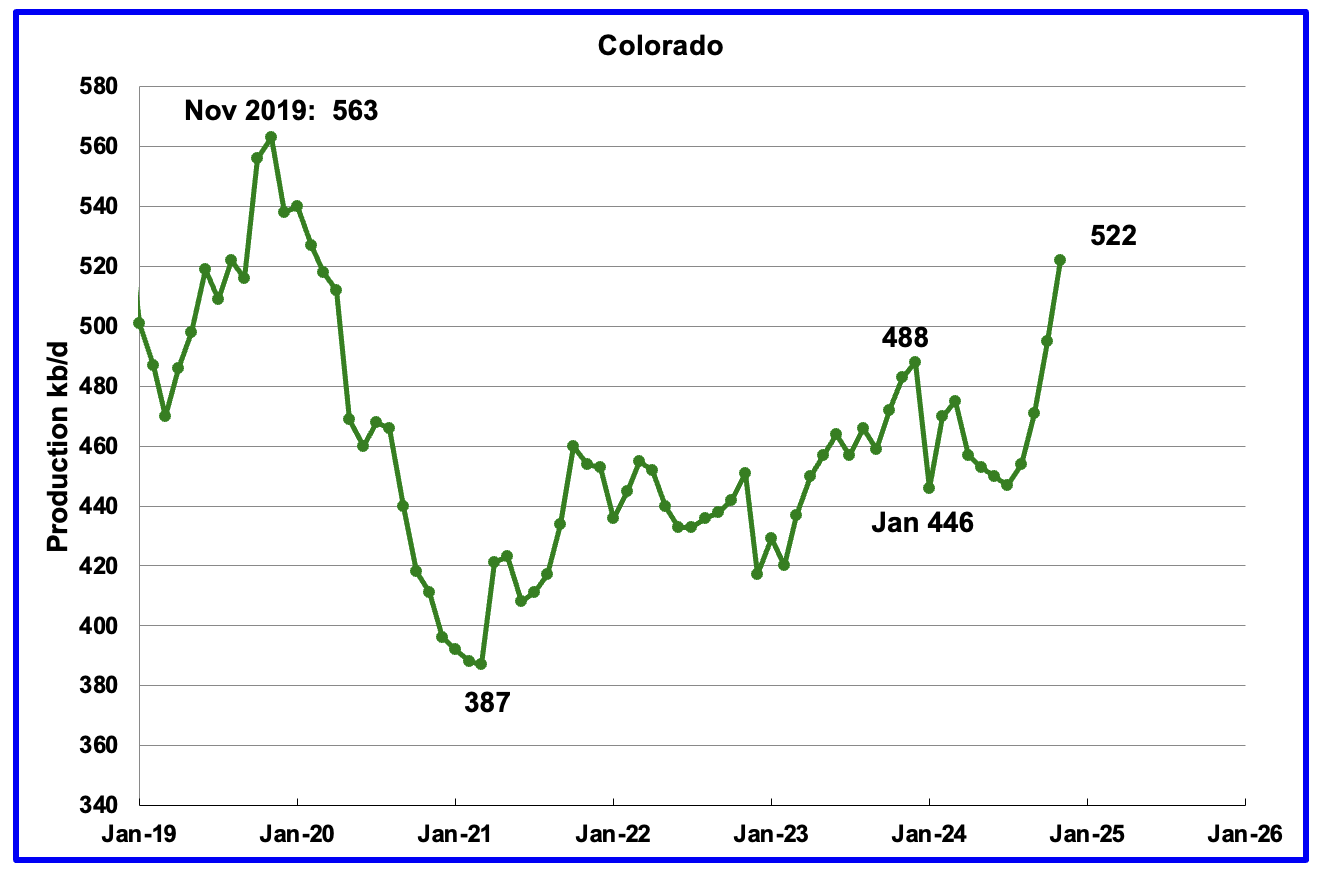
Coloradoʼs November oil production increased by 27 kb/d to 522 kb/d. Colorado began the year with 12 rigs but dropped to 10 during June, July and August and had 8 in operation October and November. In January only 6 rigs were operating. Will this slow the production increasing trend?
The majority of Colorado’s oil comes from the Denver-Julesburg (DJ) Basin located in Weld county, according to this Article.
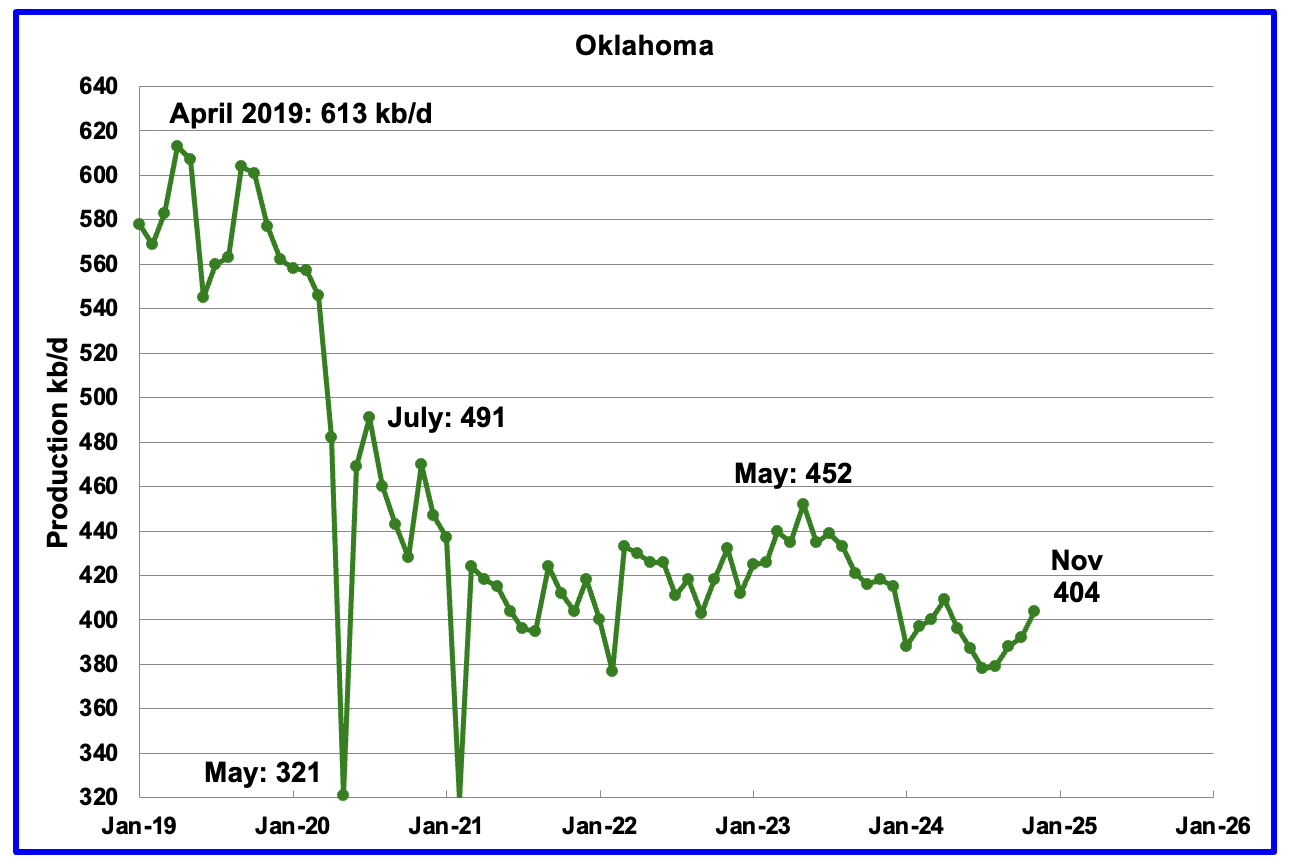
Oklahoma’s output in November rose by 12 kb/d to 404 kb/d. Production remains below the post pandemic July 2020 high of 491 kb/d and is down by 48 kb/d since May 2023. Output entered a slow declining phase in June 2023 but appears to be recovering.
Oklahoma’s rig count dropped from 40 in May to 30 in July. By the end of September 2024 there was an uptick to 41 operational rigs and has held steady at 41 from October to December. At the end of January there were 44 in operation. Will the increase in the rig count result in increasing oil production?
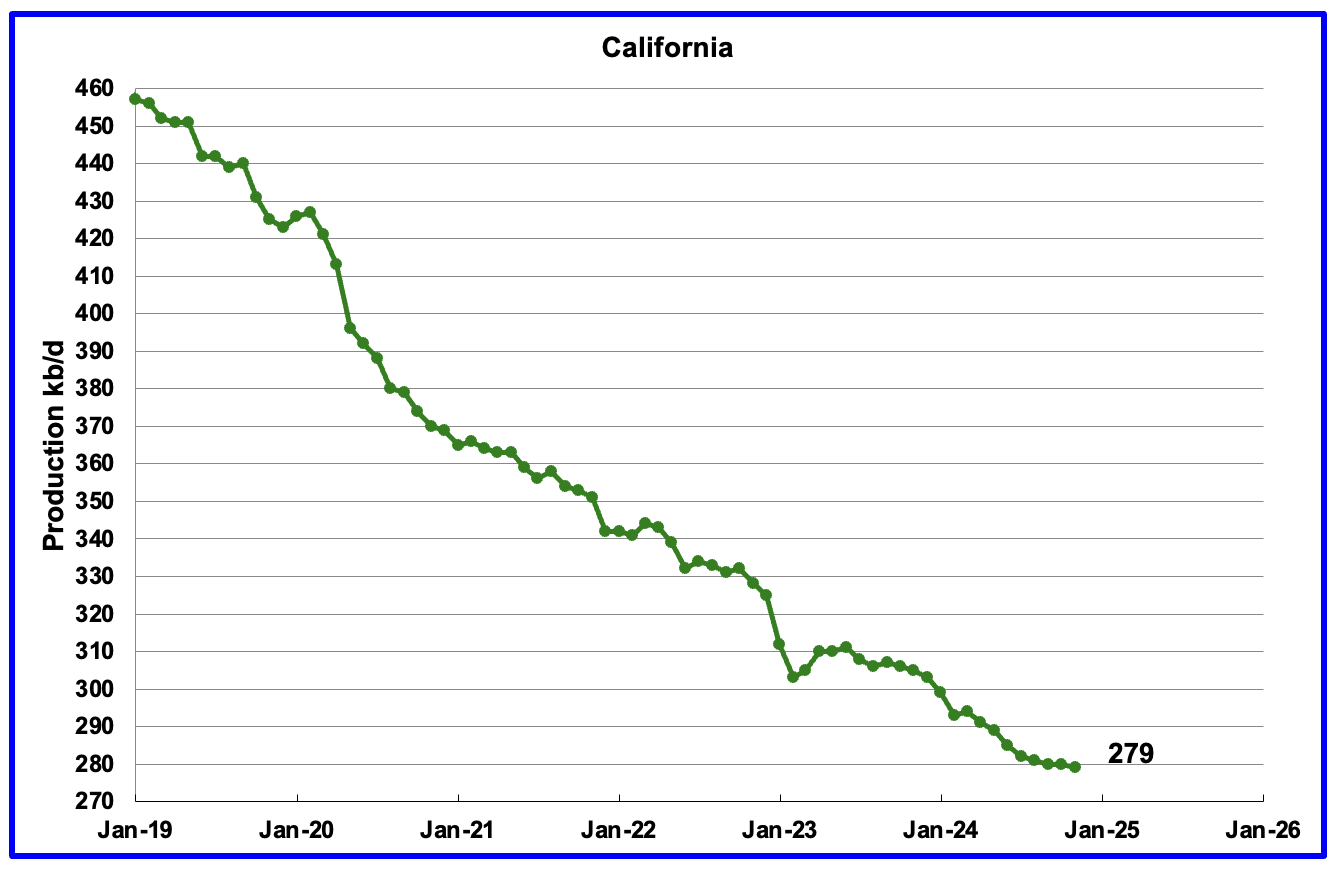
California’s declining production trend continues. November production dropped by 1 kb/d to 279 kb/d.
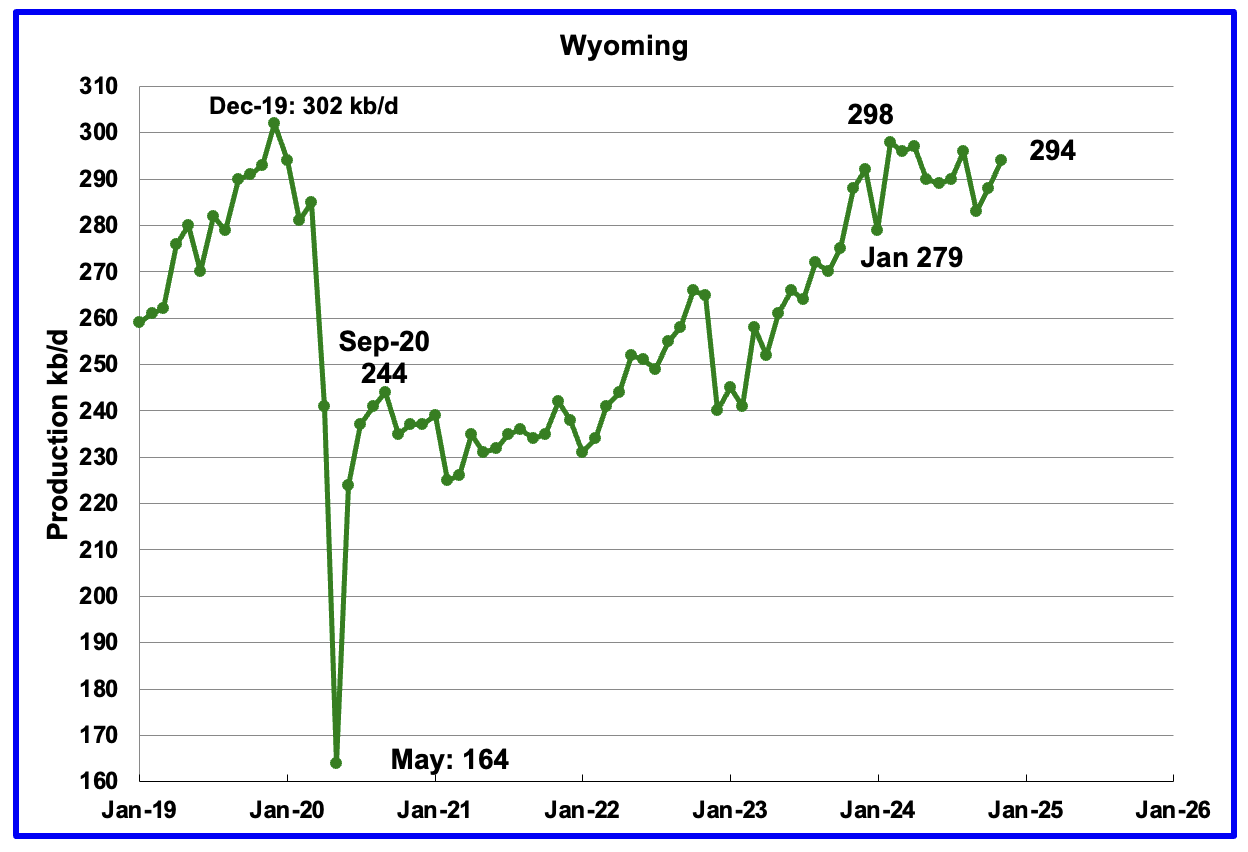
Wyoming’s oil production has been rebounding since March 2023. However the rebound was impacted by the January 2024 storm. Production peaked in February 2024 and is showing signs of being on a plateau.
November’s production rose by 6 kb/d to 294 kb/d. Note that production has almost recovered to the pre-Covid level of 302 kb/d.
In August Wyoming had 8 operational rigs. The rig count has slowly risen to 14 from November to January.
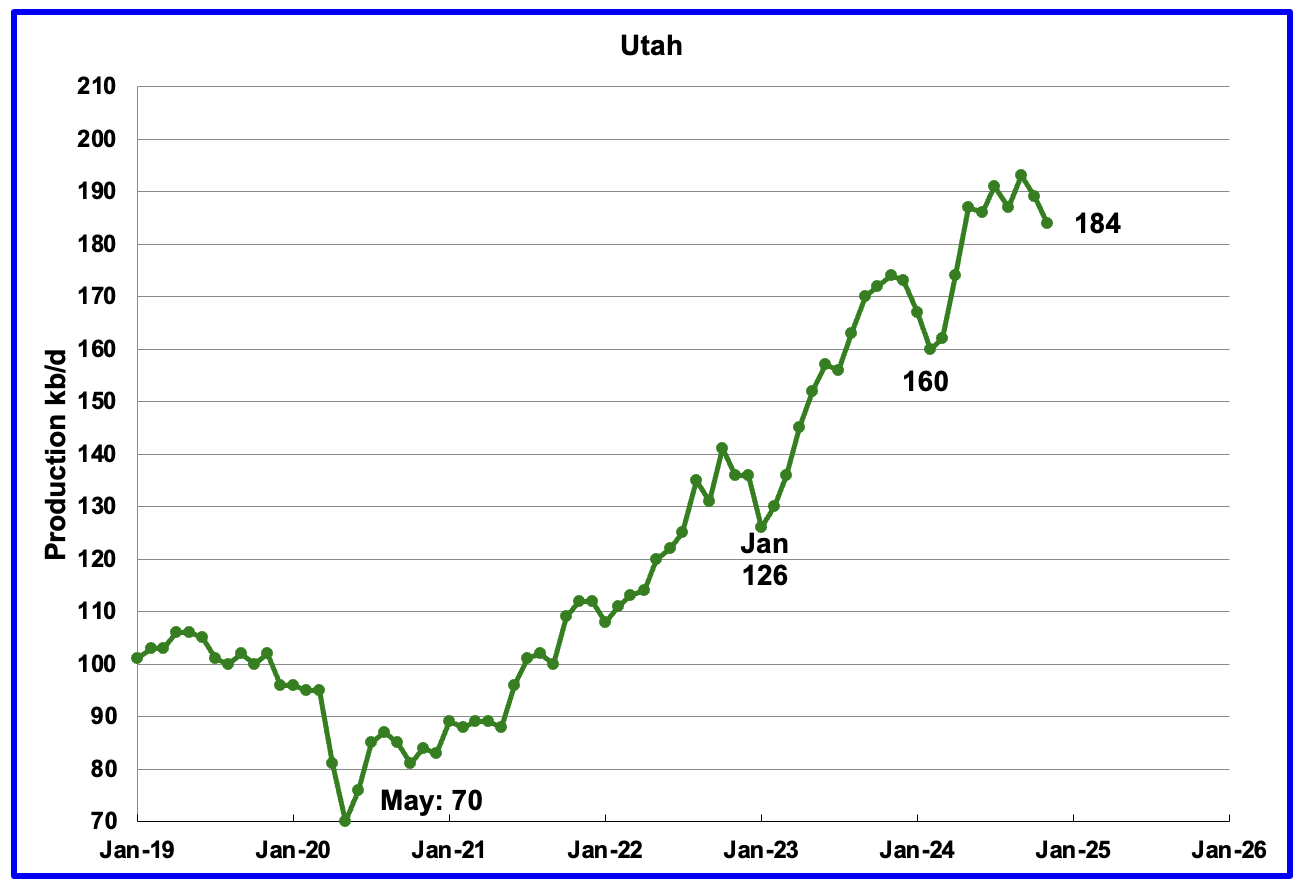
November’s production decreased by 5 kb/d to 184 kb/d. Utah had 9 oil rigs in operation from January to September 2024 but dropped to 8 in October through January.
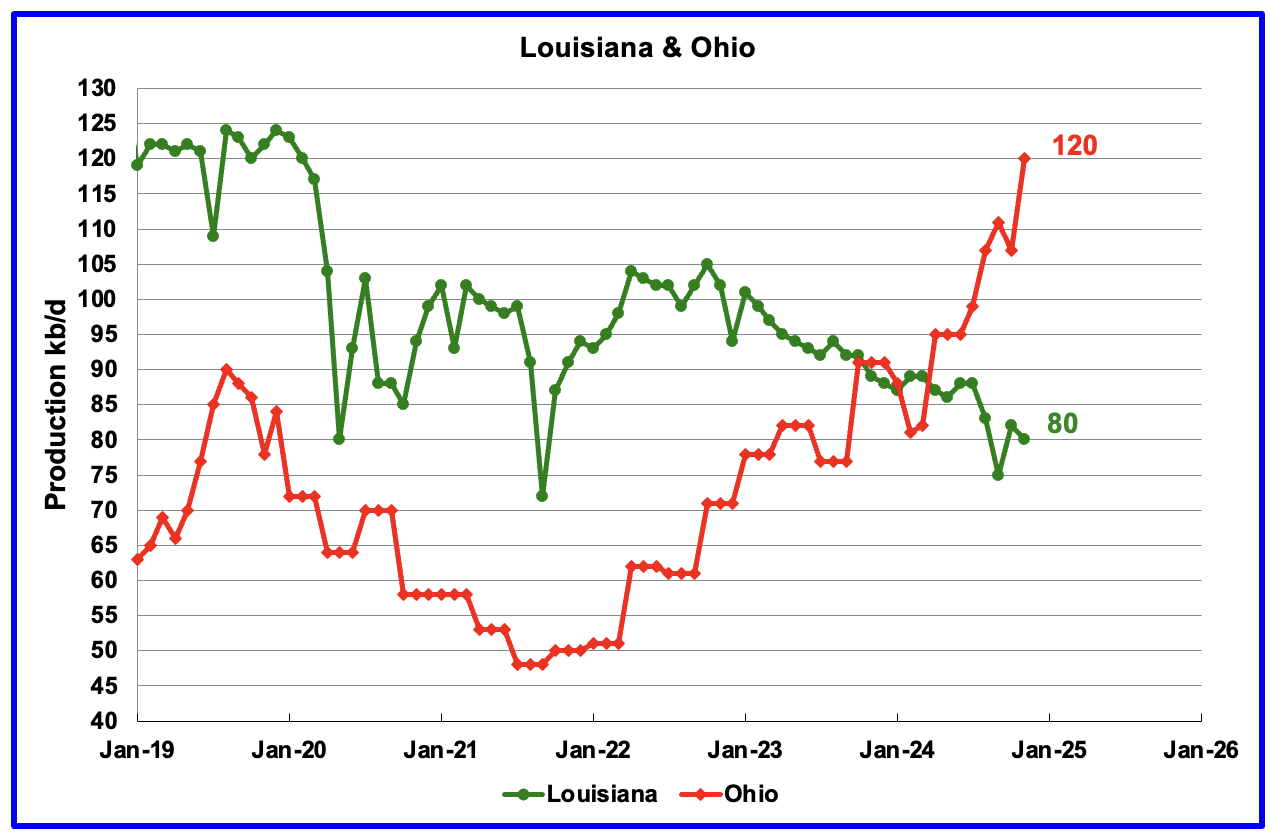
Ohio has been added to the Louisiana chart because Ohio’s production has been slowly increasing since October 2021 and passed Louisiana in November 2023.
Louisiana’s output entered a slow decline phase in October 2022 and has continued to fall in November. November’s production dropped by 2 kb/d to 80 kb/d. As of January there are no oil rigs operating in Louisiana. Anybody have any thoughts on this and can it be confirmed?
Ohio’s November oil production rose by 13 kb/d to 120 kb/d, a new record high. The most recent Baker Hughes rig report shows one horizontal oil rigs operating in Ohio in December and January.
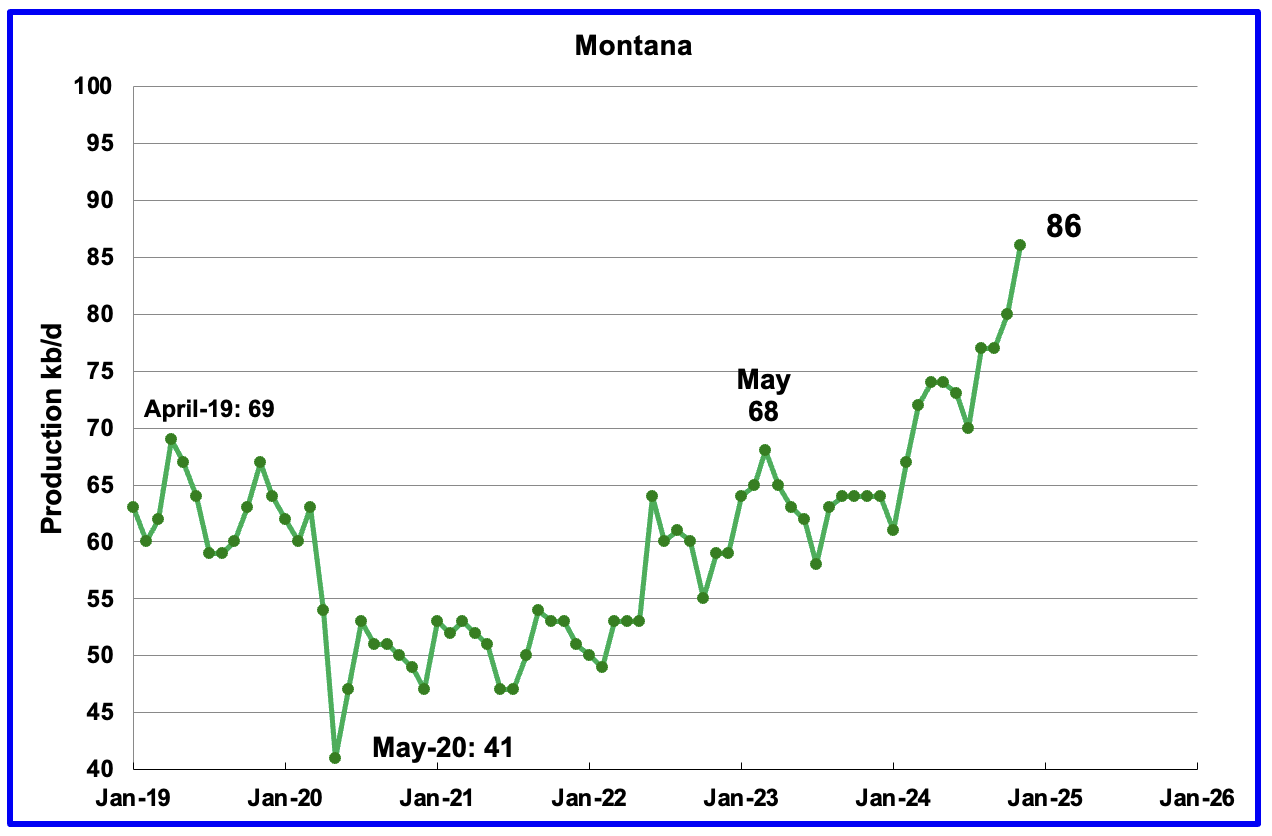
Montana’s oil production reached another new high and is possibly heading for 100 kb/d. November’s oil production added 6 kb/d to 86 kb/d and is now 6 kb/d higher than Louisiana’s.
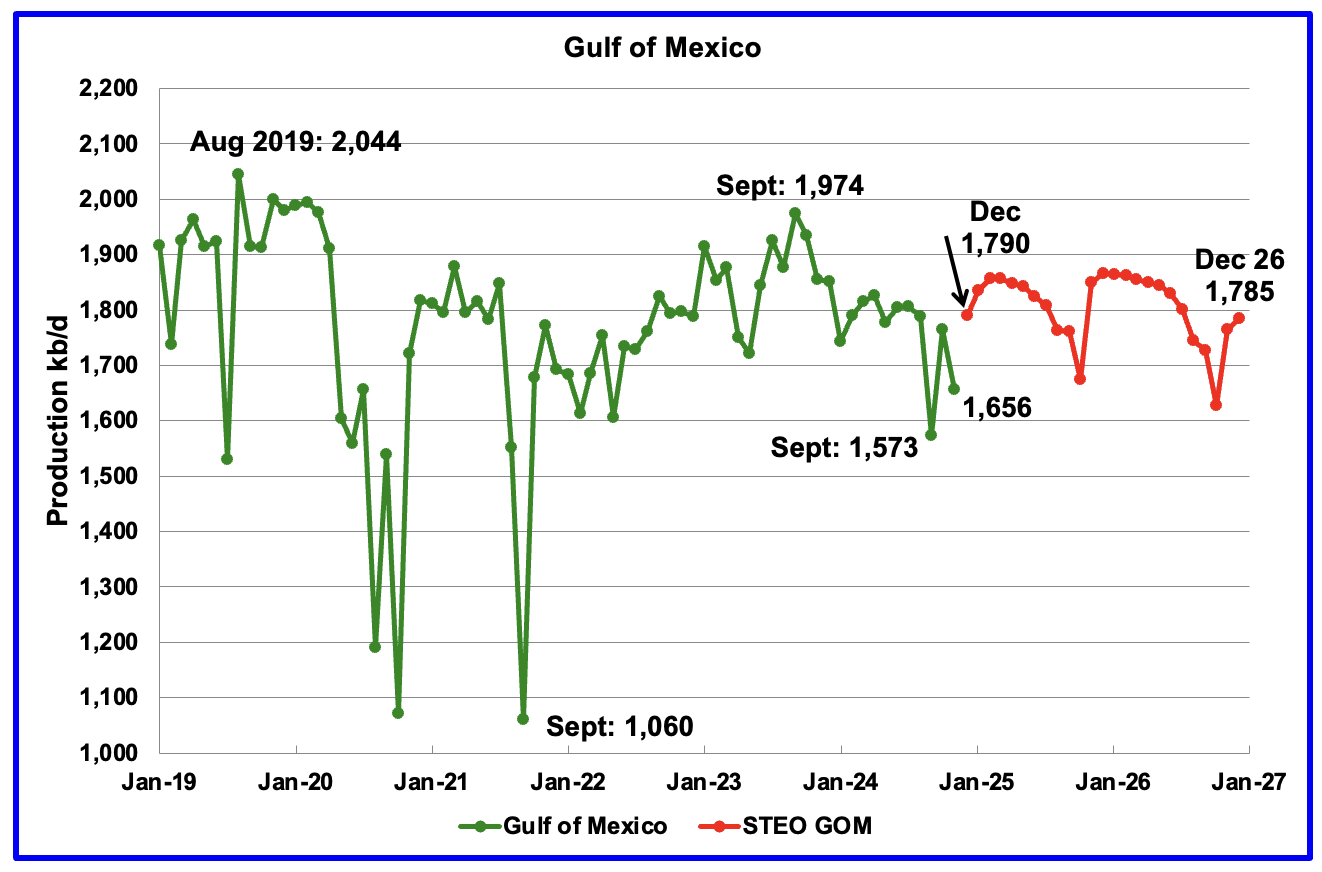
GOM production dropped by 108 kb/d in November to 1,656 kb/d but is expected to rebound in December to 1,790 kb/d. It is possible that November’s decrease is simply continuing maintenance issues associated with the September Category 4 hurricane Helene.
The January 2025 STEO projection for the GOM output has been added to this chart. It projects production in December 2026 will be 5 kb/d than December 2024 at 1,785 kb/d.
A Different Perspective on US Oil Production
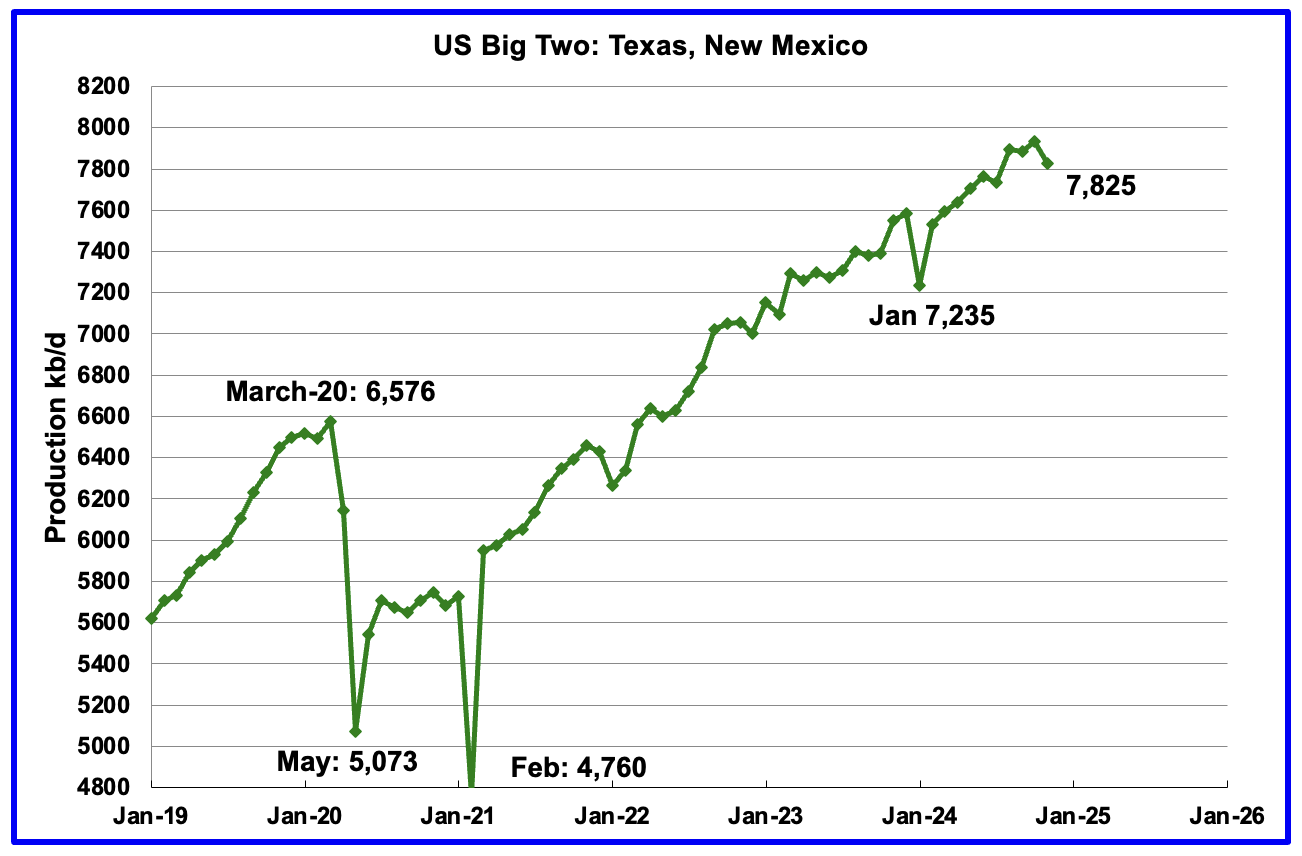
The combined oil output for the Big Two states Texas and New Mexico.
November’s production in the Big Two states decreased by a combined 108 kb/d to 7,825 kb/d and is 590 kb/d higher than January 2024
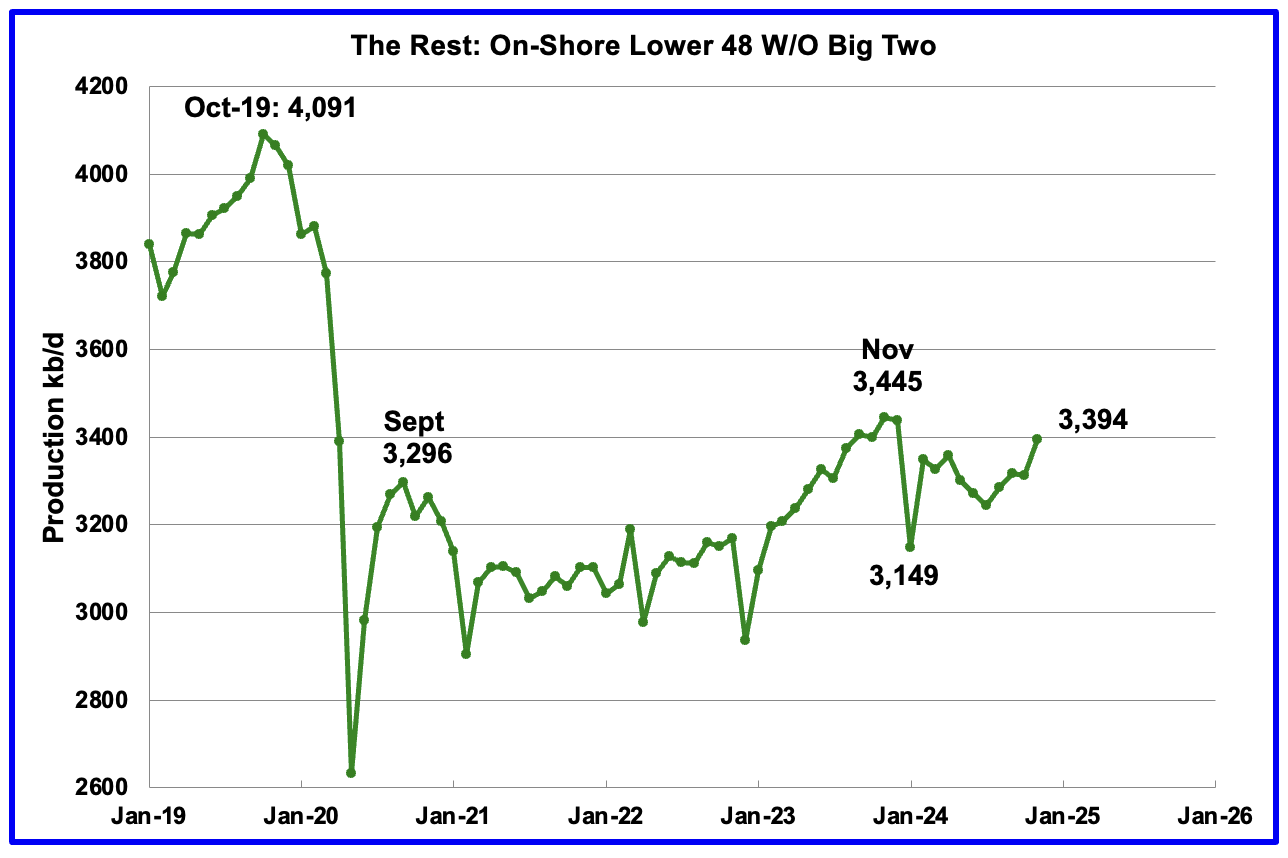
Oil production by The Rest
November’s oil production by The Rest rose by 82 kb/d to 3,394 kb/d and is 51 kb/d lower than November 2023.
The main takeaway from The Rest chart is that current production is below the high of October 2019 and is a significant loss that occurred during the Covid shut down and will not be readily recovered. Note that November 2024 production has now exceeded the Sept 2020 post covid rebound to 3,296 kb/d by 98 kb/d. Contributing to the rise is increased production from Colorado, Ohio and Montana along with a one month boost from North Dakota. Combined these four added 87 kb/d in November.
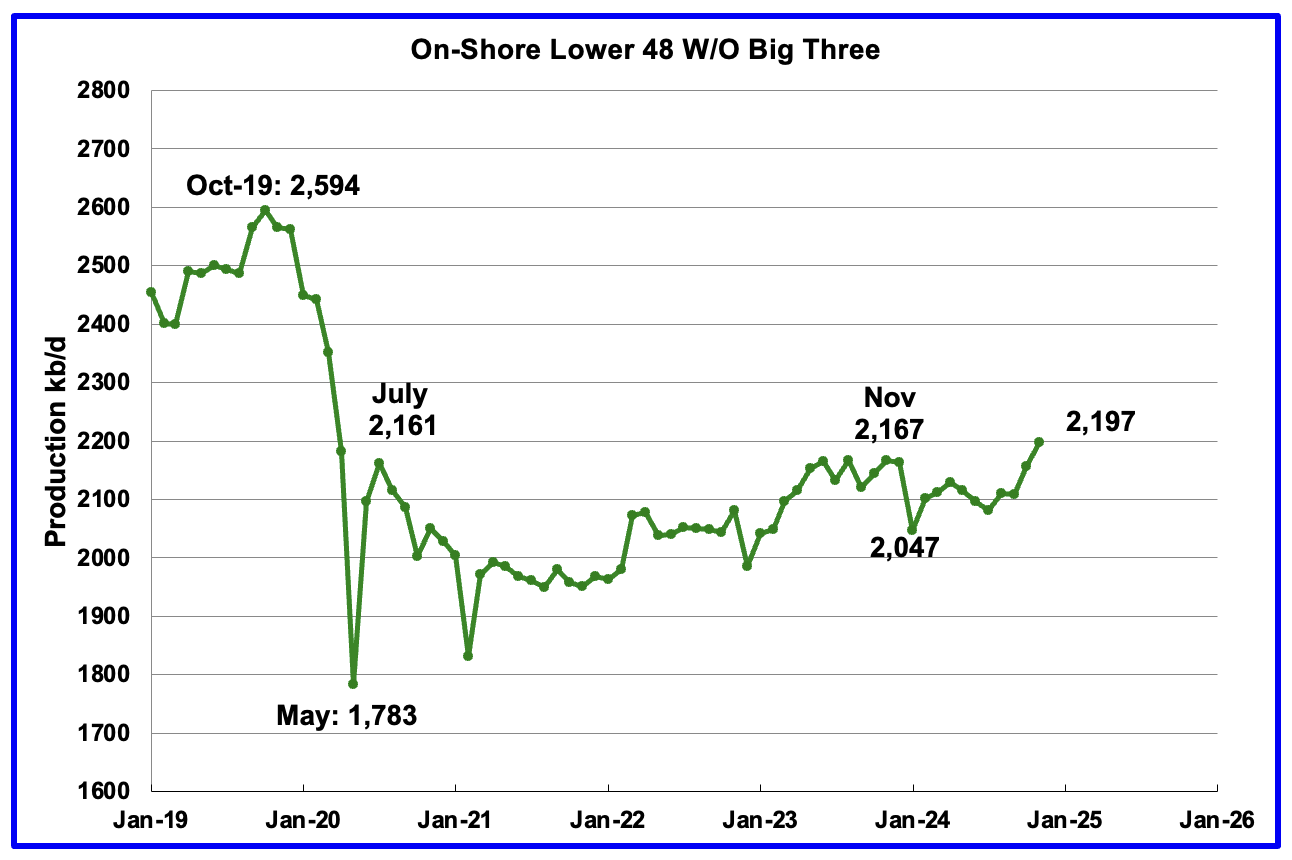
The OnShore L48 W/O the big three, Texas, New Mexico and North Dakota, shows production may be on a slowly increasing trend.
November’s OnShore L48 W/O the big three production increased by 41 kb/d to 2,197 kb/d, a new high. Colorado, Ohio and Montana contributed 46 kb/d to the increase.
Permian Basin Report by Main Counties and Districts
This special monthly Permian section was recently added to the US report because of a range of views on whether Permian production will continue to grow or will peak over the next year or two. The issue was brought into focus recently by two Goehring and Rozencwajg Report and Report2 which indicated that a few of the biggest Permian oil producing counties were close to peaking or past peak. Also comments by posters on this site have similar beliefs from hands on experience.
This section will focus on the four largest oil producing counties in the Permian, Lea, Eddy, Midland and Martin. It will track the oil and natural gas production and the associated Gas Oil Ratio (GOR) on a monthly basis. The data is taken from the state’s government agencies for Texas and New Mexico. Typically the data for the latest two or three months is not complete and is revised upward as companies submit their updated information. Note the natural gas production shown in the charts that is used to calculate the GOR is the gas coming from both the gas and oil wells.
Of particular interest will be the charts which plot oil production vs GOR for a county to see if a particular characteristic develops that indicates the field is close to entering or in the bubble point phase. While the GOR metric is best suited for characterizing individual wells, counties with closely spaced horizontal wells may display a behaviour similar to individual wells due to pressure cross talking . For further information on the bubble point and GOR, there are a few good thoughts on the intricacies of the GOR in an earlier POB comment and here. Also check this EIA topic on GOR.
New Mexico Permian
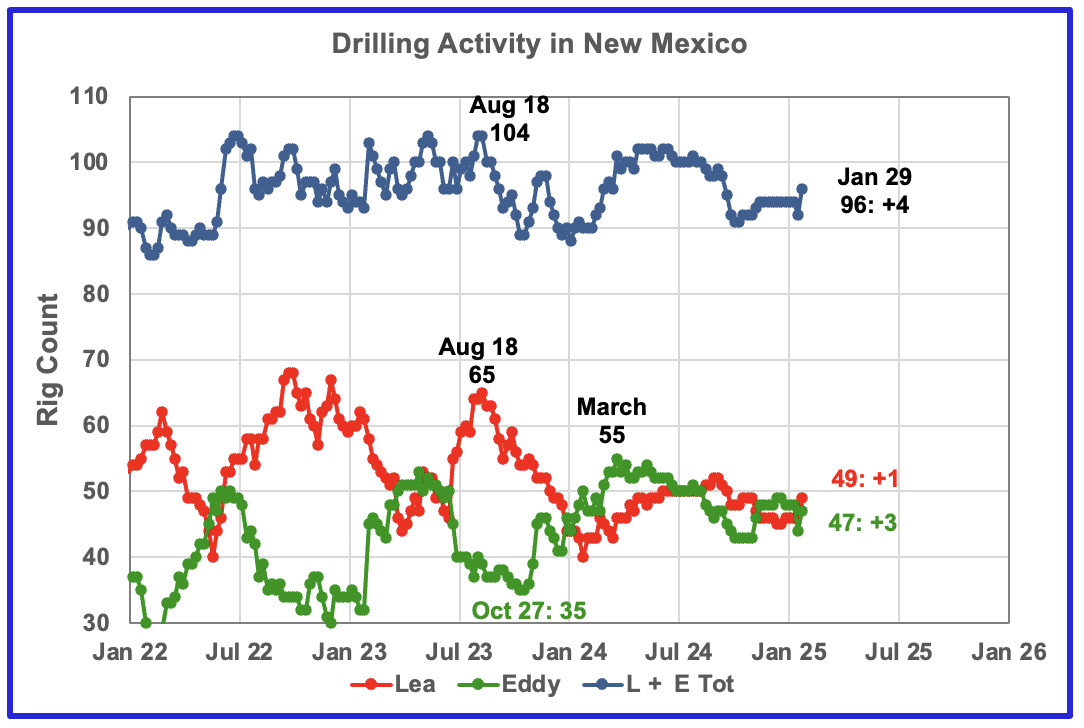
The total rig count in Lea and Eddy counties in the week ending January 31 is down 4 to 96 from the July count of 100 and has held steady for 6 weeks preceding January 31 when it increased by 4 to 96.
Lea county rigs have wandered between 52 and 46 since July to 49 at the end of January.
The Eddy county rig count has increased by 4 from 43 in October to 47 at the end of January. The increasing Eddy county oil production starting in June 2024 is due to the rise in the Eddy County rig count from 35 on October 27, 2023 to 55 in March 2024. See further down.
Lea and Eddy rig counts have stabilized in the 46 ± 3 range since October.
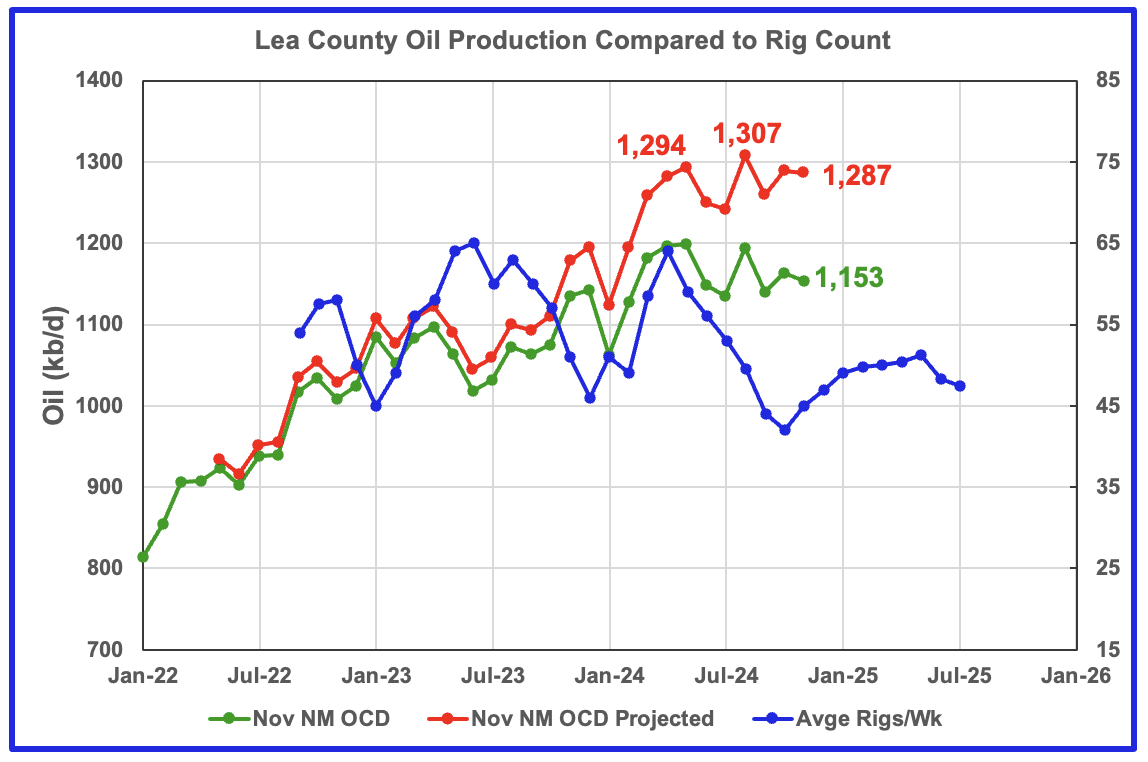
Lea County’s oil production appears to have entered a plateau phase in May at 1,294 kb/d and produced slightly more in August at 1,307 kb/d and dropped in November 1,287 kb/d.
Preliminary November data from New Mexico’s Oil Conservation Division (OCD) indicates Lea County’s oil production decreased by 6 kb/d to 1,153 kb/d. A projection for November’s final production estimates it will be closer to 1,287 kb/d, a decrease of 2 kb/d from October.
The blue graph shows the average number of weekly rigs operating during a given month as taken from the weekly rig chart. The rig graph has been shifted forward by 8 months. So the 64 Rigs/wk operating in August 2023 have been time shifted forward to April 2024 to show the possible correlation and time delay between rig count, completion and oil production.
Comparing the flattening oil production since May with the dropping time shifted rig count, indicates/implies the newer wells drilled since June had higher IPs to offset the decline associated with the fewer number of wells drilled by the declining rig count. The rising rig count since November may be able to slow the declining/flattening production in Lea County but the writing on the wall is saying that Lea County is close to peak production or may have passed it.
Note that rig counts are being used to project production as opposed to completions because very few extra DUCs are being completed at this time.
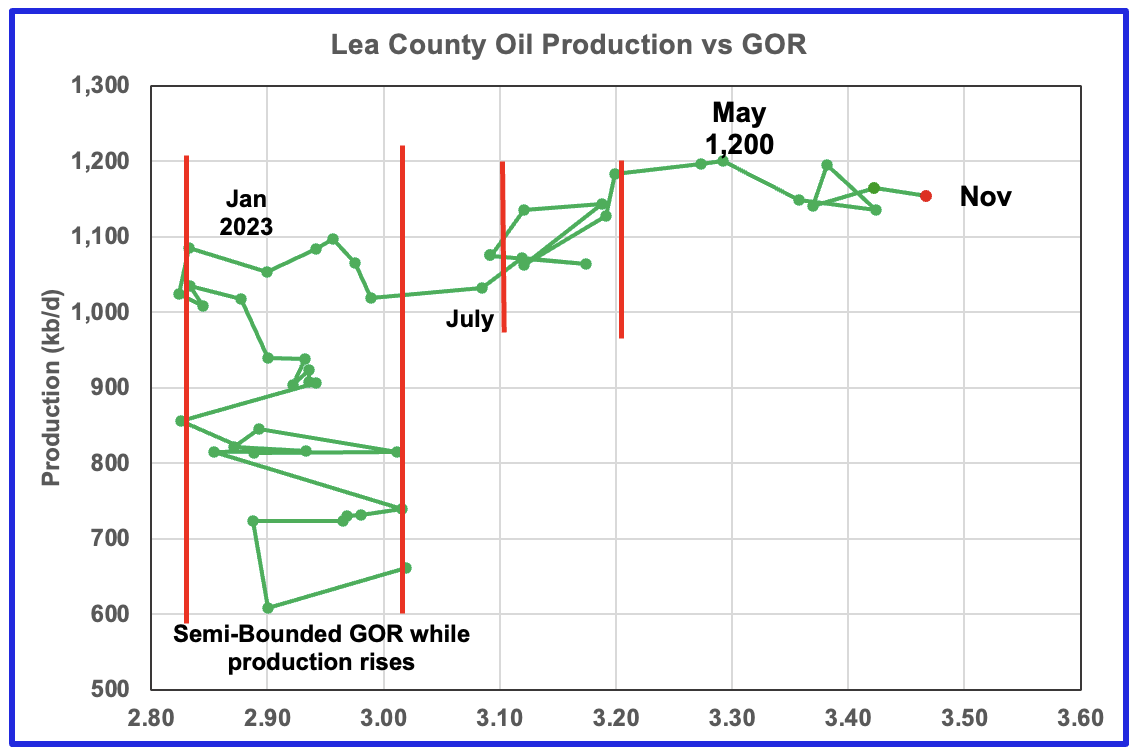
After much zigging and zagging, oil production in Lea county stabilized just below 1,100 kb/d in early 2023. Once production reached a new high in January 2023, production appeared to be on a plateau while the GOR started to increase rapidly to the right and entered the bubble point phase in July 2023.
Since July 2023 the Lea County GOR has continued to increase as production increased within a second semi-bounded GOR. This may indicate that the recent additional production is coming from a new bench/field since the GOR’s behaviour since August 2023 to March 2024 time frame appears once again to be in a semi bounded GOR phase accompanied with rising production.
The GOR moved out of the second semi-bounded GOR region in April and has continued to increase while production hit a new high in May 2024 and since appears to be in a plateau phase or slow decline. The GOR hit a new high of 3.47 in November and this is another indicator that Lea County may be close to or past peak production.
This zigging and zagging GOR pattern within a semi-bounded GOR while oil production increases to some stable level and then moves out to a higher GOR to the right has shown up in a number of counties. See a few additional cases below.
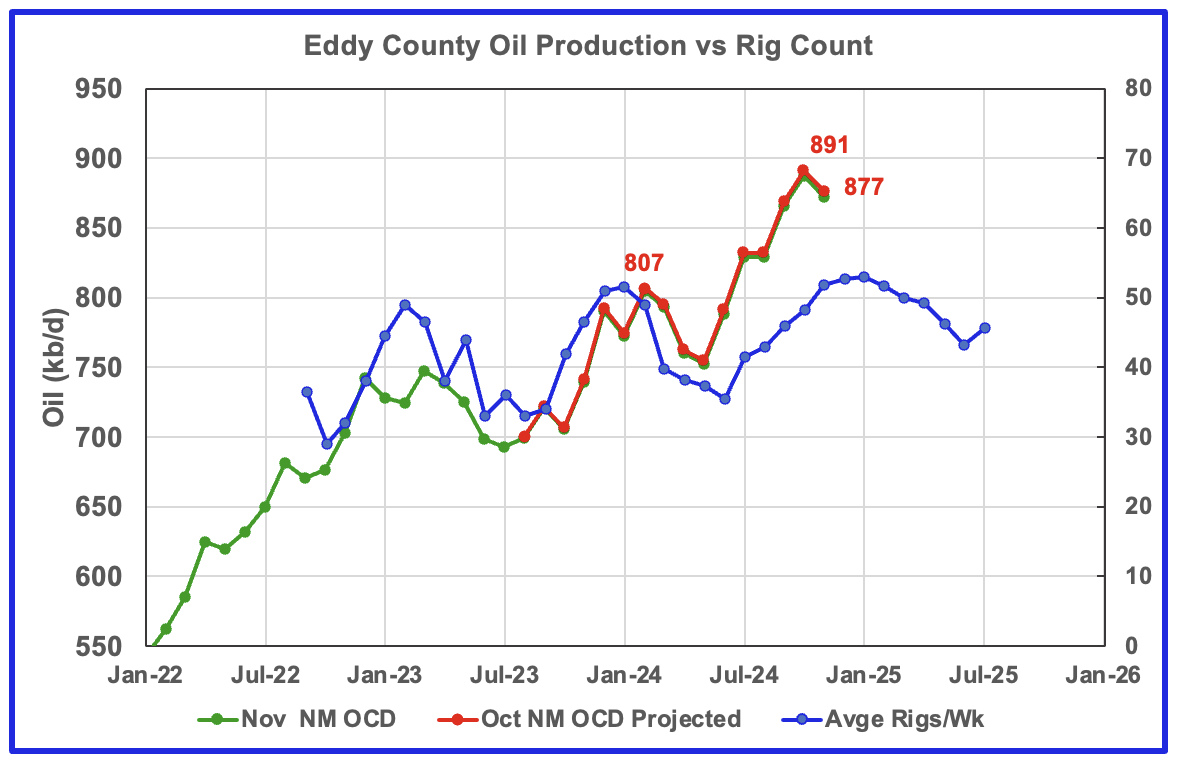
Eddy County’s oil production first peaked in February 2024 at 807 kb/d. After dropping for three months, the number of rigs and associated wells increased and so did oil production. In October the projected oil production increased by 25 kb/d to a new high of 891 kb/d. However November saw the first drop in production over the last six months. November production dropped by 14 kb/d to 877 kb/d.
From May to October production rose by 138 kb/d. Over that same time shifted rig period, 14 to 15 rigs were added to Eddy County and production rose. Was a new Tier 1 area/shelf discovered?
The blue graph shows the average number of weekly rigs operating during a given month as taken from the above weekly drilling chart. The rig graph has been shifted forward by 8 months to roughly coincide with the increase in the production graph starting in November 2023.
Clearly the production rise up to October 2024 is closely associated with the rise in the rig count and associated well completions delayed by roughly 8 months. The November drop is the first clue that the production rise associated with increasing rigs is about to end. The flattening rig count starting in November implies that production in Eddy county is heading into a short term plateau phase before starting to decrease sometime in December or January.
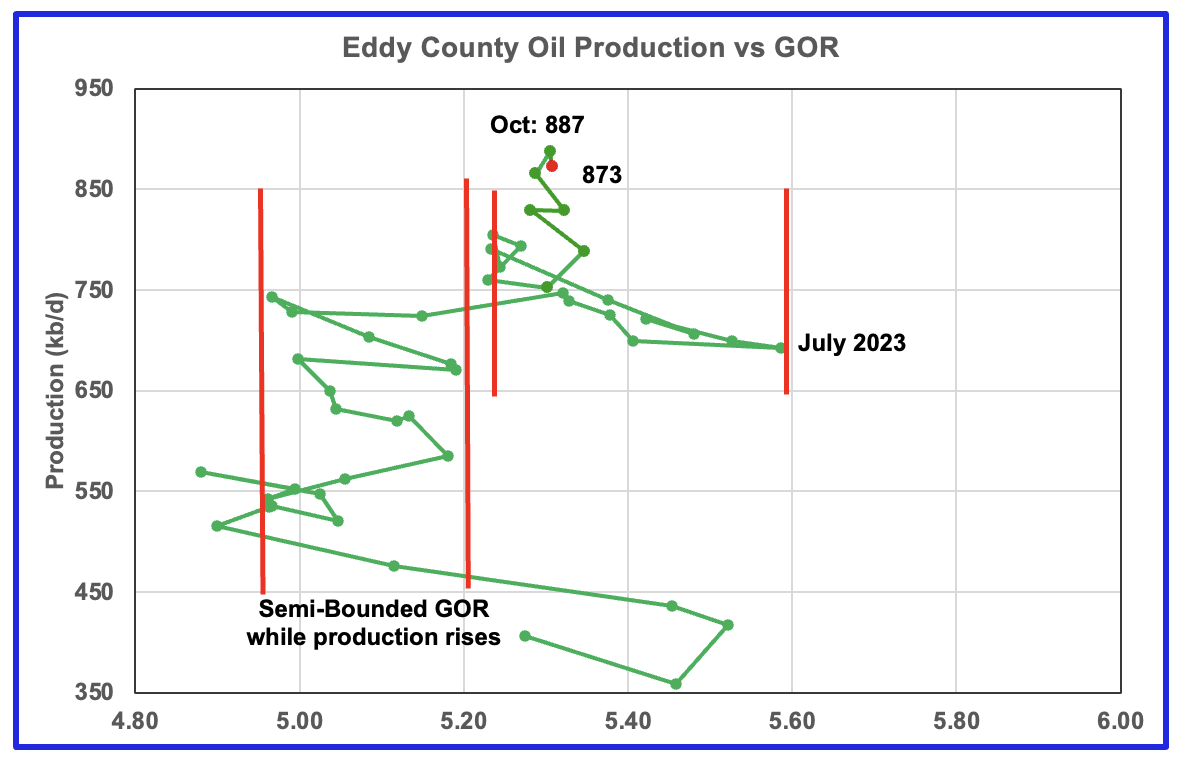
The Eddy county GOR pattern is similar to Lea county except that Eddy broke out from the semi bounded range earlier and for a longer time and then added a second semi bounded GOR phase. For November production decreased by 14 kb/d to 873 kb/d and stayed within the second semi-bounded region.
The right hand red bar could possibly be placed closer to a GOR 5.35 which may better define the second Semi-Bounded GOR region.
Texas Permian
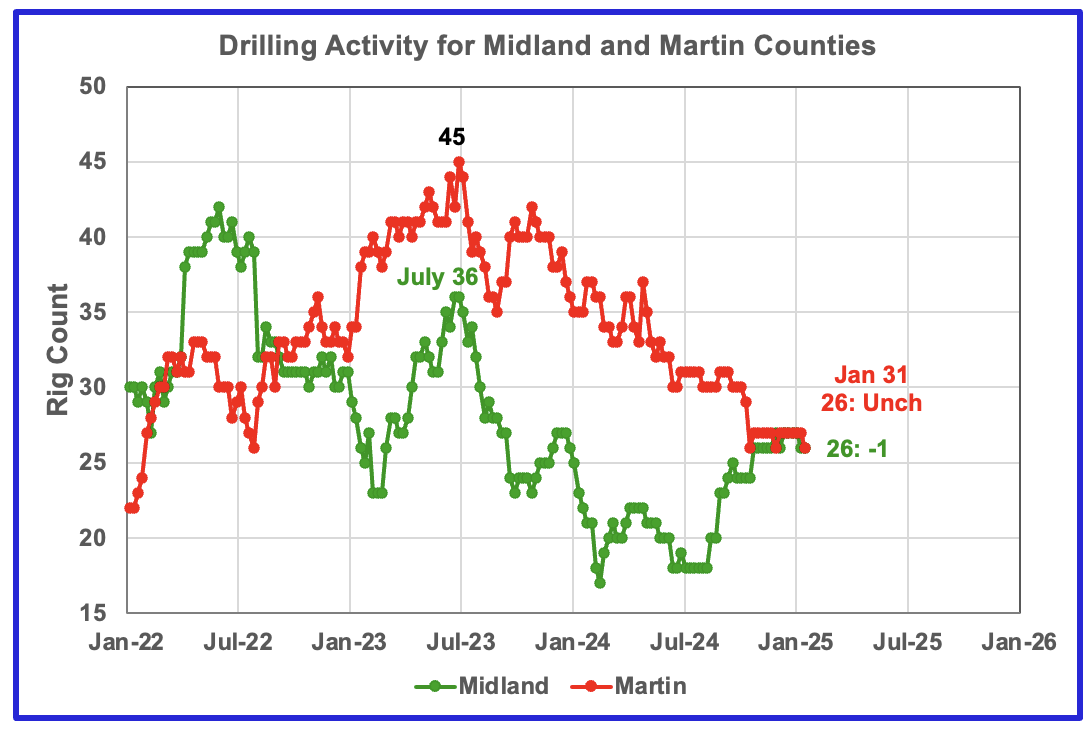
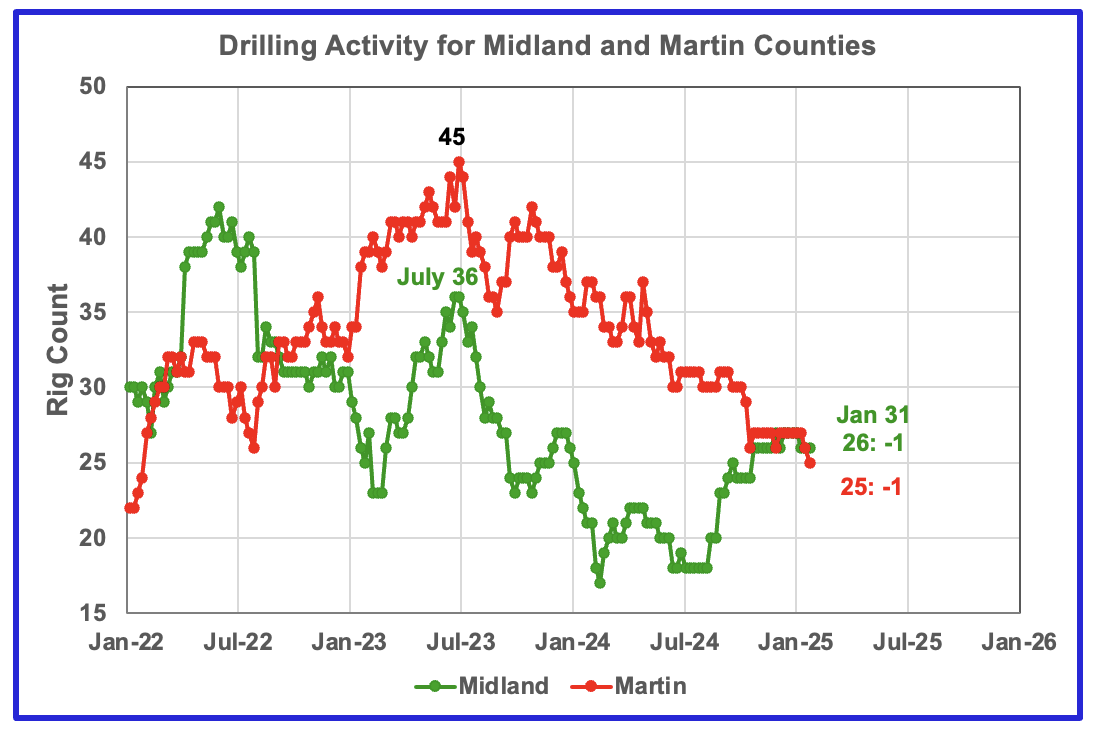
The Midland county rig count has been rising since July and is up 8 to 26 in January. The opposite is true for Martin county. On January 31, 25 rigs were operational, down 20 from 45 in July 2023.
Since the end of October drilling in the Midland and Martin counties has been very steady at 26 and 27 rigs, respectively, except for January 31 when Martin dropped to 25 and is now being reflected in its production.
Texas County Oil Production
The Texas RRC made significant revisions to its production data in their September report and those revisions now continue to affect the November projections in this update but to a lesser degree. The projections for this Texas update are almost back to being reasonable. However in a few cases the projections are still questionable.

Midland October oil production chart for comparison with updated November chart below.
For many months in previous posts Midland county’s oil production had been declining. The revisions in the RRC September update have turned the decline into rising production that exceeds the previous production peak of 699 kb/d in July 2023 which I didn’t think was correct and mentioned in the previous US post. See next chart.
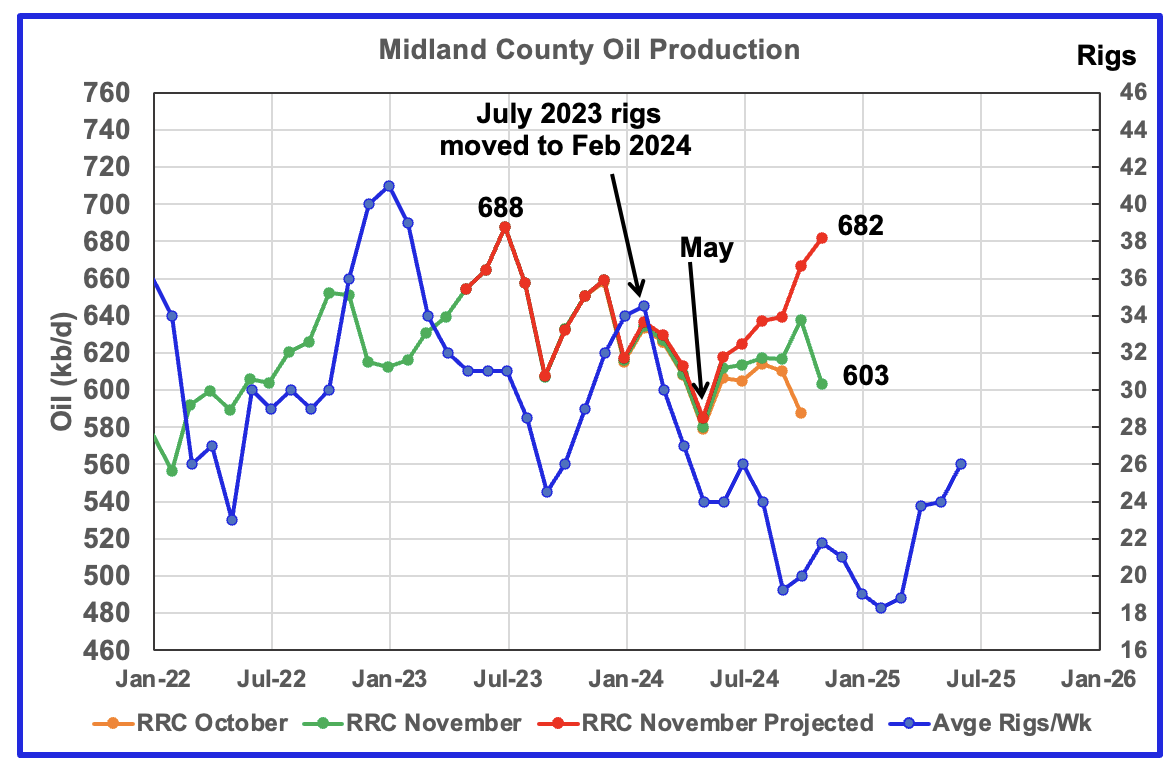
The orange and green graphs show the oil production for Midland County as reported by the Texas RRC for October and November. The red graph uses the October and November data to project production as it would look after being updated over many months.
I think the increase in the projected production after May is related to the under reporting of production in the September data and its impact on the October results, especially after July. Comparing the current chart with the previous one, note that May 2024 production has dropped by 40 kb/d, 620 kb/d to 580 kb/d. Also, July 2023 is down by 11 kb/d and the projected November production is now lower than July 2023.
The post May production projection is not credible and hopefully will correct itself in the next data release. Considering that oil production from July 2023 to May 2024 followed the rig count graph, it is not unreasonable to question whether the production rise after May is believable. The intial RRC November data is showing higher production in November over October and this is reflected in the projection. However I think it is on the high side.
The blue graph shows the average number of weekly rigs operating during a given month as taken from the weekly drilling chart. The rig graph has been shifted forward by seven months. So the average 34.5 Rigs/wk operating in July 2023 have been moved forward to February 2024 to show the possible correlation and time delay between rig count, completions and oil production. If the seven month shift in the rig count is approximately correct in that oil production can be tied to the rig count, oil production in Midland county should increase for a month or two before resuming its decline.
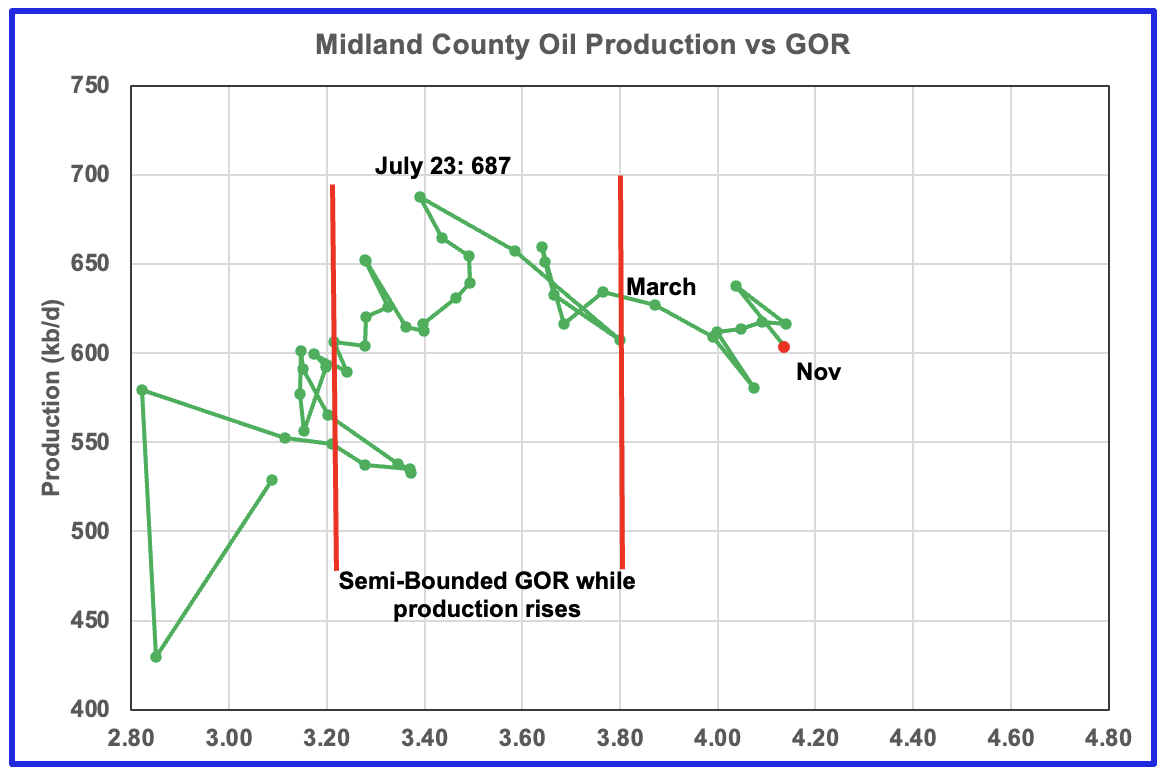
The production revisions do not affect the GOR. For November the GOR ratio increased to 4.14 while production dropped.
With Midland county into the bubble point phase, oil production and the GOR have stayed within a narrow range outside of the initial Semi-Bounded GOR region. The oil production and GOR shown in this chart is based on the RRC’s November production report. Note that while the last few months are subject to revisions, the July 2023 to April 2024 production data has been steady for a number of months.

Above is the Martin county oil production chart posted in June. It was the second month that was hinting at a production peak for Martin county. Also it was the first month in which the GOR moved out of the semi-bounded GOR region. The subsequent July and August charts were affected by significant revisions to the earlier production data and as a result the projected results were not credible.
This chart has been posted to compare with the November oil production chart below which appears to confirm that Martin county has entered a plateau phase or possibly a declining phase.
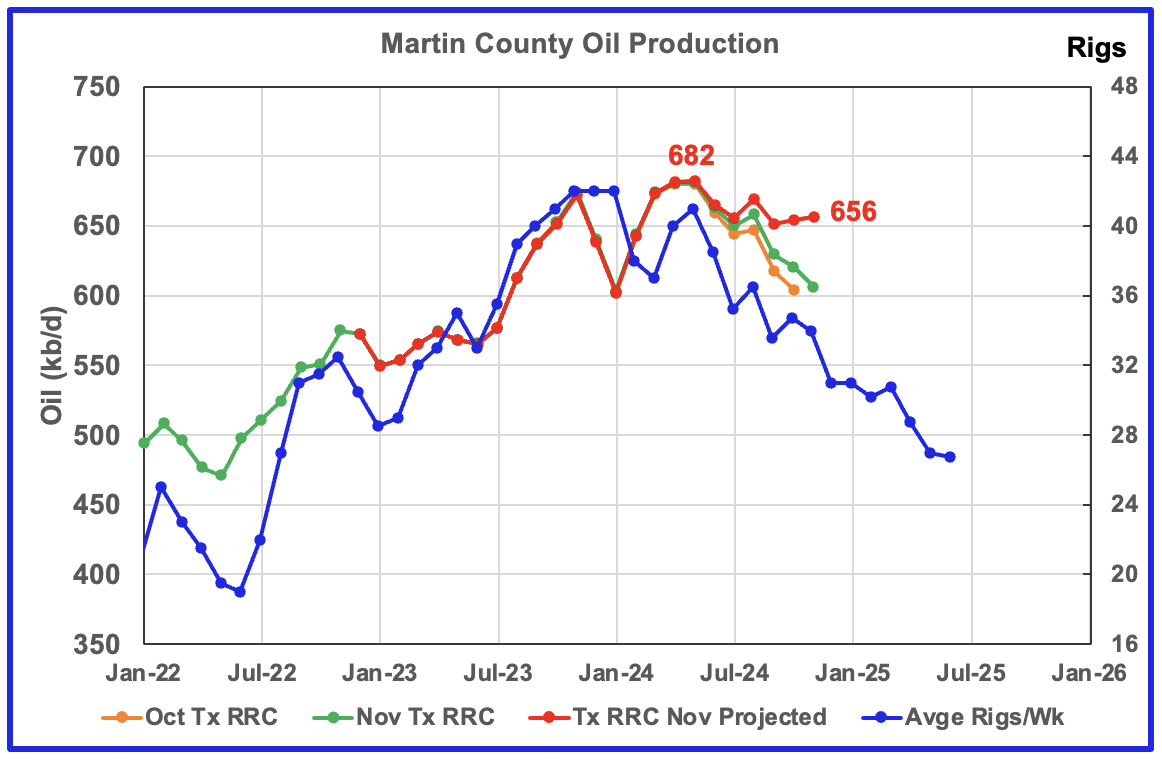
The orange and green graphs show the production for Martin County as reported by the Texas RRC for October and November. The red graph is a projection for oil production as it would look after being updated over many months.
Martin county’s projected November oil production increased by 2 kb/d to 656 kb/d and is 26 kb/d lower than the peak rate achieved in May 2024, 682 kb/d. Note that May production in the comparison graph was 680 kb/d, very close to the value shown in this chart.
Texas’ RRC oil production for Martin County was showing initial signs of peaking in November 2023 but was then followed by declining production into January 2024. Production since June has been on a plateau while the rig count has been dropping.
The red graph is a production forecast which the Texas RRC could be reporting for Martin county about one year from now as the Texas RRC reports additional updated production information. This projection is based on a methodology that used the October and November production. The green graph shows oil production reported by the Texas RRC for November and is slightly higher than October.
The blue chart shifts the rig count ahead by 6 months. Note the three flat spots in the November, December and January rig count and similar flat spots in production a few months later.
November’s production data is another early indicator that Martin county’s oil production is in decline. A few more months of data will be required to confirm whether Martin County’s oil production is in decline.

Martin county’s oil production after November 2022 increased and at the same time drifted to slightly higher GORs within the semi bounded range. However the June 2024 GOR saw its first move out of the semi bounded region. November’s preliminary oil production was lower than November 2023 and June 2023. In November the GOR reached a new high of 2.93, which is consistent with falling oil production.
Martin county has the lowest semi-bounded GOR boundary of the four counties at a GOR of close to 2.60 but for November it has jumped to 2.93 and is clearly out of the semi-bounded region. Martin County has now entered the bubble point phase that should result in a dropping oil production trend.
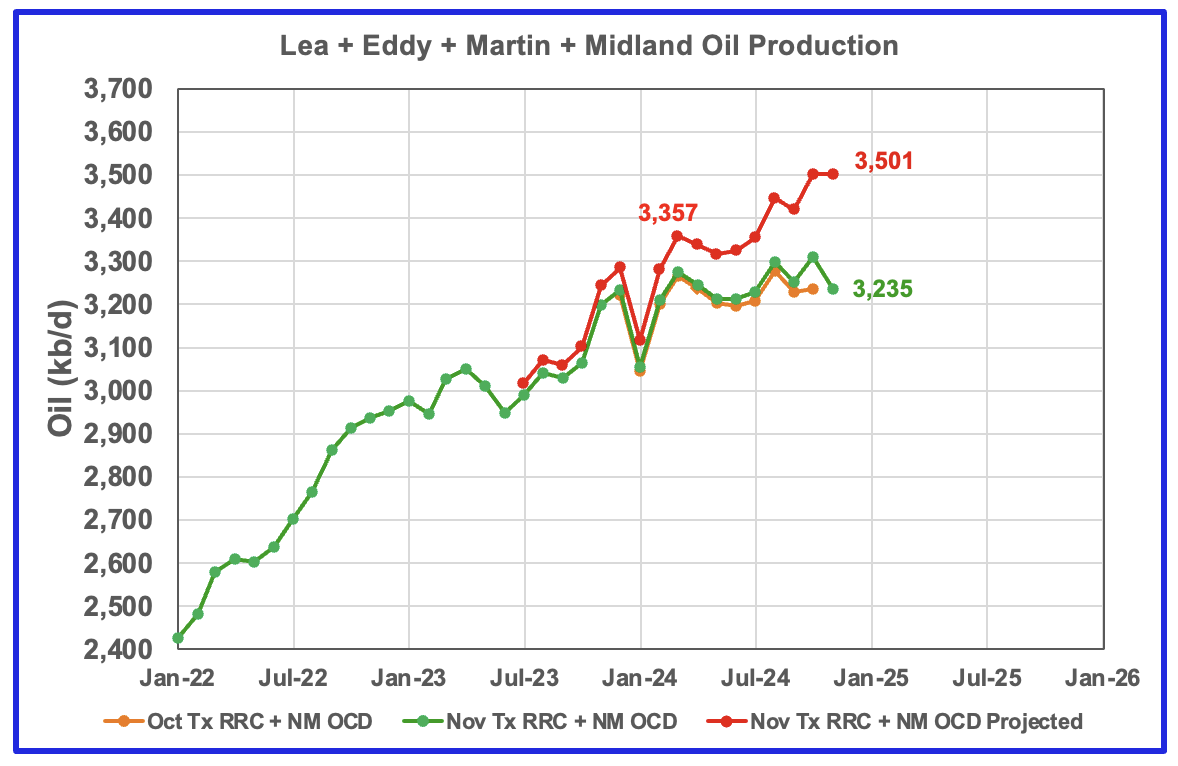
This chart shows the total oil production from the four largest Permian counties. Assuming that current November Permian production is close to 6,400 kb/d, these four counties account for close to 55% of the total.
The production forecast for October and November is showing no growth. The small increase of 144 kb/d since March 2024 is another early indicator that these four counties combined are at the beginning of a production plateau in 2025. The projected production after July is a real production increase primarily from Eddy county. However since Eddy production dropped in November, overall production for November is flat at 3,405 kb/d.
The October and November initial production data is shown in the orange and green graphs respectively. The red graph uses the October and November data to project an estimate for the final November production. The plateauing of production in these four counties over the next few months would be an early indicator that US onshore L48 production is near its peak.
Findings
– Lea county may have peaked in May 2024. While oil production is not following the rig count graph directly, the dropping rig count is resulting in Lea production currently being on a plateau.
– Eddy County’s oil production initially peaked in February 2024. It started a new increasing phase in June as it followed the uptrend in the rig count and exceeded its previous February peak. November is the first month since May that production dropped and it may be the first sign that Eddy production has peaked as it is occurring at the same time as the rig count is peaking.
– Midland county peaked in July 2023 and has roughly followed the declining rig count graph since then. It appears to have started a new increasing phase in June 2024 but is unlikely to exceed the July 2023 peak.
– Martin County may have also peaked in May 2024 and may have entered a slow declining phase.
– Three of the four largest Permian oil producing counties are now in their post peak phase, assuming that drilling does not start to increase. Need a few more months of data on Eddy.
Texas District 8
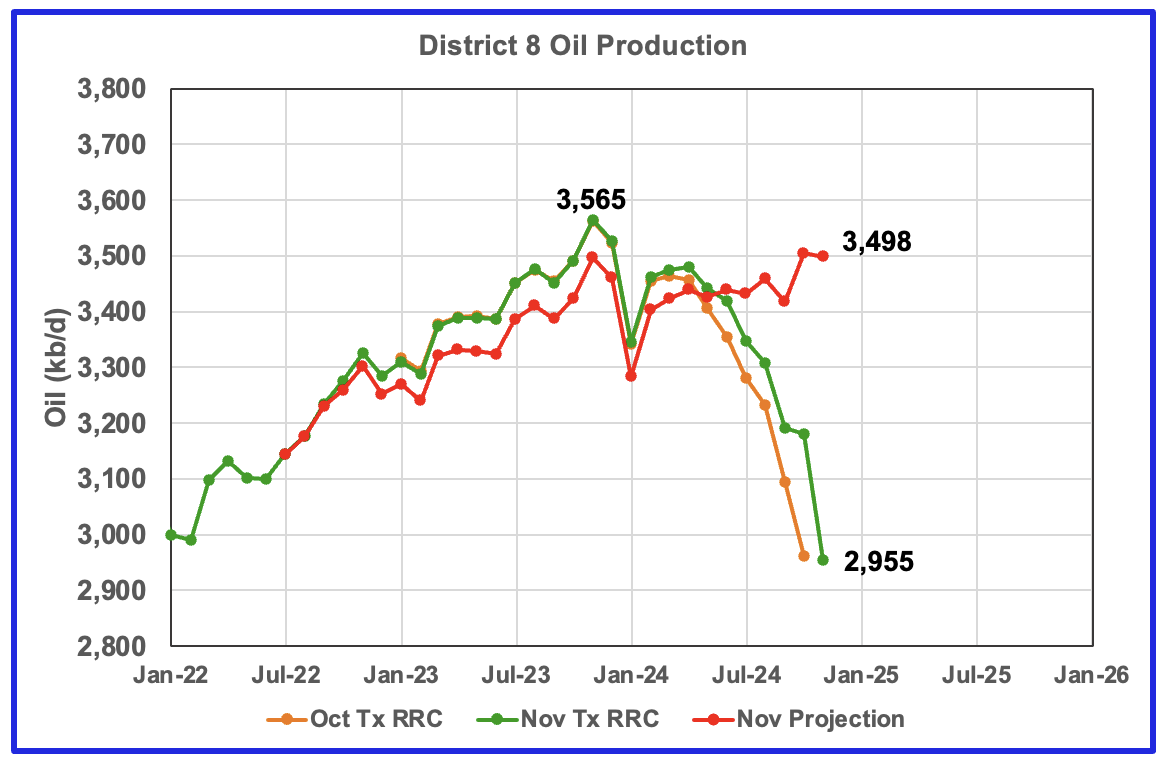
Texas District 8 contains both the Midland and Martin counties. Combined these two counties produce close to 1,350 kb/d of oil. While these two counties are the two largest oil producers, there are many other counties with smaller production, such as Reeves #3, Loving #4, Upton #5 and Howard #6 that in total produced 3,498 kb/d of oil in November 2024. Essentially the Midland and Martin counties produce close to 39% of the District 8 oil.
The orange and green graphs show the production reported by the Texas RRC for October and November. The red graph is a projection and it indicates that production in District 8 entered a plateau phase in May 2024 around 3,350 kb/d. I think the October and November estimates as a bit on the high side.
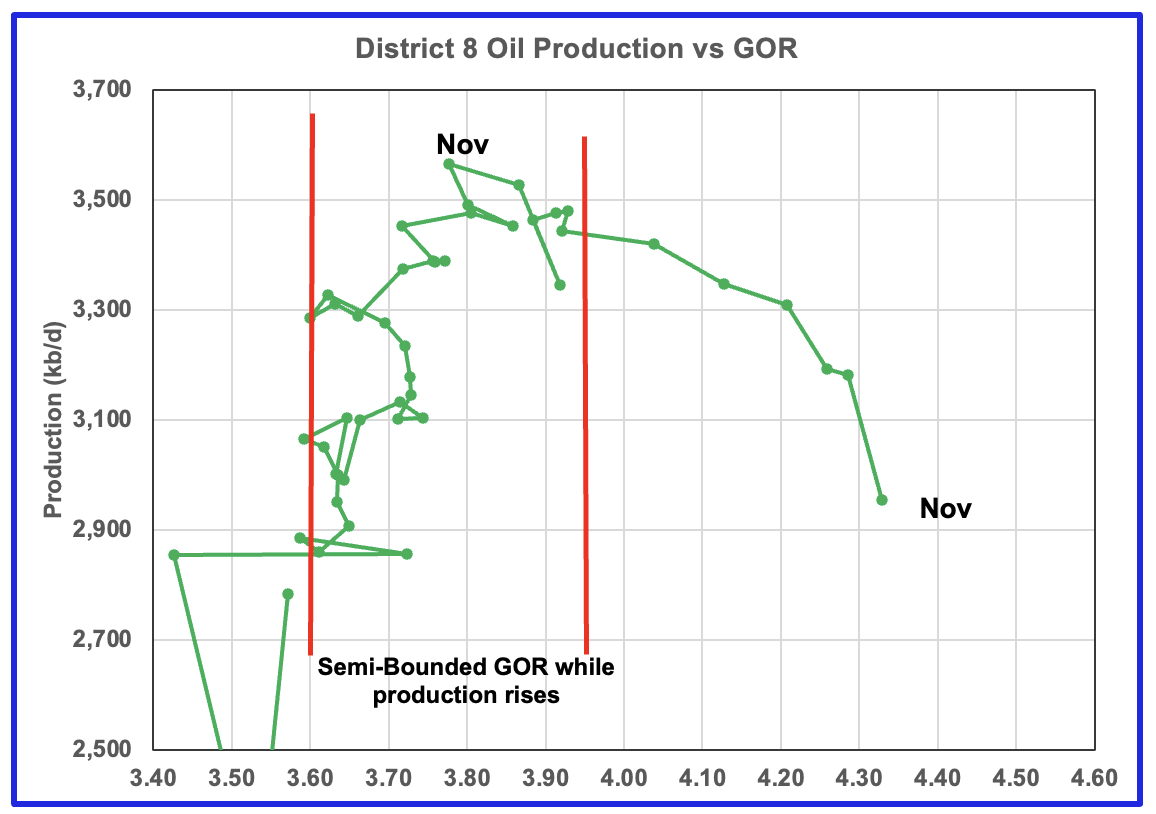
Plotting an oil production vs GOR graph for a district may be a bit of a stretch. Regardless here it is and it seems to indicate many District 8 counties may well be into the bubble point phase. This is another indicator that implies District 8 has passed peak production.
Oil Production and GOR Charts for Two of the Next Bigger Oil Producing Counties in Texas
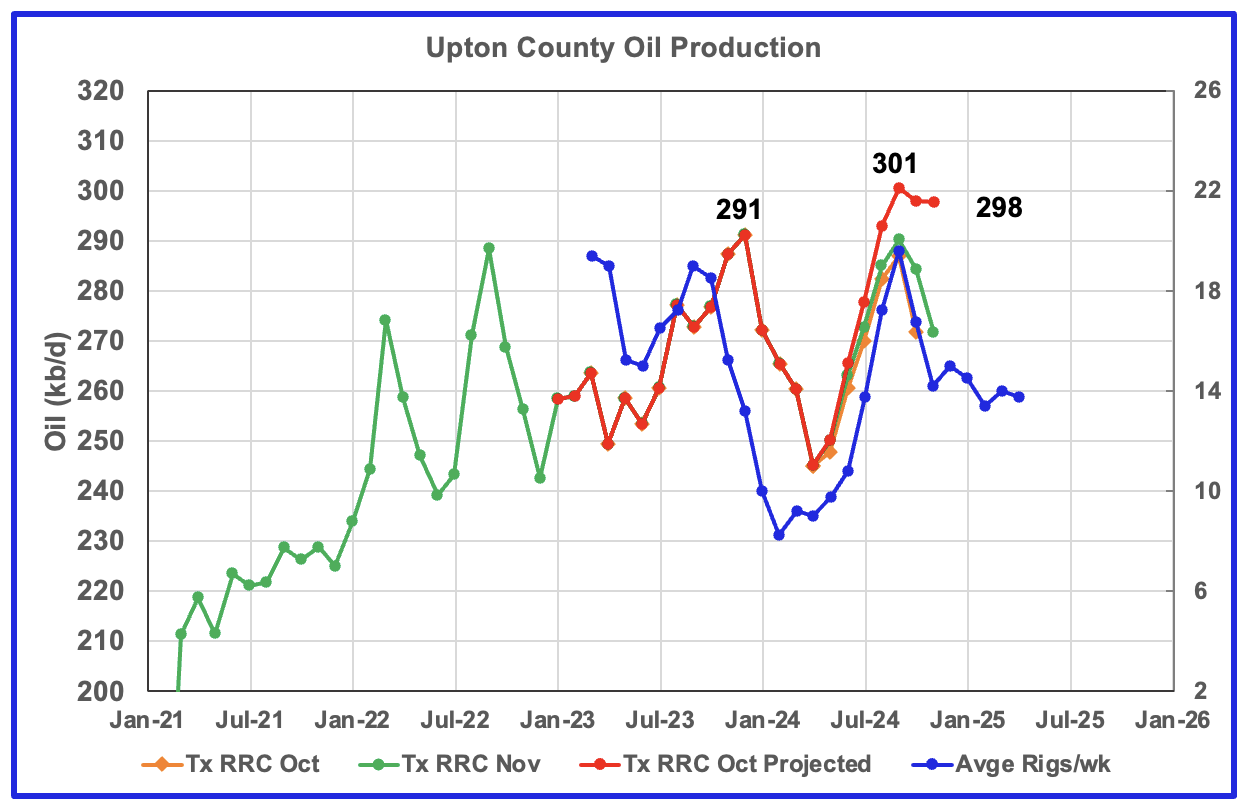
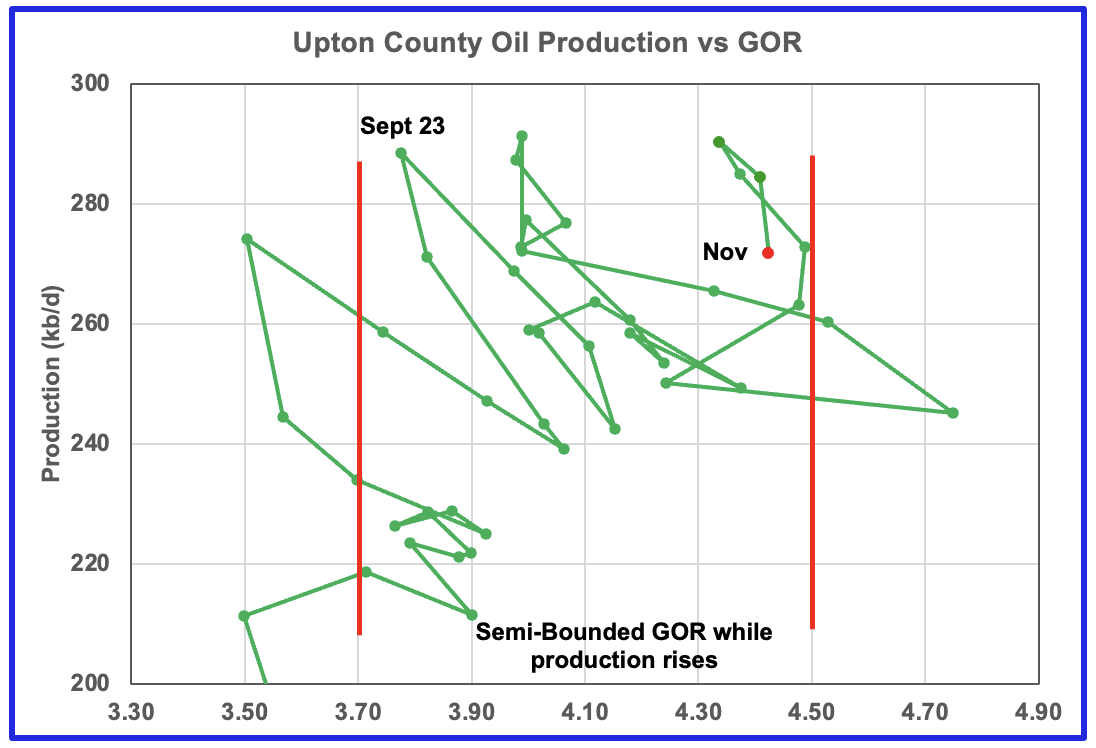
Upton county may have entered a plateau phase in September 2024 at 301 kb/d. Note the slow progression of the GOR since September 2023 in the Semi-Bounded GOR range towards higher GORs. As of November 2024, the GOR remains in the Semi-Bounded GOR range but may be on the verge of moving out.
The rig graph in the previous chart has been shifted forward by six months.
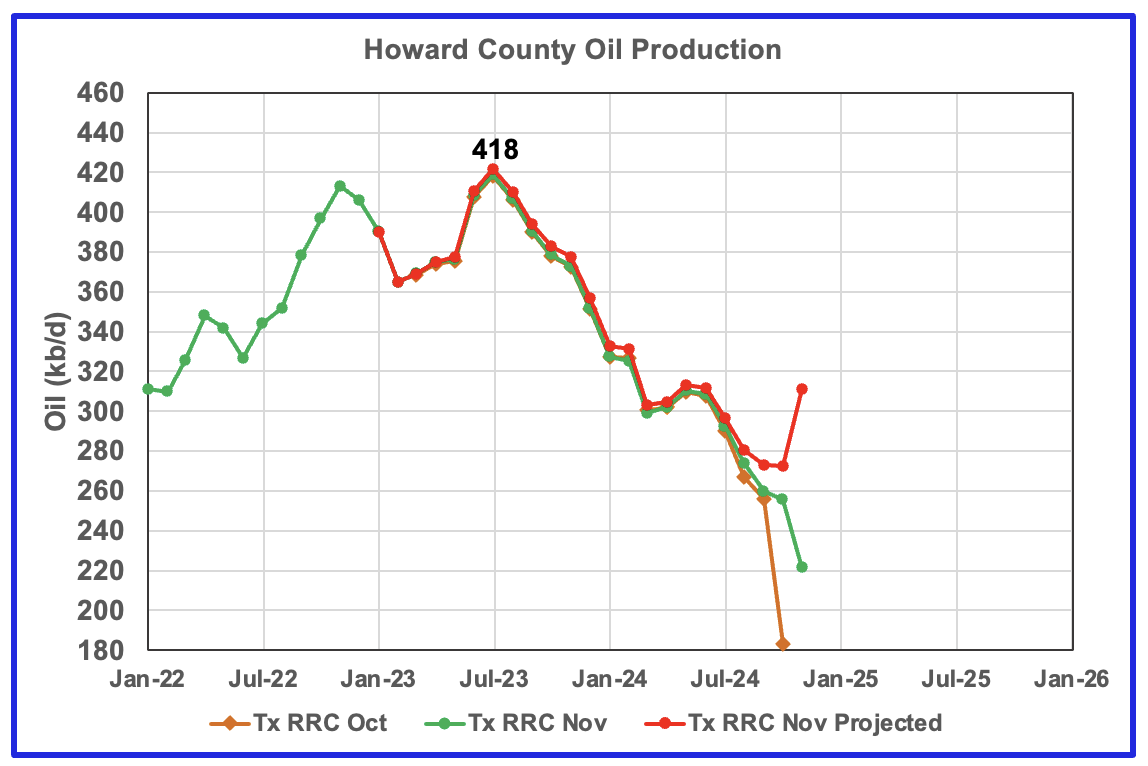
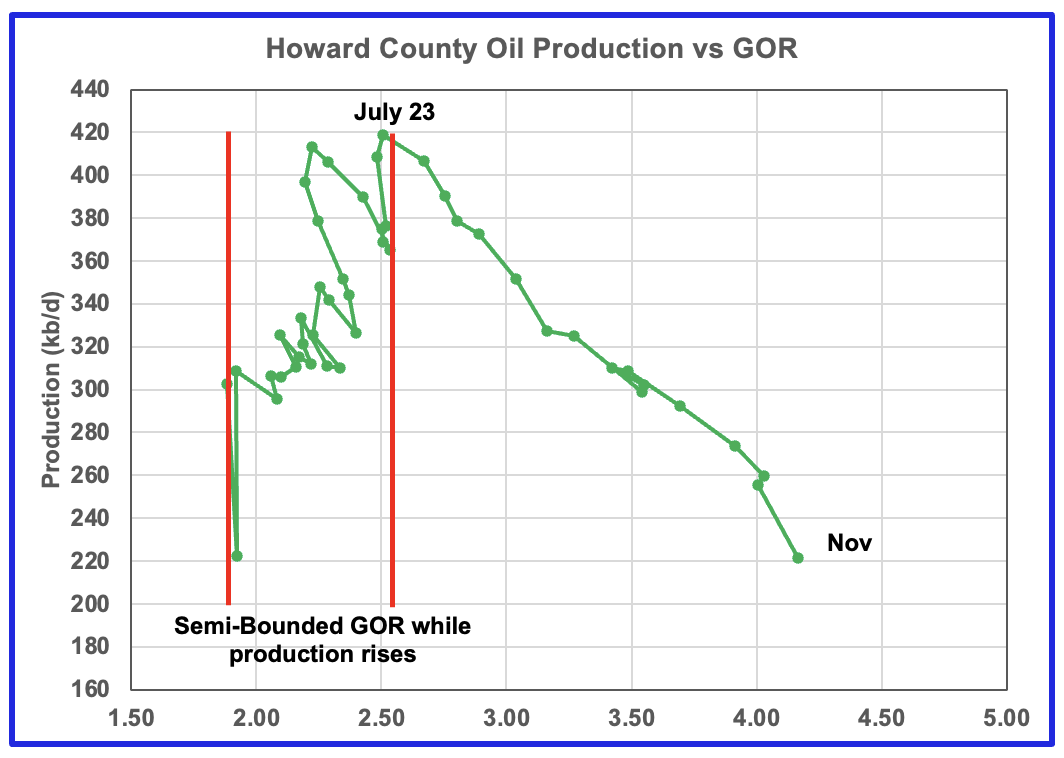
Howard county peaked in July 2023 at 418 kb/d. Note the rapid movement of the GOR to higher ratios once it broke out of the Semi-Bounded GOR range. While the GOR has risen to new highs, production has kept on falling. The production rise shown for November in the projection graph is overdone.
A Forecast for U.S. Oil Production
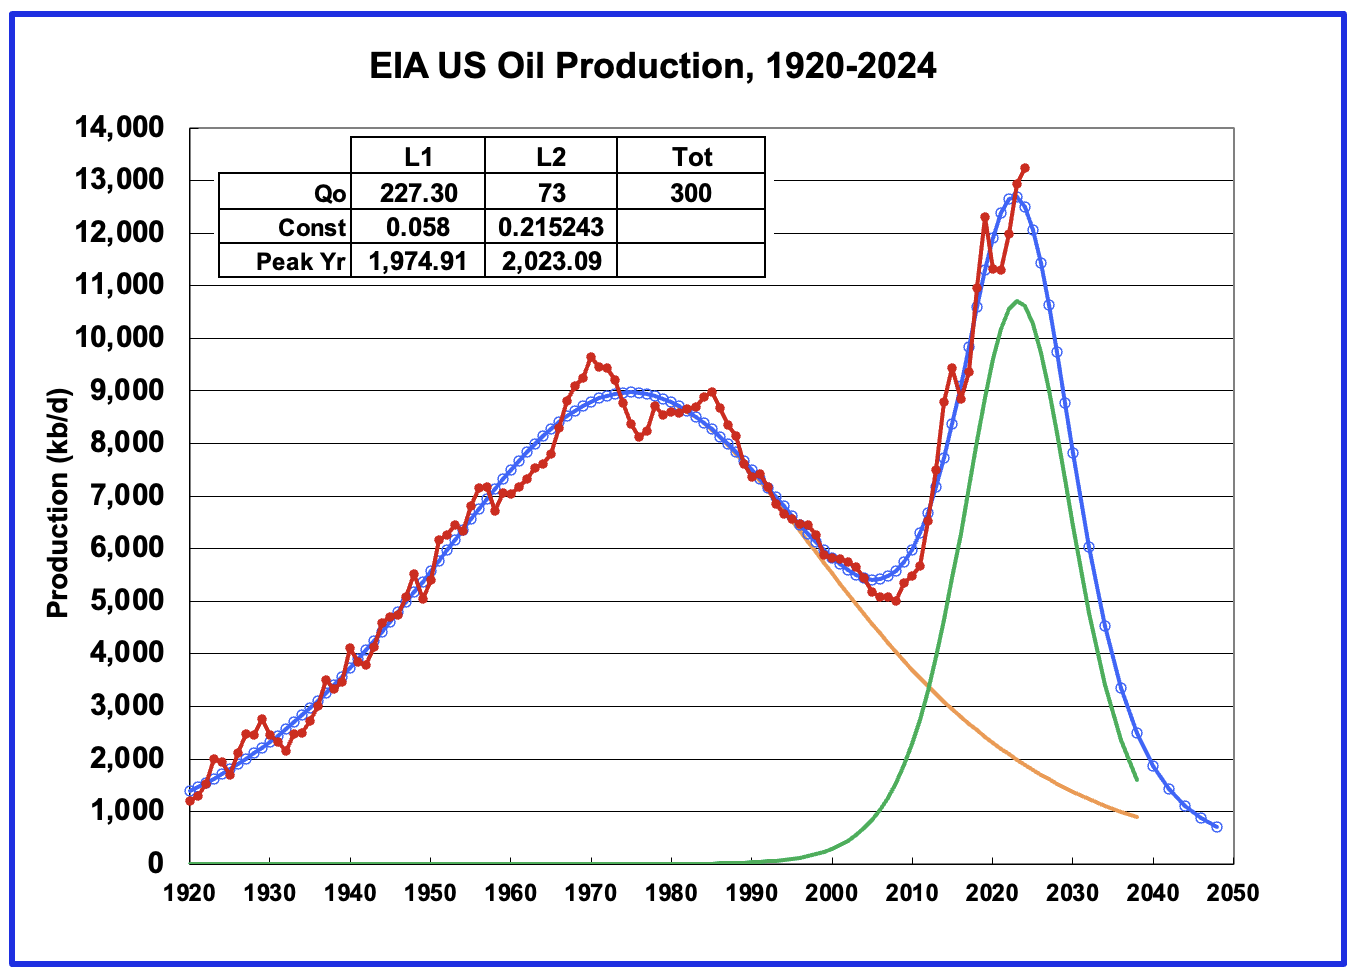
In the January 19th POB post, a reference was made to a U.S. oil production projection by Jean Laherrere using a Hubbert model that shows production peaking in 2025. The analysis used a single Logistic function to model production between 2008 and 2023.
Above is a two logistic model of US production from 1920 to 2024 which shows a projected peak in early 2023. Total potentially recoverable oil is 300 B barrels.
Drilling Productivity Report
The Drilling Productivity Report (DPR) uses recent data on the total number of drilling rigs in operation along with estimates of drilling productivity and estimated changes in production from existing oil wells to provide estimated changes in oil production for the principal tight oil regions. The new DPR report in the STEO provides production up to November 2024. The report also projects output to December 2025. The DUC charts and Drilled Wells charts are also updated to November 2024.
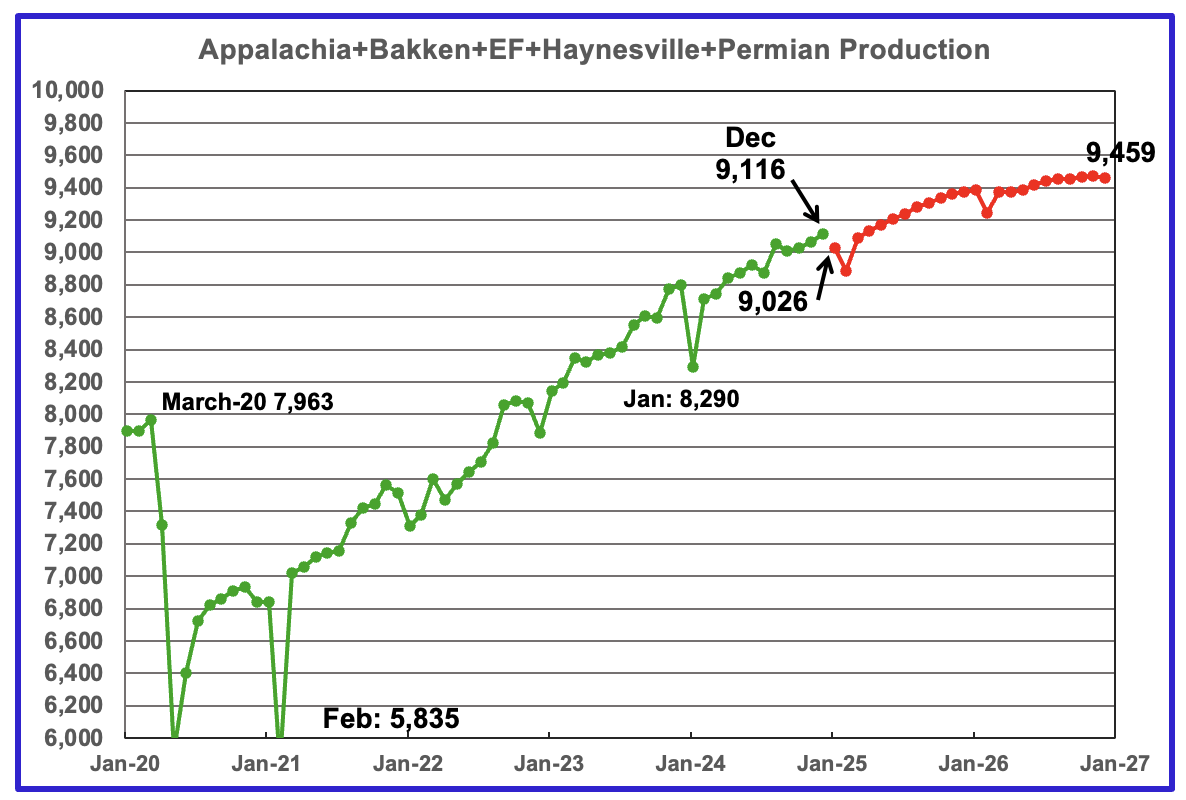
The oil production for the 5 DPR regions tracked by the EIA is shown above. Also the projection by the January 2025 STEO now extends to December 2026, red markers. Note DPR production includes both LTO oil and oil from conventional wells. DPR oil production for the Anadarko and Niobrara regions is no longer available.
The December oil output in the five DPR regions increased by 50 kb/d to 9,116 kb/d. Note the December 2024 production is 184 kb/d lower than the STEO December 2024 forecast of 9,300 kb/d in the previous post. Production is expected to drop by 90 kb/d in January to 9,026 kb/d. By December 2026 production is expected to reach 9,459 kb/d.
From December 2024 to December 2026, production is expected to grow by 343 kb/d. Note how production is flat from October 2026 to December 2026. Is this an early indication for an upcoming plateau and possible decline.
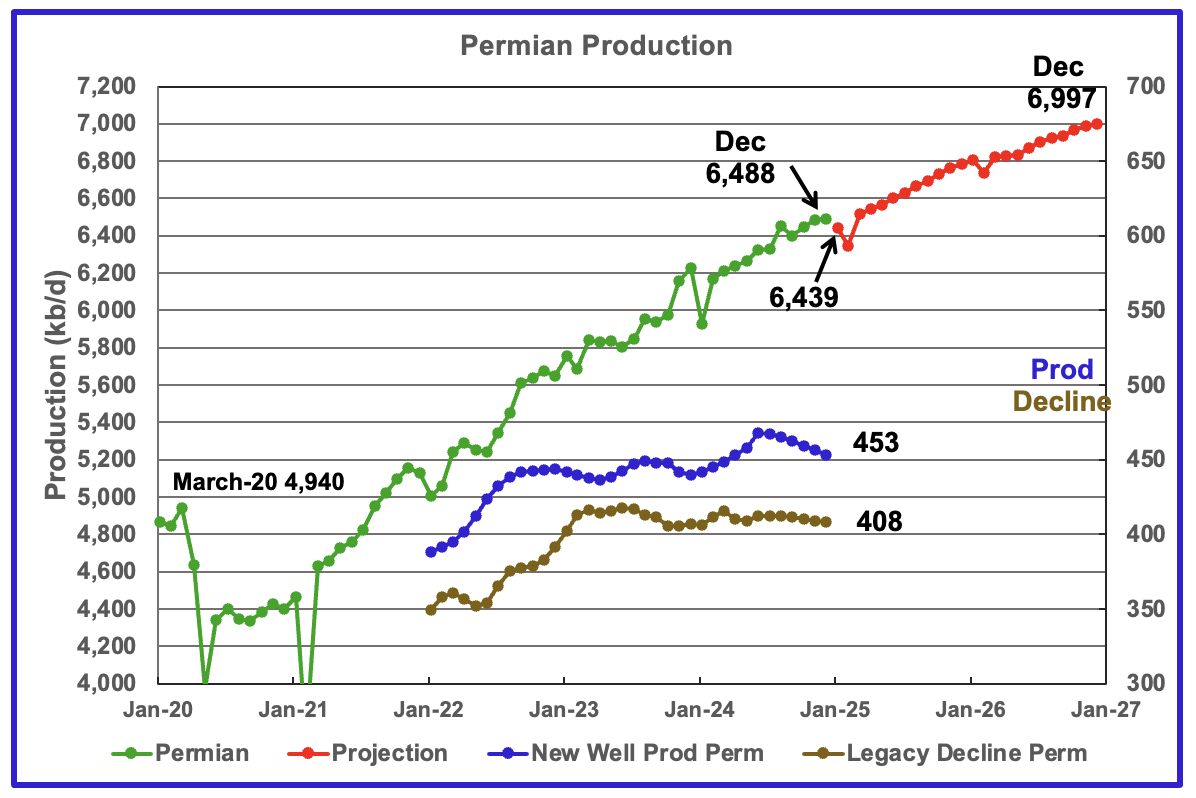
The EIA’s January DPR report shows Permian output increased by 5 kb/d to 6,488 kb/d. By December 2026 output is expected to be 6,997 kb/d, an increase of 509 kb/d or an annual growth rate of 255 kb/d/yr.
There has been a significant revision to the production forecast for December 2025. In the previous post, the STEO forecast production in December 2025 would be 6,631 kb/d. The updated forecast for December 2025 is 6,787 kb/d which is an upward revision of 156 kb/d.
Production from new wells and legacy decline, right scale, have been added to this chart to show the difference between new production and legacy decline.
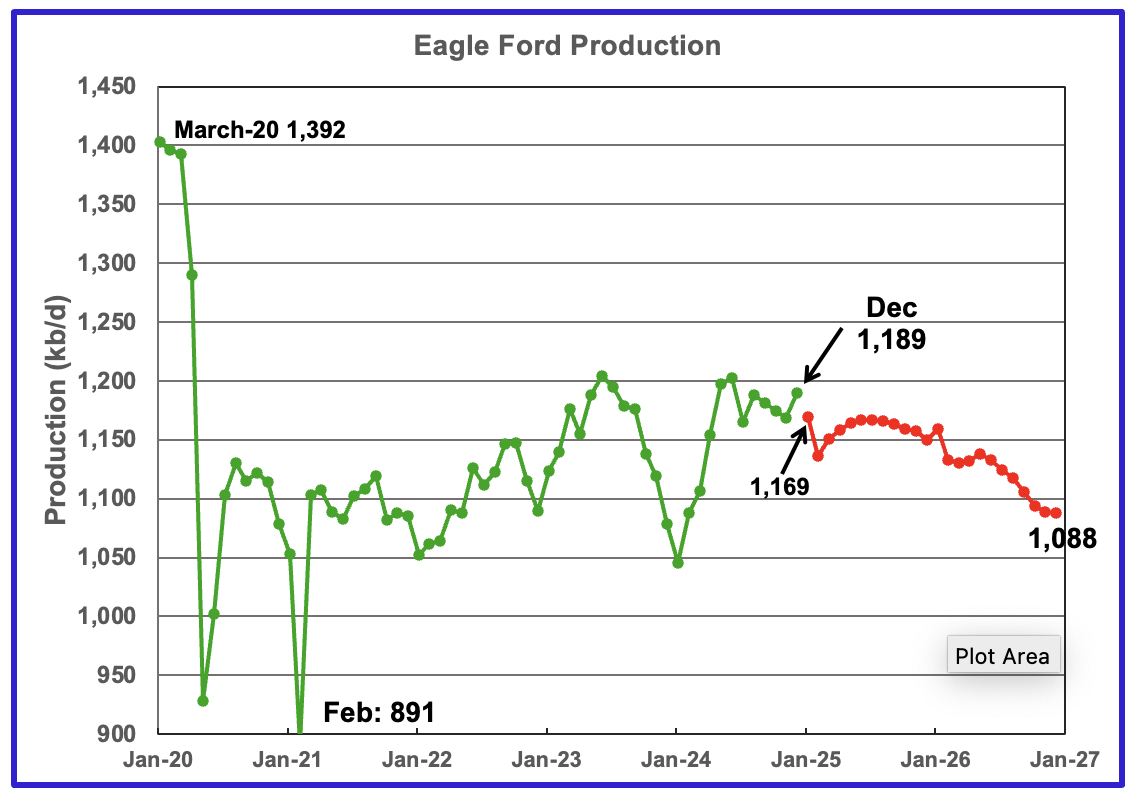
Output in the Eagle Ford basin has been increasing since January 2024 and may have peaked in June 2024. December production rose by 20 kb/d to 1,189 kb/d. Production over the next two years is expected to fall. Output in December 2026 expected to be 1,088 kb/d, 101 kb/d lower than December 2024. January 2025 production is forecast to decrease by 20 kb/d to 1,169 kb/d.
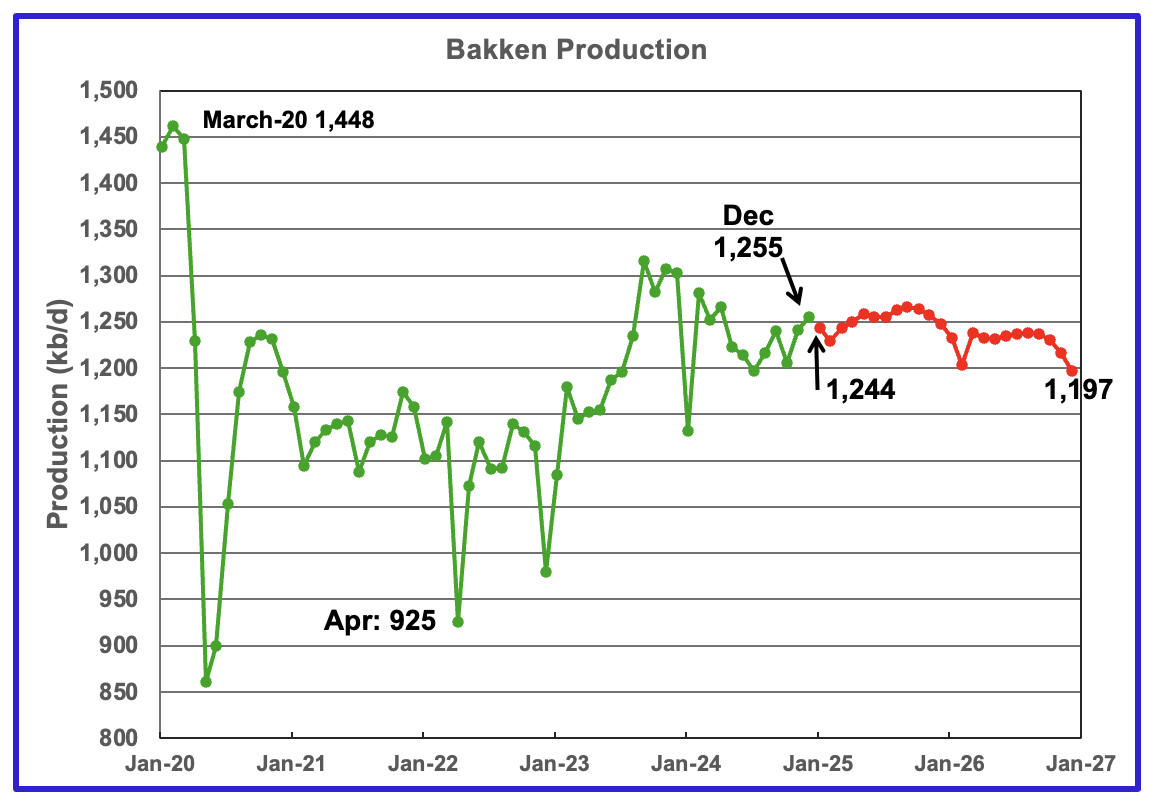
The DPR/STEO reported that Bakken output in December rose by 14 kb/d to 1,255 kb/d. The STEO projection out to December 2026 shows output to be essentially flat in 2025 and mid way into 2026 and then to start dropping.
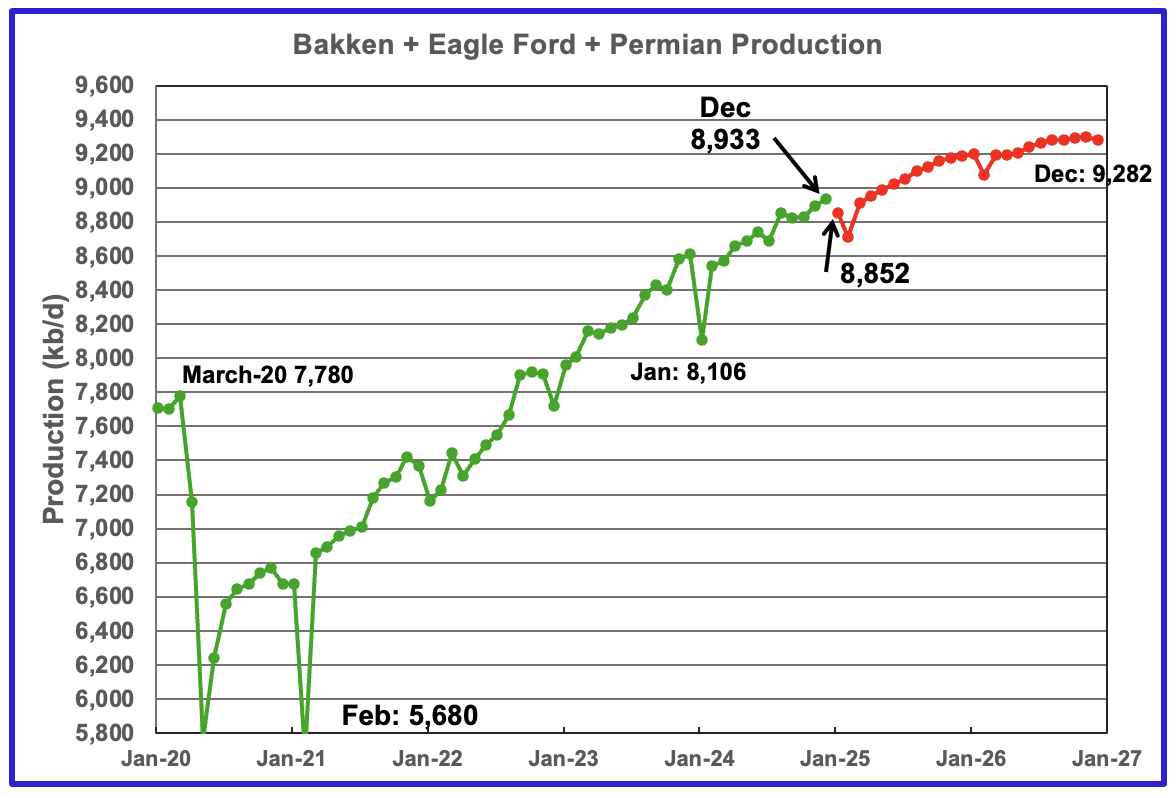
This chart plots the combined production from the three main LTO regions. For November output rose by 41 kb/d to 9,086 kb/d. Production in December 2025 is expected to reach 9,144 kb/d. This is a 46 kb/d production increase than forecast in the previous report.
DUCs and Drilled Wells
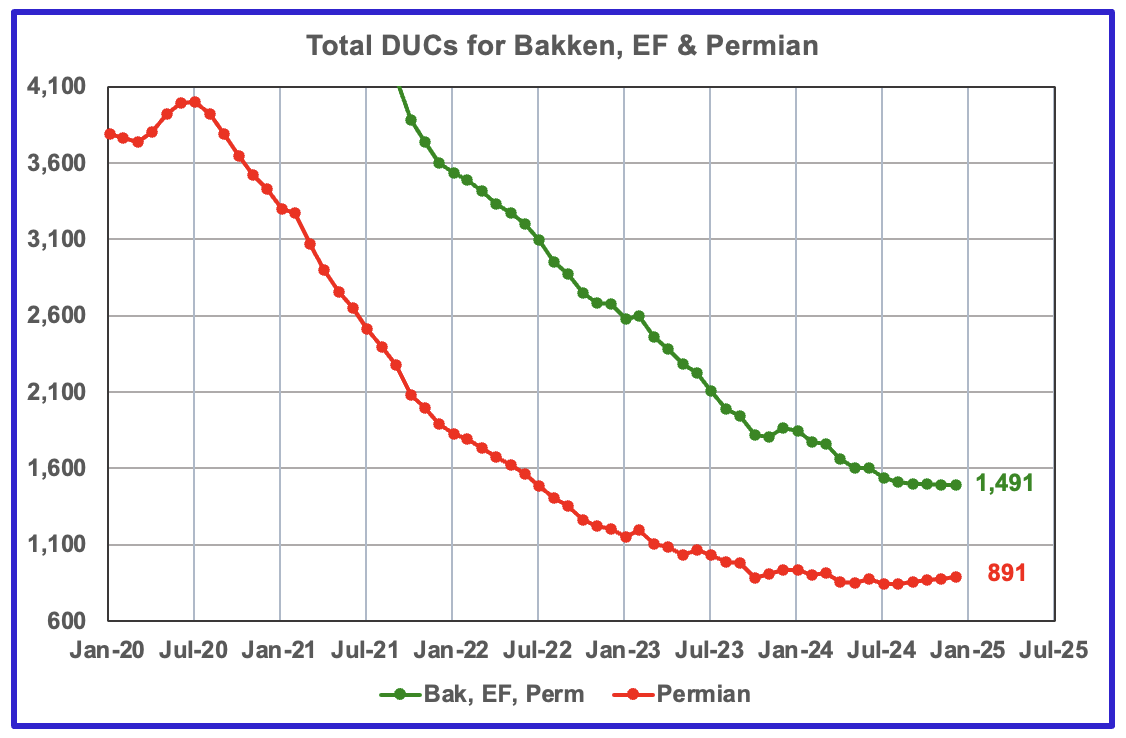
The number of DUCs available for completion in the Permian and the three major DPR regions has fallen every month since July 2020. December DUCs dropped by 1 to 1,491. In the Permian, the DUC count increased by 12 to 891. The July low was 845 DUCs.
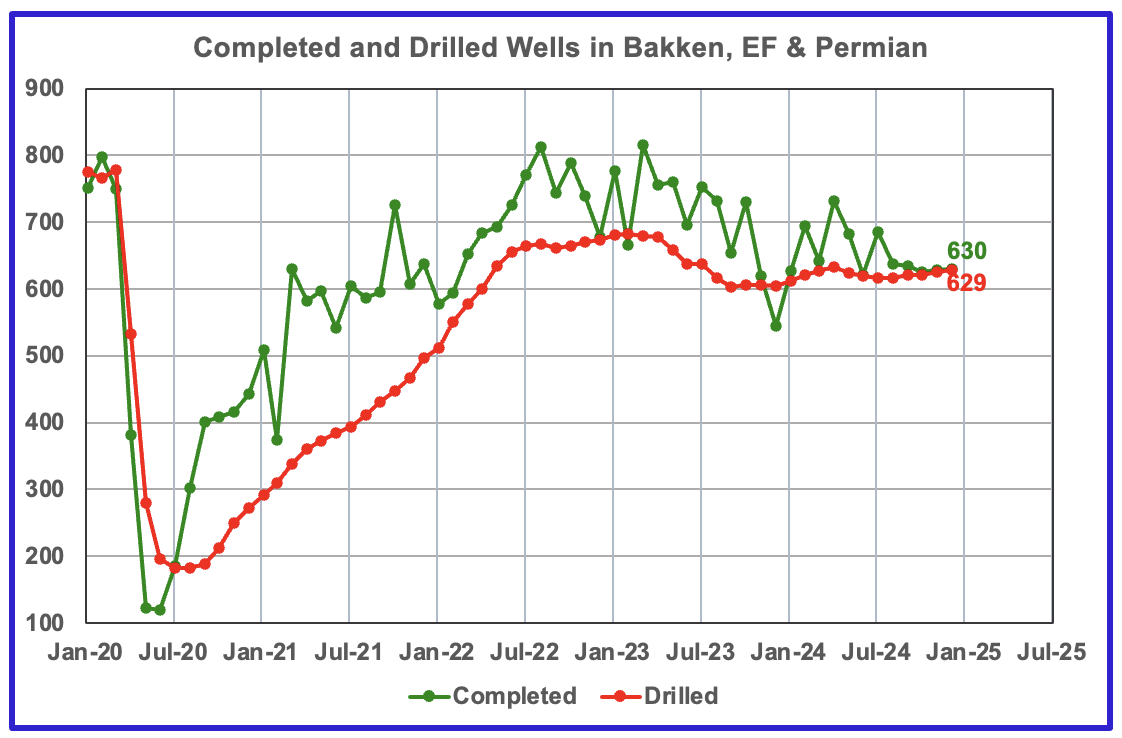
In the three primary regions, 630 wells were completed and 629 were drilled.
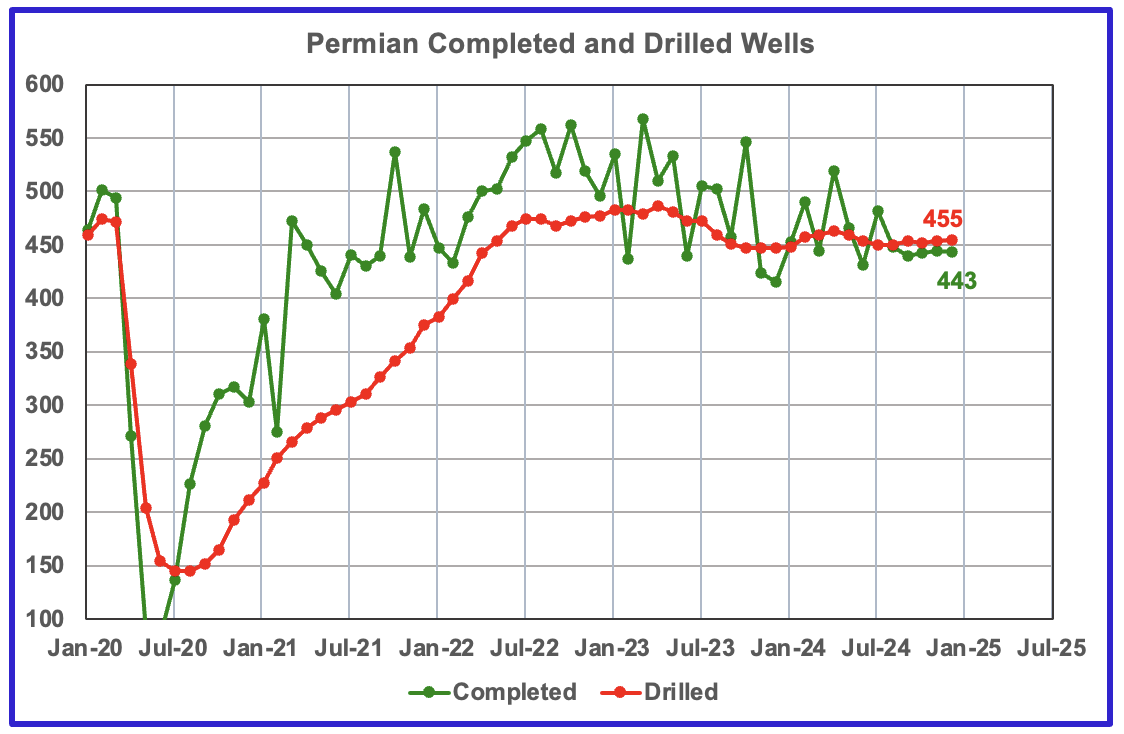
In the Permian, the monthly completion and drilling rates have been both stabilizing in the 440 to 455 range over the last 5 months.
In December 2024, 443 wells were completed while 455 new wells were drilled. This is the fifth month in a row in which the number of wells drilled exceeded the number of completed wells.
156 responses to “U.S. November Oil Production Drops to Year Ago Level”
Peak oil: Requiem for a failed paradigm.
MikeB,
Thanks. A very nice piece by Mr Berman.
Not everyone ignores unconventional oil, I have always considered both economics and geophysics in my analysis.
Maybe Art has not heard of peokoilbarrel?
This statement puzzles me:
No one here at POB thinks peak oil has anything to do with “running out.” Only people who misunderstand peak oil do.
No one here at POB thinks “record high . . . global reserves” has anything to do with flow rates–that is, how fast you can get it to markets.
The question is, as Professor Craig Hatfield has put it, “How long can oil supply grow?” “Reserve” is not the same as “supply.” Supply is what flows to market. The end of supply growth is not the same as “running out.”
The best point in his article is about obsession over peak dates: If we’ve learned anything, it’s that the phenomenon is too complex to predict.
When Art talks about “global reserves”, he is talking about the official numbers ?
Especially accounting the big jumps that came in the 80ies ?
Really a strange piece from Art.
Saying that “peak oilers” didn’t see shale oil coming might be true, but saying they don’t consider “unconvential oil” now, is simply false.
In Laherrere graph, shale oil is labeled “source rock” (I’m not sure exactly why, but from a geologist point of view, Laherrere always objected to the term “shale oil”, and even more to the French translation “petrole de schiste”, prefering “petrole de roche mère”, or “source rock” in English.
Also saying “peak oilers” only care about geology for me is ridiculous, a Hubbert curve is a model done “under geological constraints” but it basically models “the typical human behaviour” when it comes to extracting natural ressources, so basically it is ALSO an economics model (or human behaviour model).
Anyway thanks a lot to Ovi for this article.
And if US tight oil peak this year, the term “peak oil” will probably be back in the news …
Agreed. Art has also stated that Bardi’s Seneca Cliff model is wrong when in fact all of his examples were backed up with data. It’s simply a model of how extraction behaves repeatedly across history. In many cases, though not every case, the decline does end up being steeper than the ascent. Not sure what’s so controversial about this or why it needs gainsaying.
Not sure I’m buying Laherrere’s model that has oil declining to pre-1920s levels before 2050 though. Seems far-fetched based on current trends but we’ll see. If he’s anywhere close to the mark that should frighten everyone.
Auderic,
Some nations have decline quickly such as UK and Mexico, but these nations have mostly offshore output which can decline relatively quickly. These nations are the exceptions rather than the rule. If we look at all nations with declining C plus C output it does not look like a Seneca cliff. From 2005 the average decline rate was about 1.8% per year.
Here is a chart with nations that have declined since 2012, for all of these nations sive 2005 (the peak for this group of 67 nations was in 2005).
alternative view considering 2005 to 2023 to determine whether increasing or decreasing in output, for this case the decreasing nations decrease about 2% per year on average from 2005 to 2023 and there are 68 nations with decreasing output and 30 nations with increasing output and 127 nations with no change in output.
Longer term view of same two groups of nations as previous chart from 1973 to 2023. 68 nation group in blue peak in 2005 and then decline, the 30 nation group of increasing nations in red. The discontinuity around 1992 is due to nation changes around the breakup of Soviet Union, Yugoslavia and Warsaw Pact nations.
The steepness of the rise seems similar to the fall, that is, on average there is no Seneca Cliff apparent in the World data for declining oil producers. If we do an OLS on blue line from 1984 to 2004 the average annual rate of increase is 846 kb/d and an OLS on the blue line from 2005 to 2023 gives an average annual rate of decrease of 701 kb/d, so actually less steep on the decline, the reverse of a Seneca Cliff.
If we reduce the interval for the rise to 1986 to 2004 (so the length of the increasing and decreasing intervals are the same), the annual rate of increase in that case is 824 kb/d, still higher than the rate of decline from 2005 to 2023.
Very confusing article by Art Berman. It appears that he wants to keep adding to his blog even when he has very little new to add
The more I think about this —
Berman is a splendid thinker, speaker, and writer, but all he is really saying is that peak oil–instead of being a cliff just over the horizon–is more like a long downhill trend sometime off in the future. It’s splitting hairs.
“the stone age didn’t end because we ran out of stones”
same for biomass, coal, ..
OPEC has repeatedly slammed the international agency for what the cartel says are “dangerous” predictions of peak oil demand by 2030.
Saudi Energy Minister Abdulaziz bin Salman even called in 2021 the IEA’s Roadmap to Net Zero “La La Land”.
https://oilprice.com/Energy/Energy-General/OPEC-Drops-US-EIA-as-a-Secondary-Source-Assessing-Oil-Production.html
So, Saudi is not worried about oil demand peaking higher? Who would understand more?
Agamemnon,
OPEC consistently overestimates World liquids consumption, their forecasts are what they wish for World consumption and do not reflect reality.
How did Kodak do in forecasting future demand for its product around 1999-2000?
Saudi Arabia suffers from the same problem.
Interesting that OPEC is dropping many of the secondary sources it has used in the past (EIA and Rystad have recently been dropped and IEA was dropped in 2022).
Thanks Ovi.
In short summary, US oil production appears to have plateaued, with minimal growth since 2019.
COVID threw things for a loop, but think it is still key that USA ended 2019 at 13 million BOPD and has just grown a little since. Even EIA is now forecasting little to no growth in 2025 and 2026.
The oil price was incredibly stable in both 2023 and 2024, with the average annual price being almost the same both years.
On our end, LOE inflation also stopped in 2023 and 2024 after being very rough in both 2021 and 2022. LOE hasn’t really fallen for us much since 2022, but hasn’t risen thankfully. We have gotten a break on steel prices.
Trump wants $40 oil. If he gets it, or even $60 WTI, I suspect USA oil production will drop. It needs $75 WTI to maintain in my view. Everything still costs so much more than pre-pandemic.
Shallow sand,
Here is the Jan STEO forecast for WTI. If this forecast is correct for WTI in 2026 at $62/b and if we assume 2.5% inflation in 2025 and 2026, the the price of WTI in 2026 using 2024 US$ would be about $57.57/b. This is the reason the EIA forecast for 2026 is gradually decreasing output (from a high in December 2025) which corresponds well with your expectation for lower output at $60/b or less.
It’s been about a 25% increase in prices from 2019 to 2025. (Just overall CPI). So $60 WTI in 2019 is really $75 WTI in 2025.
IOW, I suspect you’re right on plateau, at current prices. I think there’s plenty of room to run in the Permian in terms of replacing decay. But it’s definitely slowed in growth. Bakken is pretty mature and doing it’s best just to hit 1.2 MM in the fall (after winter recovery). So it’s static. Eagle Ford is in a little bit of decline, probably. It was never as good a basin, really. Not sure about OK and CO and WY, but probably a tiny amount of growth but not moving the needle. OH and UT are cute stories, but also not moving the needle.
Nony,
Shallow sand actually owns a bunch of wells with his family,my guess is that his insight may be far better than yours. He says $75/b is needed now to maintain output and at $60/b he expects output would fall.
Chart below has WTI oil prices in 2019 $ per barrel including the 2025 to 2026 STEO forecast crude prices. Note that the average spot price for WTI in 2019 was $57/b.
Dennis.
We own lower 48 oil production, but ours is much different than shale, as we have discussed previously.
I’m not sure where EIA’s dramatically lower oil price predictions are coming from, unless there is something on the demand side I’m missing?
In any event, my view is that $75 WTI would allow for stable to slightly increasing USA oil production in 2025-2027, probably not getting to 14 million BOPD, but probably not dropping below 13 million BOPD, assuming no major weather related events.
$62 WTI in my view would cause USA to eventually drop below 13 million, if sustained. $40’s is really the equivalent of 2020’s price, so I think we’d go significantly below 13, maybe even below 12 million if sustained.
Although our production is much different than shale, surprisingly we have been somewhat similar economically. At $80 WTI we do really well, so does shale. At $70-80 WTI we do ok, no complaints, but nothing aggressive planned. Same with shale.
When WTI was barely above $40 in 2016, we struggled. Shale had big losses. When it was below $40 in 2020, same.
Trump’s message regarding oil and gas production and prices is political. It’s not backed up by the economics of what it takes to get the oil out of the ground.
2015-2019 growth was driven by debt, that has been well documented. Tremendous NOL’s resulted.
Of course, I have a vested interest in the oil price. I sure don’t want to go back to 2015-21 prices, because we just didn’t do great.
I think at one time pre-pandemic I said $60-65 WTI would be great. 2018 was the one good year we had from 2015-21. With the post-pandemic inflation, $75 is where we need to be now.
I suspect any shale executive and bean counter would say the same.
Thanks Shallow Sand.
The lower prices expected by the EIA in 2025 and 2026 are based on slow demand growth and the unwinding of OPEC plus cuts in output along with continued growth from Canada, Brazil, and Guyana leading to a stock build for crude Worldwide. The stock build results in downward pressure on oil prices at least in theory. The EIA does about as well as me forecasting oil prices (in other words they do very badly at predicting future oil prices.)
Your predictions on how $75/b vs $62/b vs $40/b would affect US output seem spot on to me.
Go read my post. I gave some supporting, interesting information to show that 75 now is like 60 back then, based on the CPI calculator. (It is actually 23% from 2019 to 2024 full year, so 25% for 2019 to 2025 is reasonable.) IOW, I was mildly supporting him. Go read my post.
Yes, I don’t think we disagree too much on this, and I agree that inflation since 2019 matters.
Thanks Ovi. My thoughts:
1. The GOM thing definitely looks like it is storm related (either past, or even in NOV). It almost explains the entire MoM change (108 versus 122).
2. I suspect TX is also somewhat storm related. It has some state waters production and even coastal onshore production.
3. Still not sure what the deal is with NM. I don’t think it’s in decline yet (too many rigs drilling, too much buzz there still). Might just be variation, noise (e.g. completion of megapads or not in a particular month). It does have relatively “new” production, so will crash hard if there’s a price drop. But at this point, I really doubt they are running out of rock. Delaware Basin is less drilled up than the Midland. I wouldn’t be surprised to see growth slow (already has, really). But I don’t think NM is in decline. That’s a one month anomaly.
4. ND: I expect drops during DEC-MAR. It often drops 0.1 to 0.2+ in the winter. We are not even done with the cold winter in ND yet (let alone the reporting of it). Given how plateau-ish overall US production is getting, I can see ND alone having a substantial impact on US totals for the next few months (but rebounding in 2Q-4Q2025).
5. MT is interesting. The webinar comments by the ND pipeline director (part of Director’s Cut) said that they are getting more flows from MT, so it is noticed in the region. He has to track the nearby states, since they all use same pipes. Not huge of course…but still noticeable when looking at the basin overall.
6. I really doubt that AK has recently started counting NGLs as oil. I have seen this suspicion/cope several times over the years from peak oilers and price bulls. Most dramatic was the resistance in 2017 to the numbers going up (look at HFIRs posts, e.g.). And then after 2018 and 2019, they just gave up that cope and accepted that shale had surged.
Unless you have some evidence (burden of proof on you), I suspect nothing has changed with how AK accounts for liquids. They have been doing this for a long time. And EIA hasn’t changed any classification rules. So there’s really no reason (other than unhappiness with the data) to suspect misclassification starting now. Consider: if we had dropping volume, would you suspect AK had started classifying some oil as NGLs? 😉
Nony,
Regarding your point number 6:
Alaska is reporting oil output at https://dog.dnr.alaska.gov/Information/Data
This is 14.335 million barrels or 478 kb/d in November 2024, the EIA is reporting 439 kb/d for November 2024, for PADD 5 the EIA reports NGL output of 64 kb/d in Nov 2024 and for 2023 Alaska produced about 50 kb/d of NGL, in any case there is a difference between what Alaska reports and the EIA of about 39 kb/d, NGL seems a likely explanation.
Also if we look at EIA C plus C data for Alaska in 2021 output is 437 kb/d. At this report
https://dor.alaska.gov/docs/default-source/press-releases/2022_02_25-department-of-revenue-releases-fall-2021-forecast.pdf?sfvrsn=74792cb1_9
from 2021, on page 49 of the report they have 2022 output forecast at 486 kb/d which is quite similar to 2021 output shown on the chart from that page. Here we have a 51 kb/d difference between EIA and Alaska State data and EIA reports about 50 kb/d of NGL output from Alaska in 2021. Seems Ovi nailed it in his guess that Alaska may be including NGL in its oil output.
1. There is no reason to suspect a sudden change to NGL accounting. Your explanation does not explain why this is showing up now, and not previously.
2. Your math is not evidence of actual misclassification. It is common for there to be differences in state accounting (even good ones) versus EIA. For example, with ND, EIA typically is lower by 25-50 bopd than the Director’s Cut. They are using different methods to compile their estimates. There’s no reason to resort to the NGL cope. Which I remind you FAILED DRAMATICALY in 2017…when we really DID have a surge of production, continuing into 2018 and 2019 and when the peakers and bulls just didn’t like the EIA reports.
3. It is very easy and normal to classify C&C versus NGLs. C&C is what comes out, at the lease pad from the three phase separator. NGPLs come from big huge megaplants, well downstream of the collection of natural gas. It’s a whole different part of the ecosystem. It is even different companies doing the reporting. Producers report for the 914. The NGPLs are reported by midstream companies that operate these big integrated facilities.
Nony,
The fact is that the amount reported in the 914 is very different from what the state is reporting for “oil”, note also that 50 bopd is 3 orders of magnitude lower than 50 thousand barrels of oil per day.
Look at the data yourself, the State of Alaska is likely reporting C plus C plus NGL. I have laid it all out.
In a different Alaskan report the data is a little closer when using WIO volume from PDF below
https://dog.dnr.alaska.gov/Documents/Royalty/PeriodicReports/RIVMonthlyWeightedAverageNSOil.pdf
In chart below EIA data is from PSM for Alaska the right column is from the Alaskan report linked above.
Many states have differences of state reported oil and EIA reports (especially at most recent month, before revisions).
Look at the process for submitting NGPLs and for EIA 914. They have separate forms. NGPLs are submitted by midstreamers that operate huge integrated plants. EIA 914 is reported by producers, based on production at the lease. It’s a completely different animal. Heck producers are very used to capturing oil production (and wet gas) because they have to pay royalties.
There is no Godly reason to suspect that very professional companies suddenly stopped understanding how to report their numbers. Especially when nothing changed in the filing forms.
Again, this is an old, old cope by peak oilers and price bulls and shows a lack of understanding of how reporting works. Cf. 2017.
Nony,
Try reading what I have written, I understand the reporting as well or probably better than you.
A difference of 1 or 2 % might be expected, but 50 kb/d out of 450 kb/d is an 11% error.
Note that the point is that the 914 is probably right, it is the Alaskan data for November at this link which seems wrong.
https://dog.dnr.alaska.gov/Information/Data
Click on Alaska’s Oil/Gas Production at page linked above to get result below 14.335 million barrels produced in November or 14335/30=477.8 kb/d, the PSM has 439 kb/d 39/439=8.9% error.
Yes there can be differences between state data and EIA data, often the state data is lower as is the case for Texas and New Mexico especially for recent months and in some cases the state data is a bit higher as is the case for North Dakota (2% higher than the EIA data for Nov 2024 and under 1% difference for September 2024 and earlier).
Many states have differences, especially on most recent month:
-For ND, EIA reports less than the state. Are those “negative NGPLs”?
-NM and TX and OK have huge differences where the EIA is bigger than the state on recent months. Now we know that is reporting lag…but if you live in 9-11 truther NGPL conspiracy land, how do you know part of the difference isn’t NGPLs? (You don’t.)
You need something better to say that EIA or the producers don’t know how to properly record C&Cs versus NGPLs. They deal with this all the time in their reporting for taxes, financial filings, royalty payments, and (for many many years) for the EIA. Go give your suspicions to the state and to EIA and get them to acknowledge they are wrong and the “PeakOilBarrelers” are right about misclassification. I’m going to wait for the professionals to sign off first, before the amateurs. You all have such a crappy previous record (again look at 2017 and all the cavitation about “must be NGPLs” when peakers didn’t like the numbers showing shale surging.)
Nony,
It may be coincidence but there is a significant difference between the reported production of C plus C and TAPS throughput, some of it might be NGPL, the fact is that the numbers are different and the differences are significant over a long period from 1987 to 2021. I don’t know for sure what the proper explanation is, my guess is that the EIA data is correct.
Also don’t claim I have said something I have not, that is pure bullshit.
I have not said the 914 reports are wrong, quite the opposite, there is a difference between what is reported by the EIA and what is reported by Alaska and the difference is similar to NGPL output levels as reported by the EIA, full stop.
The differences between EIA 914 and TX and NM is due to incomplete reporting which gets corrected over time, never has NGPL been mentioned in those cases or for North Dakota, in North Dakota I expect there is more complete data than the EIA has and it is likely to be better in my view, though the differences are mostly under 0.5% after about 3 months.
Not sure if this is relevant to the conversation…but I used to submit all the EIA reports directly to the EIA for monthly and annual liquids production and electricity generation as part of my job. Did this for about 7 years. I will tell you that the monthly reports were a complete crapshoot and only at the end of the year did things really get balanced up and what I’d consider accurate. EIA didn’t really care about the monthly reports in my experience. YMMV.
NGPL natural gasoline production hikes only when GOR get hikes due to bubble point breakthru. Then, this more valuable N gasoline part caught more attention by mid-stream.
See the plot here,
if original oil above bubble point, the gas produced have C2,3,4, 5 Ngasoline compositions in an obvious fast decline as HC chains get longer. But, after bubble point, the heavier part, i.e. Ngasoline actually went up in the gas stream, and got collected by Mid-stream, and the oil part at well head actually gets heavier due to Ngasoline loss in gas stream after bubble point.
data from,
https://www.eia.gov/dnav/pet/pet_crd_api_adc_mbblpd_m.htm
here is the TX-NM oil API, I made youtube video about TX-Bakken difference, and NM is similar to Bakken with oil original API well above 40, so it did not show the API heavier(<40deg API) modulation and hike trend.
https://youtu.be/2hxyNIhxmnQ
here is the youtube video last year when EIA announced shale oil is getting heavier.
Here are more data till Feb 2024,
https://www.eia.gov/dnav/pet/pet_pnp_gp_dc_nus_mbblpd_m.htm
and it is obvious that the Natural Gasoline increase YoY is getting larger, and so is the seasonal temperature modulation amplitude.
They now even listed scrubber oil and condensate besides C5, an obvious sign that the lighter part of oil stream gone with the gas stream to mid-stream NGPL.
LNG Guy,
No doubt that the reports are not perfect, but if we look at the overall 914 estimates vs final PSM estimates the estimates are pretty good, within about 0.5% most months.
Nony,
Nobody said this was a recent change in the way Alaska is reporting things, that is another invention you have conceived, read what is written and stop making shit up.
A difference between EIA and Alaskan data was observed, the difference was approximately equal to NGPL output and this was offered as a possible explanation for the 9% difference between the reported output between the two sources.
Any conspiracy has been imagined by you.
Can you point to either Ovi or me saying that shale output wasn’t increasing in 2017?
Some expert anaysis from the June 2017 STEO from the EIA compared with EIA PSM data.
Here is a chart from a post in 2017 I did.
https://peakoilbarrel.com/future-us-light-tight-oil-lto-update/
I had underestimated future Permian Basin output as USGS had only done studies on Midland Wolfcamp at that time thay produced fute studies on Spraberry in late 2017 and Delaware Basin in late 2018. So this estimate was too low. Tight oil output increased to 8.2 Mb/d by Dec 2019, my scenario had output increasing to about 5.7 Mb/d by Dec 2019
In December 2018 I had the following scenario for US LTO. A big increase due to USGS assessments and rapidly rising tight oil output in 2017 and 2018 (from 4300 kb/d at the end of 2016 to 6300 kb/d by October 2018 about 2000 kb/d in under a 2 year period). This scenario proved too optimistic and missed the coming Pandemic at the end of 2019. Note however if we assume the Covid crash and recovery was about 2 years the 9000 kb/d estimate at the end of 2022 in this scenario matches pretty well with the EIA tight oil estimate for Dec 2024 of about 8893 kb/d.
Maybe Alaska s too cold to run the stablizer, and so they add extra NGL
West Virginia also changed its NGL/oil reporting in 2018/2019, where they combine midstream NGL and oil together as liquid, while operators not complying 100%. But EIA some how only get the oil and lease condensate, which probably does not include NGPL oil and liquid at downstream— there is a huge difference like WV liquid report is 139Million Barrels in 2023 (about 350K BOPD),
https://www.wvgs.wvnet.edu/www/datastat/Marcellus/reports/WVGES2023MarcellusandUticaPtPleasantProductionSummary.pdf
EIA crude and lease condensate for WV is only ~50K BOPD.
https://www.eia.gov/dnav/pet/hist/LeafHandler.ashx?n=PET&s=M_EPC50G_FPF_SWV_MBBLD&f=M
Sheng wu,
It is not clear that there has been a change in how Alaska reports this. They may have always combined crude and NGL in their data.
Only in some reports do they do this if you go to their data miner you can get just C plus C, see my comment below.
Found this:
• the most recent Short-Term Energy Outlook (STEO)
model estimate (including interim estimates) for average
daily production for the lower 48 States and the Federal
Gulf of Mexico (GOM) (STEO Table 4a: http://www.eia.
gov/forecasts/steo/data.cfm?type=tables);
• daily production volumes delivered from the North
Slope of Alaska to the Trans-Alaska Pipeline System
(TAPS) (reported to EIA by the Alyeska Pipeline Service
Company);
• daily volumes of natural gas plant liquids produced on
the North Slope delivered to TAPS (reported to EIA by
BP); and
• daily production for South Alaska estimated from
monthly production reports (lagged by two months)
from the Alaska Oil and Gas Conservation Commission
(AOGCC).
From page 38 of Document linked below, no doubt the EIA uses this same Alaskan data for PSM data for Alaska.
https://www.eia.gov/petroleum/supply/weekly/pdf/appendixb.pdf
Also came across this
https://www.commerce.alaska.gov/web/Portals/18/pub/ReportsAndCharts/CHARTS_Avg_Daily_Oil_NGL_Production_Rates_Statewide_(1960-2020)_20210317.pdf
There is nearly an exact match between the annual data reported by the EIA and the total oil in this document from 1981 to 2019.
Also figured out how to get data directly from Alaska State website,
http://aogweb.state.ak.us/DataMiner4/Forms/Production.aspx
Just put month and year in two boxes under data and monthly output shows on page, so for November data put 11/2024 in two date boxes and you get 13,159,787 for total oil in barrels then divide by 30,000 to get kb/d so 13,159,787/30,000=438.66 kb/d. This matches the EIA data which is rounded to 439 kb/d. I checked data from Aug 2024 to November 2024 and the data matches exactly to the nearest kb/d for the State data and what is reported by the EIA in the PSM.
I said: “Just put month and year in two boxes under data”
data should have been “date”.
Nony,
Also consider this data
https://www.alyeska-pipe.com/historic-throughput/
It is very different from the EIA data.
The data can also be downloaded at link below
https://dog.dnr.alaska.gov/Documents/Royalty/TAPS_Volume_CY21.xlsx
and compared with annual North Slope data from the EIA at link below
https://www.eia.gov/dnav/pet/hist_xls/MANFPAK2a.xls
From 2015 to 2021 (no taps data after 2021) the percent difference in EIA North Slope C plus C data and TAPS data was between 8.5% and 11.5%, roughly 44 kb/d on average difference on average output of 457 kb/d (about a 9.6% difference.)
TAPS=Trans-Alaska Pipeline System.
So how does this gibe with a story that the RECENT INCREASE is a result of NGPLs. You would have to have a change in classification to explain a recent increase. Rather than a long standing delta. (Duh.)
Again…I’m going with the experts. Not the bloggers.
Nony,
I haven’t said anything about the recent increase only that the difference between what Alaska is reporting and the EIA is reporting might be NGL output. I don’t think the increase in November is anything but the typical increase seen at the end of the maintenance season. I was talking about the difference between the data reported by Alaska and the output reported by the EIA. Upon rereading the post, Ovi said the same.
Do you know how to read?
Alaska must have brought new fields online to consistently have YoY and monthly production gains which have broken away from the earlier dropping production trend red lines.
The comment prior to the one above talks about Alaskan reporting.
The Alaska Department of Natural Resources reports production of 14.335 million barrels of oil or 478 kb/d vs the EIA’s 436 kb/d. The difference could be that Alaska is also counting NGPLs as part of oil.
In the future I will just ignore your comments you are a troll.
Nobody said the recent increase was due to NGPLs, this is something you invented or is due to your lack of reading comprehension.
nonymous,
Listen man,
If you are not adding useful info, don’t waste Dennis’s time, so we can learn more from him.
Stop polluting, whoever you are with this unfortunate handle.
Anonymous
If you don’t like bloggers what the heck are you doing here?
You’re adrift. You need to focus.
Its would be really good if the US has lower oil output in these years, since that would enable this plateau phase to last a little longer. Also, higher prices would provide more of an incentive to learn to live with less. It takes time to adjust, and the culture at large hasn’t made much of an adjustment to what is coming after the plateau.
The goal should be to have changes happen gradually, rather than in a great chaotic downside rush.
The conservative approach is to use up the oil more slowly.
https://mishtalk.com/economics/trump-says-we-have-all-the-oil-we-need-true-or-false/
Trump says USA has all the oil it needs – True or False?
https://www.youtube.com/watch?v=UV4NNV1pDZs
12 minutes
Interesting analysis of USA shale from Chris Martenson and oil investor.
Mr. Martenson used to post here.
Permian, Haynesville and Barnett and Fayetsvile are quite different in geology and therefore cost per BOE.
Barnett and Fayetsville peaked earlier because their cost per BOE can not compete with Marcellus and Haynesville, and Hayneville can not compete with others even though it is quite productive and closer to the LNG ports.
The resources are still there and far above the 60% for Haynesville, Barnett and Fayets — they are just not profitable to produce with gas price around $3 or lower.
Trump V2.0 will reduce the oil productions from Iran, Venezuela and Russia, and then we will see oil price above $80 and gas above $6 in US and LNG price over $10~$12 in Asia and Eu, then we will see more gas and oil production happening in US shale patch. Sure, Permian oil is still probably limited by geology dominated resources and production methods even with higher oil price; but Haynesille, Marcellus and Eagle Ford (dry gas in Webb co and close to Port Chritstie and Starship LNG) will be “drill baby drill” no problem and could easily add 3 Million BOEPD (~18BCFPD).
Sheng Wu,
I wonder how much demand exists for US natural gas at $6/MCF for Henry Hub prices. There is a lot of cheaper gas in Russia, Iran and Qatar to compete with in the World so a lot of shale gas will be left in the ground.
I have been working on pre-feed studies for two world-scale LNG train (~5Mtpa/ea). Both have hit the skids as of now. In both cases there have been two reasons:
1. The Biden admin’s pause on LNG export approvals
2. The feed gas is proving to be too expensive to compete on the world market
One of the facilities already has trains in service so this would just be an expansion which cuts down on construction costs as the storage and loading infrastructure already exists. But they are not able to negotiate profitable contracts with potential buyers/shippers with the current market. Maybe this will change, idk. I’m hoping it does just for the sake that I’m getting kind of board with boring process improvement type projects and prefer working on the large design and construction projects.
“Everything faded into mist. The past was erased, the erasure was forgotten, the lie became truth.“
– George Orwell, “1984”
Dennis
Thanks for taking the time to answer Nony regarding the difference in the Alaska’s reported oil production vs the EIA’s. I have been away but took some time to follow the discussion.
I raised the question of the difference because I wasn’t sure if the EIA just used the 914 process or also spoke to oil officials in Alaska. Subsequent to posting the US update, I found a partial production report for Alaska’s December production which means they are one month ahead of the EIA and could be in contact with the EIA for additional info. This is what the report states:
“• ANS production down 0.8% month over month – 02/02/2025 (Login to read Full story) Alaska North Slope production averaged 482,485 barrels per day in December, down 3,765 bpd, 0.77%, from a November average of 486,248, and down 0.04% from a December 2023 average of 482,659 bpd. Crude oil averaged 426,650 bpd in December, 88.43% of total volume, down 3,958 bpd, 0.92%, from a November….
Assuming crude means “C + C” the difference must be NGPL’s.
I will answer Nony” other points tomorrow. It is getting late.
https://www.petroleumnews.com/pntruncate/479679785.shtml
Thanks Ovi,
As I said earlier you nailed it on suggesting the difference between the State reported “oil” and EIA reported C plus C might be NGL. Also Nony imagined you were claiming this had somthing to do with the increase in November from October when that was clearly not the case for those of us who know how to read.
Nony
1) We agree. 👍
2) I base my call on Texas peaking on Midland County peaking, Martin projection being on a plateau along with the GOR continuing to rise and District 8 being on a plateau since Feb 2024. I am suspicious of the November production projection.
3) NM depends on Eddy. The production benefits of the increased drilling in the county are behind it. November was the first down month for Eddy in a while but I think it is real and Eddy could be on plateau for a few months. Making a call on one down month is a bit risky, but combined with rig count, it is a good bet that Eddy is close to entering a plateau phase. Need a few more months to sort this out. A move to a higher GOR is needed to cement the case.
Lea County is definitely on a plateau and the continuing rise in the GOR is another good indicator.
4) ND. I agree winter weather is a continuing problem. Also Director of the NDMNR said that oil production will remain relatively steady for 2025. Also the DPR for the Bakken does not look encouraging.
5) Interesting comment on MT.
6) Addressed above in comment to Dennis. Unfortunately the crude comment was not in the November article. December article was Just a fluke.
Back checked September and crude comment was there Also was able to find an article on new Alaska field coming online.
https://www.petroleumnews.com/pntruncate/168013579.shtml
https://www.adn.com/business-economy/energy/2024/12/26/first-oil-production-begins-at-nuna-project-in-alaska/
https://www.petroleumnews.com/pntruncate/516692949.shtml
POB WTI Price Challenge
Something on the light side for today. 15 participants this year.
Thanks for that!
I had 117 end of year, with 100 avg.
Based on Trump attacking/embargoing Iran for attempting to assasinate him and Permian Basin decline.
https://www.reuters.com/world/us/trump-set-reimpose-maximum-pressure-iran-official-says-2025-02-04/
Andre
Sorry for the error. Just wondering if I also have someone else wrong.
See updated chart.
no worries mate!
Thanks for fixing it.
Love the work of the PeakOilBarrel lads!
if next 1~2 Months, i.e. December~January, US oil production number stay same as last year, oil price will get squeezed higher?
Particularly, if Permian obvious declines with an ominousBubble Point burst.
https://www.sciencedirect.com/science/article/pii/S2666049022000524
From the conclusion:
If we add to conventional oil production that of light-tight (‘fracked’) oil, our analysis suggests that the corresponding resource-limited production peak will occur soon, between perhaps 2022 to 2025. If then we add tar sands and Orinoco oil, the expected resource-limited total peak occurs around 2030, although there is a major question over whether significantly increased production rates of the latter two classes of oil is possible. Finally, the resource-limited production peak of global ‘all-liquids’ is expected about 2040 or a bit after if the latter liquids are also produced at the maximal rate.
Rgds
WP
Light tight oil rolling over
Gulf of Mexico appears to have also peaked
Thanks Seppo.
Note that for US L48 regional C plus C output (from STEO) the estimates look different. The tight oil estimates from the EIA have not been very good for the most recent 12 months.
Granted this includes conventional output, but my guess is that the conventional onshore L48 output would either be flat or decreasing at current oil and natural gas price levels.
US L48 excluding GOM conventional output using EIA’s tight oil estimate. My guess is the the actual conventional output after 2022 is about 2Mb/d or less and the tight oil output is being underestimated by the EIA.
I wonder if Shallow sand sees output rising in his field?
Production continues to slowly fall in our field.
I think looking at what non-shale oil states have been doing would be helpful here.
Florida, New York, Pennsylvania, Illinois, Indiana, Kentucky, Missouri, Kansas, Nebraska, South Dakota, Alabama, Mississippi, Arkansas, Louisiana, Arizona, Nevada, California? Maybe total those and see where you are over time? Maybe add in ND non-Bakken?
Am I missing any? It’s tough to break out the shale v conventional in Texas, New Mexico, Oklahoma, Colorado, Wyoming and Montana?
I’m not sure what has caused the growth in Utah. I’ll read about that.
Shallow sand,
Thanks for that info.
I did what you suggested for states you listed except Louisiana because part of the Haynesville play is there, I did not include North Dakota non Bakken/Three Forks. From 2021 to 2024 the decline rate was about 6.3% per year. I think Utah is Uinta Basin tight oil causing the increase.
Shallow sand,
Chart below with exponential trendline fit to data.
Dennis.
I suspect you’d find something similar for conventional production in the shale states.
Another thought. Maybe look at the shale states from 1985 to 2005. Compare them to the non-shale states during the same time period.
1985 was the end of the 1970’s-1980’s drilling boom. Oil prices fell off a cliff in 1986.
Shallow sand,
That was my thinking as well. If we are correct and the EIA L48 excluding GOM data estimate is also correct then tight oil output would look like chart below.
Shallow sand,
Excellent idea, chart below. Shale states are Pennsylvannia, Ohio, W. Virginia, Oklahoma, Texas, New Mexico, Louisiana, North Dakota, Montana, Wyoming, Colorado, and Utah. The Non-shale states are everything else except Alaska and GOM. Shale states decline at average annual rate of 3.82% from Jan 1985 to Dec 2005 and non-shale states at about 2.93% per year.
Note that in my tight oil estimate upthread I assumed shale states conventional declined at about 6.3% per year, if we use the rate of decline for all L48 onshore conventional from Jan 1985 to Dec 2005 as a guide we get about a 3.5% average annual decline rate. Using this rate gives us a lower tight oil estimate, see chart next comment.
revised tight oil estimate, about 83 kb/d lower than previous estimate for November 2024. Note that conventional decline may have increased as it did in the non-shale states to about 6% per year, if so the initial estimate may be better.
Dennis and Shallow,
Great discussion!
I think what is happening is that there are two separate offices at EIA, and they used to produce different reports, but they are now both folded into the STEO
The LTO office is the one that produces the LTO estimates, and before getting folded into the STEO they were giving the data by formation, not only by basin. I noticed then that they only have data for the main formations: Wolfcamp A/B, Bonespring and Sparberry. So I think their data reflects the stagnation from these formations. However, NOVI Labs has said that ALL of the growth in shale the last year or so is coming from other horizons. So that probably explains it.
The other office that shows growth in the shale basins is the one that was producing the DPRs, and they collect data from the entire basin production, so that’s why they show growth…
Kdimitrov,
I agree, unfortunately I no longer get updated data from Novi so trying to guess at tight oil output to fill in these blanks.
Dennis.
3.5% is probably a pretty good number to use, if you aren’t able to access the actual data.
Again, just looking for something to use as a guide, clearly the actual data would be preferable.
Thanks Shallow Sand.
I’m holding out for one more GOM peak – 2 Wilcox fields have recently come on-line, Whale and Anchor, and 2 more are set to come online in 2025, Shenandoah and Salamanca. And at least one Norphlet tieback, Chevron’s Ballymore is set to come on line in 2025, and also, I think, at least one of Shell’s tiebacks to Appomattox.
This final peak may not be as high as the previous 2 shown in the Seppo’s chart.
Thanks Bob,
Great to hear from you. If you ever care to do another GOM update, just let me know. George Kaplan no longer is doing updates, I think he has lost interest in peak oil.
https://www.youtube.com/watch?v=37vZSNJvCz4
Trump changed the name….It is now the “Gulf of America”
Nobody will call it the Gulf of America, Trump is such a clown.
Maybe Farage will want to change the Irish Sea ro rhe British Sea.
Mike G,
Trump may rename that too, maybe the Donald Sea.
One surprising difference in shallow v.s. deep water GOM oil & gas
The shallow water which also targets shallower subsea depth reservoirs have GOR at almost 2~20MCF(average 12 kilo scf)/bbl , basically mostly gas reservoirs.
While the deep water targeting the Wilcox trend with also deeper subsea depth. Previously, geological model would say you will only find more gas going deeper water and subsea depths.
Yet the GORs for these deeper water & subsea depths are about 100~500scf/bbl, totally reversed as black oil reservoirs with API well under 40. They are basically the same hypersaline lacustrine oil as found in both sides of Atlantic and going onshore in south America, i.e. Guyana, Santos Basin presalt, Venezuela, and Vaca Muerta.
https://www.eia.gov/outlooks/steo/report/perspectives/2024/09-gulfofmexico/article.php
https://www.eia.gov/outlooks/steo/report/perspectives/2024/09-gulfofmexico/supp2.png
so, there is a huge incentive to drill deeper baby deeper drill!
Comparison of my December 2018 tight oil scenario (84 Gb) with more recent tight oil scenario for US from December 2024 (83 Gb). Note that I expect the EIA tight oil data will be revised higher over time to about 9400 kb/d for December 2024 (plus or minus 50 kb/d). Peak for most recent scenario is 9700 kb/d in Jan 2027, this scenario is certain (probability=100%) to be incorrect.
Dennis,
So, based on newer EIA data the latest forecast scenario will be peaking now and then seeing decline faster?
Sheng Wu,
My current expectation (best guess) is the December 2024 scenario represented by the thin red line on chart above, the back diamonds are the official EIA tight oil estimate which I believe is too low from Jan 2023 to December 2024, this is accounted for already in my best guess scenario. The current scenario does decline more steeply after 2030 than the 2018 scenario, but the difference is marginal. The entire scenario is highly speculative in any case and assumes oil prices will remain under $80/b (Brent price in 2024 $) for most future years.
besides oil price, real per well decline rate and EUR based on the drilling in the last 5 years will also kick in the near future drilling activities.
Sheng wu,
My scenario builds in decreasing EUR in the future based on productivity decline so far on an EUR per thousand feet metric which shows lower productivity per 1000 feet of lateral in the Permian basin. I assume about 2% per year decrease in normalized productivity/EUR for the average Permian well in my scenario. I assume lower profits in the future lead to a fall in the completion rate. Any and probably all of my assumptions about the future are certain to be incorrect.
Dennis,
I guess still quite some operators don’t factor in the same EUR decline, and instead probably assume improvement in bigger fracs.
Dennis,
I don’t know why Coffeguy does not prepare a nat gas post to finally spell out some science and region by region analysis in order to have the slightest chance of avoiding the soundbites (cherry picking and anecdotal s). Maybe thousands of years…
Just want to thank Dennis for avoiding the traps of opinions and anecdotal “evidence”
and for staying humble and respectful.
Big Thank you Dennis!!!
Dan,
I have significantly ‘pulled back’ from my long term, serious studies of the hydrocarbon world.
As such, I am not properly positioned – nor, frankly, inclined – to research and post data that validates my optimism regarding adequate, long term supply of both liquid and gaseous hydrocarbons.
Not really necessary, actually, as the data is readily out there for any who choose to self educate.
Starting point might be the well known 2011 report from the EIA “Review of Emerging Resources: US Shale Gas and Oil Plays”.
Should one not want to read through the ~100 page pdf, merely a quick glance at the famous graphic on page #6 ought to give pause to even the most die hard pessimists and ‘peakers’. (The depiction and massive size of the Apppalachian Basin with its stacked Upper Devonian, Marcellus and Utica formations underlies my optimistic projections vis a vis future output. My minimal monitoring of ongoing production reinforces this outlook).
No, Dan, Art Berman (someone with whom I have disagreed nearly 100% over the years) has nailed it just right with his two recent controversial posts.
He claims over 2 centuries worth of recoverable oil and NGLs.
Soundsaboutrite to me.
Edit … that eye popping shale gas/oil graphic from the EIA is actually quickly accessible by doing a Google Image for ‘eia shale gas oil resources’.
Coffeeguyzz,
That EIA study rhat you point to was a copy and paste of investor presentations, if that is your basis for optimism, it is not very solid.
Can let us know what you are thinking when you say ultrasound natural gas prices? Do you mean under $2.50 per MMBTU in 2024$?
Here is a scenario using the USGS mean TRR estimate for Applacachian Shale Gas resources (primarily Marcellus and Utica formations) which is about 306 TCF. About 115 TCF of cumulative dry gas has been produced since Jan 2000 and from Jan 2011 to Dec 2019 the annual rate of increase was about 3.26 BCF/d. I assume this rate of increase is reached from Jan 2025 to Dec 2026 and then the annual rate of increase slows to 1.6 BCF/d from Jan 2027 to August 2027 when the peak is reached at 50% of URR for cumulative shale gas output (153 TCF). Peak is about 40 BCF/d in late 2027 followed by decline.
A more realistic scenario (this is very optimistic) would reduce URR to about 70% of mean TRR so a URR of 214 TCF with a peak in April 2024. This actually matches the data pretty well.
I doubt the optimstic scenario presented will represent actual output in the future.
Based on the output data (CTMA=centered twelve month average) a peak in 2023 looks like a reasonable guess.
Of extreme interest:
Crude production cost by producing country from “Inside China Business” channel.
https://www.youtube.com/watch?v=pO-5voKt1gY
Claims *Peak Oil Demand* IS 2025 for worlds largest oil consumer and
market prices may not support …. Drill Baby Drill
I think I read that EV’s outsold ICE cars in 2024 and they are 5 years ahead of schedule
in the state EV goals whatever they are.
My Observation : Increasing kWh from the increased efficiency/output of the latest generation of PV Panels is also becoming a factor.
never underestimate US ingenuity either.
Elon’s electrifying/electrocuting US goal might also work out and US could export 3Million BOE electricity in 10 years.
The take home message is different-
‘Never underestimate Chinese innovation and determination.’
true,
China made solar, EV & batteries from dream to reality.
US also made oil and gas independence from dream to reality.
By geology background, China should have more or similar shale oil and gas as US, but monopoly by big 3 barrels made the FF sector way lagging behind renewables sector.
Sheng Wu,
US still depends on oil imports, the US independence in this regard is a myth. Natural gas we are independent for now, but many of the LNG investments may become stranded assets as US natural gas is likely to peak around 2030 (or sooner). Perhaps the US will move quickly to wind and solar to replace natural gas for elctric power and perhaps install more heat pumps to reduce natural gas use for space and water heating, but currently any such plans are delayed by the fools in power.
A bit OT but I´m still amazed people in general haven´t grasped the ingenuity of the heat pump. But if they were left without a fridge, AC or freezer they would be in big trouble shorttime…
US import of heavier crude to refine is actually a monoploy process to rip off and control Canadian and Venezuela heavier oil.
In the process, US actually make more money with minimal investment, i.e. avoiding costly downstream refinery investment, and import and export oil at the same time is a good strategy to control global oil market.
Laplander…so true. I recently learned about an interesting project where they have installed a large district geothermal heat exchange loop (clsed loop). All the buildings served, commercial and residential, can tap in with their own fluid exchange heat pump. Other sources of heat or electrcity can be added as to the system as available and if needed, such as from solar/gas furnace/biomass/grid.
This system is different than many others in that it does not attempt a large central heat pump.
Also, I see that the list of vehicles with heat pump for H/C is now getting pretty long.
Dennis,
You have repeatedly (and accurately) stated that you have grossly underestimated shale oil production over the years.
It is mildly astonishing (to me, anyway) that you blithley offer such sweeping statements about future US natgas production when – I am assuming – you have minimal granular production information at the present time.
As your focus has always been on oil, it would be understandable that you would not devote much time to the world of natty.
However, as we proceed into this year of 2025, you (and readers of POB) might want to be mindful of your (semi uninformed) projections as they are looking to be GROSSLY inaccurate to the low side in the coming years.
This is not meant to be seen as negative criticism.
The proposed plans to construct numerous data centers in the App Basin region – along with other areas – is predicated on the assurances of abundant, reliable electricity. Virtually all of this juice will be powered by natgas-fueled generation plants … several of which may be contracted by the big upstream boys supplying dedicated (to the data centers) natty at ultra low pricing.
Your expressed view (wish?) for a ~2030 natgas peak displays a fair amount of unawareness, IMHO.
Coffeeguyzz,
See
https://peakoilbarrel.com/u-s-november-oil-production-drops-to-year-ago-level/#comment-785699
Before December 2018 I had underestimated tight oil output, my estimates were mostly in line with AEO reports by the EIA. My estimate from 2018 is similar to my estimate in 2024.
This is my current guess for US shale gas, you are correct that I do not follow this closely, it is based on the assumption that about 67% of the mean USGS TRR for shale gas will be economically recoverable. This is roughly the level of my tight oil URR relative to the USGS mean TRR estimates for tight oil.
Note that the ultralow pricing that you assume for natural gas will lead to ultralow profits and ultralow levels of shale gas well completions. The data centers will be built in areas with good solar, wind, hydro, or nuclear power resources. Natural gas may provide some backup, but will not be a major player.
Coffeeguyzz,
Also consider the EIA’s AEO 2018 for tight oil shown below compared to EIA’s tight oil official estimate, there are many who underestimated how quickly tight oil output would grow.
Shale Gas data in TCF per year, highest TTM average was Feb 2024 at 30.75 TCF/year.
Dennis,
That TTM natgas production chart is EXACTLY a great example of why so much your projections are skewed.
For over a decade now, I – and several others – have continuously tried to point out the WHY of ‘stuff’ behind your numbers.
Quote from EIA.gov site [Today in Energy/In Brief Analysis, February 3,2025] … “Spot natural gas prices at the Henry Hub in Erath, Louisiana … averaged $2.22/MMbtu in 2024, the LOWEST average price in inflation-adjusted dollars EVER RECORDED!!” (emphasis added by moi).
And this, Dennis, plays a big role in the ‘flat’ of your chart.
There is SO much natty in the US it would make your head spin.
While you continue to ‘peg your hopes’ on Renewables (sic) for future energy needs, the rest of the US will continue on embracing our abundant, inexpensive hydrocarbons to power our everyday necessities.
Gar. Own. Teed.
Coffeeguyzz,
Low natural gas prices will result in flat output, higher prices will reduce use and make it harder for LNG exporters to make a profit.
There may be less shale gas that can be produced profitably at $3/MCF than you believe.
Are you still thinking 30 Gb will be extracted from Bakken as you were claiming 10 years ago? It’s looking like 8 or 9 Gb URR.
What is your estimate for shale gas URR?
Dennis,
I stopped following the Bakken long ago and do not feel knowledgeable enough to say what the ultimate recovery might be.
However, as only about 10/15 percent of the OOIP was being recovered awhile back, I would expect Enhanced Oil Recovery techniques will definitely be employed if/when the price of earl makes this approach economically feasible.
As far as natty Ultimate Recovery … sorry, I am just not much of a numbers guy.
I will say with VERY high confidence that the US has about 100 years’ worth of recoverable natgas just in the already-recognized basins.
Small example … the other day I was going over the production histories of several dozen Tier 3 wells in Pennsylvania.
Fascinating.
Almost all were 10 to 12 years old, definitely step out/exploration efforts WAY off the acknowledged high grade areas.
Still, there were many that have clocked 4 Bcf/6 Bcf in these ~100/~120 months online.
Dennis, these wells were using relatively archaic drilling/completion techniques back then.
The size of these Tier 2/Tier 3 lands dwarfs the so called sweet spots. (For comparison sake, today’s high grade wells regularly do 8 to 10 Bcf in the first year).
Lottsa gas yet to be extracted.
Lottsa gas formations (the Mancos B and Piceance being just 2) still out there that cannot economically compete with the Mighty Marcellus and Permian ass gas.
Utica will likely be found to be more productive – ultimately – than the Mighty M.
Just not its time at the moment.
” Natural gas may provide some backup, but will not be a major player. [for data centers]”
Dennis, I don’t see it that way, for the intermediate term anyway. Looks like lots of nat gas turbine orders are popping up recently. For example-
https://www.power-eng.com/gas/turbines/ge-gas-turbines-to-be-rapidly-deployed-for-onsite-data-center-power/
https://www.bloomberg.com/news/articles/2024-10-23/mitsubishi-power-sees-data-centers-boosting-gas-turbine-orders
https://finance.yahoo.com/news/ge-vernova-power-city-sized-202004497.html
Coffeeguyzz,
I agree real natural gas prices were historically low in 2024 and the long term average from 1989 to 2024 was about $5.63/MMBTU (2024$), since 2015 the average has been lower at about $3.63/MMBTU in 2024$. Note that output was relatively flat from 2020 to 2024, but less so from 2015 to 2020.
Hickory,
Natural gas net generation has been growing at 4.4% per year from 2014 to 2023, much of this increase has been at the expense of coal power output which decreased at an average annual rate of 8.6% in the US over the same period (2014-2023). Non-hydro renewable net generation increased at an average annual rate of 10.6% from 2014 to 2023, if these rates continue renewables will gradually tale a bite out of coal and natural gas power.
There is little public info on Tesla’s Battery expansion at Spark’s Giga Nevada.
It’s a political hot potato since it’s CATL’s tech with US ownership.
LFP Paks can get well under 3 cents / kWh but while the materials are
common the process and supply chain preprocessing is exotic. It may be epoch in terms of
a step in energy transition.
More on Canadian crude
U.S. LOSES Cheap Canadian Oil to China as Beijing SUES the US Over Tariffs – What’s Next?
https://www.youtube.com/watch?v=zval-Aagczg
I spy with my little eye…us peak:
Is this a logistic curve?
Looks like freehand.
Rig Report for the Week Ending February 7
Rigs and Spreds Rebound
– US Hz oil rigs increased by 2 to 440. The count is also down 19 rigs from April 19 and are up 13 relative to their recent lowest count of 427 on July 24th. The rig count has remained in a very tight range between 427 and 442 since July. Will it get back up to 450 in the coming weeks?
– The New Mexico and Texas Permian rigs were unchanged at 96 and 190 respectively
– In New Mexico, Lea and Eddy were unchanged at 49 and 47 respectively
– In Texas, Midland and Martin were unchanged at 26 and 25 respectively
– Eagle Ford added 1 to 42
– NG Hz rigs rose by 1 to 81
Frac Spreads Rebound for the Week Ending February 7
The frac spread count rose by 8 to 198. It is also down 62 from one year ago and down by 43 spreads since October 11.
It is a bit strange how much frack spreads have dropped since 2023, perhaps the fracking operations have seen a greater increase in efficiency or maybe there has been a fall in the number of natural gas focused frack spreads.
Dennis
I think it takes them fewer days to do a Frac. Something to look into. It will be interesting to see how high the Frac spreads rebound to by March/April.
Dennis,
What has changed is not exactly efficiency, but the number of wells being fraced simultaneously: it has gone from 1 to 2 and now to 3 (trimulfrac). Operators have many wells per pad so they have these spreads with 2x or 3x horsepower sitting on the pad and blasting multiple wells simultaneously. The sat trackers see only a single spread, but it is a more powerful one…
Kdmitrov,
Makes sense, it would be nice to have data on horsepower of frac spreads employed, but this data is hard to come by, probably available in proprietary databases. I do not have access to those.
https://www.youtube.com/watch?v=uy5w8_FqXcI
10 minutes
Trump requires that oil prices go down during his administration ( what an idiot ).
Saudi Arabia ignores Trump
NG: I agree with Coffeeguyzz, we have so much natural gas it’s hard to put a number to it. All the major shale oil basins are in some sort of decline at this point. As the bubble point is reached and the quality of those wells declines, the GOR increases dramatically–at least for a few months before the final death throes. In the Permian alone there are now roughly 55,000 of these wells. Before it is all over that number may double. There are several thousand more such wells in the Bakken, Niobrara, Eagle Ford–all the big shale oil basins. Consider that NG really is nothing more than an unwanted byproduct in those oil wells–and man they’ve got a lot of it.
Then move over to dry gas: the mighty Utica, and the Haynesville–those wells are absolute monsters, under high pressure. It is not unusual to see a 70 MM cfpd well. And they stick around for several years too. The Barnett hasn’t completed its course, or the Mancos. Neither has the NG belt of the Granite Wash or the entire Anadarko Basin. I could go on naming fields that were run through rapidly, taking only the sweetest spots because they filled the gathering stations, but I’m sure you get the point. There’s NG in abundance. I suppose we could squander it and run out but it would take a dedicated effort. Even if we rip through the Tier-1 dry gas, there’s a lot of Tier-2,3,4 that will be as good due to refinement of extraction techniques.
Furthermore, because of politics, there’s likely going to be dramatic fragmentation of prices. The Gulf Coast NG in close proximity to LNG trains is going to bring pristine prices; more insular gas not so much. Big Oil recognized that it would be next to impossible to create alternative energy to run the data centers that was price competitive and also a time-sensitive build, so they are planning to create NG utility plants adjacent to the data centers. As usual, the market will follow the pipeline.
I am an equal opportunity guy, so I don’t enjoy dissing other forms of energy. However, for those of you who might not be following the much balleyhooed lithium ion battery dumps for electricity storage, check out the third fire at the largest one in the world at Moss Landing. Why they would construct a pilot project of this massive size in that spot beats me, but with this latest fire they have themselves a mess. It is next to the lettuce bowl (Salinas Valley) and upwind from the strawberry patch (Watsonville). It is also next to the Elkhorn Slough, a national otter preserve, and just around the corner from fabled Pebble Beach. They are just now being forced to check for forever chemicals and heavy metals in the soil and guess what. Consider this: Since the twenties this same facility was used to house several NG fired turbines to provide electricity for a large surround. With nary a disaster.
Gerry Maddoux,
Knowledgable people have told me the USGS mean estimates for TRR are far too high for tight oil plays. Let assume they are correct. Do you suspect those same folks would have the same opinion for USGS mean TRR estimates for shale gas? The number is roughly 1637 TCF for the mean USGS TRR for shale gas and about 124 Gb for tight oil mean TRR. My estimate for economically recoverable resources in the case of tight oil is about 83 Gb or about 67% of the USGS mean TRR estimate. Note that many knowledgable people have suggested my tight oil estimates are far too optimistic (others have claimed the opposite). My guess for shale gas simply takes the 1637 TCF TRR and multiplies by 67% (from my tight oil work which is far more extensive than my look at shale gas) which would be 1097 TCF for URR, my model is 1100 TCF so I rounded up a bit to make it a round number.
Do you have a guess for shale gas URR in the US?
yes, lots of the EUR per well estimate are based on initial parent well in tight oil plays, they could put a big frac get high IP without considering laterals’ spacing. before 2022, the spacing is as low as 500ft average in core of Permian, now it is close to 600ft according to Novi, and it might still be too small, and probably it should be 750ft as Scott Lapierre suggests, or even 1,000ft.
The scenario could be as worse as this:
the operators drilled 2X number of well as they should, and get higher production real fast, and then see in after 3years the real dismal decline, and then decided to pull back drilling and resources estimate. So, we might see a much faster decline once peaked and falling starts for tight oil.
The typical spacing in Marcellus has been about 750ft in the core, and lots of operators have been drilling at 1,000ft.
Dennis, I have to agree with Gerry… the US is blessed with a lifetime of still untapped nat gas. I do not know much about the “knowledgeable people” or the USGS methodology for producing their TRR numbers, but it seems that their analysis is not reflective of what I see in the actual data from specific wells in the various plays and the still massive undeveloped fairways that exist. Seems like the USGS needs to get more detailed in their analysis vs. broad generalizations… but in all honesty, I have not ever looked at their TRR data as I do not give generalized government data a whole lot of weight.
What I do like is trolling through actual individual well production data all over the various shale plays and what I see are consistent signs that my teenager kids will have plenty of nat gas for their kids if they want it. This is just my hunch based on years of my addictive habit of well data voyeurism. Fairways are expanding and completions are getting better. Specific example… Nacogdoches County, TX: I am under four Aethon wells drilled and completed in July of 2023. To date (over about 17 months), those wells have made a combined 20 BCF and as of November 2024 they are still producing a combined 30,000 MCF/D, or almost a BCF per month. Other than the 2024 summer price swoon period, I have been paid over $2.00/MCF through November 2024. These wells have likely paid out in a challenging price period and are still making ~$2,000,000/month gross at $2.00/mcf. Wish I had a bigger NRI, but I’ll take what I can get.
My point of the example is that this production has a relatively shallow decline and multiple remaining undrilled locations in a 1,500 gross acre Unit. Meanwhile, there are hundreds of locations on undrilled acreage all over this one county. This same scenario exists in many other shale plays like the downdip Eagleford, stranded “Alpine High”, Anadarko, Arkoma, Appalachian, Marcellus, etc, etc… Lots and lots of undrilled inventory that will have to wait a while for a drillbit. Meanwhile, the massive associated gas does its part.
Also, this popped up today… further supporting that nat gas will be the driving force for data center build out. Wind and solar will certainly also have a big chunk, but nat gas will be king for decades:
https://www.businesswire.com/news/home/20250207943457/en/Energy-Transfer-and-CloudBurst-Sign-Agreement-for-Natural-Gas-Supply-to-Data-Center-Project-in-Central-Texas
Gungagalonga,
I look at actual shale gas output, it has been pretty flat since 2020, maybe higher prices will lead to higher output, but the higher output tends to reduce the price.
Gunga,
Re “lots and lots of undrilled inventory …
In a comment to Dennis upthread, I mentioned several dozen Tier 3 Pennsylvania wells with cums of 4 to 6 Bcf over 8 to 12 years online.
Although you know this, for wider clarification/emphasis, a 4 Billion cubic foot well is energy equivalent to a ~700,000 barrel oil well.
Not too shabby.
The wells I checked were in Cameron, Clinton, Clearfield, Potter, et al counties.
WAY off the fairway and virtually NO new drilling in these areas for about a decade.
Think about that for a minute.
There are hundreds of thousands of acres – currently undeveloped – that have proven production of three quarter of a million barrel oil energy equivalence wells just sitting there.
Again, this is with using obsolete D&C methods.
Don’t think we will be running out too soon.
it seems that shale gas production and recovery is way different than tight oil, especially light tight oil where PVT controlled phase separation after bubble point pressure drop off really hurt the recovery.
Whereas shale gas does not have this problem, they could last over 8 years easily in Marcellus, but Haynesville also decline too fast and after 5 years maintaining the production is a headache.
Gerry,
Do you have an opinion on using NG to replace OIL in the broader economy?
Specifically ICE cars, diesel, plastics, etc.
What kind of effort and infrastructure would it take? refineries?
Genuinely curious. Not being a smart ass.
thanks!
GM,
I don’t have the expertise to comment on the NG supply, but I can comment on your concluding point. “With nary a disaster.”
Not true.
Fossil fuel driven climate change is already a disaster many times over. Cyclone Nargis, ’22 and ’23 European heat waves, Hurricane Helene, and on and on. And it’s only getting worse.
Above, T HILL:
I was, of course, referring to the Moss Landing Utility Plant, the topic of the paragraph.
The world is filled to the gills with “disasters.”
If I missed a comma somewhere, please bring it to my attention as well, will you.
Mr. Maddoux,
You might find it of interest to know that the current highest-per-day flow rate well in Bradford county, PA is the Indian Foot 102HC from Expand Energy (the new company formed from the merger of Chesapeake and Southwestern).
It averaged 77 MMcfd for its first 55 days production.
Now online for just under 5 months, it has a cum over 9.3 Bcf … the energy equivalence of over 1,600,000 barrels of earl.
Still flowing VERY strongly.
Dennis Coyne: “Do you have a guess for shale gas URR in the US?”
No sir, I have no idea how much shale gas can be extracted in the U.S. But every time I look at old conventional dry gas fields I am impressed by their continued viability, even those with multiple benches and sharp gradations in geologic permeability. For example, the old Hugoton Field exhibits complicated geology but has been going strong since the early twenties and so far has produced 35 Tcf of dry gas, with only a few million barrels of oil. I’m not suggesting that every gas field is comparable to the Hugoton, just that some of those wells that are still producing are over seventy years old. And even today, when you need the increasingly hard-to-find natural gas, helium, you go to Hugoton. It’s been infill drilled with about 15,000 wells but believe it or not there’s still some room on the fringes for productive wells–it’s just that with the massive NG overhang that’s been prevalent in the U.S. from the shale oil basins in the last two years no one wants to dig for small potatoes.
I don’t want to beg the point but when you get in a truck and drive from one dry gas boom town to another, and look at amplitudes in the plethora of seismic charts (more than one man can examine in a lifetime), you’ll see plenty of places that were not drilled out in a go-go era. In many of these prolific areas they installed massive gathering plants, but the production was so high that they hit capacity and pretty soon the whole carnival just pushed on to another “find.” I mean, if we do get energy impoverished and people are scrambling for NG, there is no shortage of these high-amplitude drilling sites, complete with nearby infrastructure.
Thanks Gerry,
Not clear conventional natural gas is going to get the job done. Shale gas based on the information I have will be more limited than the optimists imagine.
Andre:
I am constantly amazed that the long-haul trucking industry didn’t wholeheartedly adopt the Cummins model espoused by the late T. Boone Pickens. It makes much more sense than electric. Mr. Pickens put a lot of money and thought into developing CNG stations along the major trucking routes. Coffeeguyzz follows this industry like a hawk; he can provide more color.
LNG is the cleanest feedstock for the petrochemical industry, by far. Especially for the pharmaceutical industry. To have more LNG free of all toxic materials from the deep earth we simply need more LNG trains.
Andre/Mr. Maddoux,
While I no longer track these matters as assiduously as I once did, here are a few observations …
Re plastics/petrochemicals … absent huge price differentials like $40 WTI and $6/mmbtu, making polyethylene and polypropylene from ethane and propane is cheaper than sourcing from oil-based naphtha.
So much so that there has been a global build out of crackers – for ethane – and PDH plants – for propane. These multi billion projects would not be built without the expections of a long term supply of abundant, (relatively) low cost feedstock. (One Indian company claimed an increase in annual profits of $300 million by switching from naptha to ethane a few years back).
Re diesel … throughout some of 2024, heavy truck sales in parts of Northern China were almost half LNG fueled. This was largely due to (*important factors*) cheaper fuel price (versus diesel), availability of supply and infrastructure, and introduction of new natgas-fueled engine availability … likely the Cummins N15L.
Cummins has started mass producing these engines this past spring in upstate New York and early reception from trucking companies is positive.
Re general displacement of ICE engines … that is actually possible right now for anyone who wishes to purchase online hardware (about $800 last I checked) and get a moderately competent mechanic to enable swapping out petrol/gasoline for natty. The storage tanks have been a daunting challenge as the cost runs into the thousands (last I checked) and poses space difficulties.
That said, there continues to be advancements in all related fields of CNG/LNG handling with new adsorbent (with a ‘d’, not ‘b’) materials showing stunning promise.
Iran has several million CNG vehicles on the road. Some petrol-starved Venezuelans have swapped over to propane use and carry propane tanks in their trunk.
One could spend umpteen hours reading up on all the innovations that continue to arise in these matters.
One of the biggest ‘maybes’ to me is this … if/when much wider spread adoption of natty takes place, it is conceivable for an American homeowner who has residential natgas supplied (over 50 million homes) to ‘fill ‘er up’ right in his driveway with his sub 500 psi tanks enabling a ~500 mile driving range.
Interesting future may be in the offing.
Australian public buses are powered by Natty.
The predictable routes allow them to refuel.
I am thinking the bottleneck is availability of refueling stations.
Andre,
Or the price of natural gas.
A History of Clean, Green Bus Fuel
When it comes to reducing harmful bus emissions, OCTA leads the pack. In 2000, California established emission requirements for diesel particulate matter (PM) and oxides of nitrogen emissions (NOx) from urban buses and transit fleet vehicles. Transit agencies were required to select either the diesel path or the alternative-fuel path. OCTA selected the cleaner alternative fuel path and has exceeded all state emission requirements for an urban bus fleet as well as for transit fleet vehicles.
OCTA operates more than 500 fixed-route buses in Orange County. The majority of the fleet features near zero-emission engines that run on clean-burning renewable compressed natural gas (CNG). This environmentally conscious fuel is produced by the decomposition of organic matter from landfills and other sources and then processed to purity standards.
As part of its plan to convert the OC Bus fleet to 100 percent zero-emission technology by 2040, OCTA is conducting a pilot program using plug-in battery-electric buses and hydrogen fuel-cell electric buses. This pilot will help determine which technology – or mix of technologies – will help bring even cleaner air quality to Orange County.
Compared to 2002 baseline emissions, OCTA reduced its PM emissions by 97 percent and NOX emissions by 99 percent after choosing to use alternative fuel.
CNG fuel is safer than gasoline and diesel because it is non-toxic and does not contaminate ground water.
When OCTA switched to CNG engines and cooling systems in 2016, it destroyed the old engines and provided documentation of that work to the South Coast Air Quality Management District, which in return provides funding to help pay for the project.
https://www.octa.net/about/about-octa/environmental-sustainability/oc-buses-run-clean/#:~:text=OCTA%20operates%20more%20than%20500,compressed%20natural%20gas%20(CNG).
OCTA Debuts First Plug-in Battery Electric Buses
Wednesday, April 20, 2022
facebook sharing button Sharetwitter sharing button Tweetsharethis sharing button Share
While Earth Day provides a chance once a year to focus on environmental protection, OCTA remains committed at all times to protecting what makes the county such a special place to live and to keeping people moving with a balanced and sustainable transportation system.
The latest effort toward a greener Orange County is the introduction of the first two plug-in battery electric buses into the county’s fleet of OC Buses.
The two plug-in electric buses have begun operating on routes throughout various parts of the county, part of a pilot program of 10 plug-in electric buses that will be tested. The remaining eight buses are expected to be delivered later this year.
“This is another important step toward zero-emission transportation technology – one that will help bring even cleaner air quality to Orange County,” said OCTA Chairman Mark A. Murphy, also the Mayor of Orange. “This is a great opportunity for us to test the latest technologies to ensure we continue providing the highest level of safe, reliable transit.”
In 2020, OCTA also began operating 10 hydrogen fuel-cell electric buses. This new pilot will help determine which technology – or mix of technologies – will work best for Orange County moving forward.
The move is part of OCTA’s plan to convert the OC Bus fleet to 100% zero-emission technology by 2040.
https://blog.octa.net/posts/octa-debuts-first-plug-in-battery-electric-buses/
Iran has a huge fleet of natty powered passenger cars.
The US natty powered cars modification is not allowed in many states, or made illegal — obviously manipulated.
Coffeeguyzz,
Only happens if natural gas is as plentiful as you imagine at the ultra low prices that you imagine. We will see.
Also keep in mind the Potential Gas Committee’s estimate for Probable resources (best guess by engineers.) is about 1200 TCF, when we add reserves (625 TCF) and cumulative production (1515 TCF) we get 3240 TCF for URR, if we hit peak at 50% of URR that would be about 1620 TCF cumulative output, about 100 TCF more until peak. These numbers are from year end 2022, we produce about 37 TCF per year so this suggests a peak around 2025, based on best guess engineering estimates of probable resources.
Gas production and peak position might be different to oil due to slower decline and high recovery factor.
Because conventional methods to maintain pressure in oil production, i.e. water pumping, is not available to tight oil, and huff-puff gas EOR is still not well adopted, tight oil might peak even earlier in terms of resources recovered percentage, i.e. like 30~40% instead of conventional oil’s 50%; and tight oil rise sharper due to higher initial IP, more tight spacing laerals and bigger frac job and then fall off faster than conventional oil.
Coffee-
“In China, SDEC (Shanghai Diesel Engine Company) is a prominent manufacturer of natural gas vehicle engines, producing a range of natural gas engines for heavy-duty vehicles, passenger cars, and other applications; they are known for their quality and reliability in the Chinese market”
not sure if Cummins has any market share there.
Cummins has a joint venture with Dongfeng (No. 2 truck manufacturer in China), they also offer LNG truck engines.
The top LNG engines manufacturer is WeiChai, in Shandong.
Thank you
So perhaps RR needs to produce more 211s? Business opportunity?
Pretty sure the trains at Melköya are RR powered, but could be wrong, it happens a lot…
Anyway, there´s several “Jumbo” engines there, to run the compressors and coolers.
Not that efficient, but that goes for the whole LNG thing in my view.
After further digging into EIA database of NGPL, singling out TX is a real shock,
https://www.eia.gov/dnav/pet/pet_pnp_gp_dc_r3a_mbblpd_m.htm
NM an ND Bakken don’t have this last 3 years Natural Gasoline (C5 ) increase suddenly reverse and outpace C2,3,4.
normal associated gas has composition C1>2>3>4>5 ,
after serious PVT fractionation, the order reversed.
An update to October Non-OPEC and World Oil production has been posted.
https://peakoilbarrel.com/october-non-opec-and-world-oil-production-rose/
A new Open Thread Non=Petroleum has been posted.
https://peakoilbarrel.com/open-thread-non-petroleum-february-11-2025/