Comments related to oil and natural gas production in this thread. Thank you.
Month: November 2018
Open Thread Non-Petroleum, November 28, 2018
Comments not related to oil and natural gas production in this thread. Thanks.
Global Carbon Dioxide Emissions and Climate Change 2018-2100
A Guest Post by Dr. Minqi Li, Professor
Department of Economics, University of Utah
E-mail: minqi.li@economics.utah.edu
September 2018
This is Part 5 of the World Energy Annual Report in 2018. Links to Part 1 to Part 4 are shown below:
This part of the Annual Report provides updated analysis of world carbon dioxide emissions from fossil fuels consumption, evaluates the future prospect of global warming and considers the implications of global emissions budget (to limit global warming to no more than two degrees Celsius) for economic growth. Figures are placed at the end of each section.
In 2017, fossil fuels (oil, natural gas, coal) accounted for 85 percent of the world primary energy consumption. Consumption of fossil fuels results in emissions of carbon dioxide and other greenhouse gases that contribute to climate change. In 2017, the global average surface temperature anomaly was 1.18ºC (degrees Celsius). The ten-year average global surface temperature anomaly from 2008 to 2017 was 1.00 ºC (NASA 2018). Global surface temperature anomaly is measured by the difference between the global average surface temperature and the average global temperature during 1880-1920. The latter is used as a proxy for the pre-industrial global average temperature (Hansen and Sato 2016).
A scientific consensus has been established that if global average surface temperature rises to and stays above 2ºC higher than the pre-industrial global average temperature, dangerous climate change with catastrophic consequences cannot be avoided. According to Hansen et al. (2016), global warming by more than 2ºC will lead to the melting of West Antarctica ice sheets, causing sea level to rise by 5-9 meters over the next 50-200 years. Bangladesh, European lowlands, the US eastern coast, North China plains, and many coastal cities will be submerged. Further increase in global average temperature may eventually lead to runaway warming, turning much of the world unsuitable for human inhabitation. Read More
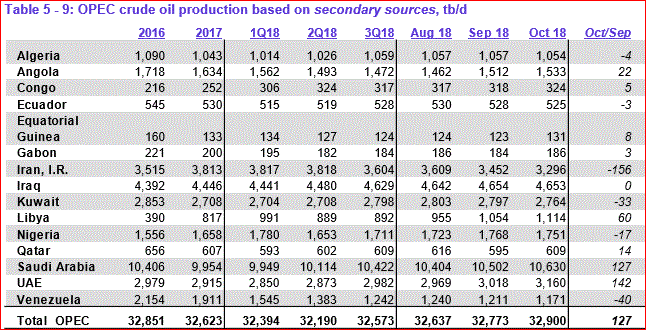
OPEC October Production Data
All OPEC data below is from the OPEC Monthly Oil Market Report The data is through October 2018 and is in thousand barrels per day.

OPEC 15 crude oil production was up 127,000 barrels per day in October. that was after September production was revised upward by 13,000 bpd.

OPEC production will likely be up a bit more in November but down considerably in December.
Open Thread Non-Petroleum, November14, 2018
Please post all comments not related to petroleum in this thread.