A Guest Post by George Kaplan
Reserves
The OGA issues UK oil and gas reserve values each year, but only in total, not for individual fields as is done in Norway, Mexico, GoM and Brazil (which reports by basin rather than field). The reserves are not backdated to discovery date so it’s not possible to generate anything like a true creaming curve, but they are split into categories of proved, probable and possible, and, since 2015, contingencies. Operators in the UK North Sea have up to five years to announce estimated resources in discoveries so there may be uncertainties for recent years, unlike in the Norwegian section where estimate must be declared as soon as they are known.
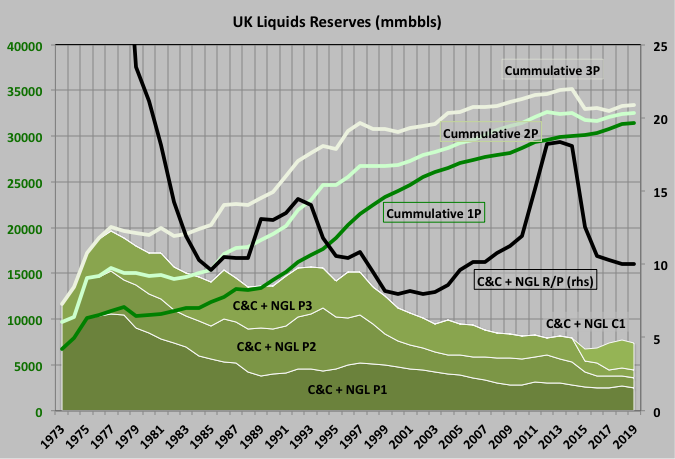
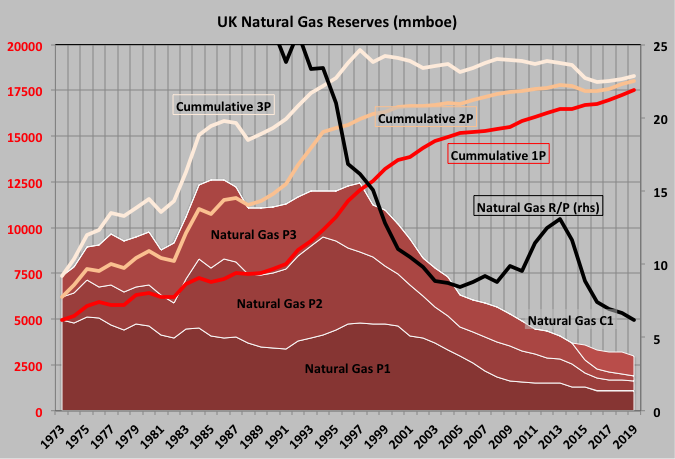
For both oil and gas the impetus to increase production after 2015 wasn’t accompanied by a matching increase in reserves so there was a marked decrease in R/P, which is still continuing for natural gas. The values of 11 and 6 years would suggest average decline rates going forward of 9% and 15% respectively (and increasing for gas). There are a number of projects in development or planned but their reserves should mostly be already included in proved or probable/possible numbers.
Remaining reserves are really quite low now – around the amount of a couple of the largest early fields – and are falling slowly, while cumulative reserves are starting to trend towards a limit (more so for oil than gas).
Recent Production
Oil production plateaued through 2019. A local peak was expected for 2018 but delays in some projects pushed this backwards. Recent production is showing a marked decline possibly partly due to the pandemic impact though I would expect this to have a bigger effect in the coming years because of delays in exploration, FIDs and maintenance. The current decline is more due to the lack of recent discoveries, the shut down and decommissioning of rising numbers of platforms and the trough in FIDs following the 2015 price crash coincident with an increase in start-ups of projects initiated in the preceding years when prices were high and now starting to decline. Plus there is a seasonal effect as planned maintenance requiring shutdowns is scheduled for late spring and summer.
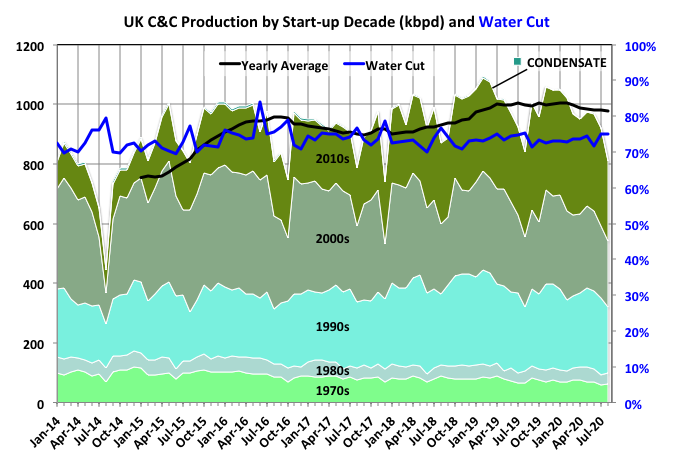
Most greenfield projects are designed with a plateau period but few actually show much of one, either because of start-up and operation issues or because of the desire to accelerate production in successful developments. Tiebacks and other brownfield upgrades tend to show rapid ramp-up and immediate decline. Both types of projects are represented in start-ups since 2010, most (by number) are tiebacks but the largest proportion of new production is now coming from heavy oil projects (some individual projects are described below). These may show real plateau periods because they are limited by capacity for handling produced water, which appears soon after start-up, but this won’t be evident before another couple of years operation.
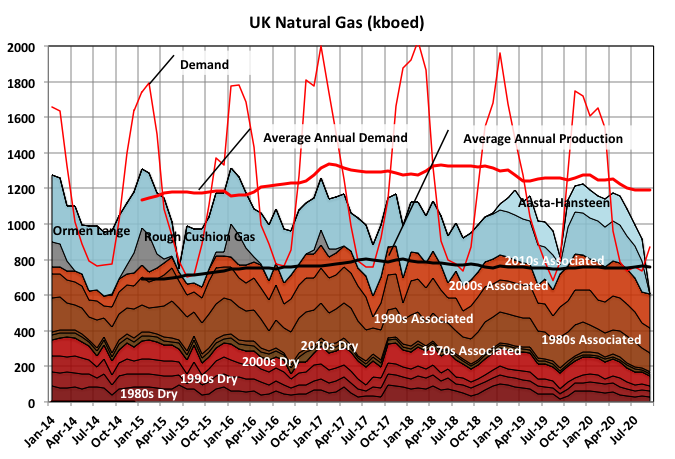
Natural gas had a longer plateau than oil. This year’s decline is less easy to identify because of the seasonal cycle as maintenance and peak shaving production is scheduled to match demand.
Most of the imports to the UK come direct via dedicated pipeline from the Nyhamna gas plant in Norway. Originally this only handled production from the Ormen Lange field, which is now in decline, although subsea compression is being added to boost production and increase recovery. To fill the pipeline Aasta-Hansen was recently started and Dvalin, a smaller field, is nearing start-up.
LNG now fills most extra winter peak demand but in the past the Rough field storage, decommissioned in 2016, or some seasonally operated fields such as Sean in the Southern North Sea, now mostly exhausted, were used.
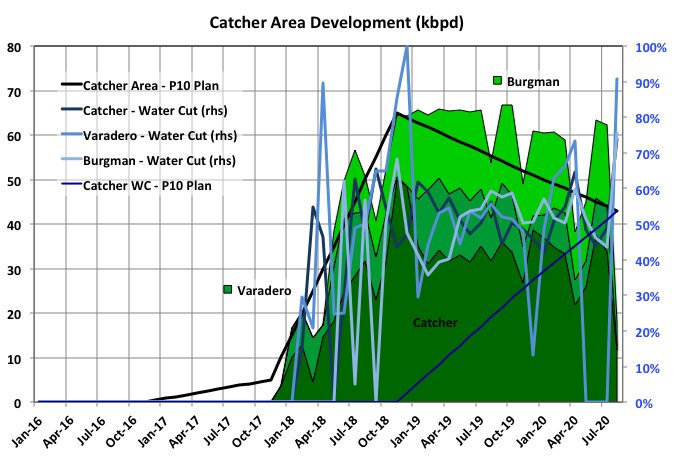
Before development is allowed in the UK the project operator is required to submit an Environment Statement. These are also made available on-line at the operators’ sites. One section required in each is an expected best-case production profile for the full life cycle. This is called a P10 estimate (unless you are Chevron who, just to make it easier for us all, decided to call it P90), meaning the operator has modelled a 10% chance of meeting or exceeding this number. Some operators also a P50 profile, but not many. The P10 estimates for the largest recent developments are shown in the following sections and also for estimates of new fields used in projections shown below.
Buzzard
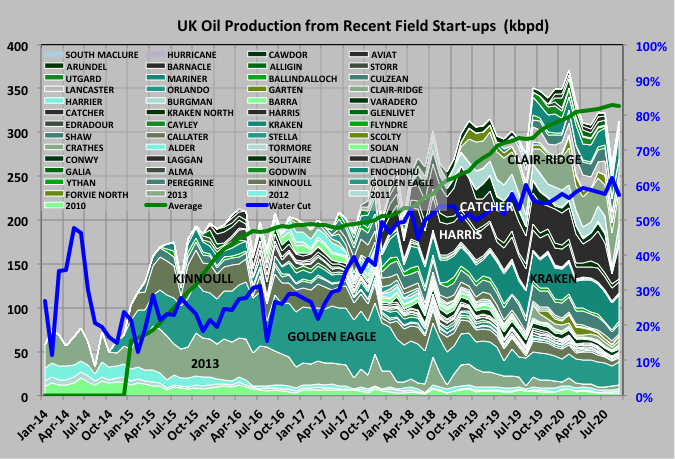
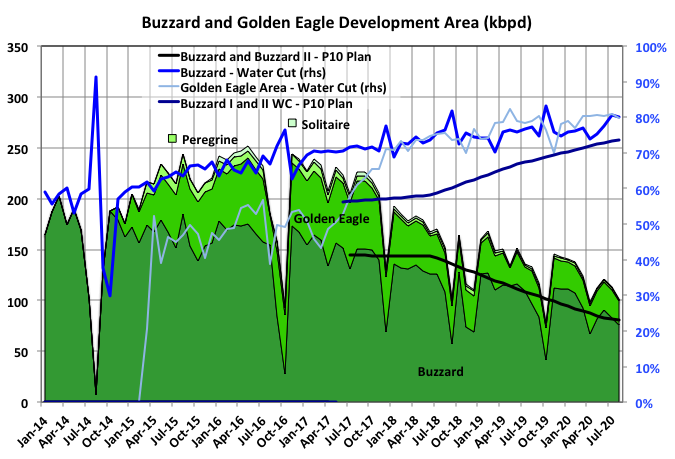
Buzzard has been the largest producing UK field for this century, has exceeded expectations and continues to produce at the high end of recent estimates. A new development, Buzzard II, was due to start in 2020 but has been delayed by at least a year because of the price crash. It will allow a maximum net increase of production of about 45,000bpd, in its second year, and add 50Mbbls of recoverable reserve.
The Golden Eagle Area Development (GEAD) is operated by CNOOC, like Buzzard. It was another fairly large recent start up now in terminal decline but with no redevelopment plans.
Clair Ridge
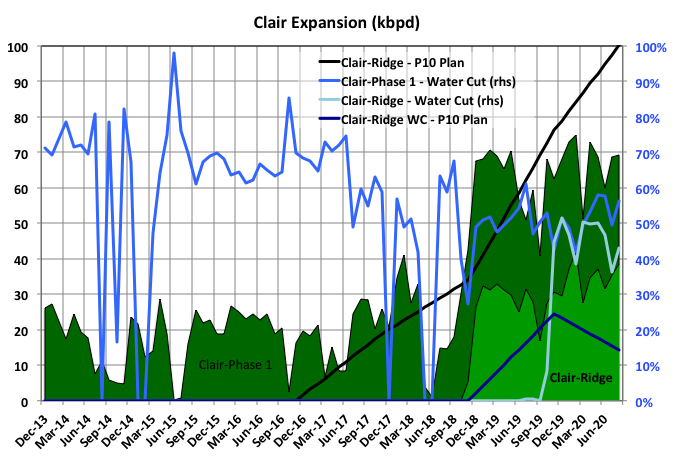
Clair Ridge has been one of BPs major projects of recent years. It was built to exploit further the billions of barrels of heavy oil (API in the low 20s) in place in the Greater Clair area. It is a second platform after Clair Phase I. Things have not gone well with cost overruns, the start-up delayed from 2016 and, now, poorer than expected well performance with higher water cuts. As a minimum more wells will be required, which will probably limit the overall throughput, but there may need to be a write down of reserves. There were plans for another platform with three drill centres in the area but those must be on prolonged hold now.
Quad 604
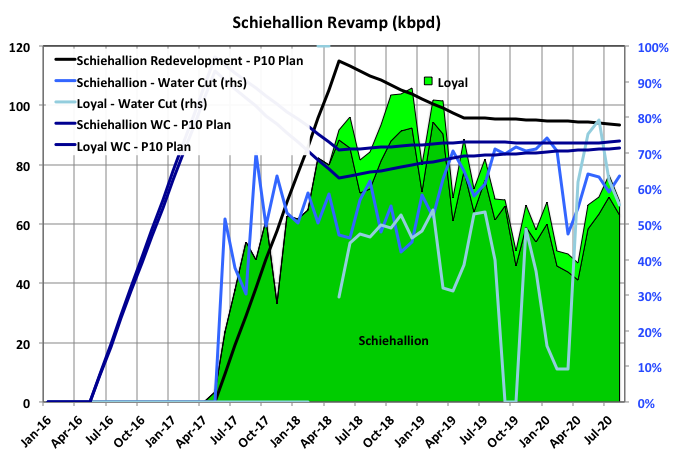
Quad 604 is a new BP operated FPSO that has replaced the old one for the Scheihalion and Loyal fields to allow redevelopment and significant increase in their ultimate recoveries. So far performance has been average at best and looks like it might get worse as overall decline rate is predicted at around 9% but natural decline looks to be around 20 to 30% and few new wells have been added since start-up.
Catcher Area
The Catcher Area contains medium heavy oil (API in the higher 20s). The initial development comprises three fields and so far their performance must have exceeded even the most optimistic estimates, though they are now starting to decline. There are three other, significantly smaller prospects in the area; the first, Laverna is in development and is and due to start production in 2021.
Western Isles Development Project
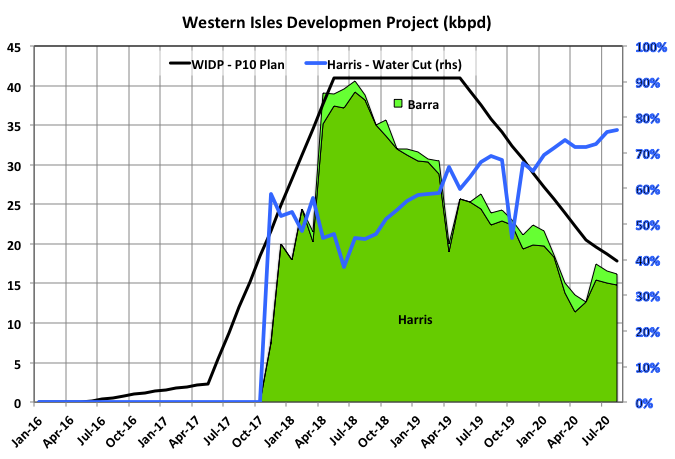
WIDP has been a bit of a disaster. It was probably marginal when it was originally approved and since then there have been several years of delays, cost overruns because of quality and safety issues, mostly from the Chinese shipyard that won the fixed price construction contract, a couple of price crashes since FID and, latterly, the fields (especially Barra) have not performed to expectations so that daily production and, probably, the ultimate recovery are lower than expected. From memory there has been quite a turn over in the senior management at Dana, the operator, and its owner, the Korean Oil Company, is probably not very happy. There are other tie-in targets in the area but the performance of Barra might have changed the risk assessment for future exploration.
Kraken
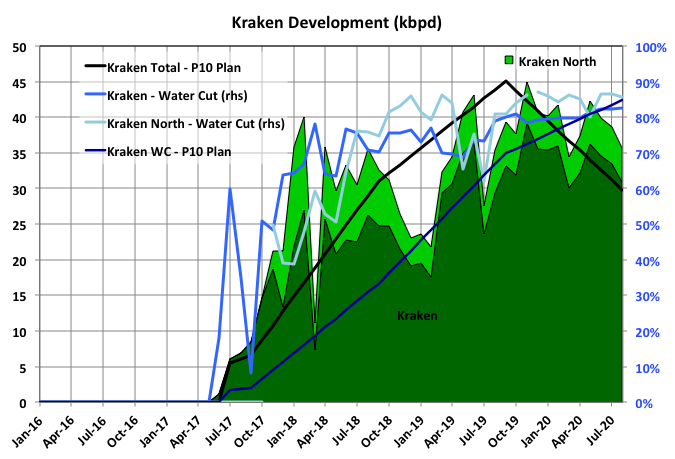
The Kraken development is heavy oil and has the largest produced water processing system in the North Sea. Its performance has been excellent so far, beating the P10 plan, although water breakthrough may have accelerated a bit earlier than planned
Mariner
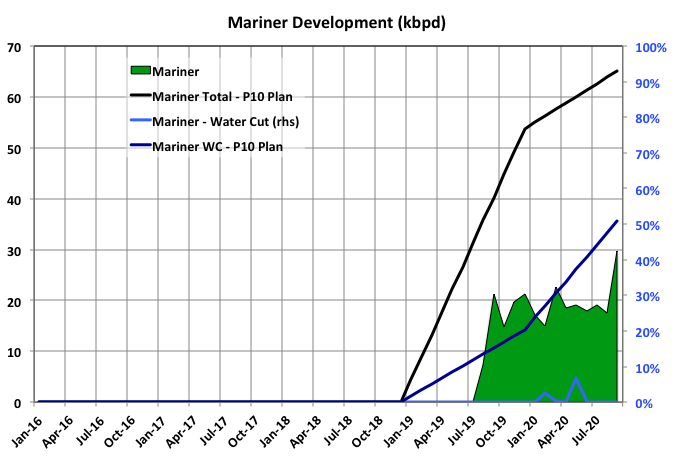
Mariner is operated by Equinor, its only one in the UK sector. It is heavy oil (second lowest API after Kraken) and uses condensate dilution and electric submersible pumps for EOR. It had a slightly delayed start up and hasn’t to date done too well. However it may now be starting to catch up and water breakthrough is low, so the problem may be with the surface facilities rather than the wells or reservoir.
Shetland Gas Plant
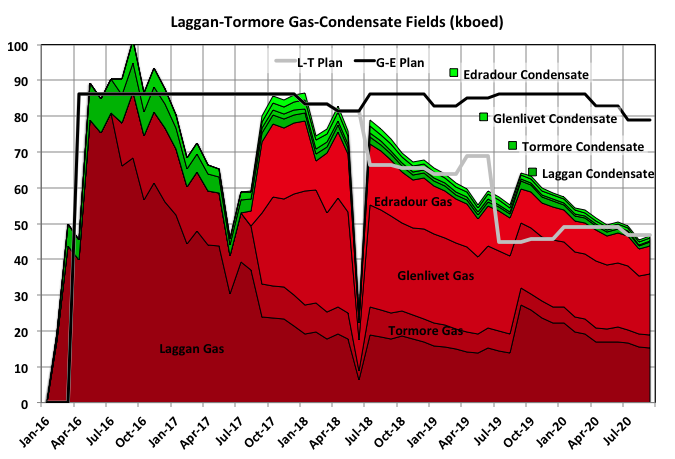
Four gas-condensate fields in the Greater Laggan area (West of Shetland) have been developed by Total with subsea wells and long (-est in the world) multi-phase flow lines feeding the Shetland Gas Plant. Phase I involved the Laggan and Tormore fields and would have to be described as disappointing. An expected plateau of three or four years actually lasted only a few months, hence Phase II, involving Glenlivet and Edradour, had to be brought forward to partially fill the spare capacity in the gas plant. The plant was also planned to allow exploitation of other gas fields in the area, but the first possibility, Glendronach, has been downgraded by 40%, through appraisal drilling, after much hype upon its discovery, and has high mercury levels that would require significant changes at the plant. There were some articles last year that Total might be looking to sell the gas plant, but nothing since. (Apologies to anyone that’s colour blind for these charts but in the industry green and red are pretty standard colours used for oil and gas).
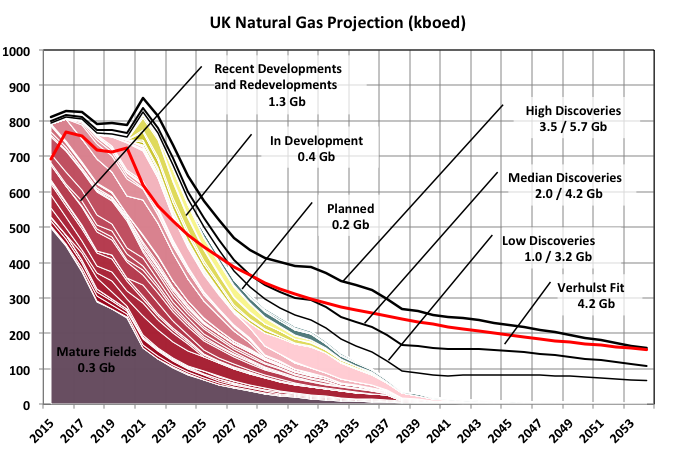
Top Down Projections
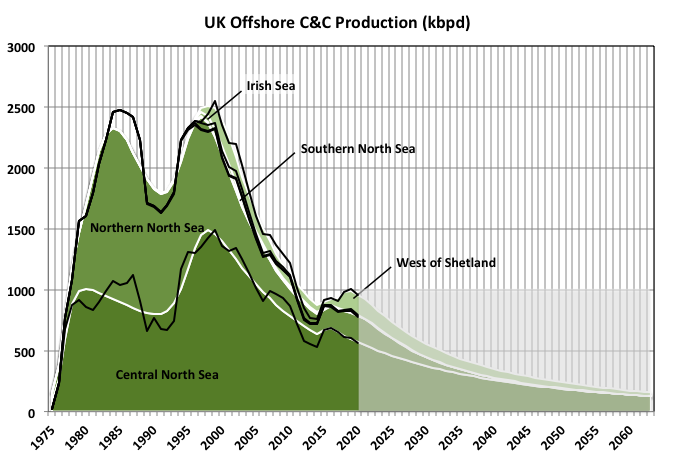
Verhulst curves were fitted to C&C and natural gas production from the five areas of the offshore production: Central North Sea (three curves), Northern North Sea (three curves), Southern North Sea (one curve), Irish Sea (one curve) and West of Shetland (two curves). The Irish Sea and the Southern North Sea are almost exclusively dry gas and the others are mostly oil or gas-condensate.
No constraints were applied to set reserves, which became an output (or an emergent property as they like to say these days) and came out as 35Gb C&C and 24Gboe natural gas.
The oil fitting was reasonable, especially for recent years, although the Piper Alpha trough proved difficult to match.
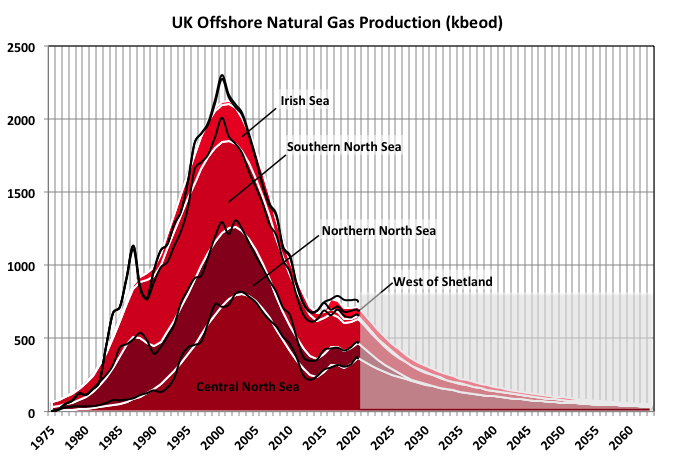
Fitting the gas production proved difficult, I tried weighting recent years higher than earler ones but it didn’t help much. It probably needs a few more years of data and a different split of curves to get much better because gas production may be heading for a new local peak (see below).
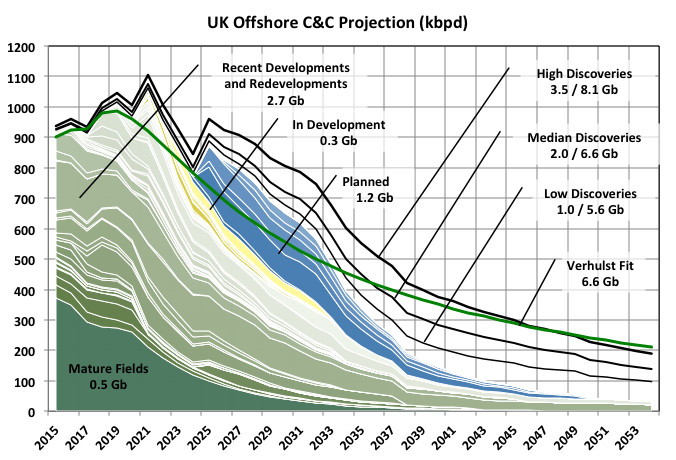
Bottom Up Projections
The production from fields in categories for recently develop, in development and planned projects below are taken from the P10 cases in environmental statements where available. Some others came from company presentations that included expected production profiles and others, especially for some planned developments, are estimates based on any available data, usually estimated reserves and design flow rate. Therefore for fields in development or planned the production rates are likely to be overestimated and the start-up schedule to be early, especially now with additional delays due to the pandemic and low oil price.
Production numbers through 2020 are measured annual averages (pro-rationed from August for this year) and the mature fields are estimated as an exponential decay.
A recent University of Aberdeen study stated that over a quarter (or 4.2Gboe by its estimates) of the potential reserves would be uneconomic with prices below $45. Much of the future production depends on existing and aging infrastructure. Often the new resources will be inadequate to justify the operating and maintenance costs without some residual production from earlier developments so that the longer prices stay low and new developments deferred the more likely it becomes that some resources are left stranded. Just from an EROI consideration it would become impossible to recover the energy of extraction, irrespective of oil price or risk acceptance. Decommissioning commitment costs may also militate against some of the smaller prospects ever reaching FID.
The estimated remaining recoverable reserves are shown after the discovery additions for each case. In 2020 the OGA estimates were 10 to 20Gboe remaining, with a mean of 15.3; this is the same range as estimated in 2016 despite 2.5Gboe of production in the meantime, so maybe the UK has joined OPEC on the quiet.. I think, at best, the number will be at the low end of this range (the median case gives 10.8Gboe) and even to achieve that discovery successes need to increase substantially. Last year 240mmbbls were discovered and the trend has been downward recently; less than 100mmbbls were added to reserves by greenfield FIDs; less than 100mmbbls were added from brownfield FIDs (FIDs allow reserves to be classed as proved, so don’t affect overall P2 estimates); and less than 110mmbbls from other upward reserve revisions, though much of this was negated by downward revisions in other fields. The biggest single prospect for new discoveries seems to be gas or gas-condensate fields in the Central North Sea.
Decommissioning
Over the past decade a cottage industry has sprung up for producing reports concerning North Sea decommissioning. There have been publications from OGA, UKOG, Arup, the Scottish Parliament, the Royal Academy of Engineering, Westwood, the University of Aberdeen, Intergenerational Foundation and probably others, e.g. from financial advisors, plus several peer reviewed journal papers. The UK is at the forefront of offshore decommissioning, maybe a bit behind GoM, but many of the structures so far removed there have been small and in very shallow water.
The UK has many structures (about three times as many as in the Norwegian sector, which has larger fields) some of which are large concrete gravity based structures or steel jackets, and most of which are piled into the seabed. The average age of equipment is almost 30 years. Ownership changes and modifications over the life cycle complicate decommissioning planning and execution.
The time value of money means that decommissioning costs don’t figure highly in original FIDs but can be important considerations for late life assett sales.
The OGA estimated a total cost of £39 billion, but this included 35% efficiency savings. Others have pointed out that on multi-billion projects cost overruns are the norm so around £83 billion is probably more realistic. So far, however, there have been reductions of 19% from original estimates, though, as the biggest gains tend to come within the first years of new technologies, this might be the best that can be achieved and cost creep is now more likely. About half is for plugging and abandonment of wells, the rest for removal and scrapping of structures, and site remediation and monitoring. Annual costs are expected to rise fairly steadily from £1.1 billion in 2020 until peaking in 2028 at above £2.2 billion. However low oil prices will likely lead to deferrals of such work, making it progressively more difficult snd costly as work forces and supply chains shrink. For offshore Western Europe annual costs are expected to peak above $9 billion in 2033.
This cost is borne by the operators but can be claimed against previous taxes paid on the field’s profits., so about half will fall on the British taxpayer (explaining why the industry become a net loss maker in 2016). There are also questions to be asked about whether the E&Ps will be able to afford this as production and income fall.
Nominally there are regulations to ensure that the costs are still covered when the large companies sell their late-life assets to smaller ones but these have not been tested in highly volatile market conditions. Asset sales can be clean breaks, where buyers need to supply a parent company guarantee (difficult for small companies with limited operations) or a decommissioning security arrangement, or the sellers may retaining some or all decommissioning liabilities, which can make sales more attractive, to reduce future financial, environmental and reputational risks, and be advantageous for tax benefits depending on individual sale characteristics e.g.age, expected future production, low side risks).
Tax regulations have been written to maximise economic recovery, part of which is to promote late life sales and investment, while safeguarding taxpayers exposure to losses. Needless to say this is contrary to the governments carbon budget aspirations.
Off Topic Finish: E&P Company Proved Reserves
The following data comes from 10-k or 20-f end of year statements of major or large independent operator companies. By the SEC rules since 2007 only proved developed and undeveloped reserves get reported. Some companies from Canada and UK also report probable reserves but these are too few to mean much, and many that do concentrate on oil sands.
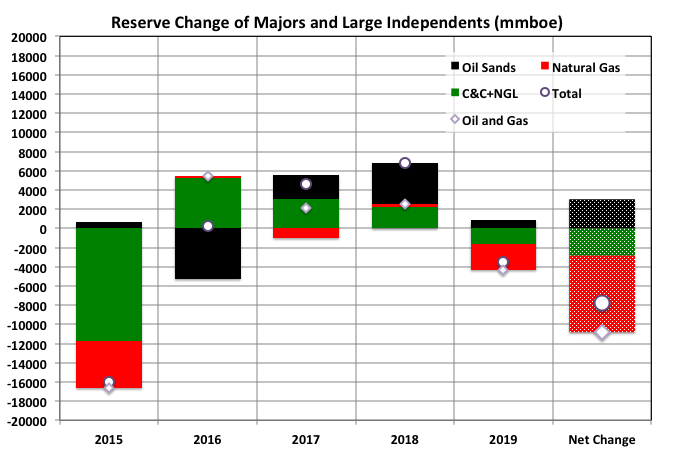
Overall the amount expected to be extracted (termed P2) is proved (termed 1P) plus probable (2P). In fact that is the definition of proved plus probable – i.e. the amount with a better than 50% chance of production. Without probable reserve numbers it’s difficult to get a full understanding of a company’s real standing.
A new field typically has probable reserves of 50 to 60% of proved, but there can be a huge spread depending on field uncertainties. As the field ages the ratio tends to decrease to zero at end of life, even if there is overall reserved growth. For companies as whole something similar occurs unless there are continuing decent discoveries, which there has been few of recently except in LTO, or beneficial sales and acquisition activity.
The group of largest companies, whether by accident or design, used to keep R/P numbers around ten years; now I don’t know. Sales, discovery, extension and production figures are usually available for the companies and would give a clearer picture but take an effort to extract; maybe next year depending on lockdown, weather, health etc. issue before then.
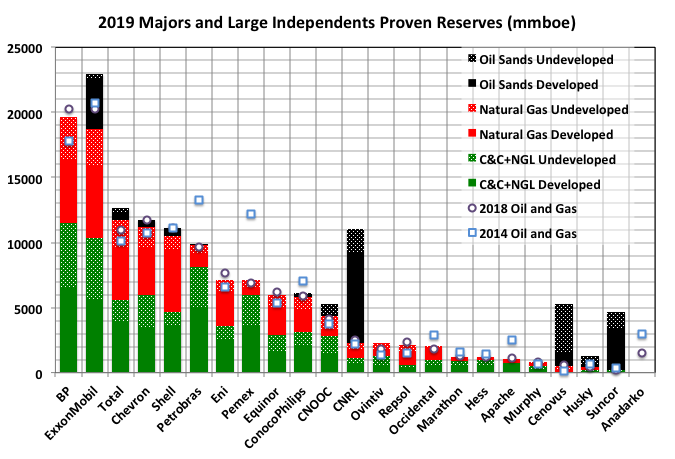
These are supposed to be the US reporting companies with largest reserves in order of oil and gas assets (excluding oil sands) but I can’t guarantee I haven’t missed some.
The proportion of undeveloped reserve in the oil and gas totals lies between 35 and 45% for most companies. On average this has been fairly constant over the years considered but an individual company can show more volatility, especially the smaller ones.
It’s noticeable that the two (ex-) national oil companies have lost so much both as a proportion and absolutely since 2014. Petrobras had huge debts and has been selling assets; Pemex has huge debts too but hasn’t sold much but has opened Mexican leases to outside companies – its main problem is a lack of discoveries.
The magnitude of changes since 2014 and 2018 appear independent of the company’s total holdings, which means the smaller companies experience large volatility.
Anadarko disappeared in 2019, Husky and Noble (not considered above) have gone this year and it looks like a few more might be heading that way.
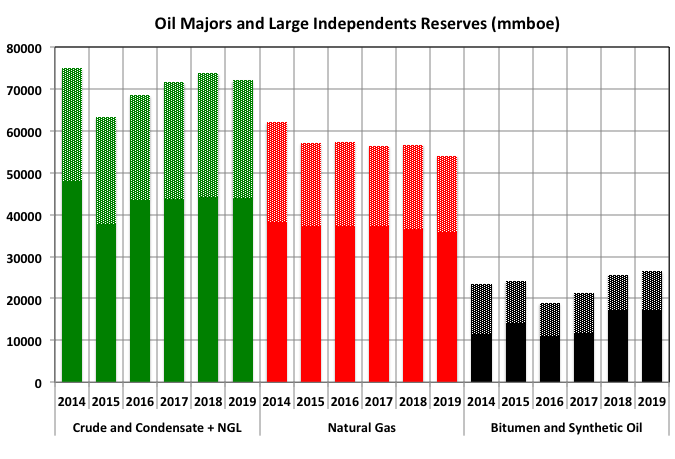
Oil reserves have dropped 6% since 2014, natural gas by 13% and bitumen has gained 13%. I’d expect the probable reserves have dropped by much more for oil and gas, and might be small anyway for oil sands. The ratio of undeveloped reserves has fallen steadily for natural gas but there’s not much of a trend for oil.
Last year’s figures are going to especially interesting given the price crash and large impairments that all companies have reported, combined with a lack of discoveries and a dearth of FIDs (which allow probable reserves to be booked as proved). I expect the drops to be significantly larger than from 2014 to 2015, and that there will be no growth in oil sands but a major downward adjustment. Logic would suggest undeveloped reserves would drop more than developed but that didn’t appear to be the case in 2015.
61 responses to “UK North Sea Summary Part II: Reserves, Recent Production and Future Projections”
Thanks George. Great stuff.
Agreed!
Thanks so much George.
Wishing everyone here much tolerance and perseverance.
Thanks for the education George.
I see that the international active drilling rig count dropped precipitously over the past year.
From Jan 2020 to Jan 2021 the count fell from 1,078 to 677.
https://rigcount.bakerhughes.com/rig-count-overview
The 2nd to last chart labeled “Oil Majors and Large Independent Reserves” is interesting. I interpret that to mean that operators are doing a good job of replacing the oil reserves they’ve produced. Focusing on oil, the drop between 2014 and 2015 is understandable due to the price collapse in late 2014, but since then, reserves have rebounded nicely, and then been holding pretty steady. While there have been projects getting sanctioned in that time period, resulting in some of the reserve adds (the stippled portion of the bars), I suspect a sizable amount of adds are due to reserve revisions. As operators are producing their fields, as a whole, they observe well performance suggesting they will exceed their initial P1 reserves (P1 = very likely to produce reserves,, like 90% likely), and they move reserves from the P2 reserve bucket to P1 reserves. If the operator has done a good job of characterizing the reservoir, at the end of field life, their EUR should be close to their initial 2P reserves (most likely reserves. 2P = P1 + P2). (There are a lot of caveats and assumptions in that statement – mainly, this assumes the operator has executed the field development plan as originally intended. If they revise their plan during the productive life of the field, which often happens, that will almost certainly trigger a update to the remaining P1 reserves for the field.)
Apologies to George, but the a fair bit of my comments above are stated by George in the post. Fortunately, I think we are in agreement.
Thanks SouthLaGeo, your perspective is always appreciated.
Thanks Dennis, although anything I say about reserves should be taken with a grain of salt. I know just enough about reserves to be dangerous.
Regarding my comments – I guess I suffer from a common problem where I go to the pictures/graphs first and draw my conclusions. I admit to not always reading all the text.
George, I’m interested in your ultimate oil recovery estimates for the UK North Sea. What is cum oil to date? Not sure if that is mentioned anywhere. If so, I missed it. I’m guessing around 22 Gb from your first graph, but not sure.
In your top down view, you quote an ultimate EUR of about 35 Gb. In your bottoms up estimate you suggest 10-15 Gb additional, leaning toward the low end. Is that about right?
SLG – The Verhulst fit does give 35 Gb C&C. Including estimated production for Nov/Dec I get 27 Gb cumulative oil through 2020 for the bottom up fits. The 10-15 Gboe refers to total equivalent hydrocarbons.
I think I may have messed up, at least with the labeling, by mixing in or leaving out the NGL and with what date I have taken the remaining reserves from (2015, 2018 or 2020) – I’ll have to do a bit more digging but it might not be for a few weeks. By OGA figures oil and NGL production to end of 2020 has been 29 Gb, dry gas has been 17 Gboe.
For others interested I didn’t do a very good job labeling the charts in the last section on company reserves. The hatched part of the columns show proved undeveloped reserves (PUD), the solid parts show proved developed reserves (PD). PUDs are generally found in undrilled sections of a field adjacent to developed parts or with assured contiguous geology (e.g. in conventional reserves a separate, undrilled fault block and in tight fields everything not currently being drained by a frac’d zone, which probably gives a lot of leeway for EUR interpretation).
Thanks.
So 29 cum oil to date, assuming the OGA estimate is pretty good, and one ultimate estimate of around 35 Gb, so that would suggest 6 Gb yet to be produced.
Interesting that the 35 EUR isn’t too far from some of the Northern GOM estimates we’ve come up with – those have been in the 35-40 Gb range.
The overall production profile for the UK North Sea (if I use graph one as a proxy for that) shows a production peak in 1977 or so, and another minor peak in the early 90s, and perhaps a minor peak in 2018.
The production profile for the Northern GOM is below.
A comparison of the 2 is interesting. The UK North Sea shows, what I would consider to be, a more conventional shape with an early peak, while the GOM profile shows a late peak. In the UK North Sea I suspect the biggest fields were discovered fairly early. In the Norther GOM the story is more complicated. The earliest peak was due to shelf oil, and the later peaks all record the march of industry out into deeper and deeper water, and also going from above salt plays to subsalt plays.
Thanks for this, a lot of work, so many graphs!
It is clear that the peaking in UK (and the North Sea ) made oil prices leave the $ 20-25 in 2002
In the meantime, peak oil eats its way through the system:
5/2/2021
Peak oil in Africa (part2): Export zero sum game
https://crudeoilpeak.info/peak-oil-in-africa-part-2-export-zero-sum-game
Another excellent report Matt.
On that Egypt graph you can see the time relationship to loss of oil for export and the 2011 Egyptian civil tumult (Arab Spring). Egypt is the number one wheat importer in the world, and the government cut back heavily on the wheat/bread subsidies when they lost the oil export earnings that funded the subsidy. Food speaks loudly.
Also, it looks like peak export year for African produced oil was 2007, at about 7 Mbpd.
Now net export is about 4 Mbpd, and on a declining trend as domestic continental consumption rapidly increases.
Rough extrapolation of the trends gives a crossover year of before 2035- at which point Africa will no longer have oil for net export.
Interesting article this morning on where Hedge Funds are investing. While oil stocks are being avoided by many advisors and investors, the hedge funds see a different future. The last three lines tell the story. A funding squeeze will start to play out.
“U.S. shale production will not quickly rebound, given the capital required and debt producers are carrying, lending oil prices support, said Rafi Tahmazian, senior portfolio manager at Calgary-based Canoe Financial LP.
North America’s oilfield services sector, which producers rely on to drill new wells, has been decimated, he said.
“They’re decapitated from being able to grow,” Tahmazian said. “The supply side is broken.”
https://www.investing.com/news/commodities-news/hedge-funds-bet-on-oils-big-comeback-after-pandemic-hobbles-producers-2411533
Ovi,
If the article’s price prediction is correct ($70 to $80/b for Brent by the end of 2021), tight oil producers will be able to increase their completion rate by financing out of cash flow. Scenario below assumes oil price rise to $75/b by the end of 2021 and then continue to rise more slowly to $80/b by 2026 (all prices are Brent real oil prices in 2020 US$) and then remain at this level until mid 2040 and then decline at $1.20/b each year up to 2080.
Completion rate averaged 452 per month in 2018 and 2019, I have assumed the completion rate gradually ramps to 485 completions per month by mid year 2023 and then remains at this level through the end of 2037 and decreases thereafter falling to zero in 2051. ERR is 63 Gb and cumulative net revenue for the entire Permian play is 1.26 trillion 2020 US$ over the Jan 2010 to Dec 2079 period. Cumulative debt is fully paid with interest by Jan 2024 for this scenario under the oil prices assumed.
Dennis
Looking at your chart I see an increase of roughly 1,100 kb/d from 2022 to 2025 or an average increase of 360 kb/d each year. After 2025, the US essentially becomes part of the world supply base, assuming the Permian is the main source of production increase.
If after 2022 world demand goes back to 800 kb/d to 1,000 kb/d, the US will not be in a position to crash world oil prices as they did in 2018 and 19 because their output growth rate wIll be too low. OPEC + will be back in control and they will fight amongst themselves for discipline.
So what I am saying is that going forward, US yearly oil growth rate will be the critical factor in determining the US ability to influence oil prices On the other side, US demand growth will also have some impact.
Ovi,
I agree, I tought the implication was that tight oil cannot grow much. I believe it can, note that this scenario is quite conservative this level of output is the minimum I would expect for the given oil price scenario. We might return to the higher growth rates of 2019 or perhaps 2018, but only up to 2030 or so.
After that I expect transition to ev transport may take a bite out of historical demand growth.
Short summary of Saudi Arabia
The economy is in bad shape:
”Saudi Arabia projected its 2020 budget deficit will soar to around $79 billion,…
Riyadh has posted a budget deficit every year since the last oil price rout in 2014, prompting the petro-state to borrow heavily and draw from its reserves to plug the shortfall.”
https://www.france24.com/en/live-news/20201215-saudi-says-2020-budget-deficit-will-surge-to-79-bn-amid-pandemic
Oil rig count is falling fast:
https://pbs.twimg.com/media/EsmaAwkXEAg91D7?format=jpg&name=large
Saudi crude stocks fell to 143 mb in November 2020 (17-year low) from over 300 mb in 2015:
https://www.hellenicshippingnews.com/rising-saudi-crude-exports-leaves-domestic-stocks-at-17-year-low/
The few drilling rigs is (probably) located in Ghawar:
”Further work programs on fields such as Khursaniyah, and legacy assets like Khurais and Abqaiq that need workovers and rehabilitation, are being delayed, the source said, whereas at Aramco’s low-cost giant fields such as Ghawar — the world’s largest — production is increasing.
“There isn’t a place in Ghawar that doesn’t have a drill, it is very dense. They’re beating the hell out of it.””
…and contractors are not being paid in time:
”Aramco’s tighter spending has resulted in several international contractor companies working on pipeline and offshore projects not getting paid for several months, three sources told S&P Global Platts. The payments are set to be delayed further, with Aramco not intending to make any payments to these companies until 2021, a source added.”
https://www.hellenicshippingnews.com/feature-saudi-aramco-faces-tough-2021-as-rivals-race-for-oil-capacity/
Oil production was cut by 1 mb/d this month and is currently just over 8 mb/d, not far from Euan Mearns forecast in 2007:
http://theoildrum.com/node/9321#comment-904645
Population has grown from 20 million in 2000 to 35 million in 2021:
https://www.worldometers.info/world-population/saudi-arabia-population/
Groundwater is falling fast:
“Groundwater resources of Saudi Arabia are being depleted at a very fast rate,” declared the UN Food and Agriculture Organisation as far back as 2008. “Most water withdrawn comes from fossil deep aquifers, and some predictions suggest that these resources may not last more than about 25 years.” Saudi Arabia leads the world in the volume of desalinated water it produces, and now operates 31 desalination plants. Desalinated water, as distinct from naturally occurring fresh water, makes up 50% of water consumed in Saudi Arabia. The remaining 50% is pulled from groundwater.”
https://www.theguardian.com/cities/2019/aug/06/oil-built-saudi-arabia-will-a-lack-of-water-destroy-it
So, what is done to solve the problem?
”According to Bin Salman, who is also the chairman of the Neom company board of directors, construction of The Line will start in the first quarter of 2021.
The 100-mile-long (170 kilometres) mega-city will consist of connected communities – which it calls “city modules” – and link the Red Sea coast with the north-west of Saudi Arabia.
In a statement, The Line’s developers said its communities will be “cognitive” and powered by AI, which will “continuously be learning predictive ways to make life easier”.”
https://www.dezeen.com/2021/01/13/line-saudi-arabia-170-kilometres-long-city-neom/
What could possibly go wrong?
Pollux , thanks for the info and update . What could possibly go wrong ? Answer 1 ;: More days for some princes to spend at the Ritz Carlton . Answer 2 ; Heads roll for MBS and company . :-0
The situation is not better in Kuwait:
Economy is in bad shape:
“Source says government has transferred the last of its performing assets to wealth fund in exchange for cash.
Years of lower oil prices have forced the Kuwaiti government to burn through its cash reserves while a festering political standoff has prevented it from borrowing.
“It’s a very immediate crisis now, not a long-term one like it was before,” said Nawaf Alabduljader, a business management professor at Kuwait University.”
https://www.arabianbusiness.com/politics-economics/458217-kuwait-facing-immediate-crisis-as-it-seeks-cash-to-plug-deficit
And oil projects are getting canceled:
”KOC’s Board of Directors has decided to cancel the heavy crude project that involves 11 oil wells although it has been awarded recently,” the report said without naming the company that had won that contract.
It said KOC and other local oil firms intend to freeze more projects in line with instructions by the Kuwait Petroleum Corporation to slash capital expenditure…”
https://www.hellenicshippingnews.com/projects-kuwait-scraps-400mln-oil-project-report/
Pollux , do you have any info on Ghawar ? As they say ” As goes Ghawar ,so goes the world ” .
True, or as Matthew Simmons wrote in “Twilight in the Desert”:
”Ghawar is the king of Saudi oilfields. There is no ”crown prince” waiting to assume the throne. It is the same in an oil basin as it is in chess: Once the king has fallen, the game is over.”
Sorry, no new info on Ghawar but the situation was pretty bad in north Ghawar over twelve years ago so it is probably not better now:
“If the area with remaining oil were an island, it would be time to look for a boat.”
http://satelliteoerthedesert.blogspot.com/2008/06/north-ghawar-updated.html
Just a query for some old TOD carry overs . There use to be “Memmel” who use to post a lot on KSA and stuff . Any info on him . Tks Pollux for your response . We are in agreement .
I loved that post on TOD on Ghawar by Joules.
Has anyone ever done an update on it – that would be fascinating. When I look at google earth I see lots of dots but I can’t tell injection wells from extraction wells so I have frankly no clue what I am looking at…
HH
The latest data that was published on Ghawar came from the Aramco IPO. They included a table which listed their primary oil fields along with their production. The following statement was included:
The Ghawar field has accounted for more than half of the total cumulative crude oil production in the Kingdom but still maintained MSC of 3.800 million barrels of crude oil per day as at 31 December 2018G.
In a presentation given by Nawaf Obaid in Nov 2006, the following statement was made: Without “maintain potential” drilling to make up for production, Saudi oil fields would have a natural decline rate of a hypothetical 8%. As Saudi Aramco has an extensive drilling program with a budget running in the billions of dollars, this decline is mitigated to a number close to 2%.
This raises the question of whether with today’s reduced income, can Aramco maintain its extensive drilling program to reduce the natural decline rate to 2%.
Hello Ovi,
I kept a file on KSA and the output for Ghawar …
June 2014
and continues to produce 5 million barrels per day (bpd) = 1.824 billion per year.
That was six years ago so a back of a fag packet calculation gets 1.2m bpd drop.
So p.a is now 1.387 billion , 76% of 2014 production .
over the years KSA estimates have varied a lot (!) but
“june 2014 …. the Ghawar field has estimated remaining proved oil reserves of 75 billion barrels, ..”
2021 its now 48.254
at 1.387 billion pa we have 34.7 years before zero *
* it won’t be linear I know and yes claimed total of all feilds is 12m bpd ( boe Nat gas included by the looks of it)
I have an uneasy feeling about this ….
what does eveyone else think ? am I out on the calc? its a rough estimate.
Forbin
( student of oil depletion)
Forbin
Knowing what is going on with Ghawar is very difficult. The 5 Mb/d number was repeated until 2018 when the Aramco IPO came out and it said 3,8 M/d. That was quite a change. The last data that I saw came from a Saleri paper given in Washington to calm the fears raised by Matt Simmons book.
In that presentation, the attached graph was shown. It shows production from 1993 to 2003 to be about 5.0 Mb/d. I used the info given by Obaid, a few posts up, that SA oil fields were declining at 2% per year to see what it would say when applied to Ghawar. Not sure if it is a fluke, but by taking the 2003 production of 5.2 Mb/d and letting it decline by 2% per annum yields 3.84 Mb/d. Dumb luck. Anybody’s guess.
Second chart
Thank you for the analysis. That’s very important to know for European oil supply. Do you consider to do the same with Norvegian production?
I did something on Norway in spring last year but I don’t think I included any projections.
No demand is not coming back . The price is too high for the consumer .
https://www.reuters.com/article/india-fuel-sales/update-1-indias-january-fuel-demand-falls-as-oil-prices-tick-up-idUSL1N2KF1N1
Price of Petrol
Mumbai (India ) Euro 1.15 per litre Income per capita Euro 6996
Brussels (Belgium) Euro 1.25 per litre Income per capita Euro 54904
I was wondering how they payed this when I was in Kathmandu, Nepal, 10 years ago. The price of petrol was round about 1 Euro / litre this time, and the town is much poorer than Mumbai. And still, 95% of transport was done by motorized vehicles (I won’t call most of them cars or trucks). In the center was a permanent traffic jam during the day hours.
hey HinH.
You have asserted here that the price of oil (roughly $60/barrel) has dampened oil demand-
“too high for the consumer”
Consider another possibility.
The decrease in demand this year compared to last is due not to high oil price, but due to loss of wage earning during this Covid pandemic. An unemployed person, no matter what country they are from, will try hard to not purchase petrol.
I do not think the current price of oil has dampened global demand.
Hicks , my comment was India specific .
Eulen , the price in Kathmandu is Euro 0.75 per litre . Understand that all petrol , diesel etc are imported from India by Nepal . So why the difference ? 73 % of the pump price in India is tax . The govt is BANKRUPT , it is collecting revenue any which way it can . You want to buy Air India it is up for sale . They are ready to sell it for $ 1 provided you can takeover the liabilities . With such a high ECOE (Economic Cost Of Energy ) it is bound to remain in a recession to infinity .
On the Pipelineistan front:
Taliban vows to guarantee safety of trans-Afghanistan gas pipeline
“ With the Taliban onboard, Ashgabat may now hope international investors can be persuaded to get involved”
https://responsiblestatecraft.org/2021/02/10/taliban-vows-to-guarantee-safety-of-trans-afghanistan-gas-pipeline/
The first shoe has dropped.
Shell says its oil production has peaked and will fall every year
Royal Dutch Shell (RDSA) said its oil production and carbon emissions have peaked as it detailed plans to gradually wean itself off fossil fuels. Climate activists said it hadn’t gone far enough.
The Anglo-Dutch company said in a statement on Thursday that it expects its oil production to decline by between 1% and 2% each year after peaking in 2019. Its total carbon emissions likely peaked in 2018, it added.
Thanks Ron! From our source:
BP said in August that its oil and gas production would fall by 40% on 2019 levels by 2030 as it ramps up low carbon investments.
I guess this means that oil production from BP has peaked as well and will fall every year (even more than between 1% and 2%).
A lot of this stuff is lip service. Probably hoping for a government subsidies at some point. Maybe they’ll produce liquid and call it something other than oil. Maybe they can call it gallons of climate Improvement fluid. It’ll get its acronym. CIF. Get the government to pay for it. That will be pretty cool.
Watcher,
You are fantastic. I don’t know what we’d do without you!
Wait a minute, what about Titan and its hydrocarbon lakes?…
“According to Cassini data from 2008, Titan has hundreds of times more liquid hydrocarbons than all the known oil and natural gas reserves on Earth. These hydrocarbons rain from the sky and collect in vast deposits that form lakes and dunes. ‘Titan is just covered in carbon-bearing material—it’s a giant factory of organic chemicals’, said Ralph Lorenz, who leads the study of Titan based on radar data from Cassini… Several hundred lakes and seas have been observed, with several dozen estimated to contain more hydrocarbon liquid than Earth’s oil and gas reserves. The dark dunes that run along the equator contain a volume of organics several hundred times larger than Earth’s coal reserves” ~ Wikipedia
Musk could send SpaceX there and bring back entire rocket-loads. Our descendants could be swimming around in this stuff and looking back to the past and thanking us.
Caelan , please keep exposing stupidity ,nonsense and wishful thinking .
Or sarcastic humour. You forgot that possibility.
…All those hydrocarbon lakes… It’s liquid gold! Come on, let’s go swimming… Ohh, life could be a dream, sweetheart…
(Were you Petro before?)
No, Caelan , I am not Petro ,though I remember him posting in fractured English . I am HiH since TOD days . Yes add sarcastic humor . As Clint Eastwood says in Dirty Harry ” Make my day ” . 🙂
Thar she blows
Global stock draws accelerates. From IEA OMR:
https://www.iea.org/reports/oil-market-report-february-2021
Global implied stock draws accelerated from 1.56 mb/d in 3Q20 to 2.24 mb/d in 4Q20
January data show continued declines
In February, global output is set to fall as Saudi Arabia implements a sizeable voluntary cut.
Brrrr… NG Normalizing? “At One Oak Gas Transmission, Southern Star and Enable Gas, spot prices reached record highs around $85, $45 and $30/MMBtu, respectively.” Grid interactive Solar inverters can never make power without fossil fueled Megaton spinning reserves or the lucky few that can afford Batteries.
https://www.zerohedge.com/commodities/panic-across-plains-states-nat-gas-prices-explodes-80
Never contributed on here, but a regular reader (don’t feel that I can add much to the discussion as I am not active in Oil & Gas, but enjoy the discussion of reserves, production forecasts (great work Dennis & George) and stories from the oilmen on the ground).
Coming out of the woodwork as the bitter cold & stratospheric gas prices caught my attention & wondered whether these are real prices or rather eyecatchers for a small proportion of gas sold.
Hope that they are real for the oil & gas men out there as it would probably transform their fortunes & put an end to a fairly long struggle (would be hard to justify any redundancies if this bonanza is real).
Does anyone know how the gas marketing side works? Do the independents sell physically forward or do you typically get paid the spot rate for the day?
The capital shale burnt continues to amaze.
Here is a Bakken example.
Equinor invested $4.7 billion in 2011 US dollars, spent several more billion in CAPEX from 2011-2020 and exits the Bakken with $900 million in 2021 US dollars.
Pretty clear Equnior’s shale wells in the Bakken did not pay out.
SS,
It seems to me that the shale debacle is pretty simple: lots of people expected oil prices to rise and stay high, and when they didn’t they kept expecting prices to rise soon. It was a classic commodities market boom and bust, which can only end when everyone gives up, says prices are going to stay low forever and we have to give up and get out…and then production can fall and prices can rise again (and set the stage for another boom and bust, rinse and repeat).
In summary, they bet on high prices and lost. Does that seem right?
There was a lot more to it than than the expectation of high prices, but high prices were a big part of what got the shale boom going.
FYI
Oil prices hit critical threshold for OPEC+: John Kemp
https://www.reuters.com/article/uk-global-oil-kemp-column/oil-prices-hit-critical-threshold-for-opec-john-kemp-idUSKBN2AC22F
It all depends on the Permian and whether the big players are going to ramp up production.
XOM, CVX, COP, PXD, EOG, OXY, APA and DVN. They seem to control a lot of the remaining locations.
I haven’t kept up on the Permian like I should have, so those with more knowledge, correct me if I am wrong.
Also, for the first time, TRRC has two commissioners who are taking a tougher stance on flaring. I am reading emergency only, not due to pipeline constraints. If that holds, will be huge.
Saudi Arabia GDP Annual Growth Rate
The Saudi Arabian economy shrank by 3.8 percent year-on-year in the fourth quarter of 2020, after a 4.6 percent contraction in the previous quarter.
And all of a sudden I’ve noticed Saudi Arabia being advertised as a tourist destination.
Tourists who want t o know what the 10th Century was like?
We’ll they’re getting desperate, they still have oil but next to no home grown food. And as extensively discussed here, it’s possible that their oil production has peaked.
I agree HT . Longtime since I have seen a beheading or a public caning . So exciting . 🙂
The decline of oil has already begun
According to this Greenpeace article from last year, World oil production may have peaked in November 2018.
Frugal
Ron has been saying for the last two years that November 2018 is the peak in world C +C production. If you check the last chart in the last post I put up, you van see the long we the word has to go to get back there. The interesting thing is that the US peaked exact one year later. Over that one year, the US added close 1 Mb/d and yet world production dropped by slightly less than 1 Mb/d.
The day of reckoning may be closer than most green media talking heads espouse.
http://peakoilbarrel.com/us-november-production-rebounds-after-hurricane/#more-30066
Oil futures are back to backwardation. Which means that oil prices for futures contracts are lower than front-month contracts. This is what is expected in a “normal” market.
Between february and november 2020, prices were in contango, meaning that future contracts were higher than front-month contracts.
What does it means? Oil producers hedge future production… And represent the supply of futures contracts. Future prices were higher because they was a lack of hedging, and the supply/demand balance led to higher prices than front-month contracts. Remember this is not current production/consumption, but future speculation over production/consumption.
In backwardation, hedging increases… Front-month oil prices were high enough to insure future production at a lower price and protect against future volatility. Interestingly, the threshold was around $45 in late november. That means LTO is probably going to ramp up in a few months.
Tita . my two bit . Shale will not ramp up . Why ? First the OPM ( other people money ) is not interested anymore in O&G sector because they expect the Biden administration to bring in extra regulation that will make it impossible to function . Second the financial sector now has other stupid but better alternatives to make money via Robinhood , crypto and playing other games . Finance has burnt it^s fingers earlier in the shale play since the last 10 years , they would be dumb to repeat this . But ^ There is a sucker born every minute .^
Better => The Biden administration will limit subsidies to O&G, which have been surreptitiously used since the crash of 2008.
New posts up
OPEC update at link below
http://peakoilbarrel.com/opec-update-february-2020/
Open Thread Non-Petroleum at link below
http://peakoilbarrel.com/open-thread-non-petroleum-february-14-2021/