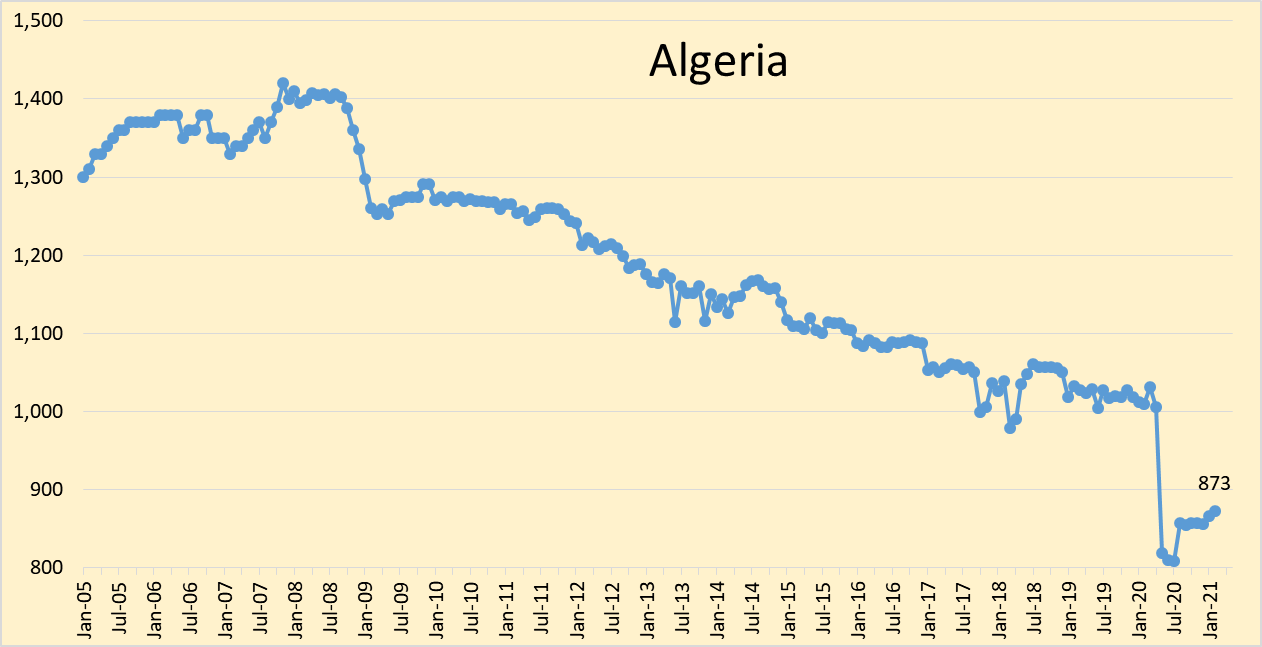
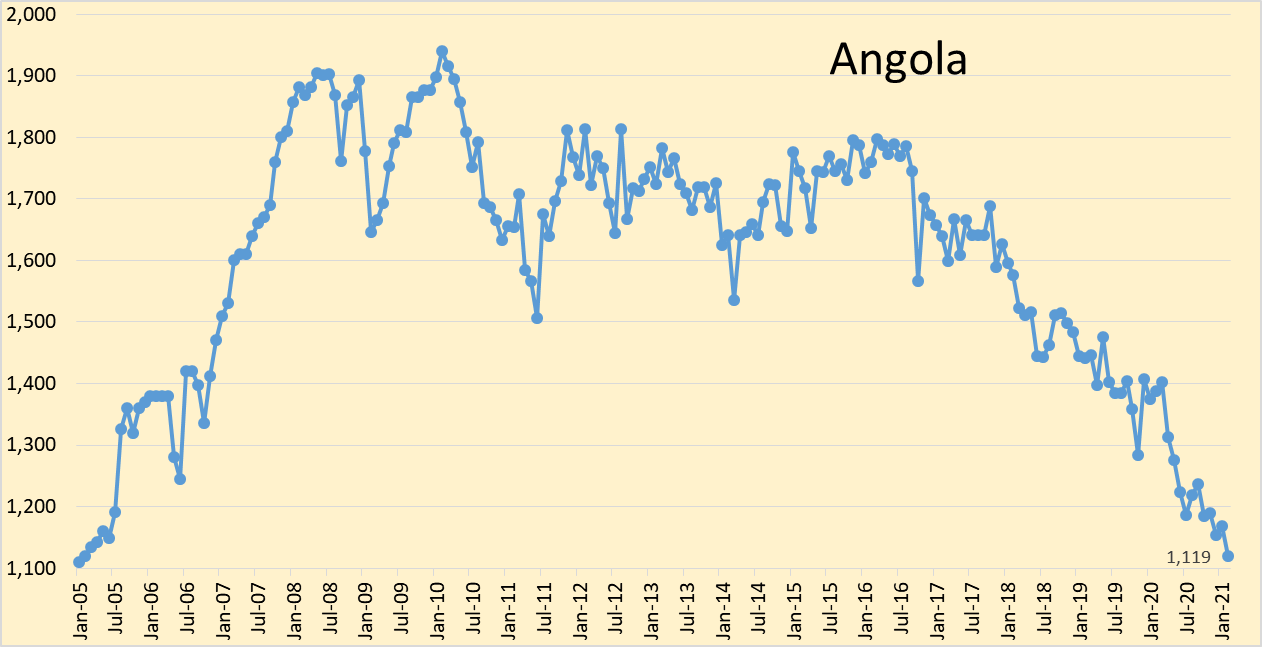
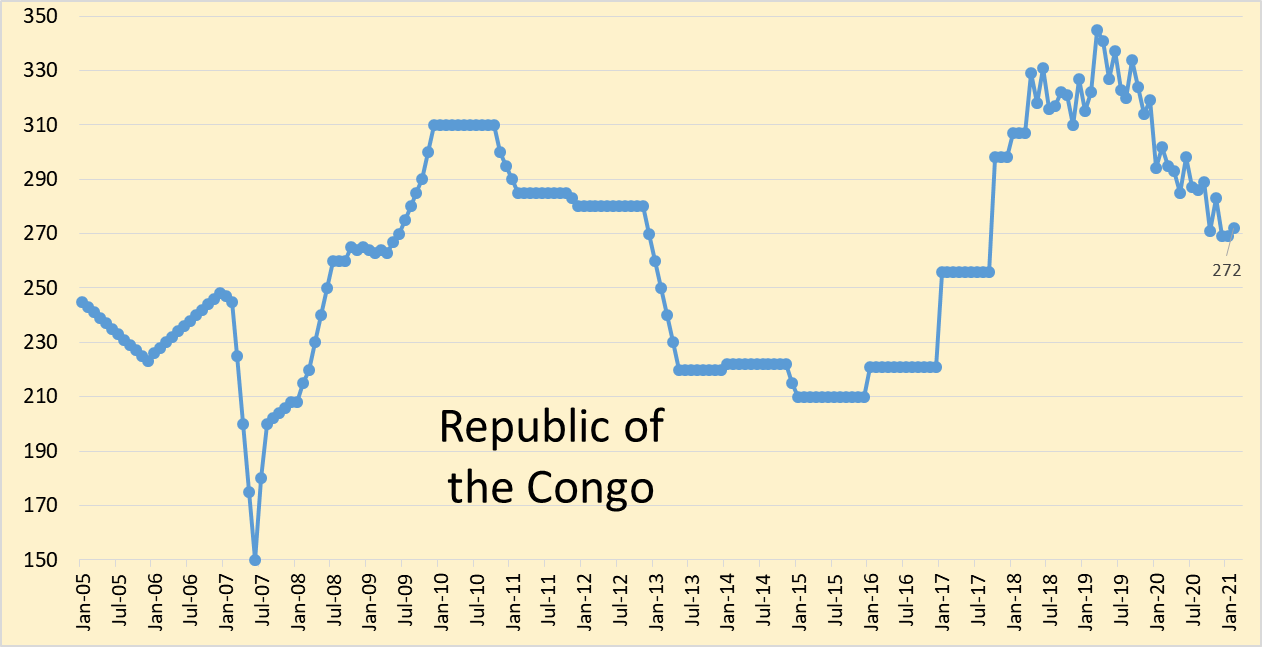
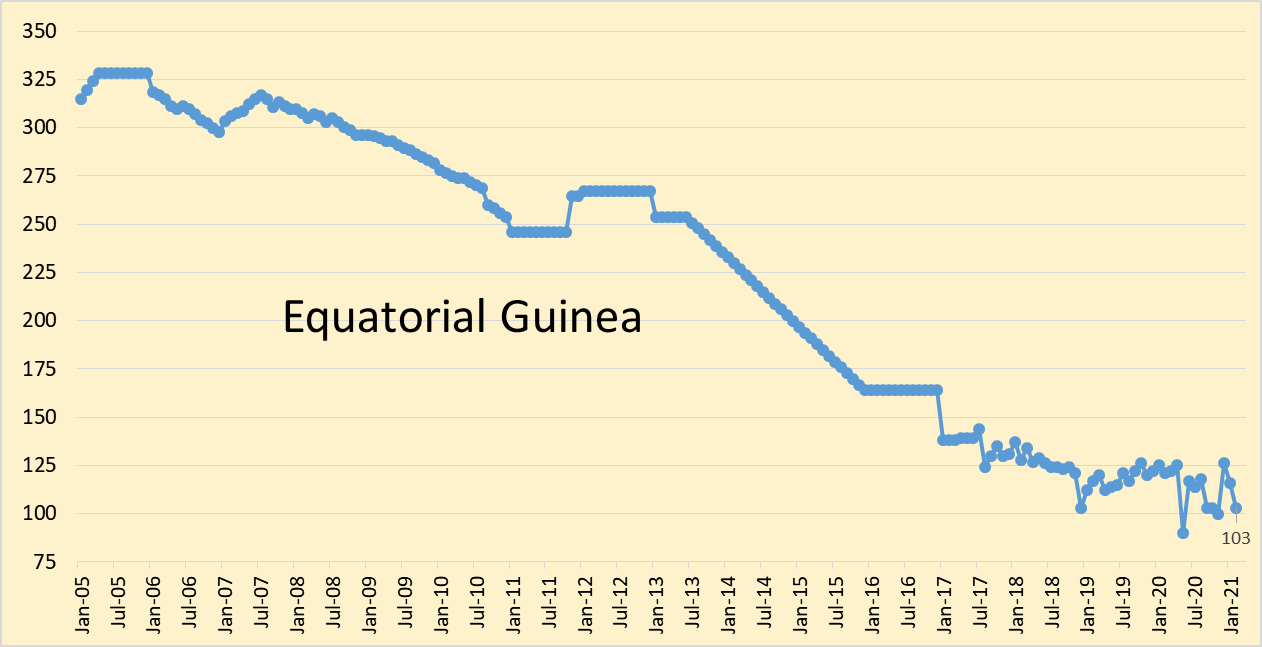
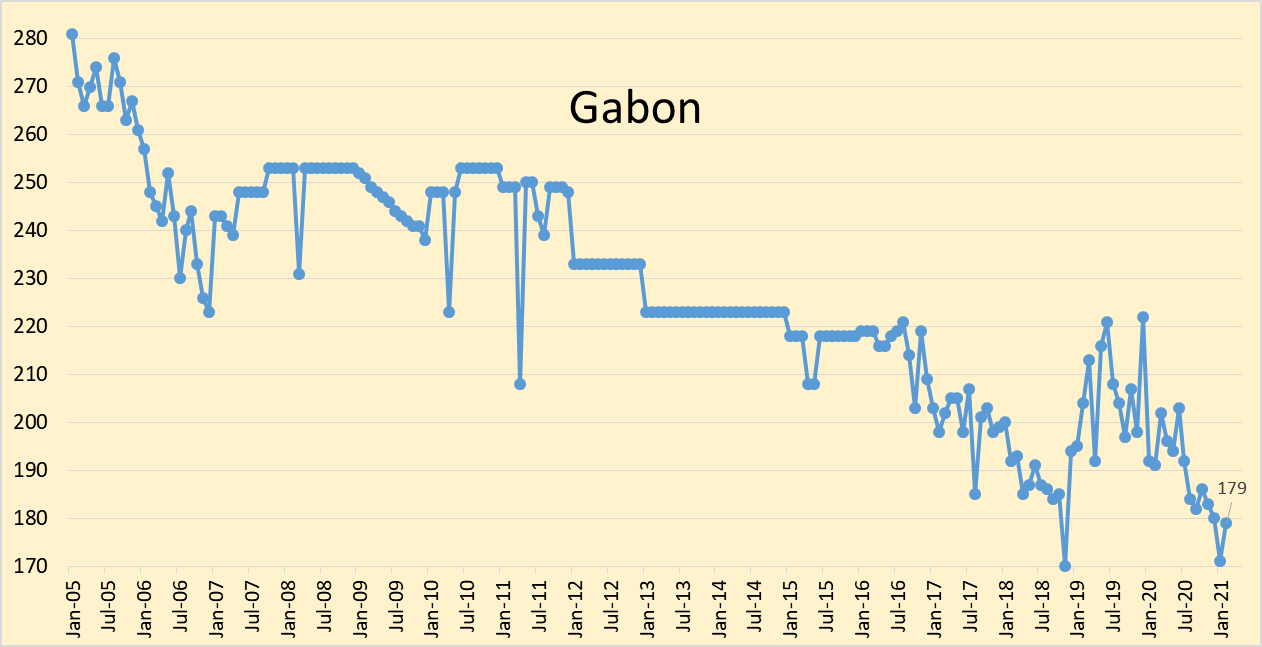
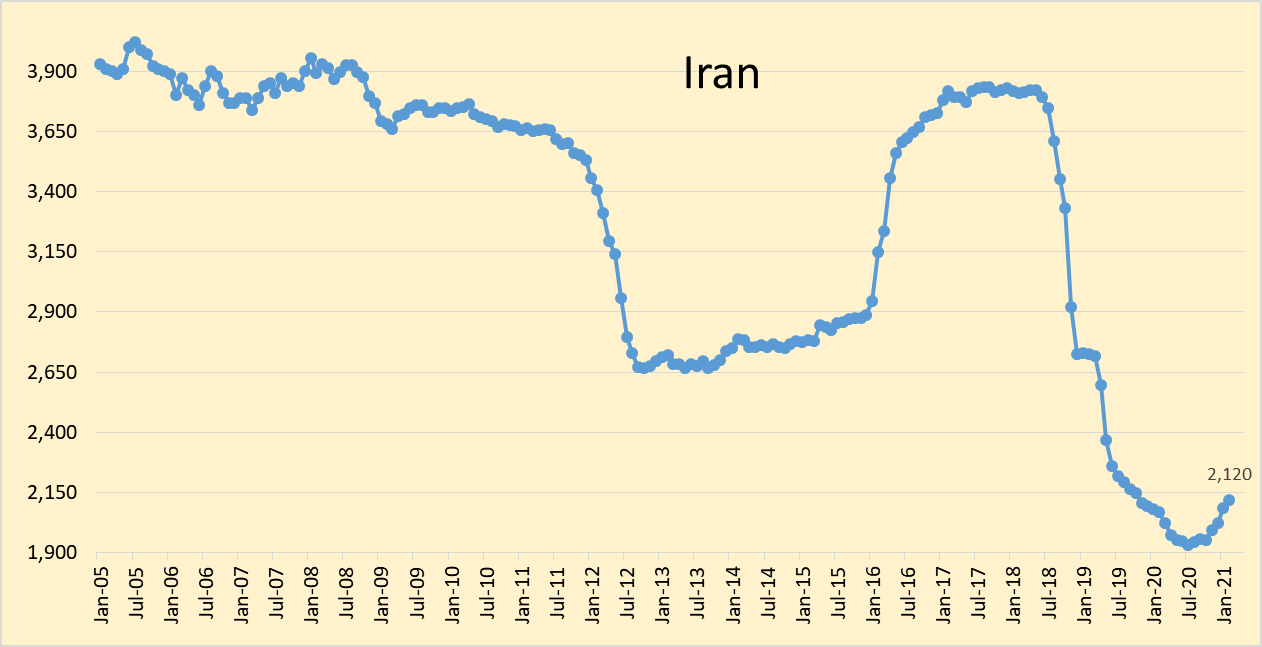
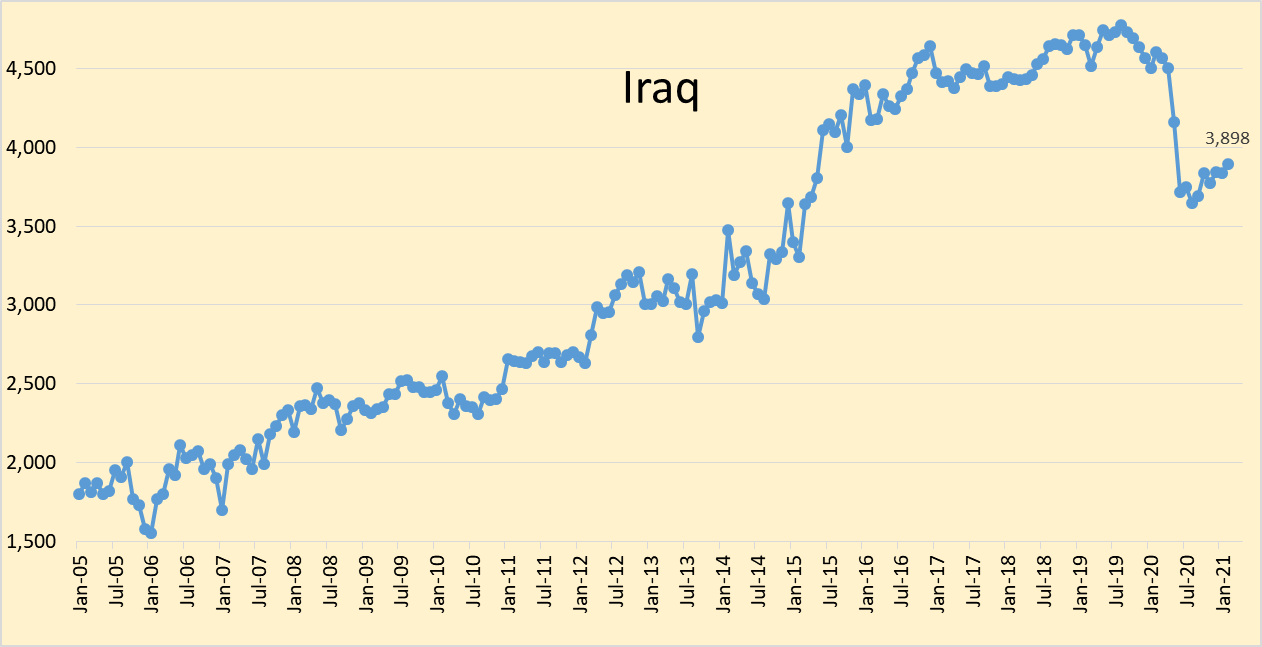
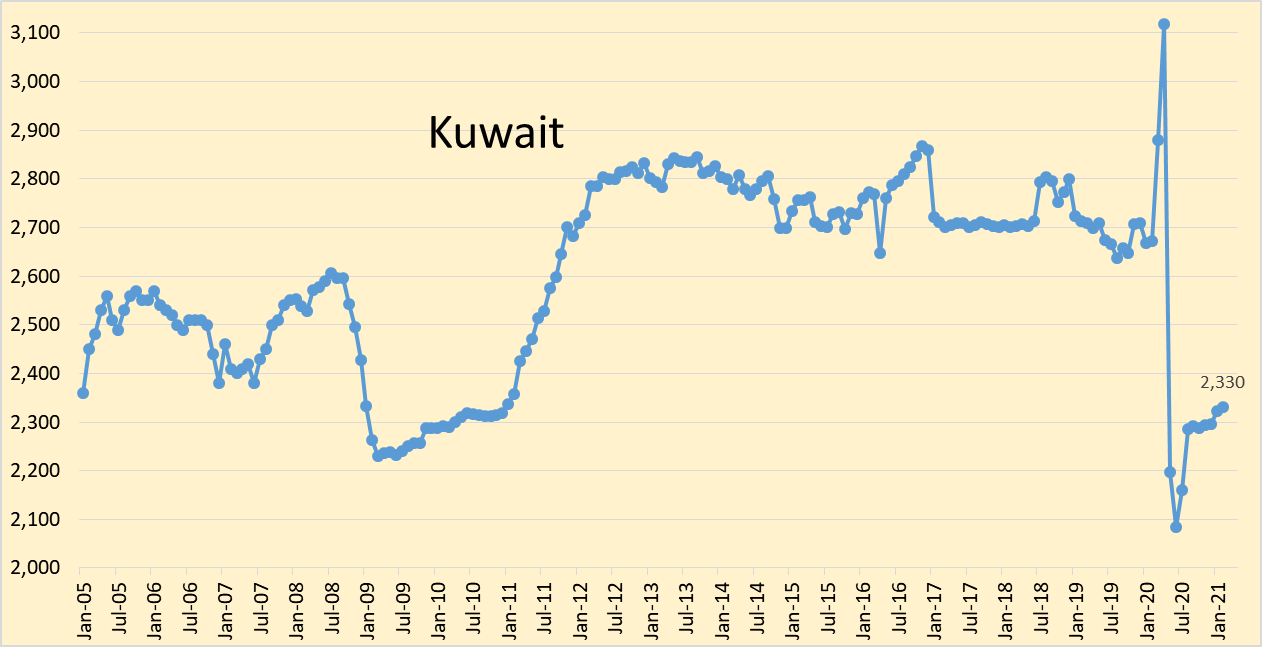
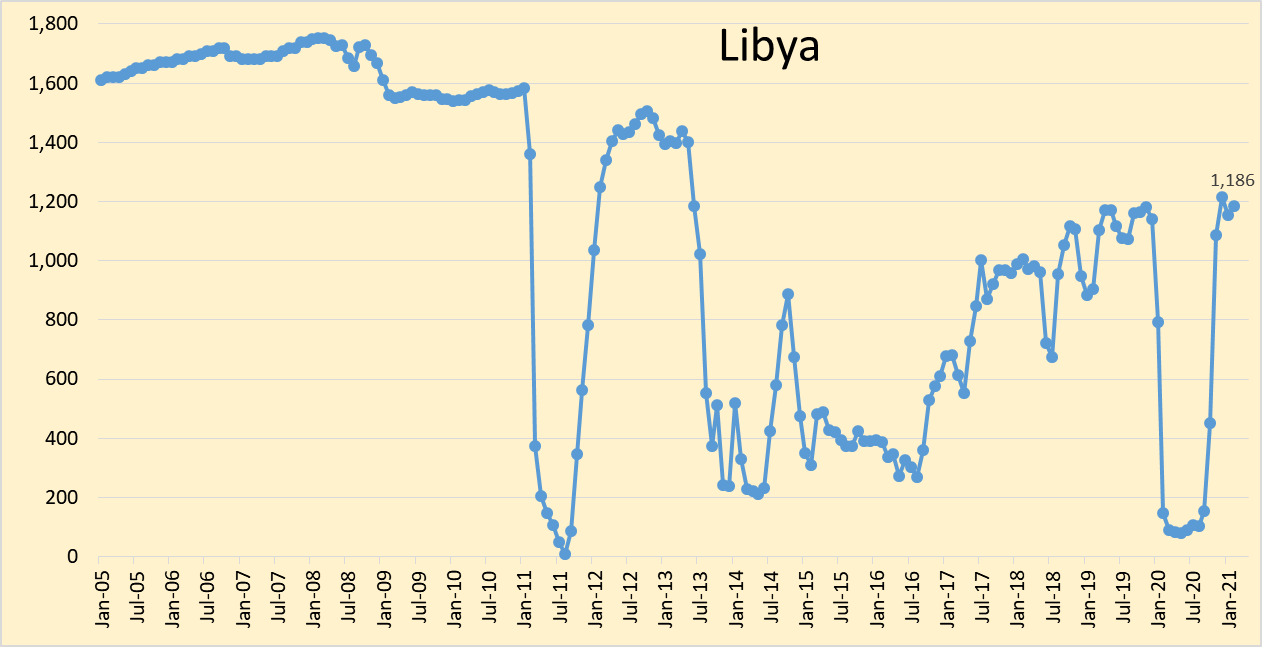
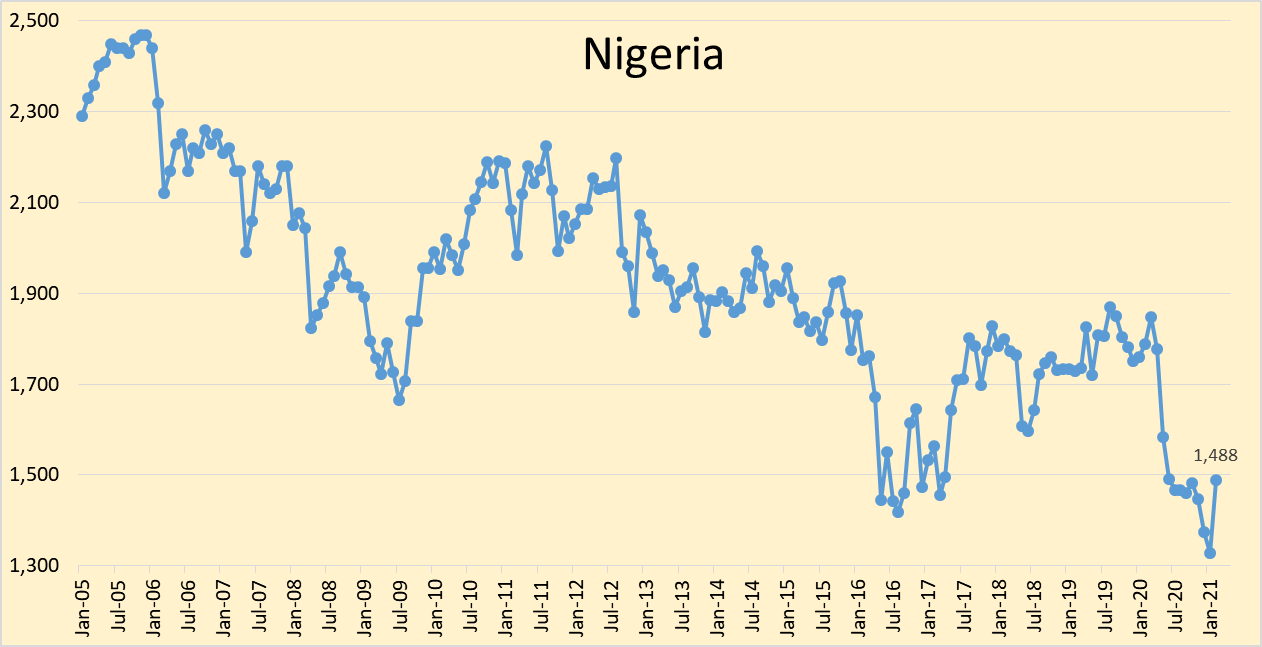
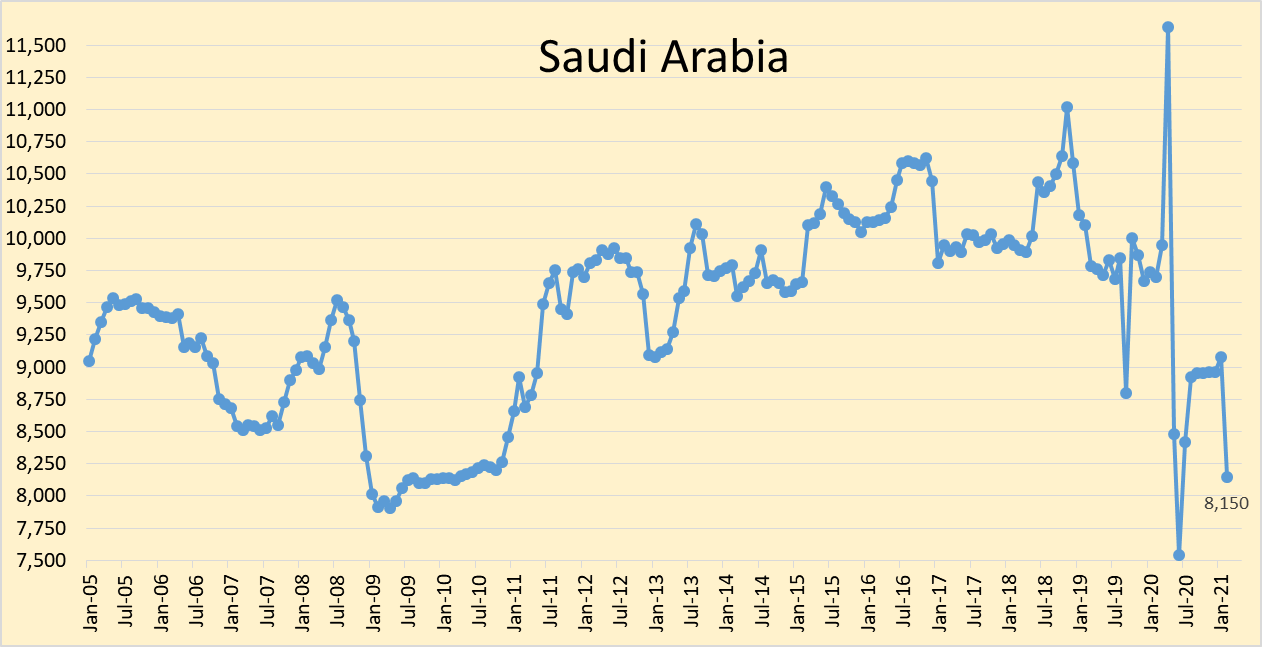
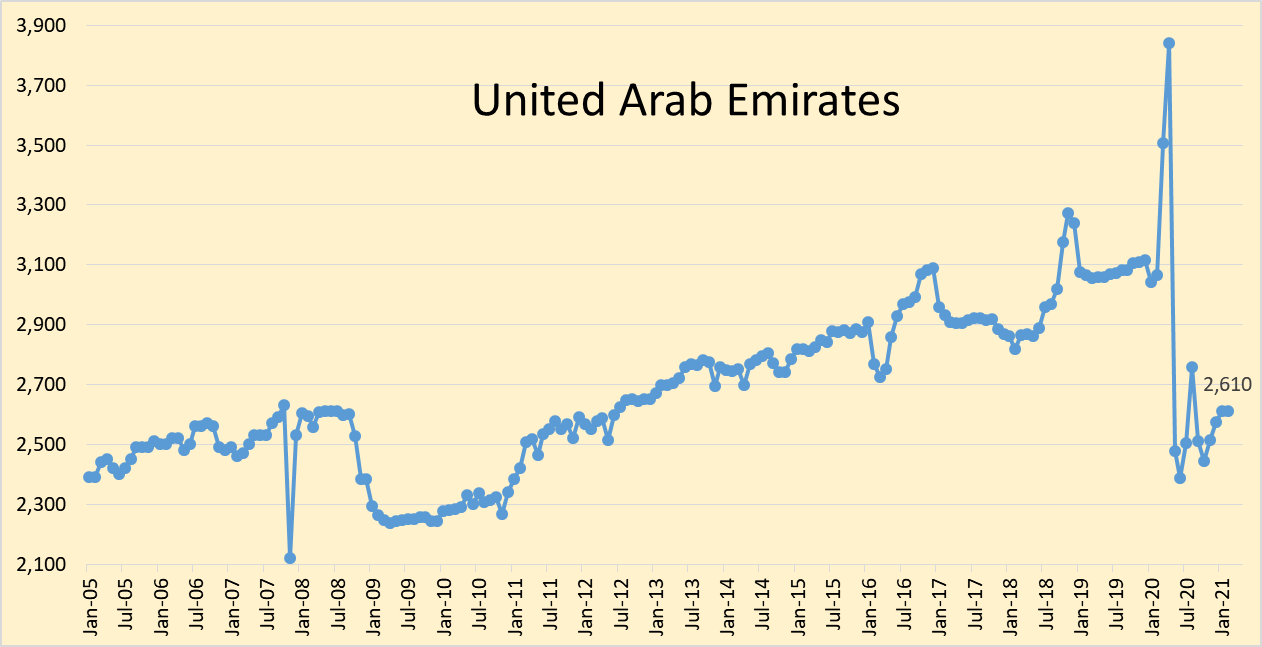
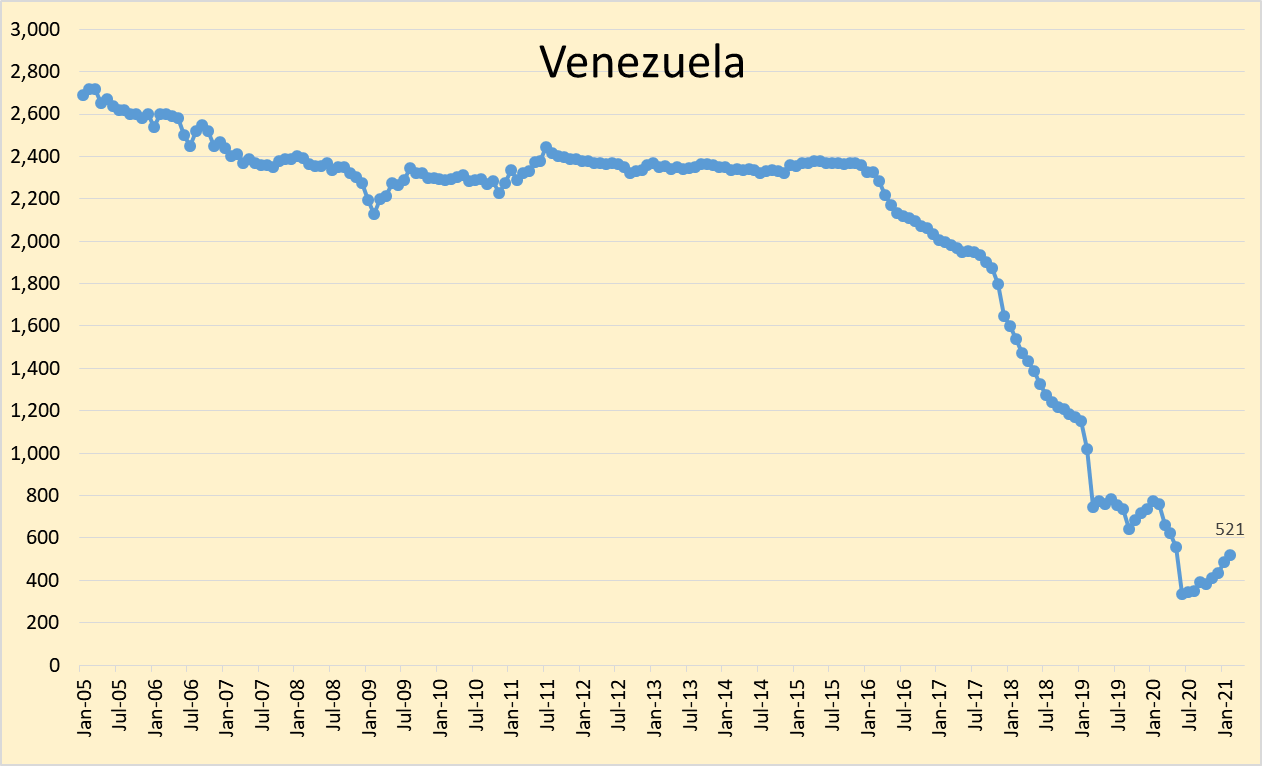
The OPEC Monthly Oil Market Report for March 2021 was published this past week. The last month reported in each of the charts that follow is February 2021 and output reported for OPEC nations is crude oil output in thousands of barrels per day (kb/d). The numbers at the left side of the graphs show February 2021 output (and in some cases the trailing 12 month average output).
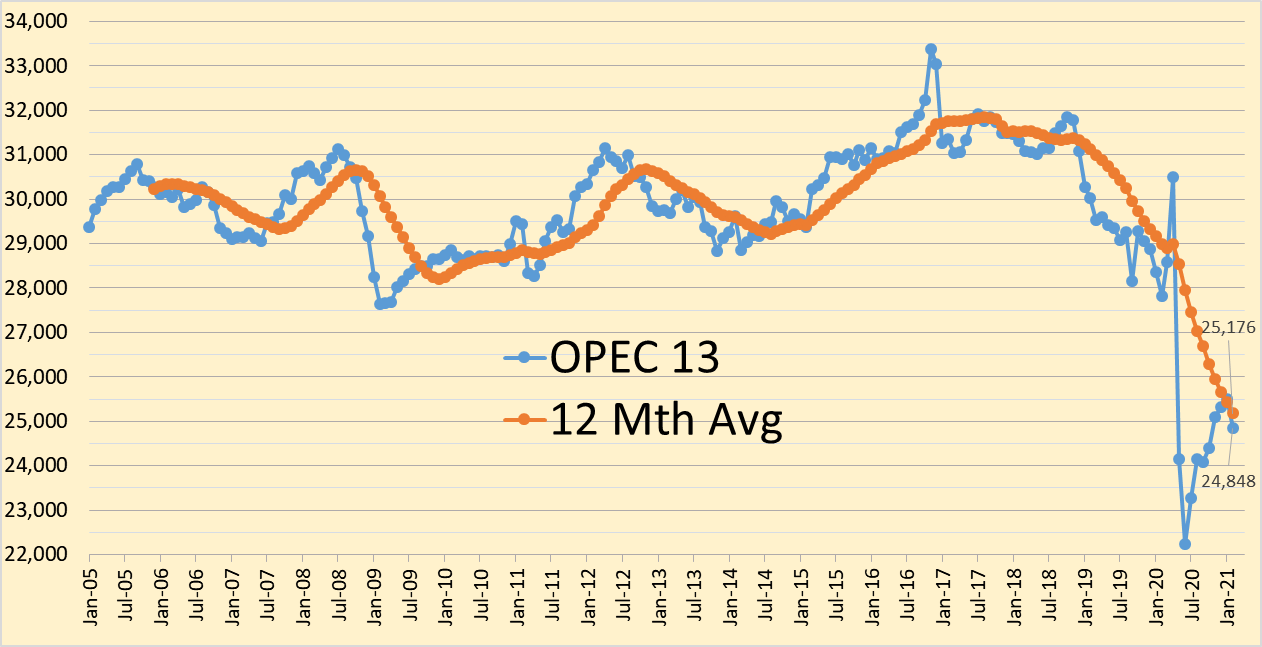
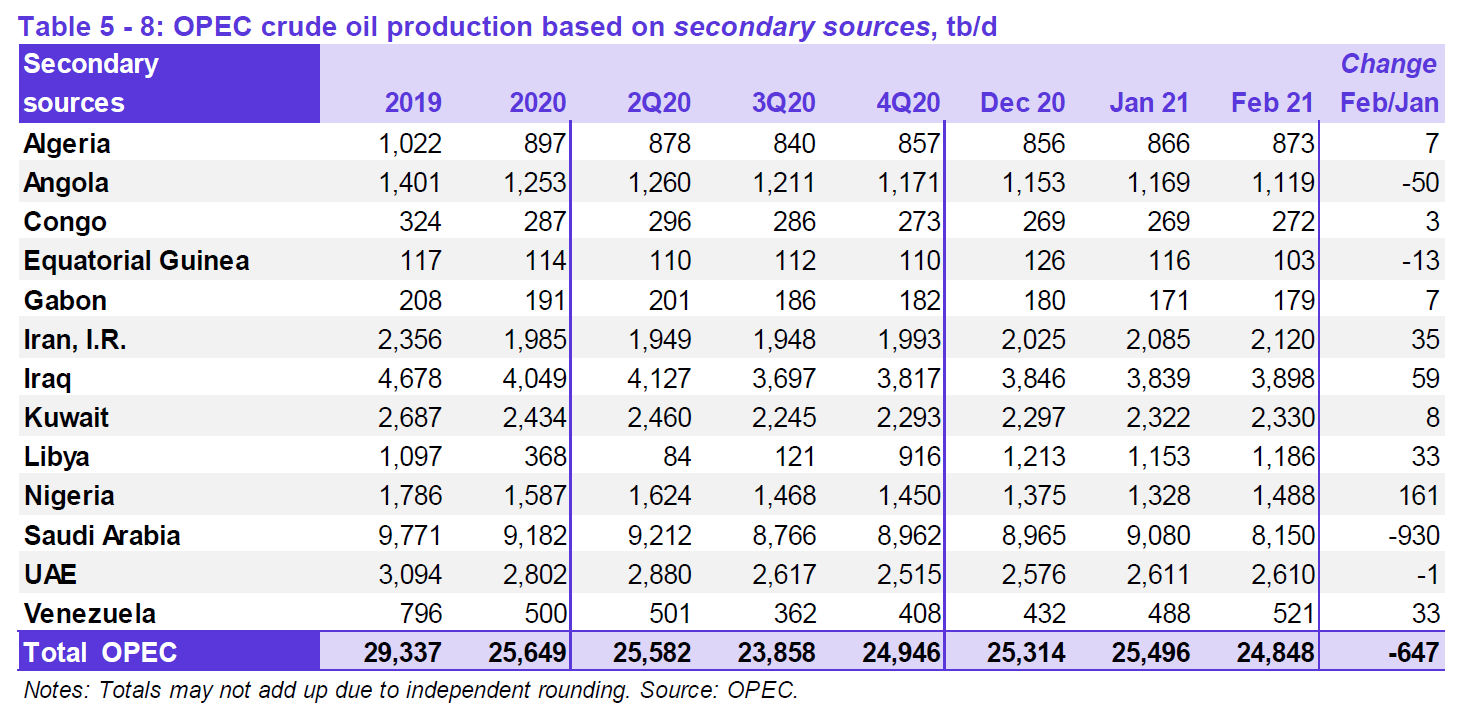
OPEC crude output decreased by 647 kb/d in February 2021, total OPEC crude output for January 2021 was not revised from last month’s report. Most of the decrease in OPEC output was due to a cutback in Saudi Arabia’s output by 930 kb/d from January to February 2021.
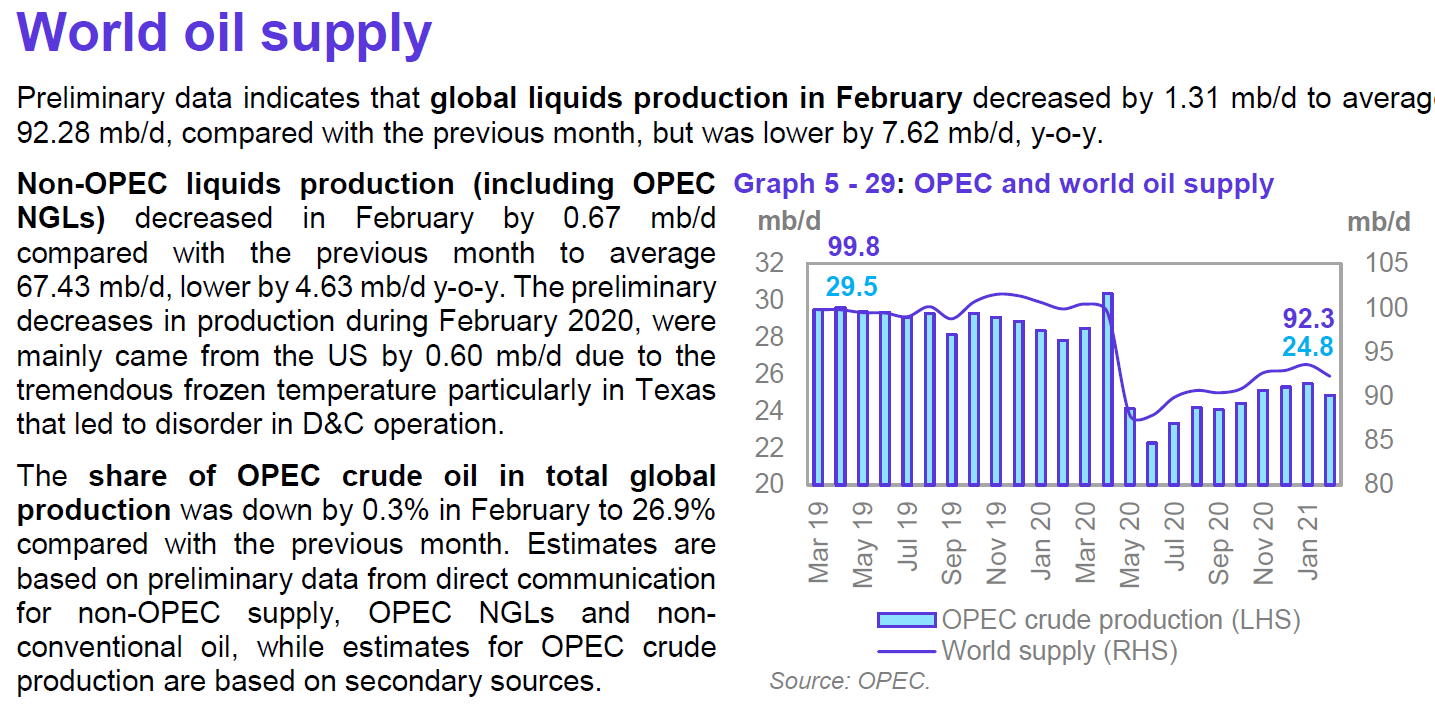
World liquids output decreased about 7.6% in February 2021 from 12 months earlier.
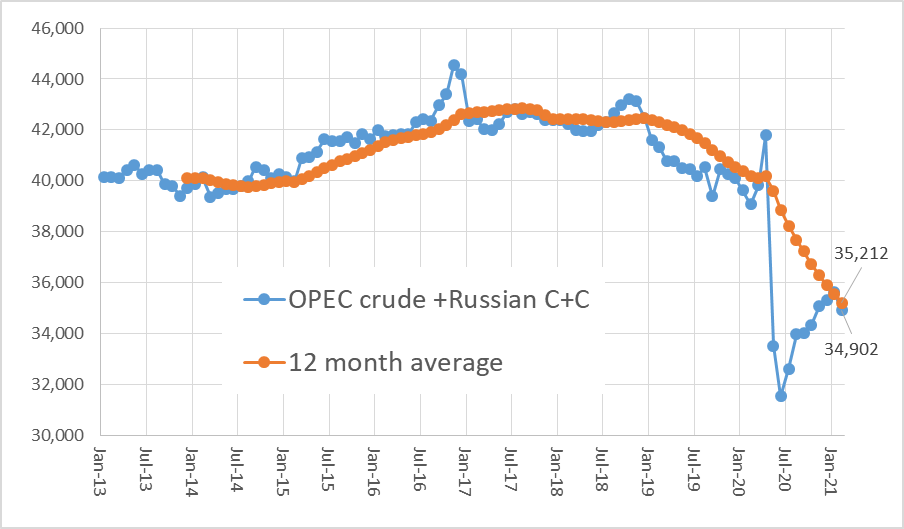
The chart above uses data from the Russian Energy Ministry and converts from metric tonnes to barrels at 7.3 barrels per tonne, the combination is OPEC crude plus Russian C+C output. Russian output decreased by 74 kbo/d in February 2021, OPEC13 crude + Russian C+C output decreased by 722 kbo/d in February 2021.
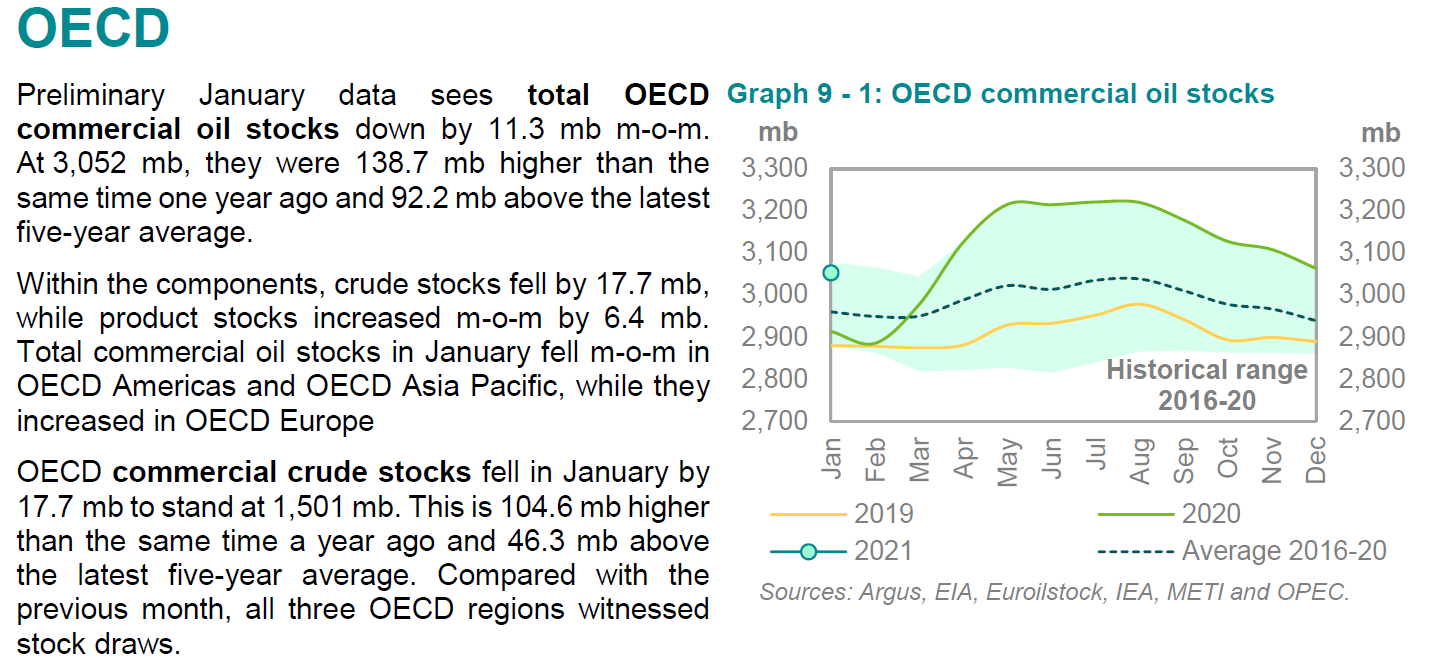
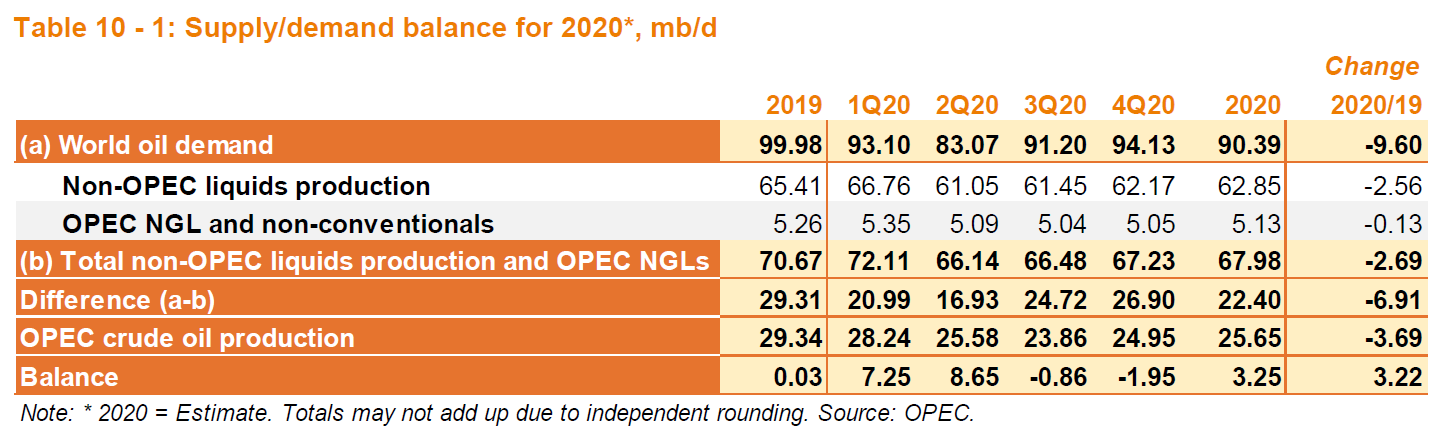
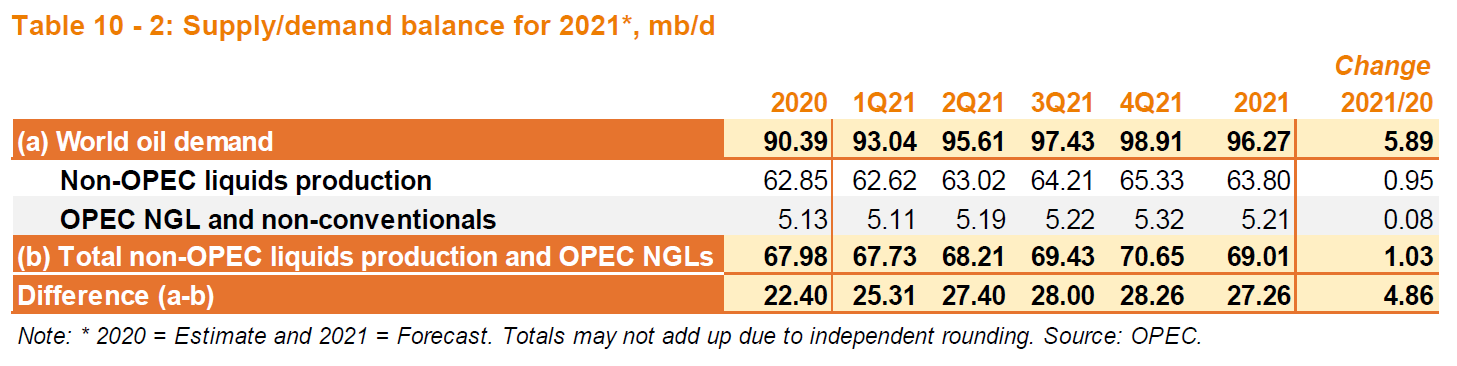
Recent OECD commercial oil stocks were 92,200 kbo above the 5 year average (see figure 18 above). OPEC crude output for February was about 25,000 kbo/d. OPEC estimates demand for OPEC crude in the second quarter of 2021 will average about 27,000 kbo/d. If the OPEC demand estimate for OPEC crude is correct and OECD oil stocks roughly reflect the level of World oil stocks, then continued OPEC output at 25,000 kbo/d in the second quarter of 2021 would lead to a stock draw of 2000 kbo/d during the second quarter of 2021. The total stock draw would be about 180,000 kbo (2000 kbo/d times 90 days) and at the end of the second quarter OECD oil stocks would be 88,000 kbo below the 5 year average. This would likely lead to higher oil prices, though I expect OPEC will raise output quotas within a few months (perhaps April or May). Brent reaching $75 to $85/bo seems likely if the OECD oil stock levels fall below the 5 year average.
133 responses to “OPEC Update, March 2021”
U.S. shale oil output to drop 46,000 bpd to 7.46 mln bpd in April -EIA
U.S. oil output from seven major shale formations is expected to decline by about 46,000 barrels per day (bpd) in April to about 7.46 million bpd, the U.S. Energy Information Administration said in a monthly forecast on Monday.
EIA said producers drilled 380 wells and completed 482 in the biggest shale basins in February. That left total drilled but uncompleted (DUC) wells down 102 to 7,086, their lowest since November 2018.
Yes, DUCs are falling. Below are the total DUCs through January. Though this is from the Drilling Productivity Report it is not an estimate but a total count.
Drilling Productivity Report
I marvel at the shale lunatics’ desire to continue losing money.
This absolutely guarantees that oil will never crack $80/bbl again. We’ve already seen $0 — we’ll be back there.
Nathanael,
Brent today is at $68/bo. Tight oil production has a positive cash flow at that price in the Permian basin.
And, today, on the 18th, Brent is down to $62.99.
Cash flow is nice but — unless the plan is for the executives to stiff the bondholders and stockholders in bankruptcy, and default on the well-capping costs, leaving those to the state — which I suspect it is — one has to actually make a profit, too.
Nathanael,
Oil prices are volatile, that is rather obvious.
My model looks at Permian basin and assumes well cost has been the same since 2010 in real dollars (in fact earlier wells were shorter laterals, less proppant and significantly less expensive. In short, the assumption is conservative.
I assume Brent reaches $75/bo (2020 US$) in Dec 2022 in scenario below.
Chart below has discounted cumulative cash flow for all producers for a conservative scenario of 59 GB cumulative tight oil output from Permian basin. Discount rate is 10% annual rate.
The annual ROI is about 10% for the producers in this scenario, where it is assumed Brent oil prices never rise above $75/bo in 2020 US$.
Click on chart for larger view.
U.S. oil & gas rig count falls for first time since November: Baker Hughes
(Reuters) – U.S. energy firms cut the number of oil and natural gas rigs operating for the first time since November even as crude prices soared to their highest since 2018.
The U.S. oil and gas rig count, an early indicator of future output, fell by one to 402 in the week to March 12, according to data on Friday from energy services firm Baker Hughes Co.
That count is 390 rigs, or 49%, below this time last year.
The oil and gas rig count has increased for the past seven months since dropping to a record low of 244 in August, according to Baker Hughes data going back to 1940.But the pace has declined each month this year, from eight in January to five in February and now zero so far in March.
U.S. oil rigs fell one to 309 this week, while gas rigs were unchanged at 92.
My suspicion is that rig counts are flat due to debt maturities. According to Rystad Energy (in 2019) debt maturities for US LTO will peak in 2022.
Note: I tried to upload the Rystad graph of debt maturities for 33 E&P companies but each time got an error message: “this page can’t be found.” Eyeballing the graph puts debt maturities plus interest payments at $9-10 billion in 2019, $11-12 billion in 2020, $18-19 billion in 2021 and $26-27 billion in 2022, followed by a close to linear decline to $3-4 billion in 2030.
Schinzy, maybe your suspicion is correct . My viewpoint is that (a) there are no more sweet spots left to drill (b) costs have gone so much higher than 2019 that drilling even at current WTI is a losing proposition (c) there is no more OPM ( other people’s money) to waste . CAPEX has to be done with free cash flow and shale never made any money even at $ 100 WTI .
Hole in Head,
With respect to (a), I strongly suspect the US LTO industry of high grading over the past 6 years, but I have yet to see strong evidence of it.
With respect to (b), I have long maintained that peak oil is a low price phenomenon, not a high priced phenomenon, that is to say that peak oil is about extraction costs rising faster than market prices. Though I don’t have specific numbers, we are in agreement.
With respect to (c) I haven’t seen any estimates of capital flowing into US LTO for 2020. I have learned in the past few years never to over estimate the perspicacity of investors. For example according to the FT, the year of greatest capital (debt + equity) inflows to US LTO was 2016, the year of lowest WTI price between 2005 and 2019. In any case, with my above observation, even with OPM, I do not expect rig counts to rise to previous highs before 2024.
That debt to equity ratio for 2019 is unbelievable. Who in hell would throw more money at that?
Who would throw more money at that?
A particular type of junk debt speculator, who thinks they’ll be able to wipe out all the previous investors in the next bankruptcy and then control a viable company post-bankruptcy. In this case, that won’t work either, but we’ve seen this exact behavior in the collapsing coal industry (where it isn’t working either).
Worth noting from the coal industry: there is no money to open new mines or even new seams at the point at which this sort of vulture investment is all that’s left. The same will be true with oil; the surprising thing is that the rig count hasn’t reached zero yet.
Hole in head,
If there were no more sweet spots left to drill we would see average new well productivity decreasing. For US tight oil this is not the case to date.
See https://shaleprofile.com/blog/us/us-update-through-november-2020/
click on well quality tab
(1) They started fracking even more aggressively in the last few years, frontloading the oil production even more. Documented.
(2) Pretty much every play but the Permian has been abandoned, and the Permian is full of conventional oil, so it performs better.
The chart above is a very poor use of “selective” data to make an argument against over-drilling of sweet spots and how shale oil well productivity, once normalized for lateral length/proppant loading, has plateaued in both sub basins of the Permian and has declined, precipitously, in other basins like the Eagle Ford and Bakken. Why? Everybody now knows, or should know, those shale dudes are drilling themselves into oblivion.
Well productivity is not getting better, its getting worse. Further, decline rates in shale oil wells are accelerating earlier in the well’s life span because of how frac’s are now designed to get as much cash as possible from a well, as fast as possible. The data is very clear on this.
The shale oil sector downsized spacing, drilled wells that bashed into other wells, parents fought with their children and productivity declined. They then “upsized” spacing again. There is a reason for that and it has to do with GOR and well performance, EUR and economics…all related to over drilling sweet spots. Nothing in the oil business lasts forever, neither will shale oil. Of course they are running out of good rock. Good grief.
https://www.oilystuffblog.com/single-post/in-the-shale-oil-biz-hope-springs-eternal
Mike,
That is correct. I do not have access to productivity by lateral length.
The chart is for all of the US, from shale profile, I don’t have access to productivity per lateral foot for the US.
I simply showed the data available.
I expect average well productivity will decrease. I agree the best rock will be drilled first, kind of how things are done I assume.
Eagle ford has seen productivity decline, on that I agree, in the Bakken I have not seen any evidence of precipitous productivity decline based on Enno’s October 15, 2020 report. Through 2019 (which is really the last year we have enough data to judge, there may have been a slight decline in average Bakken productivity per lateral foot. Proppant load has not changed much since 2017, lateral length has also been pretty flat since 2017 for Bakken. There has been only a very slight decline in Bakken cumulative production over first 12 months from 2018 to 2019.
Thank you Mr Shellman, I have been looking for a report like that.
Someday I will make it to Texas and it would be an honor for me to take you on in a game of tennis!
Schinzy, you must please call me Mike and I would look forward to that…providing your getting older at the same rate I am and your “stuff” aches and hurts as much as mine. Alas, we’ll do battle, however old we are, take Advil and drink beer after…and the winner shall buy the BBQ.
Mike,
I am giving a talk Monday and will cite your post.
I lettered in tennis at UCLA 1975-1977. I never made the top 6, but it’s funny how the memories of those days stay with you over time. I played next to some good players.
Hi Mike,
Yes nothing lasts forever. If WTI oil prices rise to $72/bo in 2020$ we might see something like the chart below for Permian output.
Schinzy,
You need to edit the chart so it is less than 50 kB, sometimes saving in gif format or jpg is smaller then png, but not always, also using editing software you can reduce resolution and get a smaller file. You are getting that message because the chart is larger than 50 kB.
Thanks Dennis.
The latest from the EIA’s Drilling Productivity Report. Understand that the last three months here is pretty much a guess. The big drop in February was due to the weather, recovered in April to continue its decline.
The reason DUCs are falling is that Monthly completions are outpacing monthly wells drilled. The companies are saving money by completing previously drilled wells but not investing as much in drilling. The data is through January.
For those unfamiliar with the acronyms here, DUCs are “Drilled but Uncompleted wells”. That is the well has been drilled but not yet fracked.
Note that the completion numbers reported by the DPR usually get revised.
Chart below has the estimate for tight oil well completions by shaleprofile, last data point is November 2020 for chart below.
The EIA DPR has November well completions at 518. Eyeballing your chart you have November completions at about 450. So yeah, I guess the DPR completions will be revised….. downward.
But the EIA DUC count for November is an actual count, not an estimate. I really don’t see what you are trying to get at here Dennis.
Dennis, shale oil production is declining because of a lack of other people’s money. Those other people are tired of losing their ass betting on shale oil. It just looks bad for the shale oil industry Dennis. Why do you find that so hard to admit?
Ron,
I try to learn from past mistakes. I have consistently underestimated the resiliency of the tight oil producers. My current Permian models assume that wells are financed from cash flow and interest on accumulated debt is assumed to be at a nominal annual rate of 7.5%. My oil price scenarios are very conservative and a gradual ramp up of completions allows a nominal 9.5% minimum ROI (as an annual rate) for any new well that is completed.
The DPR estimates completions and that is the basis for DUC estimates, the estimates are model based, if you go back in time and look at DUC estimates from a year ago and compare with the most recent estimates you will find significant revisions.
My point is very simple, the DPR estimates are not data, they are estimates based on models, and the models are not very good.
Dennis, the DPR makes estimates for the data they do not yet possess. However, their data for North Dakota match exactly the data North Dakota produces. It is just that North Dakota does not make future productions, the EIA does. I suppose that is the same for every state as well.
North Dakota publishes “completed” and “waiting on completion”, (DUCs). Chart below. They differ slightly from the EIA’s data. However, the EIA DPR Bakken data is for North Dakota and Wyoming where the North Dakota data is ND Bakken only.
In short, I do not think the EIA DPR data is all that bad. In fact, they get it pretty close most of the time. But it is the nature of estimates to be off slightly. And when there is an unexpected weather event, they are usually off a lot. The EIA is lousey at predicting the weather.
Ron,
Perhaps the North Dakota data is very good, for many other states that is not the case. We do not have good completion data for Permian, Eagle Ford, and Niobrara.
See my chart below comparing current estimates with those from 12 months earlier for DUCs from DPR reports.
Oh and I disagree that the DPR is pretty good, they are ok when there is a steadily increasing or decreasing trend (their forecasts in that case just extend the trend and do ok). Whenever there is a change in trend they miss badly. Their basic model relies on rig counts, not really a great model.
Chart below compares DUCs for Permian, Bakken, Eagle Ford, and Niobrara from March 2020 DPR and March 2021 DPR, the revisions are significant.
Dennis , tks for the good work .
Ron , tks for the dissection and analysis .
Just confirms ‘ the shale party is over ‘ .
Saudi Arabia’s economy contracts 3.9 per cent in Q4
The oil sector contracted by 8.5 per cent and the non-oil sector declined by 0.8 per cent, data from Saudi Arabia’s General Authority for Statistics showed..
I think they’ve peaked and are now in deep trouble.
Frugal , I am of the same view . KSA will not be able to touch 10Mbpd again .
Agree with you both. I don’t believe the gracious 1mmbopd cut is voluntary.
lightsout,
these claims have been made in the past, they were wrong then too. 🙂
Indeed,
At that point, there is no reason to think that KSA is unable to recover production.
This 1Mbpd cut was decided in January, while Brent was stagnating around $55. The prince increased by almost $15, before retreating a bit.
That was a pretty successful move. Despite delivering less oil, KSA increased revenue because the price increased.
Interesting to think about. Saudi Arabia is clearly trying to maximize short-term hard-currency income. So they want to cut production as long as it raises prices enough that
(new price * new Saudi production) > (old price * old Saudi production), but *not more than that*.
I don’t know how to model this psychology, frankly; since the oil price swings wildly, figuring out what their optimal move is seems quite tricky. Let’s see: they basically went from 10 Mbpd to 9 Mbpd, so the gain is (9 * difference between old and new price) and the loss is (1 * old price).
9 * 15 – 1 * 55 = 80.
Ah, but oil is back to $63. Now, let’s hypothesize that it falls back to $55. That 1 Mbpd they didn’t produce earlier gets sold at $55, so that is breakeven apart from the time value of money. If it ends up never being sold, well, they still gained.
So suppose it’s back at $55 and then the Saudis try the same cut again to get the price back to $70, this time going from 9 to 8:
8 * 15 – 1 * 55 = 65.
Now, suppose the price retreats back to 55 and they try it a third time, cutting from 8 to 7:
7 * 15 – 1 * 55 = 50
Now it’s getting interesting. This is still a gain, but now if that delayed-production Mbpd never gets sold, if the Saudis have waited too long and it’s worthless now, then they *lost* money in the long term.
I could do similar calculations with different prices, but prices are also impacted by so many other things I don’t think it really makes sense. The takeaway is that Saudi Arabia can make deliberate cuts to keep the oil price up for a while, but at some point if they keep it up they start risking their oil being stranded and unsold. I’m not sure what that point it, and it depends on the overall demand, mostly.
So, for further analysis, let’s start with the basics. Quantity of production and quantity burned has to stay close to balance, because of limited storage. Because of lags between drilling investment and production, it often doesn’t balance, which tends to swing the price both very high and very low. There are not many lags on the demand side. Saudi Arabia has the ability to adjust quickly on the production side by keeping oil in the ground or pumping it faster, probably quicker than most other oil producers and it actively does so. This means it is the market balancer.
So as demand drops, Saudi Arabia will drop production as long as it is a profitable move for it to drop production.
Saudi Arabia also wants to keep the price *low* enough to keep the frackers from expanding, however. Let’s assume the Saudis can expand production enough to do that if they want to. Current estimates are that breakevens for the frackers range from $48 to $54 around Texas. Long-dated WTI futures track these breakevens. The breakevens won’t drop. So start with that as a reference price; roughly $50.
Below that, Saudi Arabia has the market; above that, they start losing part of the market. You can look at their situation as a question of how much of the market they want to cede to the frackers in order to sell more production themselves, which is an optimization question: when they pump less, how much do they raise the price by, and does this profit them?
Running a few different scenarios, it becomes clear that Saudi Arabia should cut from 9 Mbpd to 8 Mpbd if they can raise the price by even $5/bbl. They should cut from 8 to 7 if they can raise the price by $10/bbl, and I question whether they can do that reliably (looking at today’s oil price of $63, which is only up $8 from $55). But from 7 to 6, they really need to induce a rise of $12/bbl to make it worthwhile and I don’t think they can really do that consistently (looking at today’s oil price).
This is surprisingly invariant to the price of oil, at least in the $45-80/bbl range. The biggest effect on the financial calculation is the total Saudi production level, and it seems that they have financial incentives to cut back to 7 or 8 but not beyond that. Once the Saudis stop cutting production and let the price drop to $50/bbl, shale is over; when they let it drop to $45/bbl, tar sands are over too.
So, we can try to work out when the Saudis will stop cutting production to prop up the oil price. Basically, when they have to. We now know they were willing to cut to 9, and that they are likely to be willing to cut to 8, and probably to 7, but not past that. So they should take 2 Mbpd off the market (possibly slightly less) before giving up on raising the oil price above $45. The question, then, is when the *demand* for oil will drop by 2Mbpd relative to current demand.
Demand had reached 100 Mbpd in 2019, before dropping to 91.3 (estimated) in 2020, and I see estimates for 97.1 in 2021. So we can say that when it drops to 89, the Saudis will stop cutting and let the frackers and tar sands go bust. It was at 95 as recently as 2016.
I’ve tried to make a rough estimate of the drop in oil demand from the permanent switch to work-from-home telework. Surveys say the work-from-home rate went from ~5% or ~17% (different sources) up to 42% and is expected to be at 36% post-pandemic; I hate to generalize from the US but it’s where I can get the data. About a third of VMT is commuting. So very roughly speaking, 6%-9% of VMT will disappear permanently relative to the 2019 situation. I believe the lower number, 6%. This actually tells me that the estimates for 2021 oil demand are likely to be too high, and we’ll probably see demand below 95 Mbpd.
The next 6% drop in oil demand must come from other sources, however, probably mostly EV adoption. From EV adoption alone, it will take about 10 years (The drop in demand in 2030 alone should be about 6%; in fact the cumulative drop should be over 6% by 2029.)
So I am slowly coming to the theory that Saudi Arabia will control the oil price until roughly 2030. They will prop up the oil price by cutting production down as far as 7 Mbpd, attempting to maximize their profits, while increasing production whenever fracking or tar sands looks likely to expand, up to as much as 10 Mpbd, until then.
Around 2030 the oil price will crash and wipe out all expensive producers. Theoretically the floor level price is something like $2/bbl (the lifting cost) for Saudi Arabia, but it’ll take somewhat longer for the price to get that low; once it drops below $20/bbl, the attractiveness of gasoline vehicles will increase and so the transition will slow down, though government action to get rid of old polluters will probably keep it going.
Red diesel and Fracking
by Dr. Seuss
KSA to cut domestic consumption by 1mbpd .
https://www.zawya.com/mena/en/markets/story/Saudi_Arabia_targets_1m_bd_cut_in_domestic_oil_use-SNG_204625200/
What happened ? Ghawar maxed out ?
Hole in Head wrote: KSA to cut domestic consumption by 1mbpd .
Saudi Arabia plans to reduce domestic consumption of liquid hydrocarbons by one million barrels per day (b/d) for use “in a better way”, the kingdom’s Energy Minister Prince Abdulaziz bin Salman said.
Saudi Arabia Oil Consumption
Saudi Arabia Oil Consumption was reported at 3,787.568 Barrel/Day th in Dec 2019. This records an increase from the previous number of 3,768.874 Barrel/Day th for Dec 2018.
That means they are cutting more than 25% of their consumption, to below 3 million barrels per day, back to about 2009 consumption levels. So they can use the oil “in a better way”. Give me a break!
These are desperate times for the Kingdom.
Frugal,
I will reserve judgment until Brent reaches an average price of $75/bo or higher over a 3 month period. My guess is they can return to 10 Mbopd if there is demand for their crude.
Since overall demand is not increasing significantly, and I now expect Saudi Arabia to control the price, Saudis will increase production if and only if the production from other companies (particularly frackers and tar sands) drop significantly (thus raising the price enough for the Saudis to want to bring the price back down).
The timing on this is very hard to predict because the frackers are irrational actors who drill even when losing money.
The price will probably never breach $75 again; the Saudis will bring it down if it comes close. Only if the Saudis are *unable* to bring it down, due to the drop in production from the frackers and tar sands being more than they can compensate for, will it cross $75.
There’s at least 4 Mbpd in non-OPEC production which was there in Dec. 2019 and disappeared in Jan 2020, which means it’s just on hold and could be restarted. Which it will. I just did a ludicrously long analysis which concluded that the Saudis will not cut below 7 Mbpd, which is only 2 more. I believe with the rise of remote work, the market will re-settle around 95 Mbpd in 2022, down from 100 in 2019.
Prices were around $60 (WTI – $65 Brent) at the end of 2019; if all the non-OPEC production comes back, the Saudis pulling 3 Mbpd off the market would still leave 2 Mbpd which has to come out of other producers to keep the price up to $60. Russia’s basically coordinating with OPEC, so will maintain its 1.2 Mbpd cut, but I doubt they’ll agree to more since they have budgetary problems.
But the remaining non-OPEC cuts were mostly from the US, 2.6Mbpd. If the US does not maintain its cuts, the price will drop below $60. If the frackers have the discipline to maintain production cuts, or they go properly bust and are *forced* to shut their wells in, then the price might be kept up. But they probably won’t be forced to shut their wells in unless the price drops. So the price is heading south of $60 again.
The minor producers will produce everything they can, because for them, cutting doesn’t raise the price much, so more production means more money. Only the largest producers have the incentive to cut to keep prices up to raise their profits.
I’m not sure whether the price will drop below $50, but I think it does. It was there for 2015-2017. $45 is probably a floor, because $50 drives the frackers out of the market and $45 drives the tar sands out, which should be enough supply reduction to balance the market for the next few years. $45-60 seems like a likely trading range.
Nathanael,
Don’t forget depletion is constant and that there has been very little investment or exploration since 2015, so there will be downward pressure on supply from non-OPEC, also as you have argued there is likely to be lower tight oil well productivity in the future and thus lower profits and a lower completion rate, so we are not likely to see tight oil output increase at as high a rate as we saw in 2018 and 2019.
Thus even if OPEC gradually ramps to full output, supply may still be lower than demand, even accounting for the decreases in demand you propose (note that things will be very different from the US in much of the World). I expect we will see World demand for C+C increase by 800 kbo/d annually from 2021 to 2026 on average, then we may see a decrease for the annual average increase over the next 5 years to 400 kbo/d (2027 to 2031), it will likely fall to 200 kbo/d annual growth rate over the next 5 years and then to zero and then negative thereafter.
I hope your scenario proves correct, but I think my scenario is more realistic, time as always will answer the question.
Ron , how can they achieve this . Population in 2009 was 26.5 million . Population in 2020 was 35.5 million .
Not achievable under any circumstances. Decline rates , depletion and rust never sleep. You are correct ” desperate times ” .
Saudi exports have remained nearly constant since 1990, with occasional excursions up and down, and the increased production has been taken up by the increase in the domestic demand.
The data is from BP statistical review and thus for all liquids.
The press release of trying to cut back domestic demand can certainly be interpreted as the growth in production has stopped and the exports need to remain the same so that the budget expenditures are maintained. This is how I read it.
Seppo says: The press release of trying to cut back domestic demand can certainly be interpreted as the growth in production has stopped and the exports need to remain the same so that the budget expenditures are maintained. This is how I read it.
Yes, that is exactly how I read it also. Yet HH’s link states:
Reducing domestic demand could also help Saudi Aramco increase its long-term spare capacity from levels of around 1.5mln b/d to 2mln b/d historically.
Gad! How can anyone be so goddamn stupid? Yet, that is exactly how the majority of the world’s oil analysis views Saudi Arabia’s oil production capabilities. How did this happen? How did the world get so damn bamboozled with this con? How? Someone tell me how?
Friends , another bombshell from Saudi Aramco . They are in deep s**T.
https://indianexpress.com/article/business/saudi-aramco-to-cut-capital-expenditure-reports-44-4-drop-in-profit-for-2020-7238150/
Why cut CAPEX when you need more oil ? Simple answer , there is no more oil to find and decline rates are hitting as they have been doing horizontal extraction of their fields since about 15-20 years .
I have no doubt the late Matt Simmons would have a wry smile on his face.
@HH
Or, as I always said:
When you cut production, there is no need to maintain a higher level of output possibility. And when they think they have to maintain cuts till end of year – why investing in capacity you don’t use. They can still predend to produce more for a few month shock and awe by emptying deep storage tanks or uncounted floating storage and shifting numbers from here to there.
It will be the same with all cutting countries – they will have hard times and many billion $ to reach old production numbers. It’s not the same as reopening the valves after 3 months production stop.
I think SA can still increase production – by tapping lot’s of their secondary fields. They still have lot’s of oil in smaller fields, as discussed here in the forum, too.
But thats a double digit billion $ operation, building lots of pipelines and facilities in the desert. And anti-drone installations, too… And it won’t be 5$ oil then, it will be a lot more expensive than that after calculating Capex.
Mexico claims billion barrel find:
https://oilprice.com/Energy/Energy-General/Mexicos-Pemex-Boasts-Billion-Barrel-Oil-Discovery.html
I would still place PEMEX as the most likely NOC to go bankrupt…
Sounds like a lot but compared to the Prudhoe Bay oil field on Alaska’s North Slope that originally contained roughly 25 billion barrels, not so impressive.
Onshore? Conventional? They might actually be able to make some money on it and drive the frackers out of business.
Everything points to permanent low oil prices with declining total production.
just an uneducated guess, but I suspect more wild whipsaw action in the the oil market over this decade, just like in the past decades dating back to at least the 1973 Saudi oil cutoff/economic warfare.
Wouldn’t be at all surprised if big money comes after US Permian shale once again by mid-decade.
Since the ultimate permanent death of the oil industry becomes clear around 2030, when the demand decline from EV adoption exceeds the decline rate of the conventional oil fields (causing a permanent glut and permanent super-low prices unless wells are aggressively shut in) — very few people are going to be putting money into shale oil in 2025, with only 5 years left in the entire *industry*.
Euh, I did hear that the cut in Saudi oil production was asked to the Saudis by the … Americans in order to stimulate the research of oil in USA as the US oil production did peak (first one) in 1970 and was declining. Perhaps, the Saudis did answer with, perhaps, to much enthusiasm.
Bakken daily barrels per well, January 2014 through January 2021.
Hi Ron, do you know why the production per well in the Bakken decreased from 2014 – 2016, then increased from 2017 – 2019, and is now decreasing again? And do we (should we) a similar pattern in other tight oil plays?
Not really. It is normal for production per well to decrease as more wells come online, older wells keep producing but producing less. So the decline you see between 2014 through 2016 is normal, though I think it is a bit steeper than normal. However, I cannot explain the later increase.
You might get some idea by analyzing the data from the below links.
ND Monthly Bakken* Oil Production Statistics (Bakken Only)
https://www.dmr.nd.gov/oilgas/stats/historicalbakkenoilstats.pdf
ND Monthly Oil Production Statistics (All North Dakota)
https://www.dmr.nd.gov/oilgas/stats/historicaloilprodstats.pdf
Frugal,
The answer comes from completion rates, from 2014 to 2016 the completion rate in the Bakken decreased, then it increased from 2016 to 2019 and then decreased again during the pandemic.
See my convolution post
http://peakoilbarrel.com/oil-field-models-decline-rates-convolution/
spreadsheet here
https://drive.google.com/file/d/0B4nArV09d398TnVzQzlOU19WNlk/view?usp=sharing
Chart below has modified completion rate from original post (#wells added, line 3 of spreadsheet has been changed)
The barrels of output per well would be expected to decrease over time, sometimes an increase in completion rate from low to high (as in the period of 2016 to 2019) can reverse the decline temporarily.
For the model above from month 40 on we have the following for barrels per well produced.
Dennis. If I understand you correctly, the production per average well is related to the proportion of high producing new wells versus low producing old wells. Is this correct?
Frugal,
Yes that’s the basic idea.
The average number of barrels per well is inversely proportional to the average age of the wells. LTO wells have high decline rates, the older the average well the lower the number of barrels per well.
Oil production in Brazil drops 8% in February, says ANP
Brazil’s average oil production totaled 2.73 million barrels of oil per day (b/d) in February, a drop of 8% compared to the same month last year, according to data from the National Petroleum, Natural Gas and Biofuels Agency (ANP), released on Wednesday, March 17th.
Angola: Oil exports collapse to 2008 levels
“Angola plans to reduce crude exports to 1.05 million barrels per day in May,” Bloomberg reported on Wednesday.
Production had fallen by more than a third since 2015 when international oil companies began cutting investment to compensate for falling prices.
The IEA published their forecast for oil (all liquids) demand out to 2026 today. According to the attached chart, they are projecting demand to be 104 Mb/d in late 2026, early 2027.
In January 2020, C plus C production was close to 83 M/d. At most the all liquids IEA demand increase of 4 Mb/d from January 2020 January 2027 could translate into a demand increase 4 Mb/d of C plus C over January 2020.
If correct, the world will need 87 Mb/d of C plus C in 2026, which is roughly 2.5 Mb/d more than the November peak of 84.3 Mb/d. In November 2019, the US peaked at 12.9 Mb/d.
This is going to be quite a challenge for the oil producers of the world. Difficult to see how a low oil price environment solves this problem.
There are a number of interesting charts in the attached article.
https://www.reuters.com/article/iea-oil-int/iea-says-oil-supercycle-unlikely-but-gasoline-demand-may-have-peaked-idUSKBN2B9129?rpc=401&
Ovi,
I agree the article is excellent.
Some of the increase will be NGLs and biofuels, not all of it will be from C C. EIA estimated about 85 Mbopd in 2026 in the IEO 2019, I would expect the estimate in the IEO 2021 will be lower. The IEA forecasts are not very useful because they are all liquids forecasts without breakout by crude etc.
Will the increase of US production in March occur as mentionned in the IEA chart as the DPR report suggests a decrease of total shale production?
JFF
Yes. The STEO is showing production back up to 11,000 kb/d. The weekly EIA data is showing 10,900 kb/d. The February drop was due to a severe winter storm in the southern US and most of that production has come back on line.
The Short-Term Energy Outlook shows March C+C half a million barrels per day above January production. The Drilling productivity report shows March, shale only, 142,159 barrels per day below January production. Though one is C+C and the other is shale only, shale is now the majority of US production. One of them is horribly wrong, probably both. But it will be interesting to see which one comes closer.
Anyone taking bets?
Ron
I think you slipped a decimal point.
Yeah, don’t know how that happened. Thanks.
Ron,
The STEO is often wrong, but one month ahead I would say they are likely within +/- 100 kb/d about 98% of the time. As to a bet, it would depend on the odds.
Jean Francois,
We saw production decrease in February due to Arctic event in Texas, in March output will likely rebound to just below the January level.
The more accurate numbers for US production are from the PSM report.
Weekly, DPR and STEO estimations are quite rough estimations. Especially when suprise events happen, like the winter storm in the south.
Tita, we all know that. The PSM is historical data only. The STEO and the DPR both get their historical data correct. It is correct because they get their data directly from the PSM. But they both make predictions about the short-term future production. The PSM makes no predictions. Hindsight is always 20-20, no matter which report you are looking at.
IEA is unrealistically bullish on oil, as they have been for quite a long time. They’re simply assuming reversion to 2019 demand in 2022. We already know that the pandemic is stretching into 2022.
Even in 2023, they’re making a stupid assumption. We already know that work-from-home is here to stay, which permanently reduces gasoline demand (by how much is hard to tell, but I’d guess 6%). Oil demand is almost entirely on-road gasoline and diesel demand (and those two move together), so expect a 6% or 5% drop there, for a post-pandemic forecast of about 95. By 2028, EVs will be severely cutting into oil demand, so it may never hit 100 again.
(if I wanted to do a better calculation, I’d include aircraft kerosene demand, but you don’t have to, because it’s only 9% of the barrel when fractionated. Everything else is essentially a byproduct.)
Nathanael,
Perhaps IEA has access to more data than just the US, which is only about 15 to 20% of World demand. Input to US refineries for crude is typically (pre-pandemic) about 15 Mbo/d, World peak crude output (annually) was about 83 Mbo/d (thus 18% of World crude was refined in US refineries). We need to account for the other 82% of the World consumption of crude and the IEA attempts to do so.
My guess is that they are optimistic and you are pessimistic, reality will be somewhere between these extremes. Roughly matching my scenarios. 🙂
EIA: OPEC Cuts To Lift Oil Prices Through April
Oil prices will likely remain at the current high levels in March and April, with Brent Crude prices averaging between $65 and $70 per barrel, after the OPEC group unexpectedly decided to maintain their production cuts into April, the U.S. Energy Information Administration (EIA) said on Wednesday.
Note that the price crashed after OPEC announced they would maintain cuts.
Nobody believes there’s enough demand. Maintaining the cuts will keep the price from crashing negative, but it won’t bring the price up.
Why an oil price ‘supercycle’ is unlikely
London (CNN Business)Will crude oil prices continue their recent dramatic boom as the pandemic recovery takes hold? Perhaps not.
The International Energy Agency said Wednesday that it does not expect oil to enter a “supercycle,” or extended period during which prices rise well above their long-run trend.
“Oil’s sharp rally to near $70 per barrel has spurred talk of a new supercycle and a looming supply shortfall. Our data and analysis suggest otherwise,” the IEA said in its latest monthly report.
Some analysts are expecting crude prices to surge near $100 per barrel as coronavirus lockdowns end and travel resumes. But the IEA, which monitors energy market trends for the world’s richest countries, thinks there is too much oil sloshing around global markets for a supercycle to take hold.
SNIP
The OPEC+ group had already agreed in January to keep production steady for February and March. At that time, Saudi Arabia surprised markets by pledging to cut its production by an extra 1 million barrels per day, a move that reflected unease about fragile demand. Saudi Arabia has agreed to extend its extra cut through April.
Meanwhild oil prices are dropping. Both WTI and Brent down about $2.50 as of a few minutes ago.
Ron
The 10 yr bond is sinking the market and oil. It is up almost up 0.1% this morning to 1.733% and up about 0.35% over the last month. I guess the higher rate will slow economic expansion. Things could change in a couple of weeks as those $1,400 cheques arrive and get spent.
Ovi, this will be of interest . Seems not a lot of the $1400 is coming into the system . Mainly going into savings or running down debt .
https://www.zerohedge.com/markets/heres-how-americans-said-they-will-spend-their-latest-1400-stimulus-check
What the hell is happening. The 10-year bond being up .1% cannot cause this kind of hit on oil prices. There is some news out there that we haven’t heard about yet.
I think I have found it. Oil prices fall nearly 10% on renewed demand concerns Bold theirs.
(Bloomberg) – Oil in New York dropped more than 6% as short-term demand concerns and a rising dollar collided to cause the biggest intraday drop since October.
West Texas Intermediate fell nearly 10%% on Thursday and is poised to extend its stretch of daily losses to the longest in over a year. Brent also slid more than 8%. The Bloomberg Dollar Spot Index rose as much as 0.5%, weakening the appeal of commodities priced in the currency.
Futures have backtracked since Brent rallied above $71 a barrel and U.S. crude topped $67 earlier this month. China has muted its buying, touching off physical-market weakness in Asia, and a shaky Covid-19 vaccine rollout in parts of the world spells trouble for a complete demand recovery in the short term.
“This is a risk-off moment with some of the cyclical trades,” said Rob Haworth, senior investment strategist at U.S. Bank Wealth Management. Oil prices will likely “test the lower end of this trading range, because we don’t have a whole global reopening. We’re behind on vaccines outside the U.S., the U.K. and Israel, and parts of Europe are having to shut back down.”
Oil’s move lower may also be linked to some unwinding of long positions from commodity trading advisors as daily price gains or losses of more than 3% can often trigger this account group to quickly unload.
Beyond headline prices, crude’s closest timespreads are reflecting the fragile near-term outlook. WTI’s front-month contract is trading at a discount again to the following month, while Brent’s backwardation — a bullish structure signaling tighter supplies — is weakening.
“The sentiment has changed,” said Tamas Varga, an analyst at PVM Oil Associates Ltd. “Short-term supply and demand considerations are temporarily casting a shadow over the bright future that is likely to arrive in the third quarter of the year.”
Ron
The CNN article you posted above regarding no super cycle must have also had some influence.
Is the muting of oil purchase by China due to the fact that they are emptying in first their own oil storage? Or is their economy suffering of the postponement of economic restart in OECD due to the slowness of vaccination?
Grain fell hard also.
Haven’t checked other commodities
The reaction is a bit too fast but perhaps paper market catching up with the weak physical market has something to do with it? Lots of unsold barrels out there.
Patience. Nothing will really go wrong until Powell steps forward and says that the FED is powerless to do anything. Until that moment there will be a universal presumption that the FED will step forward and do something. It really doesn’t matter what.
Until that moment there will be a universal presumption that the FED will step forward and do something. It really doesn’t matter what.
– didn’t work out so well for Zimbabwe.
Sean , let me add Argentina and Venezuela to Zimbabwe . Entering the club will be Turkey and Brazil .
Tight oil estimates are out for February, there was a 512 kbo/d drop which was expected (I read estimates of 500 kbo/d). The chart below includes a projection for the next 7 months based on the trend from November 2020 through January 2021 (blue dots on chart). Also there is a second projection based on my model where Brent oil prices (in 2019 $) gradually rise to $75/b by July 2030 and then remain at that level until 2040 and then decreases linearly to $30/bo (2019$) by Feb 2063. The second model (my best guess with a 50/50 probability output will be higher or lower than this estimate) is shown with red ” ” symbols.
The model reaches the Nov 2019 tight oil peak by Jan 2024, URR for the model is 92 Gb of US tight oil output from Jan 2000 to April 2053.
In the grand scheme, with perhaps 3000 to 3400 Gb of World URR for C plus C, 92 Gb is but a drop in the bucket.
Hi Dennis, perhaps we change the language here to make your model more realistic. For instance, instead of saying “gradually rise”, maybe “sporadically rise”, or “explosively rise”, or something. Because nothing about oil over the last two decades has shown any inclinations to gradually do anything at all. Just a thought…
Stephen Hren,
I focus on long term oil prices. The 36 month real Brent oil price in chart below with my scenario stitched on. I misremembered the price scenario, it rises to $80/b, holds there for 15 years or so then price decreases. Clearly the future scenario will be incorrect and I agree there will be volatility, one could imagine a sine wave superimposed on my scenario or just a random wave pattern that is impossible to predict.
SLR expires March 31st. Because the senate banking committee said so. This is a big deal that most are not aware of. I know Powell said that if markets or interest rates responded badly he’d step in. But he doesn’t have the authority to step in and reinstate the SLR.
The record margin debt that has been pumping the stock market and commodity prices is going to come down and more than likely come down in a disorderly fashion now that SLR expires. I closed out all long positions I had. Including oil.
Might not come crashing down all in a week or two. But the very thing that was ramping prices. The margin debt will go into contraction now.
Hi HHH, Any thoughts on the FEDs motivation here? Why would they voluntarily give this up?
Don’t think this was done voluntarily. Senator Elizabeth Warren & co wrote to the Fed to remind them that they are the ones making the laws and to end the SLR. Fed followed their orders.
https://www.zerohedge.com/markets/stocks-bopnds-tank-after-fed-lets-slr-relief-expire
I am trying to find if this SLR stuff is more “one size fits all” regulation.
The banks in my local area tend to already be over capitalized. After GFC, for several years they had to build up even more capital, even though they were not a systematic risk, and even though they were in solid shape, even during the worst of GFC.
So, the local banks cut dividends to shareholders, and built up more capital (which earned Rock Bottom returns during this extended period of financial repression). Finally, the past 2-3 years, the local banks could raise dividends again. This was good, as the local banks are almost 100% locally owned, and employees own a significant percentage of the stock in them.
So here we go again? Hope the Fed is more nuanced this time, but I doubt it. It will be the same with oil production, as I have beat to death the issue.
The Feds are kind of like the NCAA. Kentucky paid players so Eastern Kentucky gets put on harsh probation for buying a recruit a pizza.
And they wonder why rural America went off the rails on Trump.
“And they wonder why rural America went off the rails on Trump.”
Of course I wonder. The republicans have no better history of managing the central bank than do the democrats. Both organizations are made up primarily of amateurs whose greatest motivation is their own reelection.
But there is no excuse to move a democratic nation toward fascism.
I shouldn’t have put the last part in. No real reason to make it about Trump. Just the perception that he would lift regulations was my point. I could have left his name out and stated R’s just as easily.
My point is that regulations typically have favored the big over the small over time. This is especially true regarding big business v small business.
An example would be COVID restrictions. I am not going to argue about what should be done and shouldn’t. It has been such a difficult time.
But seems when there were a lot of restrictions, the largest thrived and the smallest went out of business or at least struggled.
No doubt regulations are needed, but it is difficult to make them “fair” in an ever changing world.
Acknowledged Shallow Sand.
Regulations, and other economic policies, no matter how well-intentioned or how poorly/well conceived, always end up creating winners and losers.
It comes with the territory of living in a big culture, I suppose.
By and large, I prefer gradual change rather than abrupt ones. It must be hellish making economic plans in an industry that has such a poorly functioning market system, with prices whipsawing all over the place. Not to mention changing regulations.
Most people have no idea how tough that must be.
Most people only know (or care) about a very small slice of the world.
Saudi Aramco to prioritize energy supply to China for 50 years, says CEO
“Experts from China National Petroleum Corp’s (CNPC) research institute have forecast that China’s oil demand will be capped at 730 million tonnes by around 2025 under Xi’s climate pledge.”
China around 2025 China will import 2 millions tons per day or 14.6 Mb/d. China imported 10.86 Mb/d last year. They will import close to an additional 4 Mb/d over the next 4 years or an additional 1 Mb/d/yr. Add in additional imports to India. Are problems looming?
https://economictimes.indiatimes.com/news/international/business/saudi-aramco-to-prioritise-energy-supply-to-china-for-50-years-says-ceo/articleshow/81618391.cms
Where is this extra 4 million barrels/day going to come from? Certainly not from Saudi Arabia.
Frugal, exactly my thought . I have a gut feeling that while all are watching oil production figures the world is missing out on the exportable surplus . Suddenly someday ELM (Export Land Model) will kick in and the world is going to faint . Maybe Dennis can do a round figure exercise of the exportable surplus and probable demand from importers in 2025 . A rough estimate would be sufficient , no need to go into decimal places .
Hole in head,
A problem with the export land model is that it typically assumes consumption growth by exporters is insensitive to the price of oil. As oil prices increase the opportunity cost of subsidizing cheap oil for the local population becomes high enough that better methods are employed to encourage efficient use of an expensive product.
It is impossible to predict either future oil prices or the consumption of oil at any particular oil price level. If oil prices are high there will be a greater level of substitution from electricity, natural gas, etc for oil.
I will leave it to others to make guesses about future oil consumption of exporters and importers of oil.
Frugal,
Output was 5.6 Mbo/d lower in 2020 than 2019. World output of C plus C will be about 10 Mb/d higher than 2020 (12 month average) by 2028. China will simply buy a larger share of total output as they continue to grow, OECD nations will transition to electric transport and reduce their crude use over time.
Dennis , my POV on both your posts . I agree regarding substitution but there are limits , maybe not geological and financial but also political . I say this in context of my earlier link where KSA says they want to reduce domestic consumption by 1mbpd . Can MBS take KSA back to 2009 without getting his head cut off ? I have already expressed my doubts about them achieving this goal with a constant increase in population . Basically what I am implying is that even if you did the exercise I requested , it would be futile , but thanks for your response ,
Regarding your reply to Frugal , I am in complete disagreement with your projection of a 10mbpd growth by 2028 . Decline rates ,depletion and rust do not rest . Of course as usual it ‘s the future and both of us have agreed to disagree . Only time will tell .
P.S : Jeffery Brown if you are lurking around ,maybe you can assist .
Hole in Head,
I stand by my estimate, in 2020 World C plus C output dropped by 5.5 Mbo/d due to a lack of oil demand and the resulting drop in oil prices from the 2019 annual average, so a 10 Mbo/d increase from the 2020 level (annual average) of C plus C output requires a return to the 2019 average level (roughly 82.3 Mb/d) requiring a 5.6 Mbo/d increase and then a further 4.4 Mbo/d increase in output to reach 87 Mbo/d.
If World demand for C plus C warrants such an increase by 2028, I believe it can be produced, and yes the model accounts for depletion, which has been ongoing since the first barrel of oil was produced. The basis for the estimate is likely World resources of 3400 Gb of C plus C (this includes the 1428 Gb of crude plus condensate that was produced from 1860 to 2020), remaining resources (this includes conventional and unconventional C plus C) are about 1972 Gb (this includes future discoveries and reserve growth).
It is possible less will be produced due to lack of demand, if a rapid transition to non-fossil fuel energy sources occurs, I hope that is the case, but I am skeptical.
Dennis, I do not concur with you . I think the 5.5 mbpd is high . Most of the producers are producing all out . Iran is selling all it can in spite of sanctions . They have done it for over 40 years . Reminds me of the term that was used in Wall Street ” cash on the sidelines ” . Not used anymore because an investment banker exposed that all funds are in the market , maybe are not in the stock market but in the bond market, currency market or commodities market . Even surplus cash held by MNC’s in tax havens is deployed in the treasury market which is recycled via the banks . The talk of ” cash on sidelines ” was over . The same with spare capacity . Agree there is a slack but that is more due to geopolitical reasons like Libya , Nigeria etc but there will be trouble spots always around the world . My view is that the max surplus that is currently voluntarily + involuntarily offline is between 1 or 2 mbpd ,no more .You mention you have taken depletion rates into your calculation . What matters is decline rates . Further we cannot ignore that there has been no CAPEX in the oil industry since the last 5 years and all producers are cutting CAPEX in their future guidance . Nothing new in the pipeline . The 4 mbpd will have to come from existing resources . Future demand will be high or low I can only guess just as you do though I am skewed to low demand as the world becomes poorer due to affordability . A bidding war for the barrels would be interesting . Let the battle begin . 🙂
World 2020 average C+C production, through November, was 6.173 million barrels per day below 2019 levels. Hopefully, the December numbers will be out today. They are late already.
82,331 Average 2019 Daily C+C Production
76,158 Average 2020 Daily C+C Production (11 months, January through November)
-6,173 Difference
Oil Shock Model
click on chart for larger view.
These 4Mb/d will not come from supplementary extraction. It will come from usual oil suppliers of OECD countries who will choose to supply Chine instead of OECD countries as long China will be able to pay them more than the OECD countries.
Ron, your figure of 6.1 mbpd . If average 2019 was 82,3 mpd and we apply a 5% decline rate it would be about 78mbpd anyway in 2020 . Is my reasoning correct ?
That is correct. It would be 78.185 million barrels per day. But the average production rate, through November, was over 2 million barrels per day lower. It was 76.158 million barrels per day. That is a decline of 7.5% year over year.
Hey, the December 2020 data is just out. Production in December was up by 797,000 barrels per day to 75.936 million bpd. However, the average was little changed. The decline from 2019 is still 7.5%.
If they really need an extra 1 Mbpd in China each year, they can get it from Iran.
The ability of the USA (and EU) to withhold Iranian oil from buyers like China and India will only last so long.
Comes down to how strongly they really want/need that oil.
I imagine a conversation behind the scenes to be something like- “we will postpone taking Taiwan and encourage Iran to go slow on their nuclear program, in return you stand down and quietly watch while we purchase the oil we need from Iran”
Frac spread count is up to 195 as of March 19, this is the highest level since April 3, 2020 when the frac spread count was 215, the low point in 2020 was 45 in May 2020 (for two consecutive weeks). The Arctic event in February dropped the frac spread count to 41 for the week ending February 19, 2021, it bounced back to 165 two weeks later (week ending March 5, 2021).
https://www.aogr.com/web-exclusives/us-frac-spread-count/2021
Yes Dennis , but 195 is not 215 . Downhill all the way .
Hole in head,
Over 10 months the frac spread count has increased from 45 to 195 an average increase of about 15 per month, should the trend continue we will be at 330 frac spreads in 9 months which is close to the level of February 2020 when we were near peak tight oil output. The trend is mostly up for frac spreads since May 15, 2020.
“Let me begin with the obvious: e-mobility has won the race. It is the only solution to reduce mobility emissions fast.”
Herbert Diess, CEO of Volkswagen AG
“There is no way there’s enough raw materials being produced right now to start replacing millions of gasoline-powered motor vehicles with EVs.”
Lewis Black, CEO of tungsten miner Almonty Industries
Hightrekker
Those comments reflect the remarks I have seen from both Toyota and Mazda.
A while back I read where both companies think that the ideal vehicle is one that has between 100 to 120 miles range on battery and gasoline backup for going further. It’s a combination of material availability, lithium, cobalt, copper, etc., battery cost, and affordability the companies noted. A few days ago Porsche announced they were going all electric by, I think, 2030. A closer look at the details revealed they were mostly hybrids. The headline though was “All Electric”.
They also said don’t expect an EV version of its iconic 911 sports car anytime soon, if ever.
Well, I understand well the last words but in an other way, some will not have an other solution, especially in Europe, than electric vehicles as the consumption of oil of some will reduce the availibility of oil for others. That’s also necessary to reduce our emissions of carbon dioxide : in Europe, we are not very pleased with the flash floods, the droughts or the heat waves occuring randomly. Of course, I guess that electricity produced by coal or gas plants is not very good at reducing our carbon dioxide emissions. It’s probable that some researches have to be carried out in the direction of the biological production of hydrogen by tinkered microorganisms and of biological production of hydrocarbons by tinkered microorganisms. Efforts have to be also made to investigate the field of nuclear fusion, especially room temperature one as it is done (?) by NASA currently.
There’s a possibility to convert nat gas into hydrogen by using pyrolisis. You loose round about half of the energy, but can dump the carbon into an old mine and have C02 free hydrogen in great quantity very fast.
It’s not considered by green envirimentalists here because fossil fuels are evil.
CO2 free new tech I see only in advanced nuclear tech (Russians and Chinese), perhaps even Thorium reactors(China). And nuclear fusion, both the west and China are building prototype reactors at the moment.
That’s why we need bridge technology – and we have nat gas, so why not use it.
Room temperatur fusion I only believe if there are certified scientific publications. Even a small hint that it could work will bring you a nobel price I think. High temperatur fusion works – as I said they are developing it into commercial scale now.
>> Carbon Capture Will Make Fossil-Sourced Hydrogen 2.5–9× More Expensive <<
https://cleantechnica.com/2021/03/23/carbon-capture-will-make-fossil-sourced-hydrogen-2-5-9x-more-expensive/
The method I described isn’t getting CO2 and storing this underground, but direct C. It’s relative new.
And yes, it’s more expensive than burning the pure gas. That’s why it’s a bridge technology – when burning the pure gas get more and more expensive with C02 tax.
World production of natural gas will peak during the 2030s. Outside Russia, the historical suppliers of Europe, Norway, UK and Algeria, are beyond their respective peaks of gas production. That’s a dead end. And we have not the desire to become more dependent of Russia gas supply, with the exception of Angela Merkel. Hydrogen nuclear production is still a concept because it requires high temperatures reactors, which are not in service by now or are still in development. https://www.neimagazine.com/features/featuredesigns-heat-up-in-asia-8115964/ About new nuclear fission technologies, as far as I know, MSFR are still in limbo. There are MSFR projects but they have not been inplemented by now. https://progresnucleaire.org/projets-dans-le-monde/ About room temperature fusion, that’s still in the first stage of preliminary studies : https://www1.grc.nasa.gov/space/science/lattice-confinement-fusion/
JFF , I keep out of the topics that are being discussed in this thread because they are based on “hopium ” . All is , this is technically possible and that is technically possible . All solutions offered are like the horizon ,always seen but never reached . No thought given to transition time ,costs ,politics and dangers involved . I jumped in only because of your line “And we have not the desire to become more dependent of Russia gas supply, ” . Well sir ,you have no choice . The alternative is either freezing or buying a lot of blankets from Mr Xi Ping .Make your choice ,not so very difficult . Be nice to Mr Putin . 🙂 . Be well for the moment spring and summer are close .
Of course, we have a choice. We have no desire to be puppets of a regime which assassinates people because they don’t agree with the president. Neither we want to be dependent of China, just because blind leaders decided that it was profitable to make socks in China and to carry them in Europe. Anyway, even the liberal care bears of European Commission did discover the unappropriateness to be dependent from external suppliers for strategic components such as semiconductors or batteries and decided that it was necessary to implant in Europe the domestic production of various items and minerals.
Natural gas has in the last few decades been thought of as being a transitory cushion towards a less carbon reliant society (look at Vaclav Smil’s books on the subject). There is nothing escaping the fact that we are past the peak of energy per capita in a lot of countries with some exceptions. Natural gas peak being about 15 years after “peak oil” (whatever the definition) sounds about right.
A lot of people and especially older people will be content with just ok nutrition and a place to stay, if western societies are declining. For some people less energy per capita is unbearable.
By mid 2020s fleet vehicles and others that reliably go 120 miles/day or less will begin switching to zinc air and other li ion alternatives. Multiple second tier technologies exist for long lasting reliable EV batteries. Only high end passenger cars will have li ion
https://www.powermag.com/zinc-ion-batteries-are-a-scalable-alternative-to-lithium-ion/
I don’t know if I am the right one to comment. A friend of mine said that than anyone with less than 10 publications as a Phd in a field in his opinion didn’t know anything.
But what I can say is that “enviromental mining” is very costly in terms of energy usage and safety. So the question is more; can batteries be recycled and the main metals be used again. And it can, but use much energy in the process. So that is the way forward then, given that an electric car “can” use 1/3 of the energy in the right circumstances compared to a fossil fuel car. My big point – offshore wind power to power electric cars; the best way forward for who knows how long.
A new thread Non-OPEC Oil Production has been posted
http://peakoilbarrel.com/december-non-opec-oil-output-continues-rebound-from-may-low/
A new open thread Non-Petroleum has been posted
http://peakoilbarrel.com/open-thread-non-petroleum-march-24-2021/