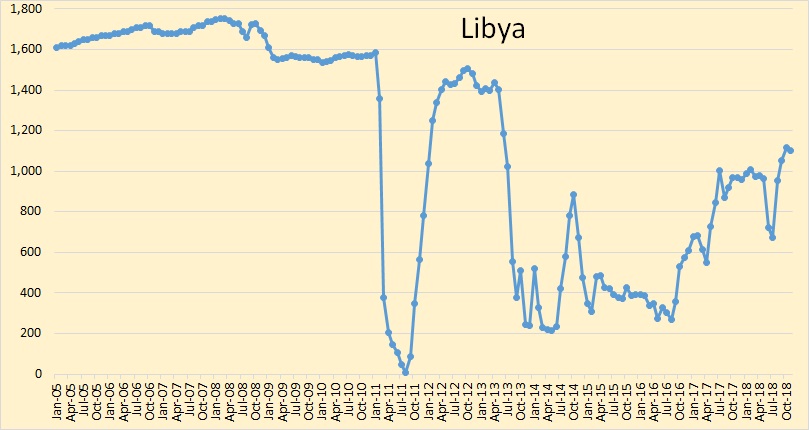
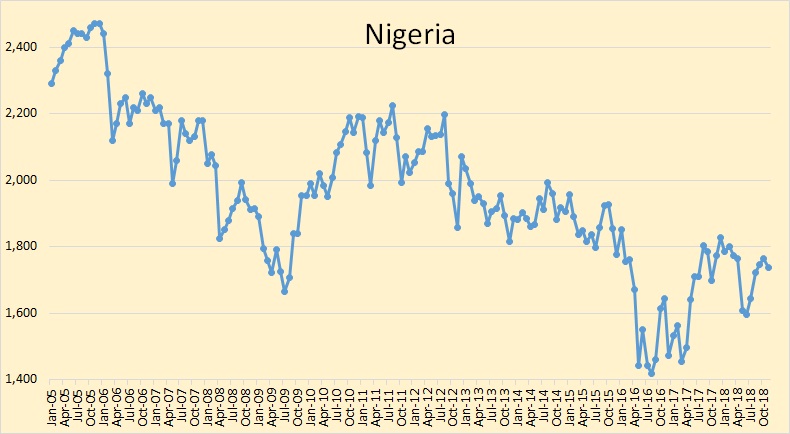
All the below OPEC data is from the latest OPEC Monthly Oil Market Report. The data is in thousand barrels per day and is through November 2018.
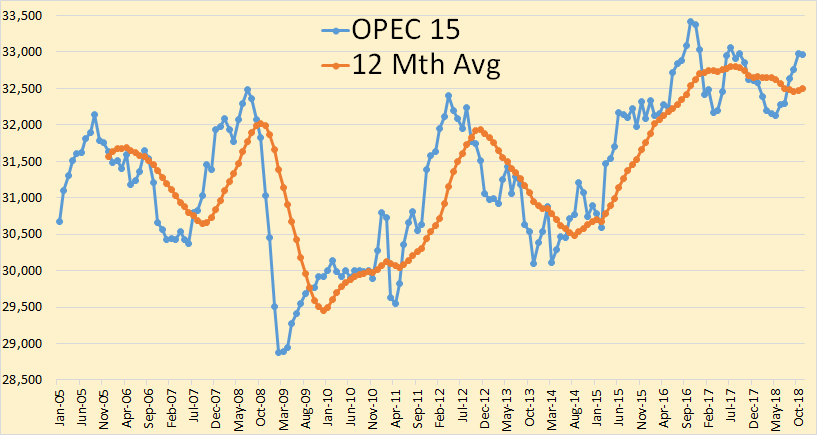
OPEC 15 was down 11,000 barrels per day in November but that was after October production was revised upward by 67,000 bpd.
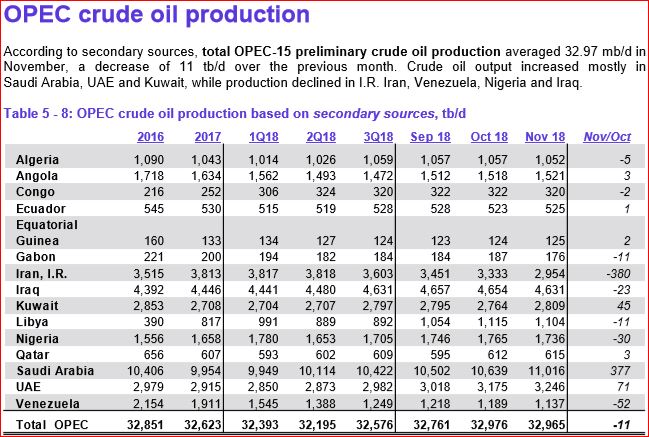
OPEC production was 32,965,000 barrels per day in November. The revised October numbers, 32,976,000 was an all time high.
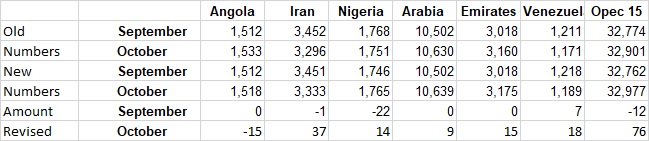
Above are the major revisions. All other revisions were in the low single digits.
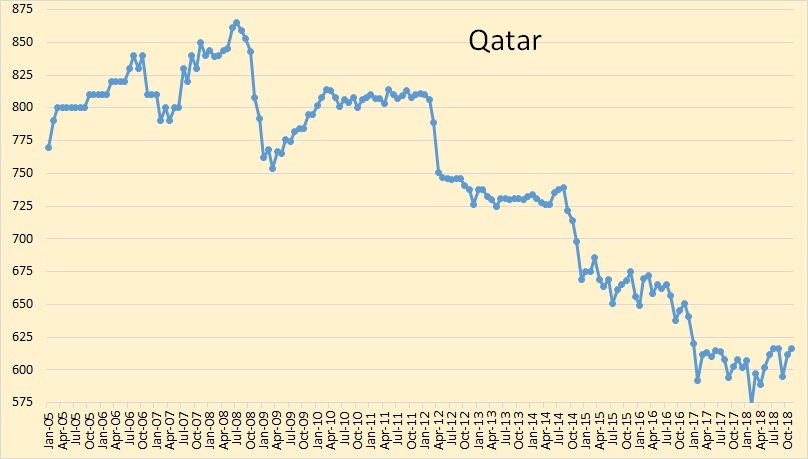
Qatar will be leaving OPEC at the end of the year.
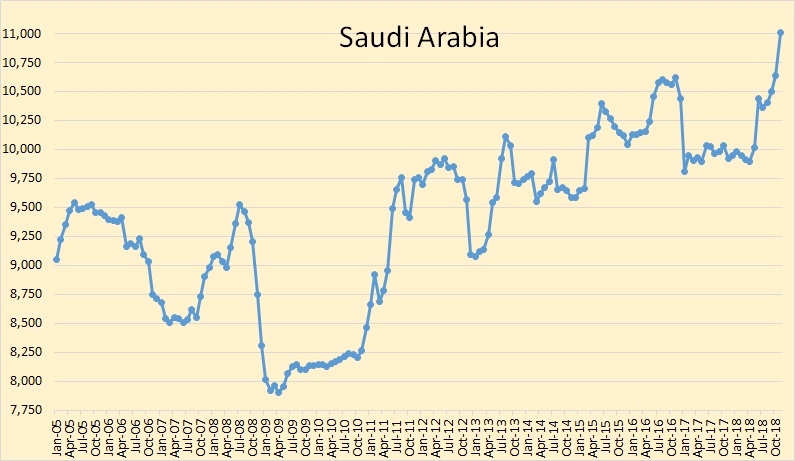
Saudi Arabia reached an all-time high of 11,016,000 barrels per day in November. They are positioning for cuts beginning in January.
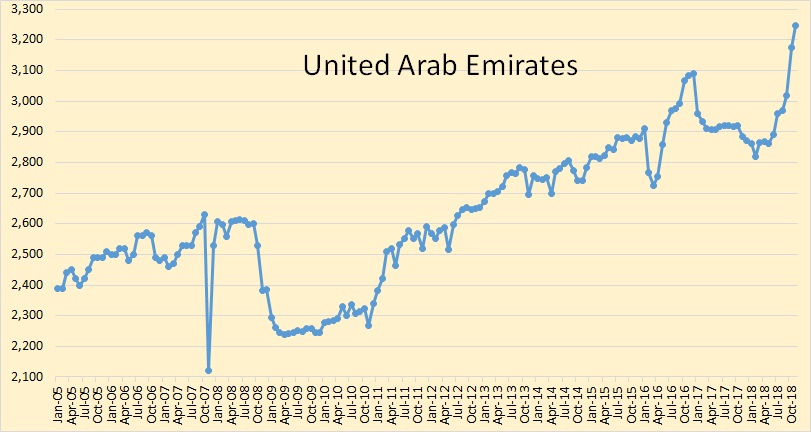
The UAE also reached a new all time high in November.
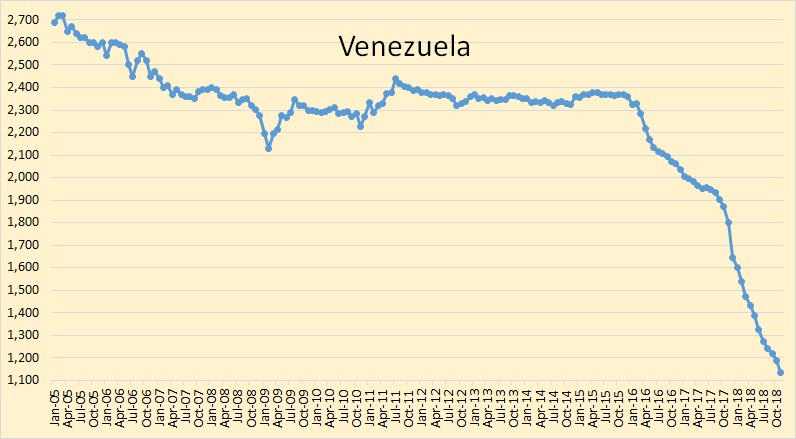
And the Venezuelan decline continues. When will they drop below one million bpd? May?
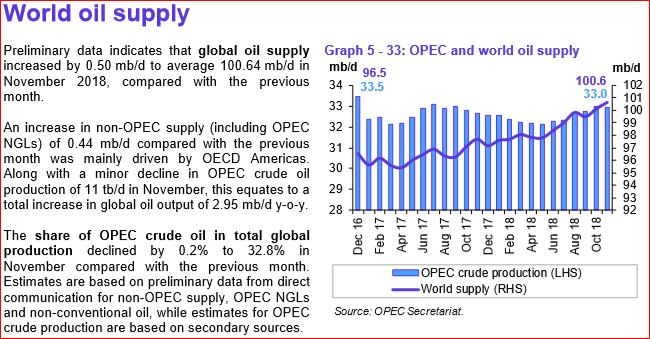
World oil supply, (total liquids), has finally topped 100 million barrels per day according to the OPEC Secretariat.
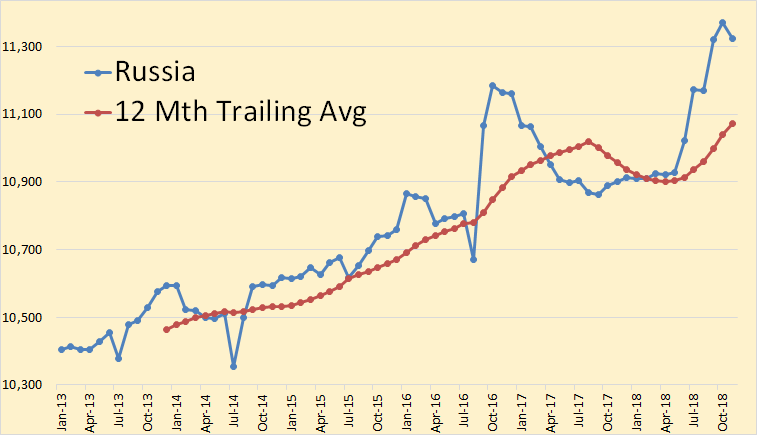
If Russia does cut 400,000 bpd, they will be right back to where they from May 2017 through May 2018. The Russian data is through November 2018.
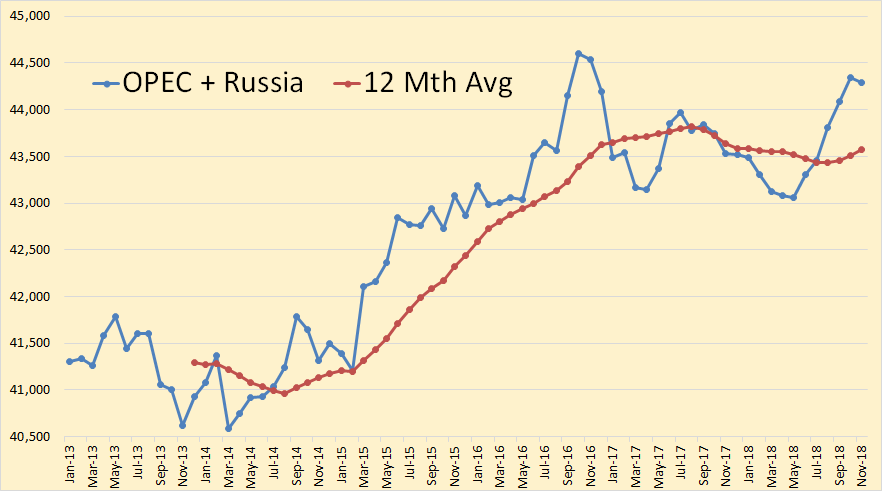
OPEC + Russia peaked, so far, in 2016. The 12 month average peaked in 2917.
World oil production outside the USA has very likely already peaked. The data for the two charts below is through August 2108.
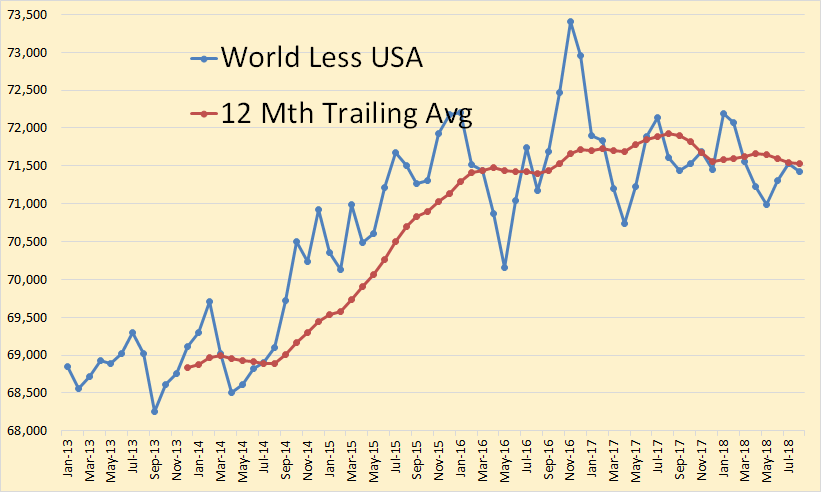
World less USA peaked, so far, in 2016 while the 12 month average peaked in 2017.
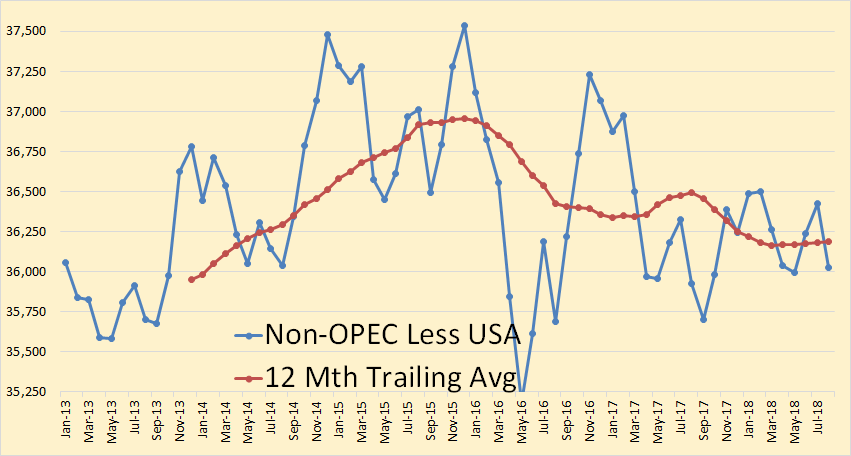
And it is far more likely that Non-OPEC less USA peaked in 2015. Even the recent increase from Russia will make little difference. Monthly production is down 1,511,000 bpd from the peak while the 12 month average is down 765,000 bpd from the peak.
The future of US Shale Oil Production
USA conventional oil peaked in 1970. It is US shale oil that keeping peak crude oil at bay.
The data I use below is from the EIA’s Drilling Productivity Report. Their data is always projected a few months ahead but their historical data is accurate. Well it differes in a few percentage points from the data issued by the EIA’ Monthly Report. Example below:
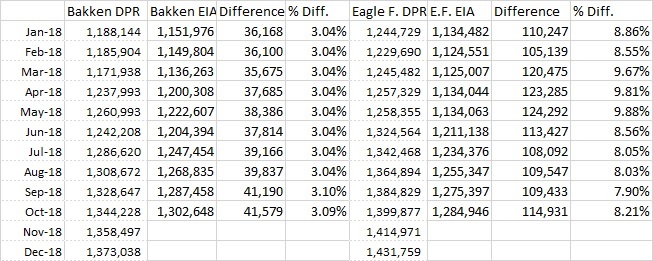
Notice that the DPR Bakken data, through August, is always exactly 3.04% higher than their Monthly Report. Their Eagle Ford data DPR averages about 8.5% higher. I think the difference is the DPR includes all oil in the basin, conventional + shale. However, below I use the Drilling Productivity Report data because they give the monthly decline rate while the Monthly Report does not.
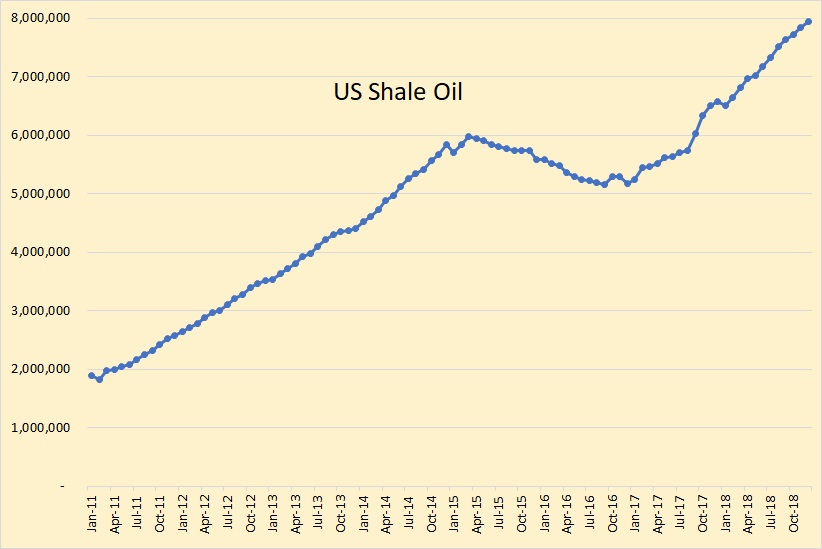
The above data is from the EIA’s Drilling Productivity Report and is through December 2018. Obviously the last few months are estimates. It is for all shale basins and is in barrels per day.
Definition: Legacy Decline. The total decline in production of all wells other than new wells drilled this month, or the last month in which data is posted.
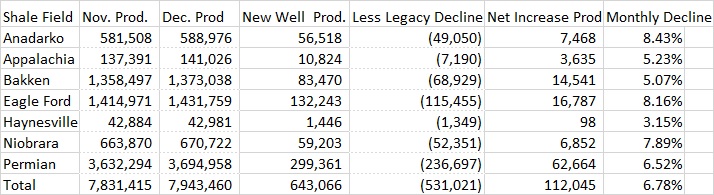
This is the decline rate the EIA is predicting for December 2018. The decline rate for total shale production is 6.78%. This is even more alarming when one considers that the DPR also includes all conventional oil in these basins.
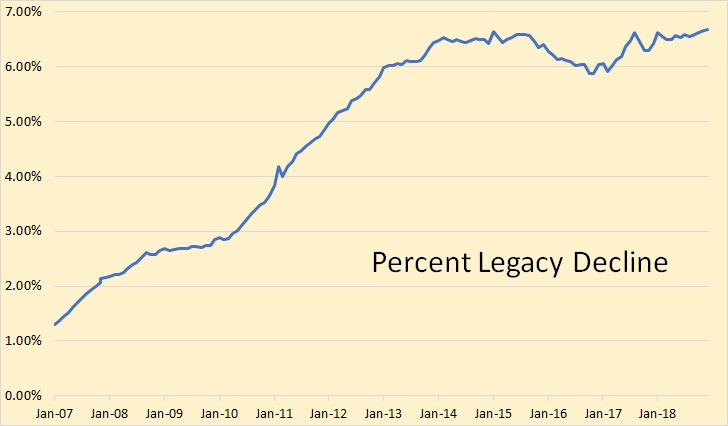
The percentage decline rate increased as production increased but seemed to top out at about 6.5 percent per month.
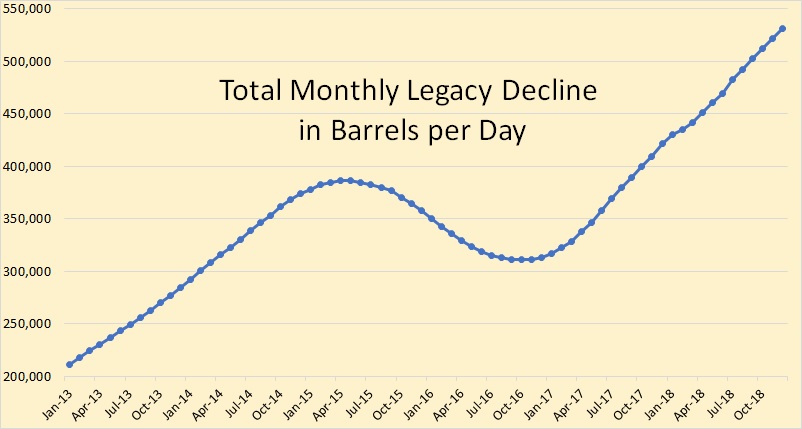
Since legacy decline is holding at about 6.5 percent, then the more oil produced means more decline in production. Currently, legacy decline is just above 500,000 barrels per month. This means that if production is to be increased by 100,000 barrels per month then new wells must produce 600,000 barrels per month of new oil.
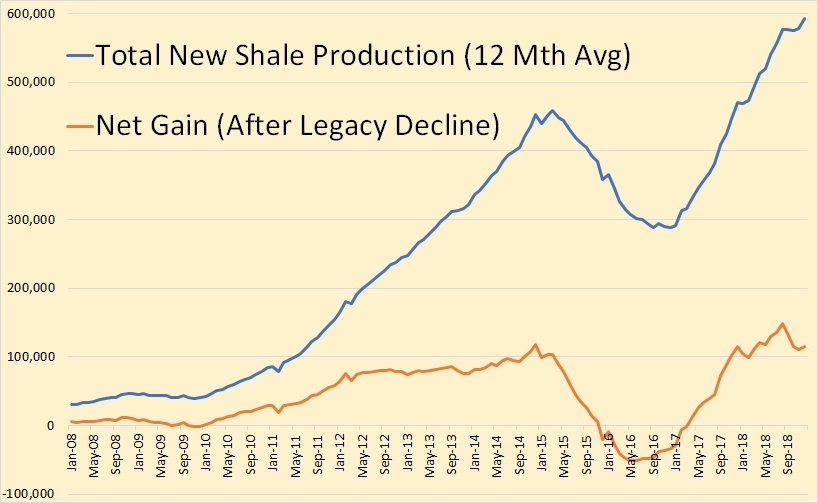
The above blue line is production per month for all new wells, averaged for 12 months. The red line is total net increase in US shale production per month, also averaged for 12 months.
The more shale production is increased, the more production must be increased just to stay in the same place. Though there may be new oil produced in shale basins for two or more decades, I don’t think new well production can stay ahead of legacy decline for more than a couple of years.
Good post Ron, thanks.
I think that is a good analysis. Too bad we have to rely on EIA data. Unfortunately, it’s the only game in town. For most people. I personally think shale will be mostly flat from Sept 2018 to the fourth quarter of 2019. Per RRC data, and Schlumberger. I don’t think the sticking point is currently the pipelines in the Permian. It is how much that can be loaded on ships. We had a 350k bpd pipeline added the first of Nov. to Cushing. Production has not increased from what I can tell, but discounts are way down. My additional source of information is reading articles from the Midland newspaper. It’s the only one that covers the small producer, and basically the main news is the oil in the Permian. And decline rates can get higher. Spot on about increasing activity to increase production. Treadmill has a steep incline.
Saudi Arabia keeps on surprising. Maybe they have some sort of wormhole connected to an all oil planet.
Aren’t they releasing barrels from storage to pad their numbers though?
Sshhhh! You could wind up as part of a nitate experiment in some embassy flowerbed.
If they cut in December or January, you might be right
6.7% per month? 80.4%/yr? This seems high for decline. There is enough age on some of those wells that the plunge should have started to level.
Seems really hard to believe that a cessation of drilling would take output down 80% in one year. OTOH if that was 6.7%/year, that seems low for so many shale wells vs conventional in the total.
It’s “only” 58% decline per year – you have to calculate it exponential, not additive.
It does level off some when it approximates stripper status. And E is correct, the annual rate per well is much higher than 6%.
It averages about 6.5% and the percentage drops off as decline sets in. The percentage dropped to 6% in late 2015. It would have continue to drop if production had continued to drop. The highest decline is from wells less than one year old. Older wells have a much lower decline rate.
Mine decrease at over 60% a year with over a three year history of seven wells on six different 640 acre lease areas, and they do better than most in my county, but whatever, EIA is the yin and the yang. If you bother to pull various production reports by lease, you may change your mind. But, you have to consider new wells they add to the lease area. Historically, it starts to level off at around 3k a month. Of course, that’s off the RRC site, so it has to be suspect when compared to EIA “data”, that reportedly gets their data from drilling info, who gets their data from RRC.
I use data from shaleprofile, which gets its data from RRC. Take the well profiles vs number of wells completed per month and the model matches output data pretty well. Completions would need to fall to under 280 for output to be flat.
Don’t look now, but production is down a little with over 480 completions.
Guym,
Not based on the data from shaleprofile, not sure you have Permian Basin tight oil data. It is possible conventional production is down, also you have suggested in the past the completion data is not very accurate. According to shaleprofile there were 332 Permian completions in August 2018, in June there were 394 completions. That data might also not be completely accurate, it seems to be revised over time as RRC data is updated. July was 349 completions.
My understanding is that your September estimate is preliminary, In August completions were pretty low, but my guess is that you don’t have Permian horizontal well output data.
Enno Peters uses RRC data, and he shows Permian output increased in August.
See https://shaleprofile.com/2018/12/04/permian-update-through-august-2018/
Horse patootie. RRC data does not show it increased. I seem to be a minority of one on this blog, who does not think Texas production is increasing. That is if you don’t count RRC or Schlumberger. On the other hand, that seems good enough company.
From a post by EN on 12/4/2018
https://pbs.twimg.com/media/Dtma6J1XQAAG2cl.jpg
A post from the last thread that is an update on Schlumberger by kohl
http://investorcenter.slb.com/phoenix.zhtml?c=97513&p=irol-presentations
In it, he sees completions start to flatten in the third quarter, and decline in the fourth, showing up as reduced production in the first half of 2019. I have production down for Sept, but on an average, I believe it will be close to flat Aug through Dec.
Look at shaleprofile.com. I was talking about Permian basin not all of Texas.
If you don’t believe Enno Peters, fine.
I think his data is great, the best by far and directly from RRC.
Schlumberger is predicting decreased activity as in completions. That is what shaleprofile shows. The point is that through August Permian output is up even though completions are down. Just look at shaleprofile.
As to output decreasing, or flat in 2019, in the Permian I will have to see it before believing. The data for well profiles and completion data suggests Permian completions will need to decrease quite a bit before we see flat output. To about 280 new wells per month in the Permian basin.
Chart below shows my model compared to data for Permian basin, I am pretty confident in the model, but future completions are unknown. The model is through August 2018, completions 394 in model (done before I had Enno’s data which often is revised up later). Click on chart for larger view.
Enno’s work is good, Texas did not increase in August, maybe the Permian did. As for seeing before you believe, that’s not unusual, actually pretty normal. I feel the same way, but I give a little more weight to Schlumberger expectations than yours. I’m sure you can understand that.
Guym,
Fair enough. I interpreted Schlumberger differently than you. They said the falling activity level will show up in the first half production for 2019. You interpret that as a decrease in production, but it could also mean a decrease in the rate of increase from 2018. We will have to wait to see if your interpretation is correct. (He did not say “reduced” production, he said it would “show up” in first half 2019 production numbers. We interpret “show up” differently, you see reduced I see a slower increase, not clear from the presentation.
Chart below shows a model (new wells on right axis) which shows why I think output is not likely to decrease and even flat output seems unlikely (though I forced the model to flat output by dropping completions in 2019). Click on chart for larger view.
You seem to think that shale wells can remain at the same completion rate and not decline. I can’t argue with someone who believes the world is flat. If the completion rate goes down, production follows. Hence, there is no mystery of what the guy at Schlumberger was saying.
I really see production Aug 2018 to Sept 2019 as close to flat. My concept of flat over that long of a period would be Plus or Minus 300k bpd, allowing for other production. Permian will probably not drop, overall. But, that’s just a guess, and I am usually wrong.
Guy,
At some completion rate output falls. The model demonstrates that the completion rate needs to fall to under 300 wells completed per month for output to be flat in Permian basin. If oil prices remain at 50 to 60 per barrel it is possible output will be flat in Permian.
I am highly skeptical that oil prices will be at current levels in May 2019, more likely is 70 to 80 per barrel.
I never get oil prices right, but your guess on prices might be similar, if so we can’t both be wrong. 😉
Guym,
I believe the Earth is not a perfect sphere. Do you agree that the Schlumberger presentation does not say output will be “reduced”?
I tweeked the previous scenario to match what you think will happen. Time scale changed to end in 2025. Notice that output was increasing in 2017 when the completion rate averaged around 175 new wells per month. Currently around 290 to 300 wells per month must be completed to maintain flat output, if well completions slowly increase to 500 new wells per month (see chart) and then remain at that level for until 2045, output will eventually peak in 2033 at about 5500 kb/d. Chart can be enlarged by clicking on it.
Guym
One final comment on Permian basin output.
From June to August the well completion rate fell from 395 to 325 for Permian basin horizontal oil well completions while output increased. At some point completions might fall to the critical level where output decreases, currently that level is about 285 horizontal oil well completions based on the data from shaleprofile which is gathered from the RRC and New Mexico.
This assumes the average well profile is unchanged from the average 2017 Permian well.
As I mentioned in 2014, it’s better to drill but leave wells uncompleted until prices rise again.
Fernando,
Thanks. Yes probably best not to complete many wells when prices are too low, many tight oil operators don’t seem to follow the advice of their petroleum engineers (I am assuming your advice would be standard petroleum engineering practice).
So the legacy decline rate is reported as 6.x% per month for month 1 of wells. Odd.
Odd way to report. Surprised it’s not the legacy decline for the whole field averaged, which would include wells beyond 1 month age. Been looking at these steep curves for years, and how they flatten out over time, but never really thought about how they quote legacy decline.
Wait a minute, that doesn’t make sense. Gonna have to hunt down the definition of legacy decline as they calculate it.
And did:
“How should the legacy decline rates be interpreted? How can they be translated into well-decline curves or decline rates?
The legacy production change is the change in total regional production from one month to the next, excluding production coming from newly drilled wells. Production from a well typically declines over time, as pressure from the formation around the wellbore is depleted. In the absence of new wells being drilled, the group of all existing wells in a region will decline in production from one month to the next. As such, the DPR separates the wells in a region into groups of newly drilled wells and existing, or legacy, wells, measuring the production levels separately. Each month, the group of newly drilled wells from the prior month is moved into the group of legacy wells, and a new group of newly drilled wells is measured. It is important to note that as the number of wells moving into the legacy group increases, the legacy production change tends to become more negative; i.e., greater total production declines from month to month. This method does not translate directly to what many people traditionally consider well decline curves or decline rates.”
That says they add new production from wells that become legacy wells each month because they were new the previous month. So this legacy decline rate always has 1 month old well production being added to the total and that will lessen the decline rate reported. It is really a NET decline rate of the field, given new(ish) production added, rather than an average of the declines of all wells of the field.
So the legacy decline rate is reported as 6.x% per month for month 1 of wells. Odd.
No, I never said anything like that. The overall decline rate is 6+% decline rate. The newer wells have a higher decline rate and the older wells have a lower decline rate. Therefore the decline rate declines when there are fewer new wells or less production from new wells.
The legacy decline rate is the total decline rate. It is just that the decline rate of new wells cannot be measured because their initial production is what is produced the first month. Their decline rate cannot be measured until you know their initial production.
There is nothing strange about the term “legacy decline”. It is just the difference between new well production and total production. If new well production was half a million barrels per day that month, but total production only went up 100K barrels that month, then legacy decline was 400k that month.
It is really that simple. Don’t try to make it difficult.
No, read their definition. It’s not simple. They are not averaging the decline rate of all wells.
They are computing additive production and adding additional wells’ production each month as those wells become older than 1 month — and comparing to previous.
It somewhat says wells younger than 1 month are what is growing overall production.
No, read their definition.
Got a link for that definition? The definition up top is my definition. I apologize if it is confusing.
It’s not simple. They are not averaging the decline rate of all wells.
They are not averaging anything. They just measuring total production for a field. Subtracting that number from last months total production gives you total monthly increase, or decrease. Then if they have total new well production, just subtract total increase, or decrease, in monthly production from total new well production, that will give you legacy decline.
All I did was reverse that process. I added total increase to legacy decline, (as a positive number), that gave me total new well production.
Guys.
Go look at shaleprofile.com.
Huge amount of total output is from 2017-18 wells.
At $269 per month, I really can’t afford it.
Ron,
There is a free part.
https://shaleprofile.com/blog/
Ron.
The free part is pretty good IMO.
shallow sand,
Agree 100% Enno Peters blog at
http://www.shaleprofile.com is the best site for tight oil data I have seen by far.
Possibly the only thing that Mike Shellman and I would agree on 🙂
Dennis, I don’t often get a chance to agree or disagree with you on oily matters because you are always trying to interject “science” and statistical analysis bullshit into everything. EVERYTHING! Life is not like that, and neither is the oil business. I think you might be mule-lipped to know how few people give a rats ass what you THINK is going to happen 35 years from now and how tired everyone gets of hearing the same ‘ol crap all the time about TRR and how rising oil prices are going help your models come true. About oil economics, you know nothing. Sorry; you’ll get over it.
And here is the deal about the oil and gas business that you don’t know, and can never understand, nor would I expect you to understand: to have relevance IN it involves a long, slow process of listening and keeping your mouth shut. Of learning. You find your place in it the old fashion way…you EARN it. I am old school; I have broken bones, put good men in body bags, have cracks in my face and blisters on my hands, been on the verge of living under a bridge but always found a way because, in part, I learned from others who knew more than I did. I listened. I never had the audacity to argue with people who knew more than I did until I had the experience to argue with them. Sitting at the computer all day don’t get it done.
Its not just you, Dennis; the internet is full of limp-dick oil analysts right now and everybody can’t wait to prove to others how smart they are about things they don’t even understand. Never even SEEN before, much less understand. I like people who…work. With their hands. And their own money.
Other than that, you seem like a nice fella, I love Maine (nice brookies there, but way too many black flies) and I never allow politics to interfere in my judgment of others, like most people do. Its a miserable way to live to hate and be angry all the time…over political idealism, or allowing one human being, Trump, for instance, to take root in your soul so deeply you cannot think of anything else in life other than hating him. He’s an idiot; my advise to life’s whiners is out smart the son of a bitch, then get off the internet and mow the grass.
Its your blog, carry on.
Mike,
Much of what I do I have learned by listening to you, interesting lecture.
I have worked as a pool builder, roofer, carpenter, and millwright.
So despite what you think you know about me, you don’t know me at all. Most of my injuries have occurred playing sports, aside from one vehicle accident.
I appreciate learning from you, but feel free to ignore anything I have to say.
Interesting that you didn’t even agree with me about Enno’s blog, sorry you feel that way.
Dennis.
I think the frustration of a small business oil producer should be obvious.
My family and I have pretty much decided producing oil in the US is not a real business anymore. How can one have a real business when there are so many fixed costs, that do not change much, with the price of the product sold moving up and down like a yo-yo? Add to that at least 50% of the voting public thinking what you are doing is evil. It is now much more preferred that one grow harvest and sell cannabis so people can get high, rather than produce oil for gasoline, diesel, plastics and the numerous other daily used consumer products.
You have done a lot of construction work, so I am sure you know the feeling when there is a recession and work drops way off. At least you might get some sympathy in that situation. Farmers get a government payment. Oil people get laughed at.
We basically lost $20 a barrel in the blink of an eye. In our case, that is over $100K per month of income loss. This after 2015-17, where the price was less than half what it had been 2011-14.
Take the family out here that is living on 20 BOPD, doing all the work themselves. Selling 600 BO per month. That family just saw a $12,000 hit to the top line. The expenses didn’t change except for fuel, which has fallen some. Probably less than $1,000 per month savings there.
Imagine what would happen if the boss walked into the tech campus of a firm in Silicon Valley and said everyone was taking a $12,000 per month pay cut immediately. Would be a lot of knashing of teeth.
Now imagine the pay cut was pretty much in conjunction with an erratic President, supported almost 100% by the industry, ironically, who erroneously thinks .30 a gallon lower gasoline prices will be a boon to the US economy. With the alternative being a party openly hostile to the industry, who cannot differentiate between small business owners with small footprints and corporate titans who make no money on the product, but make billions off the corporate largess. We are all terrible polluters who need to get hit with a carbon tax and made to jump through environmental testing hoops despite we are emitting less than the tiny amounts of methane we were emitting 30 years ago.
It is incredibly frustrating.
Shallow. Thanks for explaining how it looks from where you stand.
As much as I hate to think this way, it raises the idea that the government should have a price stability mechanism in place that shields producers from the volatility of the dysfunctional market. Maybe gets updated every 6 months depending on market conditions or something like that. I’m sure everyone would hate it.
Maybe the government should even have a longrange an energy policy. Like a ten yr plan. I know…crazy thinking.
Shallow sand,
I was just re-reading Mik’e comment, I would have to shovel the snow off my lawn, before mowing. 🙂
I have not worked in construction very much since I was a young man, some carpentry work helping out a friend whose partner was injured for a half a year when I older.
In any case, I feel for you guys and am hoping for higher oil prices. At low oil prices tight oil will not do well, nor will oil sands, or deep water offshore.
Not sure what can be done about the volatility. I simply think a carbon tax makes sense so we transition to alternatives because oil output is likely to peak by 2025, perhaps 2030, if USGS mean estimates are correct and oil prices rise as I assume.
Note that an oil price scenario between the AEO 2018 low oil price case and reference oil price case (average of the two scenarios) would mean that at current well cost, the Permian Basin would never become profitable. This is what Mike Shellman has been saying all along.
I would comment that neither he nor I know what the future oil price will be.
Just as I do not know it will be high, he does not know that it will be low.
The future is unknown. On that perhaps you would agree.
That’s why I often present several scenarios. Below are scenarios I use for Oil Prices, the med/low scenario results in failure for the Permian basin (if it were a business it would be bankrupt under that oil price scenario), for the medium oil price scenario or higher it succeeds if well cost remains 9.5 million per well in 2017$.
Click on chart to make it bigger.
Shallow sand,
Seems strange to me for someone to lash out at me because oil prices have fallen. Does it seem that I am cheering for lower oil prices?
I think I have been pretty consistent in my expectation that oil prices will increase at some point and in fact what I think would be best to bring about a gradual transition to other forms of energy as fossil fuel gradually depletes.
I also have been consistently wrong about oil prices going up, but clearly I have no control over oil prices.
I have nothing against oil producers and have never intentionally said anything to disparage oil producers, especially smaller companies. I don’t particularly like the fact that Exxon-Mobil tried to mislead the public about climate change, much like Tobacco companies with the dangers of cigarette smoking.
Small oil producers had nothing to do with that in my view.
Despite what Mike believes I have a pretty good handle on oil production economics thanks to the work of Rune Likvern and comments by you, Mike Shellman, Fernando Leanme and others.
I do a discounted cash flow analysis for net revenue over the life of the well, those wells with a positive discounted cash flow over there operating life are assumed to be completed. I use the AEO reference case for my price deck and use constant dollars for the analysis and a “real” annual discount rate of 7%, which is the same as a 10% nominal annual discount rate at a 3% annual rate of inflation. This is standard economic analysis that I am sure you and Mike are familiar with. Mike has complained that I use constant dollars, doing the analysis in nominal terms changes nothing, I just prefer constant dollars, it is the way economists are trained to think.
Mike – You take great pains to always tell us how much experience you have, but as far as I can tell you haven’t got the faintest idea how 98% of the oil and gas industry works. It is based on hard science and mathematics: thermodynamics, probability, materials science, structural statics and dynamics, some of the most sophisticated programs and fastest computers in the world etc. When those things are ignored and decisions are based on “trust me, that’s how we did it last time” people die. Taking pride in near miss accidents and injuries is absolutely the worst approach and will, rightly, severely limit someone’s future career options, even in the least rigorous companies. Hard won lessons have, thankfully, mostly purged your type of thinking from the industry and it is now one of the safest around. As for using ones own money and labour – I’d really be interested to see a sole trader build and operate a multi-billion dollar development, which is where by far most oil and gas is produced, on their own from scratch – it is simply impossible, that’s why capitalism is so popular.
Shallow Sand speaks the truth for a lot of us small producers who have been around for decades. It’s an artificial world where a 1% oversupply of crude is termed “awash” in oil and where the “oversupply” crashes the price. My family and I hang on for the sake of our few dozen employees and on the (probably irrational) hope that Saudi Arabia and operators in the Permian can’t keep borrowing money forever. For four years, starting in 2014, we cheated by wearing out trucks, dozer tracks, power tongs and every other piece of equipment we own. This year we paid the piper and spent $800,000 (every bit of extra cash we harvested at $70 oil) replacing equipment and buying some tools for the shop–except for the few thousand dollars I spent on new cameras for the shop and a couple other defense items. I figure when the college students with the worthless degrees find that the internet doesn’t work anymore, and they’re cold in the winter, the first thing they’ll do is wish for global warming, and the second things they’ll do is show up at my shop demanding a safe warm place. I want to be ready.
Dennis, I don’t often get a chance to agree or disagree with you on oily matters because you are always trying to interject “science” and statistical analysis bullshit into everything. EVERYTHING! Life is not like that, and neither is the oil business.
So let me get this straight, every endeavor that I’m aware of, if one removes the science and the statistical analysis one is left with pure bullshit! Except for the oil business. Ok, good to know! Carry on!
Cheers!
Well, to me that would be very understandable. The third year is small potatoes to the first two years. EIA’s “legacy decline” has always seemed to come from outer space, to me.
Shallow sand,
Yes for all of the US almost 2/3 of output is from wells that started producing in 2017 and 2018.
Also 2016 wells produced 1567 kb/d at the start of 2017 and 614 kb/d at the beginning of 2018. So a fall of about 61% in a year. About 9,000 wells were completed in 2017 to keep output rising (data from shaleprofile.com), in 2018 through August about 6000 new tight oil wells have been completed. If completion rate decreases as it did in 2015 and 2016, output might decrease. It would probably need to fall to 50% of current completion rates for a decrease in output.
Well, that vindicates my 60% decline from my wells, lol. I thought they were decent upper tier two wells, so glad to hear they are not underperforming to the average.
Ron I pasted from EIA.
https://www.eia.gov/petroleum/drilling/faqs.php
scroll a bit
The newest (1 month+) wells dont have a previous month in their data. They add that production. It’s a net calculation, not an average of all well declines.
It will understate what it would be if they averaged all declines (including those newest (1+ month) declines.
Rephrasing, assuming I understand them . . . they look at all wells and compare it to previous month, but wells just coming into the data that are 1+ month old . . . their production does not have a previous month to compare to, so that production is purely added. The whole field will show decline EXCEPT for those newly added wells — even though those wells did decline from the prior month which is excluded from the data.
They are reporting a form of net legacy decline. I guess what they SHOULD do is wait a month so there is a previous month to compare to for the new wells, but I’m sure that will be convoluted with constantly noting that no matter what they do, some wells will have no previous data.
Or perhaps compute the decline rate for every single well in the field and average them together. This way the newest wells don’t get their production into the overall calculation.
Ok, it takes production from boundaries, not plays. Anyone have any idea how many plays are in the Permian and Eagle Ford boundaries, including conventional? Bunch. Permian is close to 1 million in conventional, still. Almost all of that is not in the Wolfcamp, Sprayberry, or mostly where they are currently drilling. Apples and GD oranges, again.
Total decline of all wells and average decline per well are the same number by simple algebra.
Excellent post, Ron. Curious what the other posters think will be the 1st major US shale play to peak. Eagle Ford or Bakken I would think. Not sure where Niobrara and the Anadarko are in relation to those 2. The next few years will be very interesting indeed.
My guess is Eagle Ford, then Bakken, not sure what’s next.
Update to EF model with assumed TRR of 12.5 Gb and using AEO 2018 reference oil price scenario. Well cost in 2017$ assumed to be $6.7 million on average. URR is 8.8 Gb, secondary peaks in 2018 and 2027, but previous 2015 peak is never approached.
So in effect, Eagle Ford play is past peak. Bakken will be next, probably within a year or two.
Yeah, seems highly unlikely at best that Eagle Ford will ever regain its high. Even the EIA forecast – notorious blue sky that it is – only gets it back to 1.5 million bpd. And that on a theory of producers shifting from Permian due to logistical constraints in the latter.
It’s a mature area, only so many decent spots to drill.
Chart for revised US LTO scenario.
Hi Dennis,
Thank you, and Ron, for the generous good work.
Your LTO scenario assumes that drilling continues at present rate, and so debt issuance, low interest rates and goldilocks oil prices continue. Or, couldn’t a severe recession, or higher interest rates completely crash the LTO ponzi scheme? Might this then render much of tight oil cost prohibitive for……….ever?
BloomingDave,
The LTO scenario assumes the rate of well completion increases until about 2025 and then starts to decrease as sweet spots get drilled up and average new well productivity decreases.
My scenario assumes oil prices gradually increase to the point that tight oil companies can pay of their debt and I assume an annual interest rate on the debt of 7.9% (until it is paid off).
A recession like the GFC would make my scenario wrong, but in the past 120 years there have been only two period where World Real GDP decreased in any calendar year (Great Depression and GFC), so these events are not frequent and probability is low that there will be another such severe recession in the short period of 2010 to 2025 (a 15 year period rather than the usual 60 year period). So the scenario is my best guess and may be wrong.
Permian Basin output for Medium ERR scenario with 400 well completions per month (same as Oct 2018) until 2040, 106,000 wells drilled from 2019 to 2040. Output peaks in 2030 at 4800 kb/d.
I do not think this is a realistic scenario, simply presented to show what happens if completion rate remains constant at today’s level. The EIA’s DPR model is not very good in my opinion.
In other sources US growth is more 1.9 mb/year, source is Rystad:
https://oilprice.com/Energy/Crude-Oil/OPEC-Came-Up-Short-Heres-What-They-Should-Do.html
Looks like the USA is supplying half of the world soon at these growth rates.
As far I know Bakken is still pipeline limited the next time, so no growth from there?
So it falls most to GOM, Eagle ford and Permian, which can grow without pipelines?
EF does not have pipeline problems, but it is not going to grow at $55 or less oil price. If prices rise to $80, yes. But, the price will need to be consistent for a good long while. GOM has hit its high back in August according to SLa and George. We won’t have much, or any growth in the first half of 2019, no matter what the hype is, unless prices spike.
Guym,
At $80/b to $100/b from 2019-2025 do you think the Eagle Ford could surpass its previous peak? I think not, but it’s your neighborhood so you would know better than me.
If oil prices rise fairly quickly, before the Permian can gear up, then it is possible for it to come close. Otherwise, probably not.
Thx guym
Dennis, attached are four EIA projections for C+C from 4 previous STEO’s. While all previous ones showed increasing crude production for on-shore lower 48 states out to end 2019, the latest projection, Dec 2018, shows a peak in July 2019. Any thoughts on the cause, financial, geological…? Clearly this means that after July 2019, decline rates are exceeding new additional production for the on-onshore lower 48.
Ovi
Not sure what that is based on perhaps expected port and pipeline constraints.
Generally the STEO is not very accurate so I ignore it.
If the AEO 2018 reference case oil price is correct (I expect it will be low) ans the USGS mean cases for tight oil are correct then we will be likely to see 9 Mb/d of tight oil output by 2024. So the 2019 plateau in the STEO will be a temporary pajuse in the increase.
I will keep watching their outlook to track how it evolves. One can hope that their methodology is improving.
Thanks.
Hey maybe they are correct.
Future is tough to predict.
Excellent analysis Ron Patterson. I really enjoy your monthly production updates and especially the analysis of various import aspects of the oil industry that is often added after the production charts.
I understand the big declines in legacy production are a characteristic of shale oil, and with overall production growth there will come a time when production from new wells cannot keep up with the decline from the legacy wells. What I wonder also is how good are the economics for drilling all these new wells. I am not close to the numbers , but my suspicion is that the economics are not that good. Nevertheless the shale oil industry ploughs on and continues to set new highs month after month.
Thanks, Ron. From my website:
6/12/2018
Qatar peak oil
http://crudeoilpeak.info/qatar-peak-oil
On the French fuel protests:
28/11/2018
European oil consumption after North Sea Peak Oil
http://crudeoilpeak.info/european-oil-consumption-after-north-sea-peak-oil
tl;dr
BP says Europe consumption up each of last 4 yrs
Prices down after EIA reports a smaller draw of 1.2 million. Lol, the past two weeks total stocks are reported down by over 15 million, including SPR, and net imports are up over a million barrels a day this week. That glut is having some big time affect on inventories, isn’t it? ?
I have debated pulling the trigger on symbol USO…. looks to be an easy 30 to 40% return in 12 to 18 months. I thought we were energy independent? 🙂
I’m in leaps for USO for Jan 2020. The only worry I have is that the discount for WTI could go up at year end 2019 when the oil can’t get shipped out. Still, overall it should get higher, but I am notorious for being a lousey investor.?
I have my eye on it–
But haven’t pulled the trigger.
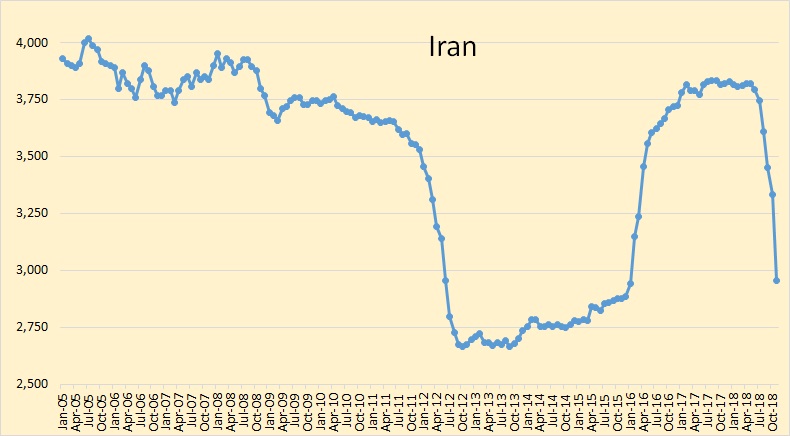
What is behind the drop in Iranian production over the past year. Did I miss something?
Sanctions imposed by US on Iran.
Wow. I would have thought there were enough countries to be willing to buck that. They must be hurting and more than a little P.O’ed.
Iranian oil was replaced by extra oil produced by Saudi Arabia and Emirates. The sanctions however, won’t make the Iranians fold to US neocons, who seem to control Trump via Bolton?
By the way, I expect Venezuela’s production to drop below 1 mmbopd in January, because Maduro’s presidential term ends on January 9, and on the 10th Venezuela is likely not to have a government recognized by USA, Colombia and Brazil. Maduro is scared there will be some sort of humanitarian intervention and requested help from Putin, Erdogan and the Iranians. A few days ago two Tu160 bombers landed at Maiquetia, but the word I got was that Putin was pulling them out tomorrow night unless Maduro starts handing oil over. Meanwhile the Iranians announced they will be sending three warships to help defend Venezuela (sounds like BS), and the new Brazilian president, Bolsonaro, reached an agreement with a state governor who runs the region bordering Venezuela to put it under federal control, to enable the feds to handle the flood of Venezuelans fleeing into Brazil.
Inside Venezuela there’s a small amazonian tribe rebellion against the regime, they closed the Canaima national park, and tribe elders declared a couple of sites used by the Venezuelan army were fair target for native fighters. The rest of the country is in the usual chaos, with a higher crime rate making it difficult to move overland from town to town.
In the USA, the prosecutors who are tracing the chavista mafias money are getting cooperation from those already jailed, and there’s confirmation that hundreds of millions was stolen and put into US, European, and other investments and bank accounts. The latest kingpin to be indicted is named Gorrin, and it seems he was given money to buy the Globovision TV, to turn into a nominally opposition media while following a regime script. Gorrin fled the US and his whereabouts are unknown.
Wait. What? Maduro was just re-elected to a 4 yr term this past April.
Depends on which planet you are on.
Maduro’s current term expires on January 9, 2019. The regime scuttled the National Assembly, and created a “National Constituyent Assembly” or NCA. They say this Assembly has superpowers and sits above Maduro, the Supreme Court, the State Attorney, and the National Assembly.
The NCA, which is illegitimate, called for elections ahead of time, and Maduro was “re-elected” in illegitimate elections, several months ahead of schedule. But the previous term is still running. Approximately 42 nations have already stated that come January 10 Maduro will not be president. About a month ago Maduro requested that about $500 million worth of Venezuela’s gold held by the Bank of England be sent to Caracas, but the bank refused because it thinks Maduro is looting everything and the regime will likely collapse.
I don’t think this is the type of blog where I should write extensively about what goes on. December production is on schedule to average 1.1 million bopd, but I expect January production will be lower than 1 mmbopd, even though the current trend puts it at 1.06 mmbopd.
I don’t have a good idea about what will go on in early January. I do know Colombia moved 4600 men from an elite reaction group into Catacumbo, and is making sure it has secure lines of supply from Cúcuta into Catatumbo. This is very interesting because there are three points where the border can be crossed fast and without hassles in the dry season, which has just started, and Catatumbo is one. The other one which looks attractive is Guajira, and the US Navy sent an LSD vessel there a few months ago. They landed a small group of Marines, who proceeded to take soundings and soil samples, and drilled water wells. So if the US is going to back Colombia and Brazil from a land site, it’s possible they’ll do it from the Colombian side of Guajira, where LSDs and other vessels can approach within two miles of the coast.
Fernando Leanme,
Thanks for this, as always.
Most nations were allowed to continue to import without sanctions from US, they were granted waivers by US, this supposedly will change in May. Allies such as Korea, Japan, and Europe cut back on imports, even China and India, I think.
Recent drop in oil price was in part in response to more nations being granted waivers than expected by the oil market.
except that much of the price decline took place before there was any hint of either a waiver announcement or a waiver discussion.
Rumors can drive prices, lots of leaks at White House.
Thank you Ron for the great post again.
Here is a probable confirmation of Russia’s oil peak in 2018-2019 as you have predicted before:
https://ibb.co/JW1j4sf
To avert 2°C global increase fossil fuel use needs to decline at about seven five to percent per year. That is just about the natural decline rate for mature oil fields, so effectively no more developments can be approved without catastrophic results somewhere. I think the evidence is mounting that after 2°C we will hit some form of runaway which will lead to hot house earth and the change will be much too fast for us to be able to adapt, which will mean the end of civilisation and maybe humanity. Therefore any new oil well could be considered the one that went over the tipping point and caused mass starvation etc. Yet no regulatory regime in the world is stopping approval of developments, in fact many are actively trying to accelerate investment from private companies. German has a word for all this, as for most things: Lebenslüge – the lie you have to tell yourself to live your life.
There’s no evidence for a “runaway” temperature increase. But there’s plenty of evidence for a fanatical, repressive, and irrational movement which ties world average temperature to the need to implement communism.
Those commies are remarkable, aren’t they? They’ve managed to rid the Arctic of 95% of its old ice, flood the US with record rainfall events, set fire to Australia, and break the back of the jetstream. They boogie, them commies.
If we are uncritical we shall always find what we want: we shall look for, and find, confirmations, and we shall look away from, and not see, whatever might be dangerous to our pet theories. In this way it is only too easy to obtain what appears to be overwhelming evidence in favour of a theory, which, if approached critically, would have been refuted.
Whenever a theory appears to you as the only possible one, take this as a sign that you have neither understood the theory nor the problem, which it was intended to solve.
For it was my master who taught me not only how very little I knew but also that any wisdom to which I might ever aspire could consist only in realizing more fully the infinity of my ignorance.
That’s Karl Popper, a man who was not only cleverer than you, but cleverer than you can even imagine.
Popper is way over-rated.
“‘Popper is way over-rated.”, says the man with zero credibility.
The likes of Kaplan think they are card-carrying atheists. But they need to believe in something otherwise their meaningless lives would feel shallow, hollow, depressing and purposeless. I recommend Nicholas Wade’s “The Faith Instinct”.
Lose the fear– it is crippling you.
“Ad hominem (Latin for “to the person”, short for argumentum ad hominem, is a fallacious argumentative strategy whereby genuine discussion of the topic at hand is avoided by instead attacking the character, motive, or other attribute of the person making the argument, or persons associated with the argument, rather than attacking the substance of the argument itself.”
https://en.m.wikipedia.org/wiki/Ad_hominem
Or it could be that Archie is just a fuckwit and best ignored, at least until public opinion (aka mob rule once things get bad enough) decides some of these a-hole deniers need to pay some recompense for fucking things up so badly for the rest of us.
Disaster Communism and Other Opportunisms
And then there’s ‘disaster capitalism’, which doesn’t necessarily make the disasters, such as anthropogenic climate change (ACC/AGW), any less real or valid.
There may be relatively-little evidence for ‘runaway temperature increase’ now, but then, evidence can be hard to glean at certain points along exponential curves…
In any case, our species has, of course, many concerns besides ACC/AGW, which makes things appear to be shaping up toward a perfect storm.
I much prefer when the climate BS is kept to the non petroleum thread.
I much prefer it when the anti-science BS is kept off this forum.
Hey Dan, you good with anti-Commie rants?
I much prefer when you shut the fuck up, but we can’t have everything.
Hello, what is of paramount importance is the total free cash flow generated by shale oil producers at any given price of oil. Any idea on this? At the average Q2’2018 price of 68$, 2/3 of producers had negative cash flows so the situation is probably worse off in Q3’2018. As per the FRED, effective high yield rates in the US went from 5.5% to 7.5% in the space of one year. Also equity prices are decreasing which impacts gearing and the ability to raise financing. To summarize, lower oil price, higher rates and tighter financing constraints will weaken even further cash flow generation, balance sheets and ability to drill at such high rates. So my scenario is for WTI to bottom between 40$ and 50$ and to slowly but surely creep up as production figures decrease during the course of 2019 and 2020. Shale oil is a by-product of easy monetary policies which are being withdrawn.
Correct analysis. In a nutshell, if prices remain where they are many tight oil producers will be toast.
Lol, you got that right.
Guym,
Occasionally I get things right. 🙂
Regarding my small oil business rant above.
Small business is a tough place, not just in the oil industry, but all over.
I think of the grocery store owners. Those guys had a pretty good thing going in small towns 30 years ago. Now they are gone if there is a Walmart nearby.
Same with department stores. The mall in a mid sized town nearby is halfway a ghost town now.
Capitalism can be brutal. But it doesn’t seem that another way has proven to be a better idea either. We tend to take freedom for granted in the USA. We are very lucky we have the freedom we do have.
I don’t know that price controls are a good idea. I don’t know what the answer is to market volatility. We benefitted from getting into oil when no one wanted to touch it, and really did well from 2005–14. Since then, not so good, but maybe our time will come once more.
Overall, shouldn’t complain. Just trying to give a unique perspective. Also trying to let everyone know that there are a lot of hardworking small business owners in upstream oil and they aren’t the terrible people some make them out to be.
Everything in the media these days is very urban centered and also very East Coast dominant. So different perspectives from different regions is always good, I think.
!! Runners-up for Quote of the Year !!
from above:
“Shale oil is a by-product of easy monetary policies which are being withdrawn.”
in a way kinda 🙁
https://www.zerohedge.com/news/2018-12-11/real-implications-new-permian-estimates
“Now, I know FOR A FACT that American energy dominance is within our grasp”
and it keeps getting more better
“Reilly stressed, “Knowing where these resources are located and how much exists is crucial to ensuring both our energy independence and energy dominance.””
Pretty Powerful results for just a by-product!
Was it JH Kunstler that pointed out that “energy dominance” is kinda kinky?
shallow sand,
I always look forward to your posts. I think there’s nothing more important here, and that’s a high bar.
Syn. Thank you for the kind words.
Shallow Sand,
You and Mike are a big part of the reason this blog is worth reading. Nice to have a variety of viewpoints and differences of opinion.
Shallow Sand
Neo Capitalism or Creditism might be better terms to describe our current monetary and economic system. When central banks can issue Credit and lend it to their pets by the billions and when those corporations go under they just issue more Credit to the corporations that take their place. This is not Capitalism where companies and individuals produce something valuable and return a profit that they can then reinvest as Capital.
This current economic system is destroying the sources of wealth and valuables. It encourages burning down the house to stay warm. I used to dream of being a big farmer but more and more I feel lucky when I see the stress and fear that so many of the bigger farmers are dealing with.
I appreciate your great contribution to this site. I’ve learned so much from your comments. They’ve increased my confidence that this shale business would not be here if it were not for the biggest ponzi scheme to date. And that the peak of Oil production per Capita that was reached in 1979 will never again be topped in my lifetime even with all this fraud on its side.
Some great musings from Charles Hugh Smith
https://www.oftwominds.com/blogoct18/zombies10-18.html
Farmlad.
The size of farming operations and the debt they are taking on is mind blowing.
A large farm in our neighborhood recently took delivery of the largest new JD combine with a new corn head and bean head. I was told the total price was $1.2 million.
I don’t know how most farmers sleep a night. Heath insurance running $2-3K per month. Low grain prices for the fifth year in a row. Interest rates rising.
I guess it has always been this way. Many panics in the 19th century. Most of those involved huge swings in commodity prices.
The East Texas oilfield opened during the Great Depression. Some sold oil for 5 cents a barrel.
The world is in a commodity down cycle. I assume history will repeat itself.
I do wonder if we will see farmland prices sink more. Land prices have dropped quite a bit in the fringe areas. Not as much in the strong areas. Have to think rising interest rates will take their toll on land prices as long as grain stays low.
shallow sand,
Your perspective is much appreciated. I continue to hope for higher oil prices as that is what will allow us to get through the energy transition.
Dennis.
The only thing we know for sure about future oil prices is that we have no clue what they will be in the future. Lol!!
I know why you model prices. I also understand why your models frustrate Mike.
As we have seen, if prices closely correlated with US oil production, your models might make some sense. However, US oil production has apparently increased substantially despite low prices and many, many wells being drilled and completed that are not profitable when all costs are included.
I think it is fascinating to see that almost all of the publicly traded oil service companies are in big financial trouble despite the unprecedented amounts of upstream capital being spent in the US lower 48. Many are trading below the 2016 and 2009 lows.
Nabors is the largest US onshore driller. Stock price is 1/4 if what is was in 1979 NOT adjusted for inflation.
Weatherford International is a huge service company. Likely going BK based on shareprice.
One would think these companies would be thriving.
Watcher gets attacked here quite often. I don’t agree with all of Watcher’s posts. However, I do agree that things seem messed up.
I talk to the guys in the field, like Mike, who actually get the oil on their gloves. I go over the shale numbers with them, because they assume it is wildly profitable. Once we talk numbers, the common response is, “So it’s just a huge promotion?”
Funny thing on SA. Discussing Whiting. Look at their stock price chart. 1 for 5.5 reverse split doesn’t help. But, new CEO apparently thinks they can afford a luxury box at Denver Broncos games and can afford team building exercises two time zones away.
Shallow sand,
The economics do not pencil out at low oil prices on that point I agree. The prices I assume simply use the EIA AEO oil price reference case, which may well be wrong.
My models assume eventually oil prices will need to rise or there will not be enough oil produced. This is based on the assumption that oil companies can only lose money for so long before they go out of business because they cannot make their loan payments. In a medium/low oil price scenario, that is what happens.
As a result oil supply falls to a level that does not satisfy demand at the lower oil price level, then oil prices get bid up as there are too many customers chasing too little oil. I know you know all this, as it is basic econ 101, but in the long run it is the way a free market works (at least in theory).
If we want to throw up our hands and say we have no clue, that is always an option, but less interesting from my perspective.
I personally am at the throw up hands point.
The pundits are all saying shale is profitable at $50 WTI. Of course, the companies aren’t generally getting $50. More like $30s or low $40s. Hedges could be helping some.
There are still a lot of rigs going. Still a lot of frack crews going. Maybe that will tail off as contracts expire and are not renewed.
Companies keep producing oil through BK these days.
Shallow sand,
Doesn’t make a lot of sense at less than 60 per barrel at well head. I doubt it can continue more than 6 months at current price levels.
Many pundits know even less than me. 🙂
Oil consumption might head down.
This one on recession.
https://www.newsweek.com/recession-2020-cfo-economy-market-crash-general-motors-verizon-trump-2019-1255426
This one on automation.
https://www.nytimes.com/2018/12/13/opinion/robots-trump-country-jobs.html
I predict oil consumption will start falling in the early 20s. Here’s my argument:
There are about 1 bn cars on the road. Cars have a life expectancy of 14 years, so 71 m are scrapped every years. 81 m were sold last year, so the number of cars on the road is grows by about 10 m, or 1% per year.
This year about 4m EVs and hybrids were sold. Like EVs, hybrids burn almost no oil. Growth is about 70% / year. If it stays at 50% for a few more years, which seems likely, we get 6 m in 2019, 9 m in 2020, and 13.5 m in 2021.
So in 2021 the number of combustion engine cars will start falling, albeit very slowly. But there’s more. Most cars park 90% of the time. The biggest advantage of EVs is gas savings, so heavily used vehicles — taxis, ride share vehicles, fleet vehicles — will be replaced first, and they consume much more than the average car.
EDIT: For example, if EVs are used four times as heavily as ICEs, and they hit 0.5% of the total market, then demanded quantity of oil would be down 2%.
I don’t know about EVs plus Hybrids, but the total number of EVs on the road, in 2017, is just under two million.
But my bone to pick with you is you expect the exponential growth rate to remain constant at 70% per year. No, it just does not work like that.
The exponential rate will automatically drop off as the number of EVSs increase. Of course the numbers will continue to increase, but when the numbers get into the 10s of millions, the exponential growth rate will be nowhere near the 70% mark. That is just not a good way to make a prediction.
Worldwide number of battery electric vehicles in use from 2012 to 2017 (in 1,000s)*
They had EV’s in 1016 and 1017? How far we have fallen. 🙂
“The exponential rate will automatically drop off as the number of EVSs increase.”
Which is why I use a logistical equation in my graphs, not an exponential.
BTW, Tesla production went from 27,000 cars per quarter to over 80,000 cars per quarter in one year ( 3rd quarter this year).
Their new rate is about 400,000 per year and will probably cross 500,000 per year very soon.
Those are all BEV.
I agree, Ron.
My guess for maximum added electrics to the total vehicle fleet per year is probably about 30 to 40 million: I would further guess this might happen around 2033.
My basis for this is that I think electrics will last twice as long as ICE cars: hence, factory capacity should be about half that of our current production. I also think that if we get to driverless cars on a wide basis, they will kill the incentive for vehicle ownership (barring those in rural areas and special cases like tradesmen). There is not much difference between public transit and a driverless car; this will depress demand despite rising population.
Of course, the world could (and probably will) end first, but as a thought experiment, it’s not unreasonable.
Ron,
Of course you’re right about 70% growth being a passing thing. But I expect it to run a few years in the mid double digit range.
The main problem now is battery shortages. Every EV that is being seriously marketed has a half year or year waiting list, but a lot of battery production is coming on line.
https://twitter.com/tsport100/status/988436366932365313
This site predicts 1.1 TWh battery production by 2028.
https://www.visualcapitalist.com/battery-megafactory-forecast-1-twh-capacity-2028/
That puts a damper on my calculation, because at 70 KWh per car battery, that’s only enough for about 15 million cars. The shorter term outlook of tripling by 2023 means about 24% growth, based on this site’s claim that current capacity is 220 GWh.
China, which is responsible for practically all vehicle sales growth, is planning a sevenfold increase in EVs by 2025, which means increasing sales by a third each year. The are building battery factories like crazy, and I fully expect them to overshoot their targets as much as they overshot their solar targets. They planned 105 GW by 2020 in 2015, but have revised that to “up to 270 GW”.
So call me crazy but I think 20-30m EVs and hybrids a year by the late 20s is realistic. Again, that’s about 30% annual growth.
The main reason I think it is true is that electricity is much cheaper than gas per mile, and electric cars will soon be cheaper to buy than combustion engine cars as well. We’ll see.
“This year about 4m EVs and hybrids were sold. Like EVs, hybrids burn almost no oil. Growth is about 70% / year. If it stays at 50% for a few more years, which seems likely, we get 6 m in 2019, 9 m in 2020, and 13.5 m in 2021. ”
EVs burn coal & NatGas since most of the Grid power is produced via coal & NatGas. You analysis of EV growth is flawed, since it does not account that the majority of vehicles are financed, and most new cars have long term loans. What is likely to happen is consumers by far fewer vehicles as the costs or vehicles becomes un-affordable. Its difficult to buy a new car when you still paying off the loan of the old one. EVs are usually more expensive & come the next recession many manufacturers will likely exit the EV market or reduce investment. I would expect EV sales to collapse by the early to mid 2020’s if not sooner if there is another global recession in 2019.
Most official agencies (IEA, OPEC, EIA) projects a peak of US shale oil around 2025. From what I read on this esteemed forum this seems like a reasonable expectations, however, US shale oil will cease to be a market moving factor once its growth rate slows to 500K or below, with this in mind, does anyone have a projection on when will US shale production growth slow to such level? Based on my own work I see this happening in the 2021/2022 time frame, but would welcome the board input.
My guess would be 2019/2020.
For sure. But, it will probably pick up some after that, too little, too late.
Well, if “making money” had been a criteria for shale, ever, then 2014 would have been the peak year.
Not because that was the peak year of making money, but by then it was abundantly obvious that they hadn’t and really never would.
Sure, some operators could have picked up some pieces for pennies on the dollar and made a few bucks, but I mean that collective half a trillion of debt and equity already on the bonfire that could not be paid back under any rational scenarios.
Crazy what thin-air money printing can accomplish, isn’t it?
Chris,
The economics works in the Permian at the AEO 2018 Reference case prices, debt gets paid back about 2027 in my medium ERR scenario, mean USGS TRR and AEO reference price case. After 2027 cumulative net revenue in 2017$ (not discounted) is about 300 to 400 B 2017$. Assuming real annual interest rates of 7.5%. When oil prices are lower (average of AEO 2018 reference and low oil price case) the economics does not work.
To me the AEO 2018 reference oil price scenario looks quite conservative, my expectation is that oil prices will be higher than that scenario through at least 2035.
>Crazy what thin-air money printing can accomplish, isn’t it?
The low interest rates of recent years are a byproduct of globalization and the huge improvements in efficiency in recent years. As technology improves, it’s getting easier and easier to produce the goods and services consumers want. Furthermore, better transportation, communication and financing are allowing vast numbers of workers to enter the job market worldwide, pushing down wages and increasing profit.
At the same time the economy is dematerializing, as teenagers lose interest in cars and spend all their time on mobile devices that consume much fewer resources.
So more and more capital is being created, but there is less and less need for it. As a result, interest rates are nearly zero.
The real question facing mankind is what to do with all this money. A moon colony? A giant war? Reversing global warming? Ending disease? Mass restoration of the ecosystem? Health care and education for all? The American answer seems to be to pepper the continent with oil wells that deliver little or no ROI.
alim- ” low interest rates of recent years are a byproduct of globalization ”
Well, I don’t see the world like that. The interest rates are low because the worlds growth is very fragile and higher rates would push growth to stagnation.
The implications of which version you believe are huge.
Yeah. I see Asia as a gigantic deflation machine. Hundreds of millions of people streaming off the fields and into the factories, offering their labor at rock bottom prices. And when they run out it will be Africans.
Added to that, learning curves seem to be speeding up, and material things are shrinking down to nothing.
People raised in the 60s and 70s worry about inflation, but I don’t see how it could possibly happen under a halfway sane government.
“People raised in the 60s and 70s worry about inflation, but I don’t see how it could possibly happen under a halfway sane government.”
The Inflation rate in the US in 1979 was close to 12%. It wasn’t until the Volker crushed it with 14% interest rates. The issue is that since then, the Bond market has been in a bull market. Bond prices keep on falling, fueling more & more debt. However when at some point Gov’ts get into too much debt, and start printing money, and eventually inflation takes off, even in a high debt economy. Odds this will probably happen in the 2020s since sometime between 2022 & 2024 it will take every tax dollar just to pay the interest on US treasuries & entitlements (no money for defense, education, roads, etc). At that point the gov’t will just start printing money to cover the difference. Its likely most of the industrial world will follow the US’s example (just like the did with interest rates). So then you have entire global economy following Robert Mugabe’s economics.
Joseph,
Much depends on the price of oil. If we assume the aeo 2018 reference oil price scenario is correct, the increase in US LTO output falls to 500 kb/d in 2022, peak is 2024 at 9 Mb/d of US tight oil output.
Lower prices might lead to a lower peak, but it might be later. URR will be about 60 Gb in the AEO 2018 reference Oil price case, a lower oil price scenario would lead to a lower URR and higher oil prices might increase URR, range would be 50-70 Gb.
Thank you all, much appreciated.
Joseph,
I mistakenly used Permian URR above , for all US tight oil the mean will be about 85 Gb with a range of 70 to 100 Gb.
Currently, legacy decline is just above 500,000 barrels per month. This means that if production is to be increased by 100,000 barrels per month then new wells must produce 600,000 barrels per month of new oil.
If US new oil production is indeed increasing by 600,000 barrels/day per month, this is a mind-blowing number — 7.2 million barrels/day per year. Has new oil production ever increased by this much anywhere else in the World?
It’s just a completely other kind of business.
With a conventional giant, you set your productive wells, and then set injection wells, infrastructure, gas plants, reinjection infrastructure. So you invest double digit billion $ in above the ground infrastructure.
In shale it’s more about drilling many wells, with a less sophisticated infrastructure above the ground.
Conventional fields have constant drilling, too – new injectors, creaming, side pockets. But this is not new production, it maintains production.
Least but not last – the crazy drilling in shale is only to mainain production, too. A conventional field you tap complete, and then mainain it. A LTO field you tap slice by slice.
Do we have a computation of what % of total US oil production is from wells < 1 year old? Or even < 3 mos old.
Watcher,
Go to shaleprofile.com to get an idea. In August 2018 roughly 25% of US C+C is from wells which started producing in the first 8 months of 2018.
Look at just the Permian on Enno’s fine sight. If you focus just on the oil. +50% of all current Permian production came online during first 8 months of 2018. Legacy decline for 2017. Take a long hard look at that as well. Combine what 2017 and what 2018 legacy decline will be. How do they complete enough wells during a calendar year to overcome this legacy decline is my question. Also compare 2017’s legacy decline to the years before it. You’ll see that legacy decline is accelerating.
The infrastructure is there.
Say you just stall – ever drilling rig will drill it’s holes, every completion team will frack it, no growth or reductions here. Every rock has the same quality. Every well lives 10 years before it gets plugged
You produce let’s say 300 wells a month
Then you’ll see even growth over 10 years, every year less. So you have 300 1 month old wells, 300 2 months old wells, 300 3 month old wells …. up to how many months you are doing this. The growth is determined by the oldes well here – that’s what your produce more than the month before.
Until you start plugging – then you are in equilibrium.
When the rock starts getting worse without the technic being able to compensate, you start declining – or have to drill more.
I don’t think we’re there, yet.
What does stall mean. You say stall and then you say keep drilling.
HHH,
As Ron correctly said, higher completion rates lead to higher legacy decline. Currently there are around 350 horizontal oil completions per month in the Permian, if it falls to less than 290 per month, output will decrease.
I was looking for total US, which would be more than just shale. Some drilling elsewhere, surely.
But probably most is shale. Big % is dependent on recency.
Pretty much all increase in output is from tight oil, perhaps a bit in GOM, but that will probably be flat to down going forward.
Watcher,
Completion data like what is found at Enno Peters site is usually only found in proprietary databases, even if someone had access to that data they are not allowed to share it.
I don’t have access to that data so do not know yhe answer to your original question.
Peak will definitely not be 2018.
https://www.reuters.com/article/us-usa-oil-eia-outlook/us-expected-to-end-2018-as-worlds-top-oil-producer-eia-idUSKBN1OA21D
Also there is spare capacity in Saudi Arabia, and Russia will increase oil production for another year or 2.
Canada can still increase production and so can Brazil, Kazakhstan, Iran and Iraq can produce more, Nigeria could produce more if the pipelines stop being blown up.
https://www.forbes.com/sites/michaellynch/2018/06/29/what-ever-happened-to-peak-oil/#4e13c394731a
It has been a long long wait for peak oil, anything on the TV?
Best guess is peak oil is when peak US LTO is. US LTO will go down faster than conventional fields once the limit is reached, so no possibilities to replace it from conventional production. Especially when Russia is in decline when this happens.
^This. I agree.
Depends
If the world decides things are bad enough they will allow Iran to produce the 4MMbl it can. That would stave off peak for another 2 years. If all the Independents could operate freely in Venezuela they could produce another 3 million barrels per day. That could be done but probably will not be.
American sanctions could be lifted and US technology could produce the vast shale oil in Russia. It all depends on how desperate people get. And they will get desperate.
The most likely peak will be around the timescale Dennis has propositioned.
Yea you could be right. It is very hard to tell.
I am still inclined to think that the shale oil production in Russia and probably in Argentina et al. needs high oil prices. (again i could be wrong)
Not sure how that will occur in a world where GDP growth seems to be steady declining. But again who knows.
Everyone who has looked at the Bazhenov shale situation thinks it is only viable in very high prices, if then. There’s no infrastructure and no local labor in that part of Siberia. This is nothing like the Bakken or Permian.
That’s ignoring the politics and geology questions, both of which are considerable.
Iron Mike,
World real GDP growth has been pretty steady at about 3 to 3.5% per year from 2010 to 2017. See IMF chart at link below (click on chart button)
https://www.imf.org/external/datamapper/NGDP_RPCH@WEO/WEOWORLD
Dennis
The GDP growth does not take into account the debt that has been used to boost that GDP.
A government that has no debt can use all it’s tax revenue to pay for schools, roads, police etc.
A government saddled with debt, must first honour the debt repayments. If it does not, it ends up like Greece.
The United Kingdom has to pay £48 billion to service it’s debt. That is $ times as much as what it spends on all the police forces.
The debt robs tax payers of services they should have, such as elderly care and safe neighborhoods. Police funding have been cut and cut.
https://fullfact.org/crime/police-funding-england-and-wales/
The rich in nice areas are the last to care about these things but eventually the people will simply have enough.
The debts occured paying not just for wars
https://www.thebalance.com/cost-of-iraq-war-timeline-economic-impact-3306301
https://thevietnamwar.info/how-much-vietnam-war-cost/
but paying for hundreds of thousands of mentally and physically injured men.
https://www.uswings.com/about-us-wings/vietnam-war-facts/
The arms manufacturers did very well along with the share holders and politicians who became non exec directors.
When a government borrow a hundred billion in order to pay wages and build roads, that is not real GDP. It is fake GDP which will be pay for with higher taxes and lower growth in the coming decades.
The rich are the first to defend this perverse situation because they benefit at the expense of the rest.
Hugo,
There can be too much debt and too little. Probably not as much of a problem as you believe. The debt was needed to get us out of the GFC. I agree that Government debt should be reduced where possible.
Private debt is not really a big deal, on a World basis it is money we owe ourselves, assuming no interplanetary lending. 🙂
Dennis
As I said, the rich will say it’s fine cos they are the beneficiaries of the debt which enriches the top and impoverishes the bottom
Hugo,
Also note that the rich hold most of the debt, so if it is defaulted on it hits them most.
A simple solution is to raise taxes on the wealthy in order to pay down government debt, also military spending could be reduced and that money could be used to pay down government debt. Also note that for many nations the interest rate on government debt is pretty low so not a lot of incentive in those nations to reduce government debt.
In addition, nobody wants higher taxes and very few want lower government spending, so government deficits remain a problem. So far it has been manageable, if debt grows faster than the economy, it will be a problem in the future.
Proper policy is to reduce debt during a boom so it can increase during a recession.
Greece’s problems (which have mostly been solved) are caused by the fact that the government owed the debt to foreigners. Obviously poor governance is a problem in Greece, but the low savings rate (by consumers and businesses) is the key problem.
There is no real reason to keep government debt low, as a matter of fact. It’s a myth created by a famous example of bad Excel calculations.
https://www.bloomberg.com/news/articles/2013-04-18/faq-reinhart-rogoff-and-the-excel-error-that-changed-history
It is important have good governance however, and for the government to invest sensibly. For example, America has problems maintaining its infrastructure because it is so poorly designed. The general feeling is that more should be spent, but actually less should be spent more wisely.
https://www.strongtowns.org/journal/2018/8/22/the-more-we-grow-the-poorer-we-become-td9nw
alimbiquated
Greece problems have mostly been solved. Are you kidding!!
https://www.euractiv.com/section/economy-jobs/news/greeces-unemployment-falls-under-20-after-7-years-of-bailout/
https://www.euractiv.com/section/economy-jobs/news/greeces-unemployment-falls-under-20-after-7-years-of-bailout/
https://www.thebalance.com/what-is-the-greece-debt-crisis-3305525
As a theoretical peak based on a lot of data that I assume Dennis model is based on, 2025 may very well be the peak. But in reality I think it will be different. With these kind of frequent showers of low oil prices experienced the last 4 years, offshore and places where cheap financing are not appropriate will suffer and building up for example Iran, Iraq, Libya, Venezuela, Syria and Kazakhstan will take too long time and not meet the demand in time. Add to that landlocked areas with potential that take even more time to develop. I know for a certainty that the oil and potential is there given investments. And then there is the shale oil potential worldwide which I do not know too much about, but assume will be expensive anyway. Due to politics intervening with the markets too much, we have built ourselves a time gap for supply scaricity and recession. A lot of potential areas screaming for higher oil prices, but not getting it. Nothing about this in MSM, nevertheless doesn’t mean it is wrong until proved otherwise.
I guess spare capacity and inventory globally can be stretched, but would it not be very visible after a while? (too high oil prices and recession due to debt bubble being a big concern)
kolbeinh,
My guess is that oil prices will rise from 2020 to 2025 and rising tight oil output will be enough to keep C+C output rising and the increasing prices may get dep water off shore, oil sands, and other longer lead time projects started, these will not arrive in time to keep output rising, but might allow a plateau 2025 to 2027 and may mitigate the decline until supply starts to gradually diminish as EVs and other alternative transport starts to ramp, by 2030 to 2035 we may see demand fall to the point where oil prices stop rising and fall if demand falls faster than supply.
Lots of moving parts all difficult to predict.
Dennis Wrote:
“My guess is that oil prices will rise from 2020 to 2025 and rising tight oil output will be enough to keep C+C output rising and the increasing prices may get dep water off shore, oil sands, and other longer lead time projects started,”
LOL! I agree on oil prices rising, that’s because current prices are near the bottom, since any lower prices Oil companies would be selling it below production costs.
I doubt higher prices will lead to massive investments simply because Oil prices have been unstable and at or below economic recovery. Shale is probably the one exception since its on shore & companies can quickly start production in a matter of weeks or months. On the other hand, an offshore project can take years & billions before a single bbl is sold. My guess when Oil prices go back up, we’ll just see a lot of companies buy up there competitor or assets, rather than take a chance of losing money on a long term project.
I think economic growth will die in the 2020:
1. Boomers retiring and start drawing down entitlements & pensions, putting a squeeze on over indebted gov’ts & businesses. I think taxes will continue to soar even while state & local gov’t go belly up.
2. Higher energy costs will cut consumption as people spend less.
3. Declining access to cheap & easy Credit. Once again consumers appeared to over extended themselves in Debt. While Central banks can cut rates back to zero, Banks and other lenders are not going to lend out money at 0%. The rate cuts worked in 2009 because borrowing costs drop from about 7% to about 3%. Lenders still could make some money with 3% loans.
4. Computer automation is going to replace at least 20% o the labor force. Robotics & AI is becoming more cost effective. Retail companies will exit the brick&mortar system and switch over to a more cost effective online – distributor system. Cars, furniture, electronics, pharmacies, clothing, etc will all follow blockbuster video stores (ie extinction).
4. Soaring healthcare costs: Gov’t interfere is causing prices to soar as insurance premiums skyrocket, & doctors leave practice or retire. US physicians have the *highest* suicide rate of any profession. IIRC about 40 doctors per week quit practice & 55% of all US doctors are planning to quit or are thinking about it. There is already a shortage of about 50K doctors & that shortage will continue to grow substantially.
I also agree with Eulen spiegal. The decline in tight oil will be too fast for other nations to make up the difference. At best a plateau might be maintained for 2 years, so potentially a 2 year plateau in the 2023 to 2027 time frame, then decline.
Geology is a big factor, but so is human management, of course.
Failed states often don’t do so well as optimizing production.
Tariffs, sanctions, embargoes, and wars don’t encourage smooth export.
If anything, I think the more likely scenario is a further decline in optimal human management.
If so, peak well before 2025.
Venezuela is a case in point. Horrendous.
https://www.nbc.ca/content/dam/bnc/en/rates-and-analysis/economic-analysis/GeopoliticalBriefing_181001.pdf
Hickory,
The oil is likely to be produced, extra heavy oil is not easy to ramp up quickly, so those resources will mostly reduce the decline rate, but cannot increase quickly enough to move the peak. Already taken into account by my models.
If WW3 starts before 2025 or another severe Global recession, then the peak will be sooner, in my view the odds are low (under 15%) that either of those scenarios occurs before 2025. Clearly nobody can predict the future accurately, so your guess might be correct, or mine, most likely we will both be incorrect. 2 divided by infinity is a pretty small number.
Agreed, but we could lose a big producer due to failed state scenarios. Saudi Arabia is in a dangerous neighborhood, with questionable stability of its government, for example.
15% chance of big market instability? OK, or at least less than 50%.
Oil market will lack stability short term, oil prices will swing widely, but if we consider 12 month average prices (the focus of my models), the swings are less abrupt.
A major producer stopping production is indeed a possibility, and the odds of that are indeed higher than 15%, probably more like 25-30% between now and 2025. My WAGs could of course be completely wrong as the number of scenarios is infinite and assigning correct probabilities is a fool’s errand.
How can you guys wave hands over head and declare peak is coming, here or whatever — when you don’t even know what oil is.
If you declare water to be oil, all the analysis you’re doing is worthless. If you declare NGLs to be oil (BP has already gone this direction for “All Liquids”) then you have further reason to see how it is a corrupted analysis. Condensate is API 45+, or is it? Some declare it 50+. Then it won’t take much effort to raise the top end number for condensate. Y’all are trying to determine probabilities of the imperfections of where the little ball rotates on a roulette wheel, and then the House comes along with a screwdriver and changes out the wheel, or ball, and you are continuing your analysis as if the wheel is the same.
The only signal you’ll get of peak is when tankers get seized by force and sent somewhere other than where they were going — and you start spending time in gasoline lines.
“If you declare water to be oil….” No worse that talking about an oil “resource” from locations where it costs more to get than the oil is worth.
Hi Doug,
I take the technically recoverable resource estimates from the geoscientists at the USGS and then apply reasonable economic assumptions to estimate the economically recoverable resource. Seems to me to be a reasonable approach, I always lay out the economic assumptions, for Permian Basin
average well cost 9.5 million in 2017 $
all $ costs below are real $ in 2017$
OPEX =$15000 per month fixed cost plus $2.3/b variable cost
transport cost=$4/b
royalties+ taxes 32% of well head revenue
annual real discount rate=7%
refinery gate price =Brent oil price from EIA’s AEO 2018 reference oil price case
Clearly any of these assumptions could be incorrect and I am always open to other suggestions (in fact I use several different oil price assumptions, see chart below)
Well, I am really not sure of any date for peak oil. It can be affected by oil price. I still think the more important measurement is when supply can not fully meet demand. On the demand curve, that probably happened years ago, but as the price of oil continues to go up, it will eventually eat into world economics more. At what oil price does it stall? I mean, ask yourself the question of how much better off would the world economy be if oil had stayed at $10 a barrel. Yeah, climate change could be a more serious long term factor, but the current economy. And bitch all you want about the shale business, it’s actually keeping prices down, somewhat, now. But, it won’t last long. That’s when we start worrying about seized tankers, not peak oil.
A lot of uncertainties for sure. With the dollar strength in most countries outside US, the old 110-120 brent price is now 90 many places. OPEC call for “stable prices” in the 80’s?; well I know for sure I am going to save for a rainy days if Brent surpasses 90 the next half year. Most likely wrong and prices will go crazy high, but better safe than sorry.
But as is, I think the oil supply worries are severly being underestimated. Just small signs, every major state so very focused on just oil for the last year. What do they know, what do they hide?
I, personally, want the price of WTI in the $80 to $100 range. At that price I make good money, and don’t have to feel guilty about getting more at the expense of the US economy. At least, not as much. However, I don’t think, long term, it will stop there, and I really do not feel good about that.
Do you really think EIA believes all of their nonsense? Maybe, but they could just be delaying the inevitable, hoping we can withstand it better.
The oil prices will be too volatile, we can agree about that 😉
About EIA, I am completely onboard about what you are preaching. I also completely lost touch around summer time (2018) because I could not believe what was reported. And thereafter just discounted the weekly reports as questionable, and I think I have a nose for these kind of things. I follow imports and exports data through external pay to view vendors as a back up and all together very little makes sense in the oil markets right now, because everyone is not showing cards (lying??). I have to pinch the president in the US for starting this trend.
K, the weeklies have always been crap. It’s the relentless over projections and now monthlies that are creating havoc. Second thought, few notice the monthlies, it’s mainly the ridiculous over projections.
Yes, it is so noticeable that I have gone quiet over it. I guess you only notice it if you have an accountant gene and look for bullish data despite all bearish headlines in the media coming out. Big oil price spike ahead though, despite all the trolls. It depends on OPEC+; if they look after themselves first, or not?
My worthless guess regarding oil prices.
I think they might drop a lot in the next couple of years, possibly testing the all time low of $29 for WTI.
It is a free world, why not? Nothing wrong with that prediction.
Lol, where is supply going to come from? Surely not shale at that price, as most of the companies, as Dennis says, will be toast. Heck, I think they will be fairly toasted at today’s price. Except for the big oil, capex budgets for 2019 are meager from what I read, so far. Big oil does not represent the majority in shale.
Technical analysis of the WTI, worldwide indices charts. GFC2.0 might be showing itself next couple of years. Global growth forecast has been revised down all over the world.
http://www.digitaljournal.com/news/world/global-economy-in-2019-growth-beginning-to-fray/article/538783
A negative demand?
Yes, i am “predicting” a significant downturn in demand due to GFC2.0.
Well, we may need that with negative supply, which we will have at $29 a barrel.
Iron Mike,
GFC2 may occur at some point, but keep in mind that in the past 113 years there have been two periods that Global Real GDP decreased (Great Depression and GFC), so on average about 1 time every 50 to 60 years. (Note that there is some dispute about whether the “long depression” of 1873-1896 was simply a period of deflation due to contracting money supply [gold at the time] relative to output, but that real economic output continued to increase at the World level.)
Economists learned quite a bit from the Great Depression and used what they learned to keep the Global economy out of severe recession for 72 years. They became overconfident and went back to a laissez faire philosophy for the banking industry in vogue before 1930, this was the main problem (lack of financial industry regulation) and perhaps some lessons were re-learned from the GFC experience.
In any case, if we used a maximum entropy analysis to guess at future GFC type contraction with a mean of 55 years, there would be about a 63% probability the time would be less than 55 years and a 37% probability it would be 55 years or more. Median would be 2050 (50/50 chance it will be before or after 2050). Probability is about 14% that GFC2 would occur between June 2018 and June 2025 and 86% that it will occur after June 2025.
Probability that it might occur between 2025 and 2050 may be about 50%, with 14% chance it falls before this period and a 37% chance it occurs after 2050.
Cumulative probability is 1-exp(-t/46) where t is year after 2018.5, so for 2019.5, t=1 and 46 is 55-9, since it has been 9 years since 2009 when World real GDP growth was last negative. Note “exp” is the exponential function as in e raised to the -t/46 power.
See https://en.wikipedia.org/wiki/Maximum_entropy_probability_distribution
and
https://en.wikipedia.org/wiki/Exponential_distribution
In the case I gave above lambda is 1/46.
Hi Dennis,
Although your analysis might be pertinent, I will respectfully disagree and acknowledge you may be correct in your analysis.
My reason is you cannot look at the past and extrapolate a future event, due to the fact that, the world as it is at the moment is in unchartered territory with regards to monetary and fiscal policy.
Also i question GDP being negative in two (recession/depression) intervals in modern history. GDP as a % of debt gives a better view. The worlds debt last i check was ~ $184 trillion. That is $86k for every individual on earth.
If that debt cant be serviced (and in my opinion it cant) then GDP figures need to be scrutinized. That’s my take on it.
So my “prediction” for a GFC2.0 is due to the fact that central banks around the world have no more ammunition left from GFC1.0.
Monetary policy, if there is to be an economic downturn within the next couple of years, cannot help like it did in GFC1.0. They can’t kick the can down the road much further. I think so anyways. I am probably wrong.
Iron Mike,
People often make the argument that “this time is different”, usually history repeats, that is why it is an interesting study.
Fiscal policy can be used to fight a recession.
The increase in World Debt to GDP is simply a matter of less wealthy nations gaining access to credit markets.
For G20 nations total government debt increased from 68.5% in June 2002 to 84.6% in June 2018.
See https://www.bis.org/statistics/totcredit.htm?m=6%7C380%7C669
For the US government debt to GDP went from 52% in June 2002 to 98% in June 2018 (it was 68% in June 1952). For Japan the government debt to GDP was 135% in June 2002 and 213% in June 2018, it remained above 145% from March 2004 to June 2018.
The debt to GDP is not really that important a metric, generally for mortgage lending debt can be up to 3 times income.
GDP is essentially income for a nation so total debt (private and public) can be up to 300%. For the World at present debt to GDP (public and private debt all non-financial sectors) is about 234% and it was 207% in June 2002 (200% to 240% using 4 quarter averages from start to end of data, 2002-2018). Japan has been over the 300% level since Dec 1997 and is currently at 371% (total debt all nonfinancial sectors).
Dennis,
While we can only use the phrase- ‘this time it is different’ only once in life without being discredited, I think I’ll use the card for the time of peak oil (3 yr window). That will make things more difficult. Probably a lot more.
Hope I’m very wrong, and the transition is smooth.
Hickory,
One could easily make the argument that every point in time is different as the number of variables is infinite and the possible states of the system are also infinite, so from a physics perspective the concept of history repeating seems absurd.
Every moment in time is different from every other, so the exception would be that “this time is the same” with the probability being infinitesimal.
I agree a final peak in fossil fuel output will indeed be something new and I doubt the transition will be easy, though a rapid ramp up of wind, solar, EVs, public transport, heat pumps, better buildings, passive solar, and energy efficiency as fossil fuel prices rise and incentivize these changes might aid the transition.
Guym,
Agree today’s prices will lead to many bankruptcies if they continue (or go lower) for the next 12 months.
My guess for oil price over the next few years is $70-$100/b (12 month centered average price range for June 2019 to June 2023). No doubt daily prices will be above and below this range, but I think 12 month centered average prices will be within this range with about a 66% probability, with a 17% proability it will be below this range and a 17%probability oil prices will be higher. This guess has a roughly equal worth to that of Iron Mike.
Yeah, I don’t think any of us have the moniker of oil god, and even he lost a bunch.
Looking at shaleprofile.com.
3,125 shale oil wells were completed in Permian, Bakken, EFS, and Niobrara with first flow in Q4, 2014.
In August, 2018, those wells produced an average of 39.0 BOPD. Cumulative production averaged 146,648 BO from Q4, 2014 through 8/2018.
Assuming well head price over the time period of $45 and assuming royalty of 20%. (Both generous assumptions).
117,318 BO to WI owners x $45 = $5,279,310
Assume deduction for $7.50 per BO for LOE and $2.50 per BO for G & A = ($1,173,180)
Assume deduction for severance taxes at 7% = ($369,552)
Net income through August (44 months) for these wells averages $3,736,578, using my generous assumptions as to oil price, LOE, G & A and severance taxes.
Did not figure anything for the cost of land, seismic, pipelines and other gathering and transportation.
Did not figure in gas, as it’s income contribution is pretty insignificant at prices at the well generally under $2 per MCF during this period.
Did not figure in any interest expense.
This is an illustration of, on the whole, how these wells have performed financially since the downturn in oil prices late 2014. Now figure that these wells cost on average somewhere between $6-12 million each, and also figure that now, at 39.0 BO per day gross, the net annual income at $45 well head is:
39.0 x .80 x $45 x 365 = $512,460 – $142,350 (LOE + G & A at $10 per BO) – $35,872 (severance at 7%)= $334,238.
Also keep in mind these wells are still declining and will level out somewhere around 10-20 BOPD.
I am very willing for coffee or anyone else to poke holes in the above and show me how this stuff is working financially.
Shallow sand,
For Permian, I have shown how these companies have racked up a lot of debt, it does not work well at $45 per barrel financially, those that claim it is, use a “typical” well in their economic analysis that about 80 to 90% of the actual completed wells have lower productivity.
When I say many pundits know lees than me, it is the pundits that miss this fact in their analysis and don’t see through the crap that is presented in most investor presentations.
For the Permian Basin with a $9.5 million average well cost (land, plugging, and all overhead included) a well head price of $62/b is needed to break even at an annual discount rate of 10%. The well gets shut in at 12.5 barrels per day, with cumulative output of 372 kb over 217 months for the average well completed in 2016.
Spreadsheet with breakeven calculation can be downloaded at link below
https://drive.google.com/file/d/1ilUT4cII4yKJo7H6F_z2nXBWyQGuZd0x/view?usp=sharing
If anyone looks at the spreadsheet focus on sheet 3. I forgot to delete earlier sheets 1 and 2
Shallow sand
You have to pick a play because well cost is different from play to play.
45 per barrel doesn’t work for the average well on any tight oil play. Permian needs over 60.
Keep in mind, this is with the service companies charging rates that are causing them to mostly either be bankrupt, or heading there.
Shale has broken much of the US oil industry. Really hard to grasp, but it has.
Interesting that the average production is about what I would expect from a tier three well in the EF. Not doubting your numbers, which look ok, just the cumulative production looks pretty sick.
GuyM. Those are Q4 2014 wells.
Wells have gotten better since no doubt. Looks like they would need to get about 3 times better to get close to making sense.
In any event, under normal circumstances these wells should be paying for the newer wells. Doesn’t look like they are.
I’ve been following the wells in the Eagle Ford since 2013. My first well was completed June 2015, and it measures a good tier two. They have gotten better, but a tier one will produce about 750k barrels the first two years, a tier two about 250k, and a tier three may make 100k the first two years, and after that slows considerably. So, 146k does NOT look right for an average. You make money in the oil business working, I just fight law suits (if you have it, someone will try to get it) and research, but I’m in the business.
On a lighter note, I just found on the RRC site, where they permitted 4 more wells on the first lease. They are making it longer to match the newer wells, so hopefully they will become lower tier one.
see productivity distribution for Eagle Ford at 24 months below. About 95% of Eagle Ford wells have produced less than 250 kb after 24 months.
GuyM. I am not seeing 750K barrels of oil in two years being remotely common in EFS. Are you sure about that? For that matter, that amount of production is very uncommon in PB, Bakken or any other shale basin.
I am looking at shaleprofile.com. Assuming I am reading this correctly, there are 2,917 EFS wells with first flow in 2015. Cumulative oil as of 8/18 shows 133,743 average for those wells.
I looked next at just EOG wells for 2015, as I assume they are among the best in EFS. I am seeing 336 wells. Average oil cumulative is 193,831.
I did the same thing for Bakken. 1,494 2015 wells. Through 9/2018 cumulative average is 177,197.
For Permian, I see 2,571 wells with first flow in 2015. Average cumulative through 8/2018 is 156,246.
Lastly, I see 1,483 Niobrara in 2015. Average cumulative is 90,522. That is through 9/2018
I went back to US for 2015 through 8/2018 8,556 wells 137,983 average cumulative. I then remove Niobrara and there are 7,073 with average cumulative of 150,176.
I guess give me some well names and I will look them up.
As I recall, Bakken has about 2% of over 15,000 wells that have passed 1/2 million cumulative. I don’t think EFS has had many more than that, but I am willing to be corrected if you can give me some well names.
Sorry, I meant to type 450, not 750. No, I’m not going to argue with Enno’s averages. Lot of tier threes could get it that low. That’s why some companies are doing ok, while others are sucking wind. Two years ago, EOG started the premium location program. Few wells are drilled that don’t produce close to 200k the first year. They are doing ok. Not great, but ok.
I am sure some wells do ok at current prices, but there aren’t many.
The current oil price is about where prices averaged in 2015 and 2017. I don’t see much to lead me to believe these companies can be profitable at current prices when they weren’t in 2015 or 2017.
And as I have pointed out several times, it appears the service companies could be worse yet.
Also, if you look at every well, like I have in the past, you will find even EOG has drilled some big time losers.
Frankly, I care mostly about what my wells do, and that they are profitable enough to continue to drill. I also, am concerned that oil price remains high enough, like you. I can’t get averages, because it is just too difficult with the reporting by leases of RRC. Enno’s work looks impressive, so I will go with his averages. EOG is our operator, so I keep up with mainly their operations. I’m not invested in them, nor would I want to, long term. Any mostly shale operations I would not look at as long term investments. EOG has drilled some dogs in the past, but most of that was when oil was at $100 a barrel, and they could average some. However, over two years ago, they went highly conservative, and mainly drill in premium locations. A premium location would be one that produces almost 200k the first year at normalized laterals of 5200 ft, so that they can come close to surviving at $40 oil. Why, is obvious, because at that price and production they have mostly covered their drilling costs, leaving the declining production as mostly income, and allowing them to continue to drill next year based on current year production. They have about as many premium locations in the EF, as non-premium. They sold off most of their tier three stuff to others. Part of that sold off was a small sliver of ours, which has already had two fairly good tier two wells. The part they kept, is five 640 acre tracts, on which they drilled in the old manner, one well on each. I only have a fraction of a percentage of the total, but it is pretty good gravy. Well one produced over 150k the first year, well two 175k the first year, and three through five were in the 130k area. Based on current production, the EUR on them should come close to the 300k mark. Now, the new drilling produces proportionately more than extending the lateral, due to better drilling and increased fracture stages. Loose ballpark, around 30 to 50% more. That would put our wells at probably over and close to their premium definition. They have 2000 defined premium locations in the EF, which they have been drilling over 200 a year. I expect that to pick up, and give them a little more than 5 years of drilling, which would coincide with a 2025 peak estimate. They produced about 28% of the production in the EF in 2016, based on RRC charts. So, I think it is safe to say, production will drop heavily in the EF after about five years. Cabot was a big owner west of us, and they continued to drill tier three stuff even after the price decline. I could never understand that, they had to know approximately what they would get. They finally sold out of the EF. That there is enough tier three stuff to lower the average around 2014-15, is a good probability. I just had to think about it. Other companies still continue to complete in tier three areas, and it has me confused. These are the ones your concern addresses, and I have no answer.
Guy,
For the same lateral length, it is doubtful that a similar quality rock has improved 30 to 50% over the past couple of years. The better techniques (more frack stages and more proppant etc) mostly get the oil out faster with thinner tails at the end of life. Overall EUR probably increases by 10%, maybe 20% for the same lateral length.
If the shape of the well profile for higher productivity wells is similar to the average well, then a 450 kb EUR well (at 20 years) would have produced about 55% of EUR at 24 months (250 kb). According to shale profile about 92.5 % of Eagle Ford wells completed in 2016 had less tha 250 kb of cumulative output at 24 months.
For EOF 110 of 139 Eagle Ford horizontal oil wells with first flow in 2016 had 240k or lower cumulative output after 24 months (79%). About 63% of EOG wells have less than the average 24 month cumulative of 210 kb after 24 months, median EOG well with first flow in 2016 was 181 kb cumulative output after 24 months.
See productivity distribution tab under advanced insights at shale profile (move slider to the right, it is 7th tab from left side).
https://shaleprofile.com/2018/11/05/eagle-ford-update-through-july-2018/
Well, I’ll let you know reality when it gets here? What I see happening per well is different than your account. We can analyze all we want for all wells, I only care about mine. And, so far, they are much different than your accounts. Mine made just under about 250k in the first two years, and I am pretty sure EOG would have them in their tier two category. Doubling their length should get them in their tier one category, I hope. That they are close to the upper 7.5% is something I can’t imagine. But, if you say so?
Guym.
I think the Texas RRC says so. That is where shaleprofile obtains it’s data for the State of Texas.
Maybe go to shaleprofile, find the wells you have an interest in and compare you records to those?
I have checked shaleprofile against IHS Energy and against checkstubs for interests in Wells for sale and have found the numbers to match.
Maybe you have some really good wells?
I use the RRC. Besides the fact that wells are reporting production by lease, other than by well, there is nothing you can’t pull up. But, you can pull up completion reports and compare them to lease totals to approximate production. And, by now, I can look at Initial Completion and get a fair estimate of production. The MWD report, with the completion report can tell me if they tried a Budaford. And most all of this is available on the GIS map that shows every well in the State. In short, its all available on the RRC site. I can tell where the tier one areas are, and the lousey ones. I’m in the best area in Western Atascosa, but the wells in Eastern Atascosa do better. Not as well as the Karnes Fault counties, or the wells below me in McMullen and LaSalle counties. Frio county sucks, and there were a lot of wells drilled there. So, I think I’ve got it covered with the primary data site.
I don’t doubt you have good RRC data. I read your posts.
Just not sure why shaleprofile data would seem off to you for EFS.
Anyway, something that does help you is better oil pricing in EFS than in PB or Bakken.
Hate that WTI is stubbornly $9-10 below Brent. If we had parity, we’d be doing a lot better despite this recent crash.
My concern is that WTI may have a steeper discount the last half of 2019. Bright expectation is that oil is up, overall. If the pipelines to the Permian come online, these morons will increase production. Not enough port capability to move it, so it will probably accumulate. Where, I have no idea. There is not enough storage at the coast to hold it.
And I don’t think Enno’s data is off. It’s just that I concentrate on the better areas and producers. Consequently, my mind has not assimilated the crap to average.
I did note that some of these low producers in tier three areas are now using extended laterals, and turning them into tier two wells. Past to present comparisons, is now apples to oranges.
Guym,
It’s what the RRC data says, not me.
Shallow Sand is correct you have very good wells (probably the EUR will approach 450 kb over 10 years or so) for all Eagle Ford wells drilled to date that have produced for at least 24 months (wells completed before Sept 2016) your wells are in the top 7.5 %, for EOG wells completed in 2016 n the Eagle Ford your wells are in the top 21%.
Not sure where the line is drawn between tier 1 and tier 2, only 37% of wells are above average, so for EOG wells perhaps your wells would be considered a little above average, but EOG wells in general see to be well above the Eagle Ford average.
EOG seems to consistently make better wells. They must be interjecting that “science and statistical analysis bullshit” into their workflows. How dare they!
Quiet_One,
Mr. Shellman’s problem with my “science bullshit”, is that I have never drilled an oil well, he is correct. I have changed the oil on my car many times, and put gasoline/petrol in my car’s tank many times, but clearly that does not make me an expert on oil.
Pretty sure he did not imply that science and statistics don’t matter, I think he does not agree with the way I apply them.
Funny thing is that application of the data and statistics in my models are based on input from Shallow Sand and Mr. Shellman (for royalty, taxes, well costs, operating costs, etc) as well as the outstanding analysis by Rune Likvern and Enno Peters. (Also Paul Pukite, though Mike is less impressed with that analysis, whereas in my opinion it is exemplary.)
Mike has only praise for all of the people mentioned above (my models are essentially Rune Likvern’s original Red Queen Model with economics applied to determine future well completion rates (wells that are not expected to be profitable under the oil price and other economic assumptions we make are not completed).
He also seems to miss the fact that I agree with him that if oil prices remain low (under $60/b) over the long term, that the tight oil producers as a group will never be profitable.
The main area of disagreement (in my mind) is that we have different opinions about the likely future price of oil. I think oil prices are likely to be at least as high as the AEO 2018 reference oil price case, he seems to think they will be lower than that scenario or perhaps that we just don’t know (which is correct).
Guym,
For EOG wells that started producing in 2016 an 2017 and have been producing at least 12 months, there are 402 wells in total and 320 of those wells had cumulative production of 200 kb or less (79.6% of EOG wells). If we consider wells with 150 kb or lower cumulative production at 12 months there are 257 of 402 or 64% and 205 of 402 wells have 12 month cumulative of 130 kb or less (51% of all EOG horizontal oil wells from 2016 an 2017 in the Eagle Ford).
This might be another case of some hype in investor presentations, but EOG is very much better than most other producers in the Eagle Ford. Their average well is 162 kb at 12 months, where the average for all Eagle Ford operators is 103 kb cumulative output at 12 months for 2016 and 2017 wells (2826 wells total).
Shallow sand,
You can pull up well productivity distributions at shaleprofile. See advanced insights slide to right side of tabs. For wells in the Eagle ford that have been producing 36 months or more only 3% have cumulative production above 350 kb according to data at shale profile.
So it seems there are not many tier one wells.
I think using the average output of all wells as you have done is a better metric.
Dennis.
Thanks. I forgot about using that.
So many misconceptions about how much oil these wells produce.
They aren’t that great for what they cost.
shallow sand,
Agree 100%.
Note that the EUR for the entire life of the well will be higher, a well with 250 kb of cumulative output after 24 months might be 450 kb EUR after 16 years if we assume the well is shut in at 8 b/d. The average 2016 Eagle Ford well has an EUR of 245 kb after 16 years (8 b/d and assumed shut in), if we assume 12 b/d shut in level then EUR falls to 231 kb at 12 years.
This low level of productivity is the reason I do not expect Eagle Ford will ever get back to 1500 kb/d or higher, it might reach 1400 kb/d with very high oil prices in the next few years (over $100/b before 2020).
I would also note this quote from shaleprofile.com blog for US as of August, 2018:
“The [rounded] 1,300 horizontal wells that started in Q4, 2016 appear to be so far the best performers; they have recovered an average of 160 thousand barrels of oil and are now at a production rate of 110 bo/d (from a peak rate of 570 bo/d). These are of course averages, and there are major differences between basins, operators and formations.”
I guess maybe you can email Enno Peters about his data. I am just quoting straight from it.
CLR and EOG and NBL all had losses in 2015 and 2016. They had a profit last year with oil average low 50s. They likely will this year with higher avg price.
Unfortunately you can’t point at oil price level as decisive those years because of hedges. The specific price point is concealed by that. EOG sort of doesn’t count since they have a lot of conventional. CLR is reporting a profit right now ttm (trailing twelve months).
Exxon had a profit in all of the years mentioned above.
Look at XOM US upstream earnings for those years, which they do break out in 10K and annual report.
I still argue earnings are over stated, because EUR is overstated and therefore unit cost depletion is understated.
In the future, when these companies sell the low volume wells, they will take large writedowns because there will still be a lot of BOE for each that was put on the books but has not yet been produced.
Shaleprofile has the data. Just look at the free blog. The wells are being put on the books at 7501.50 million BOE. 6:1 gas to oil.
Look at shaleprofile and see if you think this is at all accurate.
Pick any time period and plug in $45 oil and $2 gas. Subtract $10 per BOE for LOE and G & A. Subtract 7% for severance taxes. Ignore interest and land, etc. Even ignoring these, see what you think.
I have the benefit of owning interests in wells that cost 1/100 of shale wells, roughly. I cannot make them work financially at $45 oil, even though the EUR is over 10K BO, which would be over 1 million BO on 100/1 ratio.
Shale oil has pretty much destroyed the industry because it is being produced in large quantities at a loss
Harold Hamm founded SDO in the 1990s alleging that KSA was destroying the US oil industry by dumping large amounts of oil on the world market at a loss.
Ironic.
Saudis are decreasing shioments to US, and Sinopac will resume purchases of US exports, big time, soon. Inventories are dropping, now, so if you hear a large sucking sound the first quarter, it will probably be US inventories.
Cushing showed a build of 1 million between the 11th and 14th. That’s hitting oil prices today.
https://www.cnbc.com/2018/12/17/oil-markets-global-economy-in-focus.html
Overall Cushing is nowhere near what it was in the glut but the talk in market is still thinking oversupply. Bad economy?
More from shaleprofile.
Less than 7,000 2018 wells produced over 2.5 million BOPD in 8/2018
Over 8,000 2011 wells produced less than 100K BOPD in 8/2018.
Let that sink in.
Year 10.
Yeah, I have said before, they are stripper wells at less than seven years. Yet, projections still use a twenty year period.
For EF I use 13 to 15 years, but output for the last few years is quite low (15 b/d or less). After year 10 the average 2016 Eagle Ford oil well produces at about 15 b/d or less, EUR is about 222 kb at that point. At end of year 7 output is about 20 b/d (this might be considered stripper well status by some, I think of stripper at 10 or maybe 15 b/d of output), EUR at end of year 7 is 203 kb for average EF well with first flow in 2016.
Guym.
I think one of the EFS “tier three” companies is Sanchez Energy Corp. In 2014 the stock traded at $38 per share. Today it is trading at 41 cents.
The capital destroyed by shale surely is breaking records.
There are a bunch of small, and some new ones that bought up the big boys cast aways. Constantly changing.
Shallow sand,
That is all in my models so not surprising to me. That is why tight oil will peak in 2025 and be about half of the peak level within 15 years. Peak at 9600 kb/d in June 2025, output falls to 4800 kb/d by Dec 2039. Annual tight oil decline rate gradually increases over time reaching 10% by 2040, it remains under 2% until 2028.
So far in the first 8 months of 2018 2,544,937 BOPD were brought online. But overall production only increased by 559,100 in those 8 months. Legacy decline for the first 8 months of 2018 is damn near 2 million BOPD. 1,985,827 BOPD to be exact according to shaleprofile.com
So soon when they have to bring online 3-4 million BOPD during a years time just to keep production flat do you still think production will still hit 9+ million BOPD?
HHH,
The model is based on the data from shaleprofile, USGS mean TRR estimates and a set of basic economic assumptions gleaned from the work of Rune Likvern and conversations here at Peak Oil Barrel with Mike Shellman, Shallow Sand, Fernando Leanme, SouthLaGeo, George Kaplan, Doug Leighton, and Ron Patterson, along with some of the analytics I have learned from the work of Paul Pukite (aka Webhubbletelescope). Note that USGS mean estimates for the TRR of the Bakken Three/Forks, Eagle Ford, and Permian Basin combined is about 100 Gb, and if we assume Anadarko, Niobrara, and other basins might combine for another 5 Gb the total US TRR mean estimate would be about 105 Gb. When economic assumptions are applied the total economically recoverable resource (ERR) is about 84 Gb. Model shown below for mean USGS TRR estimate and oil prices assumed at the EIA’s Annual Energy Outlook (AEO) 2018 reference oil price scenario. Click on chart for larger image.
From the ND Directors Cut:
September: 40,778,467 barrels = 1,359,282 barrels/day (Final)
October: 43,148,176 barrels = 1,391,877 barrels/day (NEW All-time high)
1,334,825 barrels per day or 96% from Bakken and Three Forks 57,052 barrels per day or 4% from legacy conventional pools
Ovi,
Thanks, preliminary estimate for wells completed is 80 wells in Oct (see page 2 of director’s cut). Surprising that Bakken/Three Forks production continued to increase by about 34 kb/d over the September level. In August 130 wells were completed and in September 124 wells were completed with increases of 21 kb/d and 54 kb/d respectively.
Ok, using second month production from RRC data as actual is now officially a failure. Third month data comes close to confirming EIA monthlies for August, which is about 200k over second month totals. Pending file is decreasing, and that means the increase probably comes from established leases that have drilled new wells. The only guess I can have for Sept and Oct is that it doesn’t seem to be increasing much over August. Not completely useless, but not what I was expecting. Surely, not enough to argue with EIA monthlies.
Thanks Guym,
Not sure I understand exactly what you mean. So do you have new estimates, or do you think the EIA data may be ok after all?
Third month is what I will have to go with, and August is the latest. Coincides in August with EIA, or pretty close. Estimates when they don’t post to regular production until the third month is iffy, so I am not going to try. Pending file does not increase, regular production does. Normally regular production increases as the pending data is moved over. Very little of that for August. They actually have 90 days to post new production. Looks like they are pushing the nickel. It worked fine on second month production for almost a year, now I will have to wait for third month.
Guym,
Thanks, pretty clear now. So third month RRC data (pending plus Production Data Query) gives the best production data and so far EIA monthly estimates matches with the third month RRC data fairly well. (If I understood correctly.)
For those who have not followed this, “third month” is the data reported by the EIA from three months before the current month. So if RRC just reported data for Oct 2018 in the most up to date data, we would go back three months to August 2018 reported output from the most recent PDQ and then add production from “pending lease” data (these are reported separately for wells that have not yet been assigned their lease number by the RRC).
GuyM can correct me if I have not understood this properly.
Note that his estimates for Texas C+C output are the best around in my humble opinion.
You are correct. Three months is a long time to wait.
Guym,
Worth the wait for good data.
Some international inventories week/week changes (million barrels)
Total (Crude + Distillates): +2.25 (shown on chart)
Total Distillates: -1.81
Crude Oil: +4.06
https://pbs.twimg.com/media/DujjeBfWsAEHGBe.jpg
Some international inventories week/week changes (million barrels)
Light Distillates: -0.15
Middle Distillates: -1.41
https://pbs.twimg.com/media/Dujjyt3XcAAliSd.jpg
ARA monthly chart but with weekly data for December.
https://pbs.twimg.com/media/DujkY-VXQAERC49.jpg
IEA oil market report, latest supply demand forecast
Shows an inventory draw 2019 Q2
https://pbs.twimg.com/media/DuSRsREW4AEnwJe.jpg
from here https://www.iea.org/oilmarketreport/omrpublic/
EU & USA Inventories (Total: Crude Oil + Products)
A monthly chart but with the latest weekly point for the USA (yellow)
https://pbs.twimg.com/media/Duj45Y6X4AIxrOw.jpg
Why, would the draw not continue after second quarter?
Perhaps they expect the pipeline constraint problem in the Permian basin will be resolved, they seem to be ignoring the problem of moving the oil to ships for export which is another constraint, the information on ports is pretty spotty.
When this happens, the WTI / brent gap will grow to epic dimension.
Landlocked light oil filling every available tank at Cushing – another possibility to drill one self into oblivion.
I’m guessing that they’ve only forecast up to Q2 due to extra uncertainty beyond 6 months. Things that have been in the news
6 month OPEC deal
6 month sanctions waivers
And I guess that in 6 months we’ll be reading reports of Permian pipeline construction?
The pipeline construction that will add 2.5 million bpd more, that will have to wait until port improvements are available?
Would like to hear what you all have to say about “peak diesel”.
https://www.resilience.org/stories/2018-12-03/for-whom-is-peak-oil-coming-if-you-own-a-diesel-car-it-is-coming-for-you/
Karen,
If the article is accurate (I did not do the research needed to verify), it seems likely that diesel will become more expensive and sales of passenger diesel vehicles will fall because they will become more expensive to own and operate. As a consequence demand for diesel from passenger cars may fall, in addition more expensive diesel fuel may lead to more use of electric trains for moving freight and diesel trains rather than trucks (which are more efficient in fright moved per gallon of diesel fuel used).
In short, if diesel peaks before gasoline the economy will adjust if the market is allowed to freely adjust market prices to reflect scarcity and efficiently allocate resources.
Dennis,
If the article is really accurate, that is big news! Look at the last Chart. It says total output of refined liquids is heading down. What is the reason for that? Less oil from Venezuela and Iran?
According to the lastest IEA report diesel stocks are at a record low whereas LPG stocks are at a record high. Anybody an explanation?
Diesel fuel and heating oil are very close. Are Europe and NE US switching to natural gas for home heating as it becomes more readily available and oil furnaces break down and are replaced. Could this be part of the reason why the “fuelolio” chart started to decline around 2008?
Keep this upcoming event in mind:
https://www.forbes.com/sites/woodmackenzie/2018/09/03/will-imo-2020-introduce-mayhem-or-opportunity-to-the-refining-and-marine-sectors/#6b2dad32632d
“To comply, the marine sector will have to reduce the sulphur emissions by over 80%, which can be achieved by switching to lower sulphur fuels. The current maximum fuel oil sulphur limit of 3.5 weight per cent (wt%) is to be reduced to 0.5 wt%, VLOSD, (car ULSD contains 0.15 wt%, added by author). The new tougher limits will be the largest reduction in the sulphur content of a transportation fuel undertaken at one time.
Scale of the issue
The marine sector, which consumed 3.8 million barrels per day (b/d) of fuel oil in 2017, is responsible for half of global fuel oil demand. Most of this fuel oil has a sulphur content of between 1 and 3.5wt%, making it a high-sulphur fuel. The marine sector also consumes just over 1 million b/d of marine gas oil, which is a lower-sulphur, higher-value distillate. However, this represents just 5% of the global demand for diesel and gas oil demand, the majority of which is consumed in the heavy-duty trucking sector.”
Maritime shipping used to be bunker fuel. I had forgotten that shifted to diesel, with the shift being somewhat a redefinition of fuel oil.
Outright scarcity of it would appear to be the mechanism for shortages of food that travels by sea, which is quite a lot. Shortages of pretty much everything else in Hawaii and other islands with little or no manufacturing.
Ugo Bardi has published an email exchange between Gail and Turiel that you may find interesting: https://cassandralegacy.blogspot.com/2018/12/peak-diesel-or-no-peak-diesel-debate.html
I read thru it. I tend to sneer at posts that announce someone is indisposed because they are giving some very important presentation at some very important conference. It reeks of self promotion. Gail has her own history of self promotion so they even out.
Lots and lots and lots of redefinition. Fuel oil is not Heating Oil. Heating oil is heavier. Fuel oil itself has grades and is often equated to diesel, and that’s not legit. Diesel has regulatory definition, which is changeable, of course.
Look. Just recite it. Your only indication of Peak will be seized tankers forced to divert to other ports and gasoline station lines. Everything else can be redefined away.
I like JODI Data but there are too many countries missing. And the last 2 months are always incomplete plus there are gaps throughout, and so it’s a question of how do you interpolate the data?
It’s anyone’s guess https://pbs.twimg.com/media/DupM8zpXgAQXREj.jpg
For example, Singapore is not in JODI. ExxonMobil’s Singapore Refinery, with a nameplate capacity of about 592,000 barrels a day is ExxonMobil’s largest in the world.
Vietnam is not in JODI. Vietnam has two refineries, Dung Quat in the central province of Qu?ng Ngãi and Nghi Son in Thanh Hoa province, near to the capital Hanoi, which only started operations this year.
JODI has all of the OECD countries where new refineries are not being built but not all of the growing countries.
This chart looks like the chart in the original blog post. It’s JODI Data but with just the raw data without any interpolation and with the same 12 month moving average. The 12 month moving average has a similar drop at the end. Maybe they posted the wrong charts.
https://pbs.twimg.com/media/DupojE8W0AAaB00.jpg
For comparison this is the original blog chart which has just a 12 month moving average. It looks like they didn’t check their charts before they were posted on the blog.
https://3.bp.blogspot.com/-YcPKKz3GE-U/W_SXgFRWrFI/AAAAAAAAE4A/NkEMdV4kxk4b8Vn_DAzKSuiRkaWCiT4kQCLcBGAs/s640/Diesel.png
India fuel consumption for November (without LPG or Petcoke)((1000 tonnes/day)
November: +0.3% year/year
Up +6.8% for the year so far compared to the same 11 months in 2017
Chart: https://pbs.twimg.com/media/Dujcwy7WsAAi_oW.jpg
Consumption of Light Distillates (1000 barrels/day)
November: +11.81% year/year
Up +9.71% for the year so far compared to the same 11 months in 2017
https://pbs.twimg.com/media/DujeViTXQAMQlvZ.jpg
Consumption of Middle Distillates (1000 barrels/day)
November: -4.27% year/year
Up +3.98% for the year so far compared to the same 11 months in 2017
https://pbs.twimg.com/media/DujejGpXgAEd5CJ.jpg
India, retail petrol & diesel prices to December 15th
https://pbs.twimg.com/media/DukLlSQWkAAvPTg.jpg
A 7% consumption increase in India is somewhat normal, with last year’s 3% being an obvious aberration. Avg consumption growth since 2006 has been 5.5%/yr, which includes the slight downtick of the financial crisis.
No sign of moderation in consumption growth in the 3rd largest oil consumer in the world. Indeed, some apparent increase in growth, aka acceleration in consumption.
A few diesel relevant assays:
Azeri Light 23% May 2015
Jotun (Offshore Norway) 18.4%
Clov (Angola) 20.1%
Bakken (dated early 2017 API 43.3) 17.9%
Thunderhorse 23.4%
Above combo of BP, Exxon and Equinor
Iran finding it tough to get takers for oil development.
https://oilprice.com/Latest-Energy-News/World-News/Russias-Rosneft-Quits-Iran-30B-Of-Potential-Joint-Investments.html
Reads rather a lot like propaganda. All seems to come from a single unidentified source to Reuters.
Projects may be suspended, but it’s way too loudly repetitive as to why.
You mean a journalist would slant information to their beliefs? Horrors!?
Ok, let’s get back to the song that has the Permian overwhelming us with oil supply.
2018-12-17 Libya’s National Oil Corporation declares force majeure on operations at the Sharara oil field, almost a week after enforcing FM on crude exports from the field which are exported via the Zawiya terminal. (300 kb/day)
US credit markets dry up as volatility rattles investors
2018-12-17 (FT) December on course to be first month without junk bond sale since Lehman crash
A deal led by Wells Fargo and Barclays that backed Blackstone’s purchase of oil and gas drill-bit maker Ulterra Drilling saw little investor appetite. The banks were forced to keep the $415m loan on their balance sheets after investors refused to buy the debt package
FT (subscription) https://t.co/BI4JUEMXAC
FT front page https://pbs.twimg.com/media/Dukp1AhX4AcYg5z.jpg
Woe be it to the mostly Permian player. No price, no transportation, and no junk bonds to survive on, much less drill with. If you dance to the music, you have to pay the piper.
Confucious say, when painting the floor, paint toward the door, not the corner.
Still all the forecasts online, from Rystad and others, that US LTO can grow 100kbd/month even without pipeline capacity (Bakken, Permian), ports, high oil prices and now even without money.
Do they run on faery dust now? Chrismas elves?
Lol, pretty much. Stupid is, as stupid does. I have never been impressed with Rystad as a source of information. They constantly quote EIA projections. That will come back at them, eventually.
I don’t know what is going on, apart from saying that the Sunrise Expansion Pipeline is filling the tanks at Cushing (old news). Yes the EIA is (so far) staying with the same outlook
EIA Drilling Productivity Report
Oil production +134 thousand barrels/day in January
+73 in the Permian
https://www.eia.gov/petroleum/drilling/#tabs-summary-2
Well, you track the discounts, too. They started dropping in August, long before the expansion came online in November. What’s your guess on that? You posted the drop in completions, and the comment by the CEO of Schlumberger that completions are dropping. So, how can it keep increasing through January? Fairy dust, Christmas elves? Even if you use Dennis’ supposition that it will increase slightly if completions maintain at a certain level, that doesn’t translate to a 1.2 million barrel increase per year. If they increase completions in January, discounts may return to $17-18 a barrel. With oil at $48, they get $30 a barrel. Yeah, they are uncoordinated, and pretty slow, but that slow?
You know, it’s sort of like analyzing a train wreck after it happens. The limiter in this is the pipeline capability. They rushed into this with disregard to the limit. They, obviously, know now. If they don’t have contracts that will move the oil, are they going to increase, irrationally? The contracts to the pipeline determines who gets to move it, and who has to pay the piper.
And, I never was able to put together a clear picture of the pipeline capability, plus local refining. Was it 3.2 million before the expansion, or 3.4? The last discount rate I saw, indicates most of the discount applied to mostly using pipeline. It would be higher if a lot of trucks or trains were required. Whatever the new total is the limitation of Permian production at $48 a barrel. I’m guessing it’s in the range of 3.6 to 3.7, but not for sure.
THAT can quickly become a self fulfilling prophecy. Deal looks crummy on solvency math —- > deal doesn’t place —– > junk interest rates have to rise ——> solvency math looks worse.
https://www.rystadenergy.com/newsevents/news/press-releases/oil-gas-exploration-winners-2018/
Oil and gas discoveries with replacement ratio at 15% for 2018 (though there is typically quite a bit of growth once appraisal drilling is completed). If 2016 and 2017 hadn’t been even lower this would be pretty bad, but Rystad spin it as a significant improvement. The three biggest were gas, I think including condensate they just about came to 1 Gboe each. Ballymore in GoM and a few in Guyana were the biggest contributors for oil (recent history would suggest being a bit wary of announced deepwater discoveries in GoM – several have subsequently turned out to be busts). Rystad release doesn’t break out oil and gas in detail, that usually means the oil news isn’t great – it looks to be slightly less than half in total, which is similar to recent years.We await Wood Macs assessment – at mid year they were indicating a worse year than previous by their way of counting.
No significant GOM discoveries since Ballymore was announced early in 2018, and Dover soon afterwards. (Whale was initially announced in 2017 – then Shell “reannounced” it in early 2018). The Rystad press release referenced above gave a resource estimates of 546 mmboe for Ballymore and 183 mmboe for Dover. These are both Norphlet discoveries. One wildcat result I haven’t heard about yet is Chevron’s Twickenham. From “trendology”, you’d expect good results from Twickenham since it is located between Ballymore and Dover.
Shell’s Appomattox project is set to come online in 2019 – the first deepwater Norphlet oil development in the GOM. Industry will be watching closely. The initial development will be from Appomattox and the nearby Vicksburg field, with facility capacity being 170 mbopd. From the scout reports, not only are producers being drilled, but also injectors. Given the structural geometry of the reservoirs from the Norphlet maps I’ve seen, where it appears there will be little natural aquifer support, this is makes sense.
Wood Mackenzie – this sounds like lots of natural gas too…
2018-12-17 (Reuters) The number of new oil and gas projects will rise five-fold next year from a 2015 trough but overall spending is still unlikely to be enough to meet future demand, consultancy Wood Mackenzie said in a report.
Global investment in oil and gas production, known as upstream, is expected to reach around $425 billion next year, according to WoodMac analyst Angus Rodger.
That compares with a total spending of $770 billion in 2014, which dropped to $400 billion in 2016 and 2017.
Many of the new projects will be around gas, with a record number of liquefied natural gas (LNG) projects set to get the green light in 2019.
The LNG projects will target 100 trillion cubic feet of gas, up from 80 tcf in 2019 and 32 tcf in 2017.
https://uk.reuters.com/article/uk-oil-investment/new-oil-gas-projects-to-accelerate-next-year-report-idUKKBN1OG0LG
Upstream FIDs per year https://pbs.twimg.com/media/DumkcFlW0AAgIhE.jpg
The mid-month GoM production numbers for October came out yesterday with about 80% reporting. It looks like there will be about a 50 to 60 kbpd month on month drop. There was some impact from a hurricane but overall the well availability numbers don’t look much different from September. What is noticeable are big declines in some of the new and restarted wells that contributed to the August peak (e.g. two new wells at Marmalard and restarts of Rigel, Llano, Baldpate and Salsa). LTO like declines as high as 30 or 40% over a couple of months show up. New and restarted wells can benefit from an initial pulse because the pressure gradient in the reservoir has not been established so the pressure at the well bore is high and then declines because of the flow (decline impacts are much slower). With mature water driven horizontal wells there can be an opposite effect in that water settles at the well bore and the restart flow is lower than before shut down but I don’t think there re so many of those in GoM.
Kaikias looks to be at about 25 kbpd: above phase I nameplate and with excellent availability for a new project, even just a brownfield tie back.
Lucius caught up reporting after six months (but not for October) and doesn’t look in good shape, with current trend pointing to shut off in all three on-line leases within early next year. BOEM reports still over 130 mmbbls of reserves but Anadarko might be asking itself where it all is. Early and fast water break though looks to be a possible problem. There are tie-ins for North Hadrian and Buckskin due next year but no current drilling on Lucius. I don’t know that given current knowledge this project would ever have been approved.
Stampede has been at about 25 kbpd for three months, from four wells though one lease doesn’t look to be a great performer, also with excellent availability for a new platform, and with two rigs operating should ramp up to nameplate over the next year or so.
Jack, with Julia tie back, is now at nameplate plateau and its well availability is amazing at 100% almost every month this year, even while bringing on a lot of new production; it must be due for a major turn around soon though.
Thanks, George. So, back to around 1.7 sometime the first quarter?
Could be, depends a lot on turn around scheduling, Phoenix is due to be off station for a couple of months (maybe 30 kbpd nameplate) but its usually a busy period early in the year. I think there is about 20 to 25 kbpd per month natural decline now and they are running out of predrilled wells to make up the difference (see below – the inactive drilling numbers are the key though there might be some unreported for October; some pre-drilled wells also get counted as temporarily abandoned or non-producing but its impossible to pick those out from the many others in the same categories). In November Big Foot started, but it will be a slow ramp up, plus three wells for Blue Wing Olive (probably the best name for a field ever – geologist is a trout fisherman I’d guess) but they are likely to be small and fast declining. There are other wells to be bought on-line for Constellation, Red Zinger (another fly I think), Claiborne, Buckskin, North Hadrian and something for Pompano whose name I’ve forgotten, plus continuous drilling at Stampede and other in-fill at the big platforms,but I don’t think there’s enough to overcome the decline until Appomatox late next year (and even that might be too slow without other shorter cycle tie-backs which are a bit thin on the ground now – Stonefly might be the last, a couple of small wells).
I might do a last post early next year when its a bit clearer what is going on, or maybe wait for the BOEM reserve update.
ps “decline impact” should be “depletion impact” in the above.
Thanks, I’ll look forward to the update.
George,
“I might do a last post” – will you stop writing on this blogg? Your analysis and energy news updates are the main reasons I keep visiting this site.
Best
I’ll keep commenting a bit but I find it getting a bit repetitive and less relevant in the overall scheme of things, but thanks for the interest.
It is extremely relevant, thanks. And as far as being repetitive, it may allow time for some of the intricate detail to set in, at least for me.
Jeff,
I agree, George Kaplan’s posts and comments are enlightening.
Fed meeting
2018-12-18 (Twitter) Donald Trump
I hope the people over at the Fed will read today’s Wall Street Journal Editorial before they make yet another mistake. Also, don’t let the market become any more illiquid than it already is. Stop with the 50 B’s. Feel the market, don’t just go by meaningless numbers. Good luck!
Link https://twitter.com/realDonaldTrump
Trump views the stock market as his personal scorecard, pretty shortsighted and dumb. Very Sad!! He knows the cheap money heroin junkies on Wall Street cringe at higher interest rates. What a sad joke.
Trump knows that the FED can make or break his presidency on Thursday. Hence he is pleading with them to be dovish in their demeanour.
Well he is getting sub $50 WTI oil… thank you Saudi Arabia!!!! He would say
Sub $50 WTI might start hurting U.S shale producers more than OPEC. I predicted $29 dollar WTI next couple of years, due to a drop in demand (recession). Lets see how it plays out.
29$ WTI in a recession will not happen – at least not very long.
At 29$ all LTO companies need credit to survive and continue drilling – and in a recession there will be no junk bond financing for such companies. It’s even drying out right now – the junk bond market is on fire.
This is different to the last low oil price period where money was cheap for everyone who needed it and had at least mediocre credit ratings.
So with the current decline rates of 8% / month you can imagine what happens next. Even in a recession fuel is needed.
We quote WTI but I noticed North Dakota is priced in the $26-32 range, that’s bordering on WCS prices.
Quoting WTI:
46.22$ and still falling like a rock. Perhaps North Dakota prices go to negative soon?
$27 as of today, might as well be negative.
A guy on Seeking Alpha claims that the big guys like CLR, WLL and OAS have great deals with pipelines and are getting Cushing pricing in the Bakken.
I am sure they are getting better than posted, but what do you think about Cushing pricing out of the Bakken?
Shallow sand,
I would think there would be some cost to transporting by pipeline, so I would think it would be WTI minus transport cost. Only the big players would have access to pipelines, the smaller players would have to use rail if there is not enough pipeline capacity. I would think about $5/b for pipeline and $10/b or more for rail.
I guess Canadian oil is also competing for the pipeline and rail space which may be the reason for the larger than normal discount.
Unless the fed decides to decrease interest rates, eventually back down to zero.
A lot of uncertainty in the markets at the moment, the fed decision on Thursday is going to be very pertinent.
Chart showing previous rate raising cycles and recessions
https://pbs.twimg.com/media/DutmqNRVYAE9YqT.jpg
That’s interesting!
Wow the only difference in the last one is that the FED or any central bank in the world right now, doesn’t have any ammunition left to kick start the economy back with cheap money. Quite worrying.
Iron Mike,
In a recession, cheap money doesn’t help much, even if interest rates are nearly zero, if businesses do not see profitable opportunities they will not invest.
Fiscal policy is a better way to address an economic collapse than monetary policy.
Again i have to respectfully disagree. Cheap money is what creates asset bubbles 10 years down the line.
Cheap money is what creates equity bubbles such as the all time high U.S equity markets.
Cheap money is what the fed and other central banks use to get out economies out of recession….QE.
Iron Mike,
Asset bubbles can occur simply due to “irrational exuberance”, cheap money might be a cause in some cases, but often it is simply an overheated economy.
See page below for Fed Funds rate
https://fred.stlouisfed.org/series/FEDFUNDS
Money was not cheap leading up to either the 2000 stock market bubble or the housing bubble in 2008.
My main point is not what might cause an asset bubble (recessions can occur for other reasons than asset bubbles), though the general cause is less monetary and more excessive aggregate demand pushing the price level higher, not necessarily “cheap money” is needed, just plenty of access to credit which can lead to excess demand.
The main point is that when interest rates approach zero, monetary policy loses its effectiveness and businesses can choose not to invest because of a depressed economic environment.
One can claim that the market will correct this situation automatically (in the long run) as Classical economists claimed, but as Keynes said in the long run we are all dead (this may have been an oblique reference to a working class overthrow, a great concern to the upper class and middle class in 1936 when the General Theory was published.
Keynesian Economics is all about using fiscal policy to reduce the length and severity of economic recessions. It was used aptly by economists from 1945 to 1978, but started to fall out of favor around 1980 or so. Failure to understand the lessons of Keynes was the reason Europe stagnated for many years after the GFC. A repeat performance of the EU in response to GFC2 along with similar fiscal austerity worldwide in response to another financial crisis would lead to Great Depression 2 and possibly WW3. Hopefully economists have learned something from their poor policy performance in response to the GFC.
https://www.amazon.com/General-Theory-Employment-Interest-Money/dp/198781780X
Keynes masterpiece can be purchased for 99 cents and read with a free app, link above. Or no doubt can be found at your local library for free.
I agree Central banks try to use monetary policy to get an economy out of a recession, doesn’t work well when interest rates are zero (negative real rate of interest, which is interest rate minus inflation rate, assuming inflation rate is positive (more than zero).
And it is probably too expensive. Keynes ideas already led the world to a dead end once, because you cannot spend your way out of trouble and planned economy does not work.
You will be better served if you pay full price for “The road to serfdom” by Friedrich Hayek.
A worthy documentary on the economic history of the 20th century and the effect of the contrasting ideas of Keynes and Hayek is BBC-four “Commanding Heigths” based on a book by Daniel Yergin and and Joseph Stanislaw.
Four parts, one entertaining hour for those that like economic history and theory.
https://www.youtube.com/watch?v=l1ElI1xyS5w
https://www.youtube.com/watch?v=hT2vCeTTL80
https://www.youtube.com/watch?v=Dlm_MmDvY1c
https://www.youtube.com/watch?v=OP2QDEE45QM
Carlos Diaz,
There is a large area between a planned economy and a well regulated market system where elected officials can choose to improve economic outcomes for a nation through public investment at appropriate times.
Hayek was not a very influential economist, most of his economic theories were rejected.
I guess you need to watch the documentary. Friedrich Hayek was a Nobel Prize in Economics, his ideas were at the root of the Chicago School of Economics where he was a professor, and he was the inspiration for Margaret Thatcher, Paul Volker, and Ronald Reagan reforms that reigned in the maladies caused by Keynesian fiscal policies.
Politicians love Keynes because he tells them to spend the more the better, and voters love that. Hayek, as a firm believer in small government, cannot be very popular.
Actually, Paul Volker had to abandon Hayek, after caving to the St Louis Fed and putting his policies into practice.
He had not put the velocity of money into his analysis, and we just about went into the ditch.
If you are interested, Secrets of the Temple has a blow by blow description of this action.
Hayek, while interesting, has not proved himself in real world situations.
Carlos Diaz,
Hayek was not even in the economics department in the Chicago School, Friedman et al liked Hayek’s political philosophy, for economics his ideas were not influential.
See business cycle at link below https://en.wikipedia.org/wiki/Friedrich_Hayek
Hayek never produced the book-length treatment of “the dynamics of capital” that he had promised in the Pure Theory of Capital. After 1941, he continued to publish works on the economics of information, political philosophy, the theory of law and psychology, but seldom on macroeconomics. At the University of Chicago, Hayek was not part of the economics department and did not influence the rebirth of neoclassical theory that took place there (see Chicago school of economics). When in 1974 he shared the Nobel Memorial Prize in Economics with Myrdal, the latter complained about being paired with an “ideologue”. Milton Friedman declared himself “an enormous admirer of Hayek, but not for his economics. I think Prices and Production is a very flawed book. I think his [Pure Theory of Capital] is unreadable. On the other hand, The Road to Serfdom is one of the great books of our time”.[86]
A rather personal opinion. “A number of Nobel Laureates in economics, such as Vernon Smith and Herbert A. Simon, recognise Hayek as the greatest modern economist.”
“The “informal” economics presented in Milton Friedman’s massively influential popular work Free to Choose (1980) is explicitly Hayekian in its account of the price system as a system for transmitting and co-ordinating knowledge.”
So much for not having influenced Friedman.
Thats funny coming from a largely unknown economist famous for his racial studies and for being responsible for a monetary crisis in Sweden when he was a Government minister.
“Since the 2007–2008 financial crisis, there is a renewed interest in Hayek’s core explanation of boom-and-bust cycles, which serves as an alternative explanation to that of the savings glut as launched by Bernanke. Economists at the Bank of International Settlements, e.g. William White, emphasize the importance of Hayekian insights and the impact of monetary policies and credit growth as root causes of financial cycles.
…
In line with Hayek, an increasing number of contemporary researchers sees expansionary monetary policies and too low interest rates as mal-incentives and main drivers of financial crises in general and the subprime market crisis in particular.
…
Hayek’s ideas find their way into the discussion of the post-Great Recession issues of secular stagnation. Monetary policy and mounting regulation are argued to have undermined the innovative forces of the market economies. Quantitative easing following the financial crises is argued to have not only conserved structural distortions in the economy, leading to a fall in trend-growth. It also created new distortions and contributes to distributional conflicts.”
He would have been horrified by Quantitative Easing and the consequences that such monetary malfeasance will eventually bring to all.
Carlos Diaz,
He was influential in political philosophy, that’s what “Free to Choose” was about.
Economics, not so much.
On your comment about a planned economy, I agree. Free markets, with limited regulation to account for market failures are the best system.
The idea that markets can regulate the economy autonomously at close to full employment has been relegated to the dustbin of history.
It’s a quaint idea that does not match with the real World.
Hey he liked dictators like Pinochet as long as he could “choose” them 🙂
Carlos,Hayek was a fool who didn’t understand ecnonomics. All his predictions were wrong, because he was a doctrinaire idiot.
https://delong.typepad.com/sdj/2010/03/friedrich-a-von-hayek-as-a-possible-originator-of-the-full-as-opposed-to-hawtreys-limited-fama.html
Keynes’s predictions were all 100% correct. You have two choices: be a scientist, and follow the theory that works (Keynes, and his successors — currently MMT) — or be a religious fanatic and BELIEVE with utmost faith DESPITE all the evidence in things which are false.
You have chosen door #2. You are free to change your choice at any time, but there’s no point in debating doctrine with a religious fanatic, and Hayek-worshippers are just religious fanatics.
You could argue the real problem is the preceding asset bubbles they create by lowering interest rates too quickly, which just intensify wealth inequality and which will inevitably burst one way or another.
George Kaplan,
In theory wealth inequality could be addressed by changing the tax structure (including inheritance taxes for the wealthy), in practice that is very difficult to accomplish.
Wealth inequality is the result of an imbalance between labor and capital. Too much labor supply leads to higher capital pricing and increases wealth inequality.
Wealth inequality has been increasing due to economy financialization, increasing productivity (robotics expansion), and fast workeforce base expansion due to demographics and globalization. Quite simply, labor is being priced down in relative terms.
The study of wealth inequality throughout history leads to very depressing conclusions about what causes it to decrease.
The problem with that chart is it is way too simplistic.
In the 1980s interest rates were high to combat a high rate of inflation and slow economic growth, the various crises were due in part to oil price volatility and the World economy adjusting to constrained oil supply from 1979 to 1983 and then dealing with the crash in oil prices as new supply competed with Iranian and Iraqi oil as it came back after the war. A better chart would consider economic growth rates and interest rates. We would see then that in fact interest rates tend to rise as the economy is doing well and interest rates are increased to try to reign in inflation. Inevitably the economy starts to do poorly ( as business cycles are just a fact of life) and interest rates are reduced to increase economic growth,
rinse repeat.
The chart title has cause and effect reversed.
It’s pretty embarrassing that the president doesn’t even know that the Fed has better information and models than Rupert Murdoch’s shitty rags. Trump has literally no idea how the world works. He thinks he’s smart because he watches cable TV.
Saudi Arabia said that they supplied customers partly from inventories, works out at 207 kb/day
Saudi Arabia’s Crude Oil Stocks Fell -6.424 million barrels To 217.38 million barrels In October – JODI Data
https://www.investors.com/news/diamondback-energy-raises-spending-dividend/
ConocoPhillips capex is going to be flat, Diamondback is going to decrease drilling in the Permian, and it just bought Energen, the number 8 producer in the Permian. Budget time with a $46 WTI price is going to slow shale to a standstill, at least for the first half.
Dennis says Permian has to drop below 280 for a decline. That’s about what it was in 2017 according to RRC, so I’m not so sure, but he’s the math guru. I know if all plays cut back on completions, the result will be a decline in production. No US increase, no increase. Just declines and cutbacks from OPEC. Demand needs to be seriously negative to cope?
Guym you revised your Texas estimates for 3rd month. Correct? Could you let us know what the revised numbers are, I’m still having trouble making sense of the Eia and other production reports. Thanks.
Dc, the third month consists of only August, as Sept and Oct are not yet to third. The exact number, I don’t recall, and I am out of town with the calculations on the home computer. However, it was close to what EIA had for August monthly. I had second month for Sept. and if the third month runs anything like August, I couldn’t argue yet with EIA’s Sept monthly.
It’s now back to where I was before. The only thing printed on the EIA site that I can verify is the monthlies. For a while I questioned the monthlies. The rest is utter garbage, to me.
Thanks Guym. I appreciate the info. Have a good trip.
Flint Hills posting for North Dakota light sweet is $20.00 for 12/18/18.
ND sour is $12.50
WY asphaltic sour is just 25 cents.
That’s probably it for increases in the Bakken.
GuyM and Shallow sand,
Thanks. I agree with GuyM, Bakken probably will not increase further until oil prices go up in North Dakota, and may well decrease.
Oil prices will not go up in North Dakota.
What I’d like to see is a transportation cost estimates for moving oil from each of these fields to the actual areas of demand (in the US case, that’s west coast, east coast, gulf coast). The decline in coal was partly triggered by increases in transportation costs as the economies of scale disappeared. “Mouth of mine” coal power plants are unprofitable too now, but the locations which required transportation became unprofitable first.
So what are people going to say if the price goes low $40s, production increases and companies post losses? And then the next year exactly the same thing happens. And the next.
Er, “that’s a lot of bankruptcies”?
Yes I don’t believe chapter 11 bankruptcies stopped much production in 2016, will have to wait and see if higher rates and a weaker junk bond market do anything
$WTI-Midland at 38.99
Bloomberg chart: https://pbs.twimg.com/media/DuwquiPXcAAQfL5.jpg
EN.
Look at the EIA field crude production page, which I assume for 2015, 2016 and 2017 is now fairly accurate.
Production dropped more than 1.1 million BOPD from the 2015 peak.
The Permian frenzy appears to have been the primary driver of growth since, with US production up 3 million BOPD from 9/15-9/18.
The price unfortunately needs to drop another $10 or so and stay there for awhile, as many are hedged on a percentage of barrels in the Permian and I assume there is still quite a bit of acreage that is not HBP.
I wound up owning FANG when it bought EGN. It is down $48 pretty quickly, and has been considered one of the best independents in the Permian. I have heard claims they are profitable in the $20s so I guess maybe we will find out.
The algos have been in charge of the oil market for awhile. Wouldn’t surprise me if we challenge 2016 low, if for no other reason than short to medium term oil prices near little relation to the physical market.
When they’re profitable in the 20s, they should have now tons of cash and dividends. At the 60$ WTI they should have made much more than 50% earning from total revenue, and should be able to finance whole 2019 drilling program from cash they already earned.
Otherwise, they lied.
I really can’t fathom being profitable at $20.
Guym,
agreed.
Much of the “oil supply glut” story is based on the estimates in the Drilling Productivity report(DPR). Those estimates are based mostly on rig counts and often the rig counts do not correlate very well with the oil well completion rate, also some of the “tight oil” output in the DPR is actually from the tight oil regions covered and includes conventional oil output.
In any case I doubt the tight oil output in the US will increase very much going forward while oil prices remain under $60/b (Brent price), perhaps 30 to 50 kb/d monthly increases for all of the US tight oil sector from Dec to Feb at most and perhaps simply flat output.
The latest tight oil production estimates by play from the EIA have US tight oil output in October 2018 at about 6900 kb/d, perhaps this might reach 7000 kb/d by Dec 2018 and then remain flat at that level until oil prices rise, if oil prices continue to fall I would expect tight oil output might decrease, but my expectation is that the OPEC cuts may stabilize prices at $60/b until May 2019 and if tight oil output grows slowly (or remains flat), oil prices may rise in the summer of 2019 (to about $70/b). Click on tight oil production estimates by play or the excel link at page below for better tight oil estimates than the DPR.
https://www.eia.gov/petroleum/data.php#crude
Watcher,
Last time that happened in the US, oil output did decrease, and it will probably happen again if prices go to the low 40s and remain there. US C+C output was about 210 million barrels lower in 2016 than it was in 2015. Based on annual prices the threshold seems to be around $46/b, at $49/b and $51/b in 2015 and 2017 output increased, at an average price of $43/b in 2016 output decreased, so $46+/-3 per barrel was the window from 2015 to 2017, not likely to be fixed, it will change over time, likely higher as more difficult areas are accessed.
Westmoreland Coal shouldn’t be in Chapter 11 — they have no hope of being a going concern. When will someone file for involuntary chapter 7 conversion?
At this point, corporate Chapter 11 is basically a scheme to steal money. It means that structurally unprofitable, permanently money-losing industries survive longer in the US than in any other country, because other countries have normal bankruptcy laws.
The question is really when these moribund coal and oil companies will stop being refinanced by brain-damaged morons with more money than brain cells. I know of no way to figure out that question. Some people seem to love throwing money down holes in the ground and setting fire to it. I don’t understand it myself.
Big draw in Japanese Inventories
week/week changes (million barrels)
Crude Oil: -8.91
Total Distillates: -1.30
Unfinished Oil and Feed Stocks -1.44
Total (crude + products + unfinished): -11.66
Source: PAJ
Japanese weekly products exports (PAJ)
https://pbs.twimg.com/media/Duw_3M0W0AESWgd.jpg
What has the MSM finally woken up. https://www.rigzone.com/news/wire/permians_growth_spurt_at_risk_of_being_stunted-19-dec-2018-157751-article/?utm_source=GLOBAL_ENG&utm_medium=SM_TW&utm_campaign=FANS
Norwegian oil and gas production again missed forecasts for November, I think the gas is the main concern because of the continuing number of unplanned outages.
http://www.npd.no/en/news/Production-figures/2018/November-2018/
US Petroleum Stocks down 10.7 million barrels from previous week for week ending Dec 14.
This is crude plus products including SPR.
https://www.eia.gov/petroleum/supply/weekly/
Also Weekly crude output has been pretty flat for the past 8 weeks with an average of 11.6 Mb/d, unchanged since week ending Nov 2. Though these weekly estimates are not usually very accurate, so take that with a grain of salt.
Yeah, that makes a total of about 25 million down for the past three weeks. Gluts really taking hold, huh?
On a different note, it’s representing what ves is talking about, below. It’s not logical, but it’s reality.
It’s a slow time of year, and draws are not expected. Still, at that rate, we would not have a single drop of inventory, including SPR, in about four years. But, it will get worse after January, and by June we will hear sucking noises.
Dennis,
If I may add few words about misunderstanding between you and oilman.
First, your models and science are perfectly fine. That is not the problem of misunderstanding between you and oilman. What you don’t observe fully is this that life is not the same ever — it is constantly changing, moment to moment it is new — the expert always lags behind, his response is always inadequate. He can only react, he cannot respond.
You say if price goes by December 2018 $80 then profitability is that. But in real life price goes down to $46 and not $80 so you have to react again, and you go back to models and tweak them with new reality. You constantly react. So you make perfectly fine new model with new oil price and again for n-time arrive to conclusions and carry ready-made answers. But the questions that life raises are always NEW. Today the price of oil is $47. Mike and Shallow have to RESPOND to a new reality and you REACT to a new reality of $47 per barrel. Mike and shallow have to ACT spontaneously for every new moment of life. Their existence depends on responding, should I drill or not? That is the ONLY misunderstanding between you and oilman.
Moreover, life is not a logical phenomenon. And the majority of people live through logic; hence they never fits with life and life never fits with him. Of course life is not at a loss; the people themselves are at a loss. Peak oil ,at least in Western hemisphere, is here and price of oil is in the basement – no logic. Oil price should be sky high.
4 years ago Mr Rune Likvern asked me for my opinion on this blog for price of oil, shale so called phenomena of drilling cash into the ground, and where are we heading and I have answered him what I am answering now: Mind is logical and Life is dialectical. Mind moves along straight line and life moves from one extreme to other extreme. Drilling the last available resources in America at this speed and at this price is illogical but Life is like that – dialectical, illogical.
I am not sure if Mr Likvern understood what I was talking about but that is how reality is. Logic is very useful but If you cling too much to logic you will never be able to be part of the living process that this existence is. In 1980 every housewife around the world was dreaming for JR oilman knocking on her door due to popularity of Dallas series around the world and today being oilman carry perception of being war criminal. Of course, both perceptions are wrong since they are just projection of Mind and not rooted in reality. Merry Christmas and Happy Holidays to you Dennis.
Ves. A $125-150K per month hit to the top line in a matter of two months is the new reality here.
Thankfully I am just an investor in this mess and have a non-industry job.
I don’t mind Dennis making projections, but with oil price volatility and so many working parts, I am not sure how useful they are.
There sympathy for coal miners losing their jobs. There is enough sympathy for the farmers that they receive US government financial support.
There is no sympathy re oil producers of any station from 99% of the US.
shallow sand,
Probably not very useful in the short term, the idea is to show that the future is not likely to bring unlimited supplies of oil, so we need to prepare for a future with more expensive oil as it becomes more scarce. That is the main message.
US tight oil has been responsible for 2/3 of the increased World Oil output since 2010, recently the Permian basin TRR mean estimate by the USGS roughly doubled and assuming the AEO 2018 reference oil price case ERR (e=economically) also doubled for Permian mean ERR case from 30 to 60 Gb. The current low (F95) case has an ERR of roughly 35 Gb similar to my old medium ERR estimate of 30 Gb.
Permian basin output is about 63% of total US tight oil output, so the Permian basin alone has been contributing significantly to World output (about 40% of World C+C increase over past few years).
Interestingly a doubling of the Permian Basin ERR moves the peak date forward by only 4 years (from 2023 to 2027) in my scenarios and peak output increases from 5500 to 7300 kb/d. The low ERR case (35 Gb) is presented to show how similar it is to my earlier medium ERR case of 30 Gb.
So, shallow sand, why don’t you get out of your oil & gas investments? They’re losers. Period. All of them. Do you just have a taste for gambling?
Oil & gas is the worst performing sector in the stock market over the last 10 years. Take your money, put it in businesses with a future. There are some very safe investments in solar farms and wind farms with quite respectable returns.
Why would anyone have sympathy for someone who makes money-losing investments, which *also* cause environmental damage? Nobody would.
Ves,
Thanks and a happy holiday season to you as well.
I take as given that the future is unknown. Every individual is different and both prepares for the future and reacts to what the future brings in different ways. Epistemology and Ontology are very interesting philosophical topics which I will not pretend to have the answers to, but also take as given that there are about as many takes on what is “real” and how we “know” as there are philosophers.
As businessmen, I am sure that Mr. Shellman and Shallow Sand have their own mental models of the oil industry, when planning for the year ahead they probably have an oil price in mind that they base their budget on, my models are no different, I make an assumption about future oil prices and crank out the result, no different than making an annual budget in most respects except I guess at the oil price farther into the future.
When the guess of the future proves incorrect (change any assumption and the model result will change), the model (or budget) is adjusted accordingly. Much like Paul Samuelson, when I get better information, I adjust my models accordingly.
I was wondering about the big price drop in North Dakota and found this older article (Nov 2018)
https://www.reuters.com/article/us-usa-crude-bakken/north-dakota-oil-prices-set-to-weaken-further-amid-pipe-rail-constraints-idUSKCN1NH0FY
Looks like transport constraints are hitting Bakken as well as Permian Basin.
At current North Dakota price levels ($20/b discount to WTI or more), I can’t imagine the Bakken will continue to increase output until possibly warm weather arrives in May 2019 (rail loadings will be easier then).
Know it’s not fair to ask with the recent price drop, but considering $46 a barrel price, which shale play is going to contribute to a 600k barrel increase next year?
GuyM,
If we assume oil prices remain at $46/b, then we would not expect as much of an increase in tight oil output, note that my model is running behind the actual output through Oct by over 700 kb/d (if the EIA tight oil estimate is correct). My US LTO model only reaches the current level (6880 kb/d) by Sept 2019. So no increase would be needed for the next 11 months. 🙂
My guess is that oil prices will rise well before Sept 2019, based on your past comments, you might agree that oil prices are not likely to remain under $50/b for the next 11 months. Or your thinking may have changed.
By my logic, prices should be substantially higher, already. But, there is NO current discussion which I believes touches on reality. Oil companies have to feel the same way. Hence, my expectation of reduced capex through the first half. But, that’s using logic over future actions, which is a losing proposition. Oil prices will be volatile, and discussions over supply/demand will be far from reality. That’s a pretty good guess.
If prices remain down for a month so, then I’ll take advantage of it with BNO and BNO options. I’m in USO options, but plan to sell them before the huge WTI discount which should occur sometime in the fourth quarter,
For sure——
Ohio just released the 3rd Qtr Utica production report.
At 605 Bcf, it is a 31% increase over 2017 3rd Qtr.
170 wells over 1 Bcf, 20 over 2 Bcf, 1 at 3.6 Bcf (a 20 thousand foot lateral from Eclipse).
The expansion northwesterly into Jefferson and Harrison counties continues.
On this site awhile back, an industry professional expressed skepticism that a region could produce 7 Tcf per year ongoing as the output was just so high.
Understandably so.
Yet, the current DPR from the EIA projects over 11 Tcf from the Appalachian Basin next year.
Last week Pennsylvania released its October report with another monthly record of 544 Bcf.
You folks would be well advised to start to come to grips with the unfathomable size of this gaseous resource in the northeast as it will continue to assert massive influence over a wide swath global affairs over a multi decade long timeframe.
We could use it in Europe to replace coal until better energy arrives. Gas is much less Co2 than coal. I think this alone would be enough to completely buy all US gasy stuff for a decade or 2.
China could replace some coal, too. Here we speak about really big numbers.
Marcellus 84 TCF undiscovered TRR in 2011 according to USGS, probably another 40 TCF of cumulative production and proved reserves, so maybe 124 TCF TRR, EIA has about 309 TCF TRR and has Utica at 139 TCF. USGS in 2012 estimated mean Utica undiscovered TRR at 38 TCF, so as there was not significant natural gas reserves in Ohio in 2012, the total Utica and Marcellus TRR is about 162 TCF according to USGS and about 448 TCF according to EIA.
Note that EIA estimates are done by economists (assume a can opener) where the USGS estimates are done by geologists and geophysicists. I will leave it to the reader to decide who knows more about petroleum resources.
https://pubs.usgs.gov/fs/2012/3116/FS12-3116.pdf
https://pubs.usgs.gov/fs/2011/3092/pdf/fs2011-3092.pdf
https://www.eia.gov/outlooks/aeo/assumptions/pdf/oilgas.pdf
see table 3 from last link for Marcellus interior and Utica Gas zone core
… and as I pointed out previously, Dennis, the USGS Utica assessment from 2012 pegged the mean well output EUR at .6 (point six) Bcf over its lifetime.
Likewise the 2011 Marcellus assessment had a 1.6 Bcf EUR per well, 4 per sq. mile.
A more recent, realistic view was put forth by the consortium headed by West Virginia University in its Utica study ” A Geological Playbook ..” wherein near 800 TCF was deemed tecoverable.
Comparable, in their description, to the Mighty Marcellus.
This is South Pars/North Dome numbers.
All this, of course, does not include the Upper Devonian formations. The 2015 study by Wrightstone Energy analyzing just the Burket and Geneseo formations projected 124 Tcf recoverable using then-current production numbers which have been greatly exceeded by newer wells.
Additional productive horizons include the Genesee, Middlesex, and the Rhinestreet, all of which currently have producers.
You are correct that the EUR looks low, for 2010-2012 average Marcellus wells the EUR is roughly 5 BCF, about 9 times higher, the 2014-15 wells are a bit higher at 7.5 BCF but laterals are much longer (a factor of 3), much depends on how many wells can be profitably drilled in the sweet spots, if it is only 50,000 wells at 7.5 BCF per well, that would be about 375 TCF. Half way point would be 187.5 TCF and if we assume Marcellus output grows at 8% per year from 2018 to 2032, then peak is reached about that time, note that the 50,000 well estimate for the sweet sp0t may be a bit optimistic, given that the increase in lateral length by a factor of 3 is likely to reduce the number of wells drilled by the same factor, so 33,000 wells in the sweet spot might be a better estimate.
That reduces TRR to 250 TCF with peak at 125 TCF cumulative output (assuming peak at 50% of URR), that occurs in 2028 assuming 8% annual output increase in Marcellus output, faster growth simply means earlier peak.
Note that I do not have output data for Utica Shale, but if we assume it is similar EUR for Utica as Marcellus, then we have about a 125 TCF TRR for Utica and combined TRR for Marcellus and Utica is about 375 TCF, 50% point at 187.5 TCF cumulative. This level is reached in 2027, if we assume Marcellus and Utica continue to grow output at 12.19% annually, output reaches 72 BCF/d at peak for Marcellus and Utica plays.
Dennis
Without dismissing – just momentarily putting aside – your above stated numbers … consider doing a 2 minute ‘anybody-can-do-this’ exercise …
Pull up any of the umpteen images via Google of current US shale plays.
Take a look at the size of the Haynesville/Bossier.
The highly respected USGS pegs Haynesville/Bossier TRR at 300 Trillion cubic feet.
Now, take a glance at the size of both the Marcellus and the Utica.
(Rarely do ANY of these maps/images acknowledge that there are producing Utica wells just southeast of Montreal.
That’s Montreal as in O Canada, Montreal.
Now, you just did some number manipulation up above and came up with 375 Tcf TRR for Utica and Marcellus combined.
375.
Only 75 Trillion more than the H/B.
Hmmmm ….
USGS assessments for the App Basin should be coming out soon.
Hold onto your hats.
Coffeeguyzz,
Here is a link to the USGS Haynesville assessment
https://pubs.usgs.gov/fs/2017/3016/fs20173016.pdf
Shale gas is a “continuous” resource by the definition of the USGS, the Haynesville Formation estimate from 2016 has the continuous natural gas undiscovered TRR mean estimate at 175 TCF, considerably less than the 300 TCF that you claim. There are about 13 TCF of proved reserves at the end of 2016 and about 13 TCF of cumulative production at the end of 2016, so TRR would be about 200 TCF.
The area of the entire Marcellus and Utica Plays is pretty large, but the sweet spot areas are not very large. For Utica about 27% of area is sweet spot or about 8.4 million acres. For Haynesville the sweet spot area is about 6.8 million acres, not all that different and note that most of the resource is found in the sweet spots and these are the areas that are most likely to be economically recoverable. For the Utica the USGS estimates the non-sweet spots (63% of total area) as an average EUR about 5 times smaller than the sweet spots, where for the Haynesville periphery (non-sweet spot) the EUR is about half of the sweet spot area. Judging a shale play simply by area is a big mistake.
Utica assessment at link below
https://pubs.usgs.gov/fs/2012/3116/FS12-3116.pdf
The number manipulation is simply taking the number of wells estimated by the USGS for Utica sweet spot of 48,000. Lateral lengths have increase by about a factor of 3 since 2012 which would reduce the total wells to 48000/3=16000, if we assume the average well is similar to Marcellus at 7.5 BCF EUR we get 120 TCF (not this ignores the fact that the best areas are drilled first so EUR is likely to decrease. I also assume the Marcellus is two times the size of the Utica, which would give us 240 TCF, for a total of 360 TCF.
This is a guess, we will have to see what the USGS estimates in the future.
Dennis
Your link was the 2016 USGS Haynesville assessment.
In April, 2017, the updated USGS assessment included the Bossier to total 304 Tcf TRR.
Not gonna get into that ‘sweet spot’ acreage thing as it continues to evolve and expand on a near monthly basis. But, the productive footprint of the Marcellus is pegged at 70,000 square miles … about the size of the state of North Dakota.
Utica is a work in progress. Much higher pressures in the Deep Utica. Much greater aerial expanse.
If you have even a cursory interest in Utica potential, a quick, 2 minute read of the executive summary from Patchen and the West Virginia University should show what is involved here.
782 Tcf recoverable is their estimate.
That is a lot of gas.
Coffee. I hope if you have been investing in the Appalachian gas players that you have been short.
The only investment class in oil and gas that may be worse over the past ten years would be the service sector, particularly the drillers.
Interesting that, despite all the activity, the US onshore drillers are becoming penny stocks. I have pointed out Nabors. The rest are all tanking bad it appears.
You made a big deal out of a very long lateral operated by Eclipse Resources. Eclipse equity closed at 76 cents a share.
I am not so sure that ultra cheap oil and gas is such a great thing for the US, given we are now the world’s largest producer of both.
Shallow
I never have, nor will I ever in the future, take any financial stake in these or any other companies.
As I have stated numerous times over the years, my primary interest is in operations … who is doing what, how it is being done, who is doing it better – or claims to be.
My initial interest in this site way back when was to learn why some people seemed to think this so called Shale Revolution was No Big Deal … a retirement party, in the words of Berman.
It was quickly apparent to me that a great deal of unawareness vis a vis industry developments permeated this site’s participants.
This, alongside several predisposing factors to NOT want the shale production to explode upwards provided fertile grounds for the soon 12 to 16 million barrels per day US oil production, along with 100+ Bcfd gas production to be a spectaculsrly unforseen reality.
What I prefer or not prefer is secondary to what I believe to be occurring, shallow.
If anyone cares to spend 3 minutes reading the April, 2017 USGS press release accompanying the Haynesville/Bossier assessment, they will read the following from Walter Guidroz, Program Coordinator of the USGS Energy Resources Program …
“As the USGS revisits many of the oil and gas basins of the US, we continually find that technological revolutions of the past few years have truly been a game changer in the amount of resources that are now technically recoverable”.
Addendum … Eclipse is being shut down/folded into another entity.
The lead engineer behind their ultra long laterals is now working with the new outfit from which this technology will continue to spread.
No offense meant coffee. I know some who post here like to tangle with you. I am not interested in that, just straightforward discussion.
Shale has surprised the heck out of me, and has made me several times strongly consider liquidating my entire investment in oil and gas, absent maybe keeping just a couple of KSA like cheap (to quote PXD CEO) LOE wells to fool around with. Had I known in 2012-13 that this was coming, would have sold all but those few “piddle around with wells.” It has been absolutely no fun when these price crashes occur, and is especially no fun knowing that this shale miracle is less profitable than an operation producing less than one bopd per well from very, very old and tired wells.
You have to admit that the way the shale is being developed is destroying the oil and gas industries that are developing it.
Particularly hard hit are the service companies, many which are already bankrupt.
Even XOM, which I have owned for many, many years (prior to the merger, I owned both Exxon and Mobil) has hit the skids, having fallen through the $70 per share barrier.
Range Resources is at $10.26, a level not seen since 2004. It traded as high as $90 before the 2014 crash.
EQT was over $100. Today $18.55
Whiting was nearly $400 (accounting for a reverse split) and now is $21.98
CHK closed at $1.84. All time high was $64.
Nabors Industries, the largest onshore US driller closed at $2.09. Traded at split adjusted $10 in 1978.
Halcon Resources Corp. was over $3,000 split adjusted at one time, went Ch 11 BK, now at $1.65, looking not so good re: BK again.
We shall soon see who can access what in the way of capital to keep going assuming oil prices stay below $50 WTI for a considerable time.
I guess I am always concerned about whether businesses make money. Seems to me that would be of some importance to you, but it isn’t, and I suppose there is no harm in that.
I have yet to work anywhere where making money was not the primary motivation.
If the money wasn’t important, the shale executives would not make so much of it, I suppose.
I have always had a hard time understanding why they kept drilling wells in Appalachia when the gas was selling for 50 cents per mcf. Not important to you, but maybe to others.
Anyway, if we didn’t have different views, places like this wouldn’t be very interesting.
Hi Coffeguyzz,
You are including conventional resources in that estimate, the shale gas is 225 TCF, you are correct that I did not include Bossier, I did not see that assessment, thanks for the correction.
See slide 16 of 18 in presentation linked below
https://pubs.usgs.gov/of/2018/1135/ofr20181135.pdf
Note that “productive area” may be large, but it is not uniform, the sweet spot area is what matters. Not all estimates are accurate, the West Virginia study could have failed to account for fewer wells with longer laterals or overestimated the extent of the sweet spots. In any case about 225 BCF is the USGS mean estimate for undiscovered shale gas in Haynesville/Bossier.
A huge uncertainty on the Bossier estimate with F95=9.4 BCF and F5=127 BCF and a mean of 51 BCF. By contrast the Haynesville shale gas estimate has a lower uncertainty with a mean of 175 BCF and F95=89 BCF and F5=299 BCF.
As I suggested before I will wait for the USGS estimate.
I found the following on Marcellus (see appendices also
https://pubs.usgs.gov/of/2011/1298/OF11-1298.pdf
For Marcellus interior (best area), they estimated about 72,000 wells at 1.15 BCF EUR per well on average (mean estimate).
Since that estimate in 2011 average lateral length has increased by a factor of 3 which would reduce total wells drilled by a factor of three to 24,000 wells for Marcellus interior (mean area estimate of 28.9 million acres) with mean estimate of area per well at 149 acres ( I have increased this area to 447 acres per well). At about 7.5 BCF per well (an optimistic average estimate) we would have 7.5 times 24,000 or 180 TCF of TRR for the interior Marcellus and perhaps another 90 TCF for the Utica shale for 270 TCF.
On further research well spacing is about 1000 feet in Marcellus and average lateral length might have increased to 10,000 feet which would give about 230 acres per well, rather than the 447 acres I guessed at above. Let’s assume one third of the total Marcellus interior is “sweet spot” with an average of 10 BCF per well and the rest (2/3 of total) has an average of 3 BCF per well. The total area is roughly 30 million acres so we would have about 43.5k wells (10 million divides by 230) or 435 TCF, in the non-sweet spots we will assume wider 2000 foot spacing so 460 acres per well and the same 43.5k wells and 130 TCF, for about a 565 TCF total, again I would assume Utica is about half the Marcellus resource at 282 TCF for a total of about 850 TCF.
Taking my earlier estimate of 270 TCF, that might be an F90 estimate and the higher 850 TCF would be an F10 estimate, assuming a log normal probability distribution, the mean estimate would be about 480 TCF for TRR of Marcellus and Utica combined. If we add this to Haynesville/Bossier we get 705 TCF of undiscovered TRR and if we add cumulative production plus proved reserves (236 TCF) we get a TRR of 941 TCF. Cumulative production to the end of 2017 is about 50 TCF, a peak might occur at about 50% of ERR (probably about 85% of TRR at best). ERR=800 TCF, peak at 400 TCF with 50 TCF already produced, assuming peak at 50% of cumulative output.
If output from these four plays continues to grow linearly at the rate of increase of the past 12 months, peak output is reached in 2030 at an output of 105 BCF/d (current US shale gas output is about 63 BCF/d).
Note that it occurs to me that I may be double counting Marcellus and Utica undiscovered resources and reserves. When we account for this the ERR for Haynesville, Bossier, Marcellus and Utica is about 685 TCF, 50% point at 343 TCF with 50 TCF already produced. Doesn’t move the peak by much (2029) with slightly lower output from these four plays at peak of 104 BCF/d.
shallow sand,
I too am concerned about profitability, also there are many in the geosciences that believe the USGS mean estimates may be too optimistic (especially the most recent ones). My guess is the rapid technological developments has lead them to be a bit too optimistic about those breakthroughs continuing, if one looks at well profiles in the Eagle Ford and Bakken, it is clear that technology has limits and we cannot defy physical laws, economists don’t seem to understand physics, but in general geoscientists and petroleum engineers understand physical laws quite well.
shallow sand: I’m sorry you didn’t see this coming in 2012.
I can’t say I predicted exactly this in 2012, but in 2008 I predicted a double-sided crunch on oil profits (increasing cost of production, dropping price of substitution). I also predicted at that time that “oilmen” would continue to throw money into unprofitable exploration & drilling because they have a psychological defect which makes them unwilling to admit unprofitability.
So I divested, and it worked out pretty much the way I predicted. Though I have to say I’m surprised the loss-making shale nonsense has managed to attract *finance money* for so long. There are a lot of suckers out there.
Estimate of US shale Gas from EIA, if the rate of increase in 2017 and 2018 continues in the future (increase of 10 BCF/d each year), output would reach 175 BCF/d by 2030 (nearly 3 times current output), cumulative output would be 632 TCF of shale gas output and we would likely be past the peak of US natural gas output.
Note that that that at the end of 2017 there were 308 TCF of proved shale gas reserves and 50 TCF of cumulative output, so a total of 358 TCF of shale gas. We reach 354 TCF of shale gas cumulative output at the end of 2024 in this scenario at Dec 2024 output of 124 BCF/d.
Note that I have assumed a linear increase in output rather than exponential with a 10 BCF/d increase in rate of output each year (2017 and 2018 rate of increase was 9.55 BCF/d each year).
Lol, hard to tell. Barnett is not done, just not profitable. Eagle. Ford gas has barely been touched, and Permian area has significant purely gas areas. What is produced now is only connected with oil production.
Guym,
Perhaps, but when the oil runs low, the natural gas may not be profitable to drill unless natural gas prices increase quite a bit. After 2030, that might happen and more natural gas drilling may occur in the various Texas shale basins. Though it is possible that an expansion of wind and solar power and falling prices for electricity from those sources may price natural gas out of the market after 2035.
As far as I can tell, there is no profitable dry shale gas well in the United States. I think last time I checked they require NG prices of $6 to $8 to be profitable on gas alone. They’re *entirely* dependent on oil profits.
Unfortunately, around $5.50 gas, it’s cheaper to heat your house with electricity from a heat pump. So much for the natgas business. As soon as the oil profits are gone, it starts declining.
It needs to happen faster than it is happening, because we need to stop ocean acidification, but the financial picture is now *crystal* clear. Oil and gas is a loser business which will go to $0.
To Fernando Leanme,do you think the events in this blog post:
https://www.prepperwebsite.com/10-survival-rules/
happened or is it a beat-up?
I read through that. There is an entire sub industry devoted to doom. Quite a few blogs manage to attract advertising and make money.
As for this guy, he starts out trying to smuggle multiple bottles of vodka into the country and objects when it is seized on arrival. I’m pretty sure that would happen just about anywhere. There are duty levels.
Farther on he announces that families shave all of their hair off to eliminate “lice and crabs”and as best I know without looking it up, lice and crabs are the same thing. But then I recall the video of people pouring out of buildings during the recent earthquake, and those rather well-fed looking people walking on roads near borders to leave the country, and they all had hair.
Venezuela’s debt-to-gdp ratio is well below that of the United States.
https://oilprice.com/Energy/Crude-Oil/Shale-Growth-Could-Slow-On-Oil-Price-Meltdown.html
Note Standard Charter estimates about 374 wells to maintain an increase, which they do not say how much of an increase. I wouldn’t think it would be much. Still, by simple mathematics, that can’t exist over a year.
Guym,
My Permian model can be downloaded at link below, scenario has a low well completion rate peaking at 500 new wells per month with a peak in 2033 at 5500 kb/d.
https://drive.google.com/file/d/12JWBiFpfquy7dpRNn7xl9wCcH0MDJNPP/view?usp=sharing
This is a large file (31 Mb) and takes a while to download. “Delta wells” can be changed in output sheet on row 9 to change scenario, but only from Jan 2017 to Aug 2051.
My model suggests flat output at around 310 completions per month (May 2019). Model could of course be incorrect as there are a bunch of underlying assumptions which could prove incorrect.
The IEA doesn’t seemed worried anyway.
https://www.reuters.com/article/us-usa-iea/u-s-oil-production-to-be-equal-to-russia-plus-saudi-arabia-by-2025-iea-head-idUSKCN1OK0SJ
Note that IEA counts “total liquids” including both NGL and “refinery gains” and does not adjust for energy content. “Refinery gains” would be zero if the oil were measured by mass rather than volume and if NGL was also measured by mass, it would be closer to being equivalent in energy per unit mass as crude oil.
Using volume as a measure of several products with different densities is just not smart.
Also NGL is much less useful as a transportation fuel than crude oil products, so it is best to judge output by crude plus condensate.
The US will never reach 20 Mb/d of C+C output, we might reach 13 Mb/d at the peak in 2025, but 12 Mb/d is more likely as there will probably be declines in conventional US oil output of at least 1 Mb/d, between now and 2025.
Another day, another price slump.
One suggestion to all small producers here with hedging:
I would for you to suggest to hedge in Brent, not WTI. You can take some barrel less due to the higher price.
When next years new pipelines open, and the harbours are not ready, the WTI gap will widen when unsellable stuff piles up. So with hedging on Brent you avoid this additional desaster. In my opinion the gap can grow to 20$ or more then.
I read stuff on Zerohedge about hedge fond shifting in oil – it seams part of the slump are forced sales from a gone bad big speculation. So this shouldn’t be forever.
ZeroHedge is an irreverent site devoted mostly to libertarian perspectives and strongly against one particular thing . . . entrenched power of both major US parties.
You will not find great financial analysis in the articles, but the comment threads are loaded with two things, sarcasm and expertise. Interesting mix. Sometimes you will find a brief mention of something you can make money on. Mostly not, but sometimes there — and essentially nowhere else.
I give nothing about their rant against politics there – it’s all about financial expertise.
I watched this site the last financial crisis, and they got it crystal clear. Most mayor financial rant there proved to be true.
Another one from there, financial but very very important for all this production forecasting here:
https://www.zerohedge.com/news/2018-12-20/credit-crashing-and-its-not-just-energy-junk
Energy junk bond are 2% rate up since end of october, that’s a major earth quake! Financing is drying up fast for LTO companies. Faster than a typcal LTO well declines.
The price has been $40s for only a week or so. Time must pass before measures appear (or do not appear, but happen nonetheless) to keep money flowing to shale so that liquids flow out of shale.
We already got a blurb a few years ago when oil price was low that the Dallas Fed had instructed Texas banks to find ways not to foreclose on shale companies. It will be louder this upcoming time, probably enshrouded in some camouflage.
I know only “normal” companies.
Earning crashing into deep red normally triggers long management conferences, hectic restructuring and such things.
These companies now have red cash flow, so they relative soon need to borrow on a dried out credit market – or have to stall / stop drilling. The easiest way to stop bleeding money.
The price was $40s just 2 yrs ago. They still borrowed then. And long term money, not short term money the Fed has nudged up.
https://finance.yahoo.com/quote/PXD/balance-sheet?p=PXD
Select diff companies, select Financials and then select Balance Sheet for each. It goes back to 2015/6 and you can see how things worked.
I’ll give you a heads up on this that probably matters more than all the rest. Banks or other institutions will lend on collateral. The recent stuff from EIA and Interior about “Resources” is all about revaluing holdings. Rates go up? Credit “dries up”? All countered by increased collateral.
People never get this stuff right. If instructions have come down to lend money, reasons to lend will be found. Collateral is probably the ultimate reason. It doesn’t have to be legitimate. The stuff is created from thin air. You just have to provide something for reporters to lean on.
The difference is: 15/16 the credit market was thirsting for high paying bonds, so there was an endless supply of money from pension fonds.
Now there is a bond crisis in the making – money will not be
thrown that easy at everyone – especially energy companies.
They’ve gone from 440 to 650 basis points in just 2 months.
The bigger ones will get money, but much more expensive. The smaller ones, I don’t know.
Zerohedge is weird. It’s full of complete looney garbage, but occasionally people who know what they’re talking about it will use it to release real analysis and information because *everyone at the site is anonymous*. So it’s a good way of deniably leaking stuff which your employer would be furious about if you leaked it. But it’s mixed in with total garbage written by idiots.
USA inventories week/week changes (million barrels)
Crude Oil: -0.5
Total Distillates: -2.3
Total (Crude + Products): -2.8 (shown on chart)
https://pbs.twimg.com/media/Du5MycKWsAAZ96Q.jpg
https://pbs.twimg.com/media/Du5OA5OXcAUhggc.jpg
Some international products inventories week/week changes (million barrels)
Total Distillates: -3.65
Light Distillates: +0.74
Middle Distillates: -5.31
Heavy Distillates: +0.91
https://pbs.twimg.com/media/Du5DaDgXcAAQnKj.jpg
Some international inventories split: Light & Middle
week/week changes (million barrels)
Light Distillates: +0.74
Middle Distillates: -5.31
https://pbs.twimg.com/media/Du5EeoRW0AAYjNt.jpg
Total (Crude + Products): -12.70
Crude Oil: -9.05
Total Distillates: -3.65
Looking at World monthly data for October, Japan & the USA had the largest crude oil inventory increases. And so this chart is not representative of World crude oil inventories
https://pbs.twimg.com/media/Du5KGSRWsAAkLj7.jpg
2018-12-20 (Scotiabank Economics) Commodity Price Index
Best & Worst Commodity Performers of 2018
pdf file https://www.scotiabank.com/content/dam/scotiabank/sub-brands/scotiabank-economics/english/documents/commodity-price-index/SCPI_2018-12-20.pdf
Looks like a lot of bubbles bursting. Not likely to bounce back, so not much financing availbe to float pure Permian players. Doesn’t look good for any increase in production. Oil prices will probably stay low with Dow for awhile. Until inventories get closer to zero. Madness.
Interesting article from Goehring investment bank. They estimate that KSA remaining reserves are around 50 billion bbls, instead of the 260 b claimed. They also (surprise) think that was the reason the Aramco IPO was pulled. I also thought the Aramco IPO would never happen because they would not be able to buy an acceptable reserve report.
http://blog.gorozen.com/blog/what-is-the-real-size-of-the-saudi-oil-reserves-pt-2/2
Fifty billion does seem low, however its probably much closer than KSA’s 260.
Interesting, they are probably right.
I knew Aramco would pull out of the IPO. They are one of the most secretive companies. How you going to float on the NYSE or London SE with no transparency, which is required by law.
50 billion sounds about right in my worthless opinion. Interestingly enough that would be more or less close to the Permian basin reserves.
I think peak oil will arrive without many people noticing until after it has occurred.
A few more thoughts about the referenced Goering report.
First, the basis or their report: “We have good data going up to 2008, however after that point data becomes difficult to find.”
Does anyone else have good data on Ghawar production through 2008. Actual Saudi production data is hard to come by, and I would like to see a table of Ghawar production through 2008 if it is out there.
Based on their 2008 data they have included a Hubbert Linearization which is the basis for their claim.
Second, if their production data and linearization are correct, they have not been adjusted for improved results from better technology. I believe the multi lateral super wells Saleri described in his 2005 SPE paper have allowed KSA to recover several percent of additional original oil in place, as well as to maintain high production rates longer.
Third is that it appears many of those super wells were drilled beginning in mid 2000’s. It would make sense that the change in Saudi attitudes regarding production restraint between 2014 and now could be due to those multilateral wells watering out.
Does this still work with all this creaming technic keeping the production up? I don’t think so. This was developed with conventional oil fields and the “old” production curve.
So – we know nothing. Black box. At least they have still the ability to crank up production for a few months as they have shown.
dclonghorn,
A Hubbert Linearization on Saudi C+C output using EIA data gives a URR of 345 Gb with 150 Gb produced through the end of 2017, that suggests about 195 Gb of remaining resources and note that in many cases Hubbert Linearization tends to underestimate remaining resources. So my guess is that Saudi remaining economically recoverable resources are at least 195 Gb.
Hi Dennis, does output from enhanced oil recovery impact the validity of Hubbert Linearization? It seems to me that if KSA stopped EOR then oil production would slow.
Survivalist,
Pretty sure EOR was used extensively in the US and at least for “conventional” resources (excluding tight oil) HL gave a fairly good estimate for the US L48 onshore production.
Generally speaking, I don’t think the HL estimates are very good, it is a special case of a more general oil shock model with dispersive discovery, Saudi Arabia does not fit those special conditions very well and in my view HL may underestimate the resource, though potentially the new technology might have accelerated depletion, in which case HL would be an overestimate.
Short answer, I don’t know whether the HL is low or high, so URR 350+/-50 Gb may be about right.
Thanks for that Dennis. To put it mildly, you know more than me lol
HL doesn’t work if production is artificially constrained such as in a cartel or by environmenyal issues, Hubbert said so himself several times. In an idealised case the P/Q curve is a hyperbola which never hits zero. It shows ever increasing ultimate reserves with the largest remaining amount predicted on the day the field expires. It’s worse than meaningless. The Ghawar HL may work as what evidence there is suggests Aramco produce that unconstrained and limit overall production by resting their heavy oil fields.
Constrained production means there is no function linking reserves to flow so there is no way to glean recovery data and no simplified estimation method can work without first guessing the reserves (i.e also worse than meaningless). Aramco has the best reservoir models available so s few people know the story, which will be close to reality. MbS might not be one as he seems a bit like Trump and lives in his own, narcissistic reality.
George Kaplan,
Thanks. If output were to follow the simple logistic function, the HL would give the correct result. It is rarely the case that a nations output follows such a curve and especially so for OPEC producers as they are members of a cartel.
In a sense all we can say is that URR is more than 150 Gb, my guess is that remaining resources are more than 0 and less than 260 Gb, perhaps 130+/-130 Gb 🙂
An alternative is to use a Maxent probability distribution with 1/lambda = 130 Gb, or any mean that seems reasonable.
George thanks for the comment. I know enough to tell when Dennis is stuck in the trees but unable to see the forest. Sometimes I lack the words to tell him, which you did very well.
As for KSA, I suppose none of us will have the data to make informed estimates of remaining reserves until it doesn’t matter any more.
Since no one except the Saudi’s will have the actual data to put together a good model, we are all guessing at their future production. My guess is that they have around 80 billion bbls left at less than $100 per bbl. Higher prices will allow them more recovery.
I have been curious about KSA and its oil and gas production for years, and have a somewhat informed but not expert knowledge of their operations. My guess may be way off, it is certainly a lot less than Dennis’s 195.
I always wonder why all their biggest new upstream projects are IOR/EOR type redevelopments on existing, mostly heavy, fields. That’s a kind of end of basin life activity. Also why pursue shale gas so actively now?
George Kaplan,
Perhaps they would like to burn natural gas in the summer to power their grid rather than oil as they can make a lot more money by selling their oil rather than burning it.
A more sensible option would be to install a lot of solar power for electricity production, in my view.
One argument for HL is that for most of the 1999 to 2017 period the Saudis were producing as much oil as was profitable, what Ron Patterson calls “flat out” production. If that is correct then the HL estimate that Jean Laherrere uses to get a URR estimate of 350 Gb (200 Gb of remaining reserves) might be correct.
In any case both Jean Laherrere and George Kaplan certainly know more than me.
Not sure what your estimate for Saudi Arabia’s URR might be.
dclonghorn,
Thanks, I also appreciate George’s comment as he knows much more than me. Note that based on George’s comment I revised my guess to 130 Gb and if we took your 80 Gb estimate and the HL estimate of 195 Gb and assumed a lognormal probability distribution with F90=80 Gb and F10=195 Gb, the exponential of the mean of the natural logs would be about 125 Gb.
A better approach with large uncertainty is to use the maximum entropy probability distribution and assume a mean of 125 Gb, in that case we get an F50 = 105 Gb, and F37= 125 Gb.
F75= 54 Gb and F25=191 Gb, F47=80 Gb, F24=195 Gb.
So about a 63% probability remaining resources are 0 to 125 Gb and a 37% probability they are more than 125 Gb and a 53% probability remaining resources are more than 80 Gb and a 76% probability remaining resources are less than 195 Gb. About a 50% probability remaining resources are between 54 and 191 Gb.
All of this assumes the mean is about 125 Gb, which corresponds to a URR of 275 Gb.
Also consider Lahererre’s August 2018 estimate in paper below (see pages 98 to 102)
https://aspofrance.files.wordpress.com/2018/08/35cooilforecast.pdf
For Saudia Arabia URR he estimates 300 to 350 Gb, so for remaining reserves his estimate is 150 to 200 Gb, so compared to Jean Laherrere’s mean estimate of 175 Gb, my 125 Gb estimate used above is quite conservative.
In the past, Laherrere’s estimates have needed to be revised higher (though there is no guarantee that will be true in this case).
dclonghorn,
Interesting that you think one analysis that uses HL is ok, but another that uses readily available EIA C+C output data for Saudi Arabia must be wrong, and note that my estimate is similar to that of Jean Laherrere who gets a 350 Gb URR using HL for Saudi Arabia.
Can you explain why HL is reasonable for Ghawar (where we cannot really check the data), but not for Saudi Arabia?
Either both analyses are valid or both are invalid, you can’t just pick the one you like.
Part of the analysis using Ghawar depends on the assumption that Ghawar is half of Saudi Arabia’s URR (not sure that is correct) and we don’t have up to date data for Ghawar.
In any case, Laherrere does excellent work so I am inclined to go with his analysis which suggests a URR of 300 to 350 Gb for Saudi Arabia.
Hi Dennis.
As per my initial comments I thought 50 billion was to low but more accurate than KSA claimed 260. I see HL as more of a guide or tool than an answer. Qualitative adjustments must also be considered. I know Laherrere is knowledgeable about much of this, and more qualified to assess than me or you or just about anyone.
Of course that doesn’t mean we can’t have a guess, and now you know mine. I suppose what irritates me is when you take a guess and start assigning probabilities to it which make it appear to be more than what it is.
Thanks very much for the Laherrere link. I didn’t have access to that info, and plan on spending some time looking it over. Laherrere is a respected expert.
I do appreciate the time and efforts you spend on this forum.
Too many people in on that sort of a secret for it to stay secret. More probably Aramco themselves don’t know how much is left.
https://www.marketwatch.com/story/oversold-oil-market-will-give-way-to-gains-in-2019-experts-predict-2018-12-20
Overall, oil prices will continue to “be difficult to predict,” said Youngberg. “2019 will be volatile just as 2018 was.”
Even so, he still offered some predictions for next year. He sees WTI prices averaging $60 a barrel and global benchmark Brent averaging $66 in 2019. That would mark increases of roughly 30% for WTI and 20% for Brent from Thursday’s levels.
US stocks are decreasing at a slow time of year at about 2% a month. US will have minimal growth in 2019, in all likelihood at current or even at $60 due the current low price. OPEC plus is up to about a 1.5 million cut, so even at zero growth inventories will go away. So, an equilibrium is assured? damn, I ran out of fingers and toes, I hope that is right.
Serve Trunp and all these idiots that hate $70 oil a lesson. Current trend is $200 oil, because they’ll be fighting over the next barrel produced by Dec 2019.
Well, after the initial shock, commodities do pretty well during a period of stagflation.
GuyM
A few days back we were discussing the “average” well and I think you were a little surprised at how many wells out there have been “dogs”.
I decided to pull the median well from shaleprofile.com for the year 2015 for each of the four major shale basins. So, one half of the wells are better oil producers cumulatively, and one half are worse. There is no way that any of the four wells below have come close to payout. Therefore, it is likely very safe to say that over 1/2 of the 2015 wells in the four major shale basins have not paid out.
Bakken
Well #3305306503
Hess
McKenzie Co., ND
First Flow: 4/15
10/18 oil rate 78 BOPD
10/18 gas rate 119 MCFPD
Cumulative oil 177,978 BO
Cumulative gas 349,963 MCF
EFS
Well #4228335477
EOG
LaSalle Co., TX
First Flow: 11/15
8/18 oil rate 21 BOPD
8/18 gas rate 67 MCFPD
Cumulative oil 124,820 BO
Cumulative gas 479,165 MCF
Niobrara
Well #4900928967
Chesapeake
Converse Co., WY
First Flow: 4/15
9/2018 oil rate 24 BOPD
9/2018 gas rate 109 MCFPD
Cumulative oil 82,353 BO
Cumulative gas 336,888 MCF
Permian
Well #4238934508
Concho Resources
Reeves Co., TX
First Flow: 1/15
8/2018 Oil Rate 48
8/2018 Gas Rate 111
Cumulative oil 154,945 BO
Cumulative gas 235,616 MCF
Hopefully I will find the time later to estimate the approximate payout cutoff in each of these four shale basins. Not that I will be on the money, but I can at least give those interested a rough idea. My estimate is that each of the above wells is probably about 1/2 way to payout, assuming no extraordinary costs were incurred. Of course, in the oil and gas business, extraordinary expenses are more common than one might imagine.
2015 turned out to be a very bad year to put a shale well on.
Tier three wells, for sure. No chance of BE at the price of oil, then. EOG finished testing out its areas mostly in 2015, some in 2016 in the EF. That well is not indicative of EOG’s efforts, currently. Those areas that were not productive were dumped, or they could just let the lease expire.
Now, let’s imagine that oil stayed in the $100 range. None of these would be great wells, less than marginal, at best. Commitments to drill these probably existed 2014 or early 2015. I remember that most everyone expected oil prices to rebound until the second half of 2015. When oil prices were up, some companies were leveraging some of their good wells to test unknown areas. I lost track of how many bad wells came online, as I was following the better companies, mainly EOG. Some companies still drill the damn things, but you’d be hard pressed to find many drilled by the bigger companies like XTO, EOG, Matathon, Burlington, etc.
Guym,
In most of these plays the average well is better than 63% of the wells drilled with only 37% of the wells being better than average, in fact your “tier 2” wells are better than 94.58% of the Eagle Ford wells completed in 2015 (2759 of 2917 wells had lower cumulative output after 24 months than your wells, 250 kb from memory.) The average EFS well completed in 2015 had 119,693 barrels of cumulative output after 24 months and 63% of all wells drilled had 120 kb or less of cumulative 24 month output. Median was 106,183 barrels of cumulative 24 month output.
EOG was much better with average 24 month cumulative output of 173,624 barrels and 84% of EOG wells completed in 2015 had 240 kb or less 24 month cumulative output. Of 336 EOG wells completed in 2015 only one well had more than 430 kb of 24 month cumulative output 99.7% of EOG wells had 430 kb or lower 24 month cumulative output.
https://shaleprofile.com/2018/11/29/eagle-ford-update-through-august-2018/
Go to Advanced insights and move slider to the right to look at productivity distribution, then choose 2015 for “Year of First flow”, to look at EOG only choose EOG for operator.
I’m not arguing any of that. They had a big loss that year, but let’s not use past as a measure of the present. All had a loss that year. Wells were smaller at around a 5200 ft lateral. EOG’s cost per well was about $5.5 million. Wells are longer, and their cost has gone down per foot. While my wells may be ok, they are NOT better than 94% of EOG wells. To them, they don’t meet prime status. Prime is close to 200k bpd the first year, my best was 175k. Half of the wells they have to drill are prime. With extending our laterals, I hope they climb into prime definition. Those are facts. How they rest of the companies measure up, I have no idea. They aren’t as transparent as EOG.
Guym,
Based on RRC data that Enno Peters collects your wells (completed in 2015 I think) are better than 84% (not 94%) of EOG wells completed in 2015. We can compare your well to EOG wells completed in 2016 (228 wells in Eagle Ford) and look at 12 month cumulative compared to your well’s 175 kb. The percentage of EOG EFS wells with 170 kb or lower 12 month cumulative is 74.56%, average well 153 kb and 69% of wells had 150 kb or lower 12 month cumulative output. Of the “prime wells” with over 200 kb cumulative in first 12 months, only 15% of EOG wells make that cut.
So the point is that if your well is not a tier 1 well, it shares that distinction with 75% of EOG wells completed in 2016. If we add in 2015 wells (so 2015 and 2016 wells) your well is better than 77% of EOG wells (170 kb or lower 12 month cumulative) of 564 EOG EFS wells completed in 2015 and 2016 (average well is 142 kb about 63% of wells 140 kb or lower 12 mo cumul.) If we include 2015, 2016 and 2017 wells and consider 12 month cumulative, your 175 kb well is better than 74% of EOG wells with 170 kb or lower 12 mo cumul. Fully 83% of 2015, 2016 and 2017 wells (738 total wells completed in EFS by EOG) have 200 kb or lower 12 month cumulative output.
Looking at 2017 only, 64% of EOG wells had 12 month cumulative of 170 kb or less and the average well had 173 kb 12 month cumulative, this increase is no doubt due to increasing lateral length and more proppant and frac stages per lateral foot. For the 200 kb and lower 12 month cumulative 73% of all wells were in that category, so 27% of wells completed in 2017 (174 wells competed in 2017) met EOG’s “prime” criterion. What’s the typical EOG lateral length lately in your area?
I am sure EOG “hopes” half the wells are prime and perhaps in 2018 they were, but not in 2017, they missed by 23%, better by far than most of the operators though. For all EFS operators except EOG for 2017 wells the 12 month cumulative was 200 kb or less for 92% of wells completed (1052 of 1147 wells completed in 2017). Also looking at all operators except EOG your wells were better after 12 months than 87.45 % of wells completed in 2017 (excluding EOG wells).
Bottom line, your wells are pretty nice wells!
The prime selection involving dumping of less productive wells, and distinguishing happened the end of 2016, and beginning of 2017. Your numbers look right, but your still living in the past. And, as RRC only reports well production by lease, and not by well, anywhere, I’m confused where these numbers come from, certainly not RRC. Unless a lease only has one well.
The ones they planned for ours, and most in our area is around 11,000 ft for usable lateral. There are, in old maps, a depicture of the Atascosa Trough. Those old maps have the end point over our area. Newer maps have it further norhh, west of Charlotte. Production gives no indication the newer maps are accurate.Older maps depict the Karnes and Atascosa troughs as roughly the same trough, only broken up. I can almost trace a line from Eastern Atascosa to our area, where the wells dip down in depth, and are a little better than those above, and below. The Atascosa trough was not as defined as the Karnes, but I am pretty sure I could roughly draw a line. I think it only had a simple downward slope.
Guym,
Enno Peters does a pretty sophisticated analysis where he is able to tease out the average well profile by looking carefully at the data both of output per lease and the first flow for individual wells, it is tricky but a good programmer can take the data reported by the RRC and pull this off, it is beyond my capability, I don’t have Enno’s programming chops.
I believe other people such as Mike Shellman have worked with Enno on some of this, as Mike is very familiar with the ins and outs of the RRC system.
So at 11,000 feet of lateral, if a new well is drilled in rock similar to your 2015 well (at 5500 feet of lateral), you might expect 350 kb in the first 12 months, that would be very nice indeed.
Guym. EOG is operating the well still. There are many more than it operated by EOG which are weaker. It just happened the 2015 median well is operated by EOG.
I think after Karnes and DeWitt, LaSalle County is one of the best.
Yeah, I’m just having trouble understanding where we are coming up with production by well. Operators report to RRC by lease, RRC reports by lease, so whose coming up with production by well? There is no method of pulling a well’s production on the RRC site, it only gives production by lease.
https://www.rrc.state.tx.us/media/7520/formpr-instructions-final-02-2005.pdf
A 640 acre lease could have 16 wells per lease, bigger leases much more.
Check stubs only give production by lease. Where would that source of information come from???? I can go to the GIS map and pull up the individual well production, but it will only give me the total production of the lease, it is not by well. So where are these mysterious numbers coming from? Ok, I found it on shale profile site, they are just estimates based on well tests (e.g. completion reports). Ok, you can use this to analyze performance per well, but I won’t buy it. These are really tricky to use as an estimate. Depends on when the well was tested. Within three days of completion, or two months after completion? What’s the gas ratio, water output, pressure? Geeze, that’s a shot in the dark. I have seen some of the EOG poster children based on IP rates peter out in a year, and some really dog IP rates keep on pumping to surprise all. So, in essence, the initial production and current production are just wags. If you’re going to use these for analysis and projections, caveat emptor.
Yes, there is a section in LaSalle and McMullen that is pretty good. High API, but pretty good. Better than mine, but our API is running about 34, which ain’t bad.
Case in point. Here is your completion report for the EOG dog listed above. Initial completion was over 1800 barrels a day. It is a Naylor Jones lease, which is usually a fantastic lease in the best area of LaSalle. It’s part of at least six wells in a lease. The listing above is obviously a mistake. How many mistakes are there?
http://webapps.rrc.texas.gov/CMPL/viewPdfReportFormAction.do?method=cmplW2FormPdf&packetSummaryId=148974
Note, the API is 44, higher, like I said. If I was going to estimate production on this one, it would be premium, at over 200k the first year. It has every expectation of being good, tested soon after completion, so water is a little high stopping some oil, gas ratio is fantastic, so it should pump good for a good while without any lift, but Enno has it listed as a dog. With one of these, I’d expand my kennel. It was only about 7000 ft long, not 11,000.
As I said, caveat emptor. To his credit, the Concho in the Permian was a barker. But some amount of gigo is expected with these types of estimates.
Guym. I believe shaleprofile is accurate with regard to Naylor Jones 57.
I decided to look at IHS US Data Online. I pay for it.
IHS shows that Naylor Jones has 5 wells. Wells are numbered 1H-5H. 1H commenced production in late 2014. The other 4 commenced production in early 2015.
It is my understanding as Texas RRC reports by lease, it is necessary to use algorithms to obtain specific well production. Therefore, IHS and shaleprofile may not completely match by well on a multi-well lease, but the totals of the wells will match, as both source data from RRC.
Here are the IHS oil cumulatives in BO for the wells, though 9/30/2018, which is one month more than shaleprofile, which has data for EFS through August:
1H 128,261
2H 149,065
3H 133,347
4H 141,781
5H 200,953
So, looks like for the five wells cumulative of 753,407 BO, for an average of 150,681.4 cumulative BO per well.
In 9/2018 the five wells produced 6,329 BO, 210.97 BOPD, an average of 42.19 BOPD per well.
The well I highlighted is 3H. So, IHS does show more BO cumulative for that well than shaleprofile, but they both show the same for all 5 wells per RRC.
Maybe I am not following what you mean by, “it is a mistake.”
I have found the shaleprofile data to match the IHS data and the RRC data. The only thing that differs appears to be IHS and shaleprofile allocations per well for a multi well lease, where RRC does not separate the lease production by well. Even then, IHS and shaleprofile are usually very close.
But, the multi well lease totals are the same, so aggregate data is 100% on the money. At least to me it is, and I have been looking at shaleprofile since it launched.
I just did a search of EOG 2017 Eagle Ford wells on IHS. There are 239 wells, all are active, all had first production between 1/1/2017 and 12/31/2017.
76 of the 239 wells have cumulative oil production greater or equal to 200K BO.
30 of the 239 wells have cumulative oil of less than 100K BO.
79 of the 239 wells have cumulative oil of 100-149,999
54 of the Wells have cumulative oil of 150-199,999.
So, pretty clear hitting less than 200K in 12 months on the majority of their wells.
80 of the wells were at or below 100 BOPD in 9/2018.
85 of the wells were 100-200 BOPD.
37 of the wells were 200-300 BOPD.
17 of the wells were 300-400 BOPD.
8 of the wells were 400-500 BOPD.
3 of the wells were 500-600 per day.
2 were 600-700.
1 was 700-800.
6 were over 800 BOPD in 9/2018.
Of those 6, 3 are on the McCollum A Unit in Gonzales County and 3 are on the Lynch Unit in Karnes County.
Lynch Unit 4H is a monster. 628,317 BO and 1,038,797 gas cumulatives. First production was 6/17. Maximum monthly production was 7/17. On shaleprofile it is the number 2 cumulative well out of 1,881, being beaten only by a COP well in DeWitt Co.
There are monsters out there. Most aren’t.
You are correct. All wells started off like wildfire, slowed to about 100k for the first year, and then crawled.
Thanks for all the info. I will pass that on to others I’ve been feeding the EOG propaganda. Impossible to get on the RRC site. No wonder they want to drill more wells. Actually, really interesting, as probably the new wells will all probably do better than more than 50% of EOG wells, at worst case. Only about thirty more after these four. Thanks!!!!
Actually, I am the happiest I have ever been to look like an idiot, thanks, again.
Guym.
You are not looking like an idiot.
It is tough to follow strictly on RRC because of the many multi well leases.
Seriously, you should look at shaleprofile free blog. Easy to use.
EOG has above average wells. No doubt about that. But maybe not quite as good as the investor presentations. Which isn’t unusual it seems.
Shallow sand and Guym,
Thanks for the excellent discussion.
Shallow sand,
Using the average well makes more sense when evaluating the entire play. The productivity distribution is skewed so the median is not very close to the average well.
Let’s say you own a company that drilled 120 wells in 2015 and for simplicity we will take the average well cost at 10 million. If your 120 wells match the average of a typical tight oil play, your median well might have a cumulative of 150 kb, but your average well would probably be 200 kb.
It is better to do the analysis month by month, but lets assume an equal number of wells were completed each month. I think you can see why if you were looking at your financial results for your business that the average well profile would be more important than the median well profile.
Dennis.
I just pulled the median wells to make an illustration. I used cost estimates from what I see in 10K and 10Q. Nothing scientific. Just trying to show how far away from reality many are about these wells.
Guym, really should look at shaleprofile. The free part has a ton of if data.
The point, of course, is that no company will disclose how many of its wells have paid out, even if land, interest and some other expenses are not included.
There is an obvious reason. The majority have not paid and and will never payout over a financially accepatable time horizon.
I am concerned a lot of tech might just be similar to shale. A whole lot of CAPEX spent on promised returns that are wildly exaggerated.
Shallow sand,
Just a suggestion for the future, better to pull average well output, just like one would when doing a financial analysis. You do see that you would use average cost and average output if you were doing a quick summary of your financials right?
Otherwise you look like you are cherry picking by using the median cumulative output, I don’t think that is what you are actually doing, but with a skewed distribution mean is more useful than median.
Consider an elevator with 10 children who weigh about 70 pounds and 5 adults who each weighs 300 pounds, you have 15 people with a median weight of 70 pounds, you wouldn’t want to base the strength of your cable on median times number of people as the cable would only need to support 1050 pounds times some safety factor maybe 2 for 2100 pounds. The mean weight of the group would be more useful at 147 pounds, note that the total passenger weight is 2200 pounds, so the median wouldn’t have cut it even with the safety factor of 2, using the mean we would have a cable that could hold 4400 pounds and we could almost carry 15 300 pound people (if they could fit in the elevator), but we would be in good shape with a 200 pound average person.
Dennis. I understand where you are coming from.
However, also thinking a few monster wells skew the average too, and it appears that just a small number of companies tend to have the monsters because they are almost all located in a tiny area of the Basin.
For example, EOG tends to have had monsters is both the EFS and Bakken. So maybe EOG won’t fail, but where does that leave the rest who don’t have any of those 500K plus monster wells?
I guess I’d like to know how the Tiers are defined. I had always assumed it was top 1/3, middle 1/3 and bottom 1/3.
I picked the middle of the middle, or not.
I understand your point, and your point makes sense across the entire basin. However, if there are, for example, 50 companies in a basin, and only four benefit from having some monsters, how should we analyze the remaining 46?
Maybe we should remove the top 5% and bottom 5% and average the rest?
Shallow sand,
I think you are over thinking it.
You have seen my models, they are based on a very simple concept average well profiles times number of wells completed laid out in a spreadsheet, it’s not perfect but it’s not far off the mark. I simply take the yearly average well profile data and fit a hyperbolic well profile to the data, when the annual decline rate reaches 10% per year I switch to exponential decline at 10% until well output falls to 8 b/d and assume the well is then shut in, this is modified slightly when the economics is done as the net revenue for any month must be at least 15,000 for the month or the well is shut in (if prices are low the well might be shut in at more than 8 b/d).
Not sure there is a clear definition of tiers. Think I would define them as fairly profitable, profit has to wait awhile, and not sure we should have drilled this one. Price has to be a function. EOG has defined their premium (tier one) as one that would be profitable at $40, which by their further definition needs to produce 200k, or close to it the first year. You and Dennis say that is a very small percentage based on Enno’s site, I say that a look at enough completions to say it is not uncommon. I think I trust the RRC site over Enno. So, at 200k the first year, a conservative EUR would be 450k. Tier two, profitable after awhile? I think it would have to produce over 100k the first year, and EUR would have to be 250k to 450k. And if it only eeks out 80k the first year, then someone made a mistake to drill there, and we need to find a human sacrifice to appease the oil gods. Although, at a $100 oil price, no human sacrifice is needed at 80k bpd the first year. Maybe no promotion, but heads are safe. My rough guess on Tier three areas for the EF, is most of Frio, half of McMullen and Lasalle, three quarters of Atascosa counties are tier three, while most of the Karnes trough are safely in tier one and two. The other counties? Gas.
I’d have to correct the above, in that most of the tier one wells reside in the imagination of EOG. They will produce about as much as the phantom wells of EIA.
Shallow sand,
Excellent point, I would do it by taking the average well productivity of each company, shale profile allows you to pull out the “monster companies” such as EOG and then just look at all other companies (that way you don’t have to analyze 500 companies, maybe do the top 5 producers and then “all the rest”.
I prefer to just look at the entire basin (as it’s too much work to look at 6 cases). So I do Permian, Bakken, Eagle Ford, Niobrara, and “other US LTO” or 5 cases in all. (I could do top 3 producers and all the rest for each basin, but then I need to do 20 cases instead of 5).
See comment above.
Actually, with clearer info on EOG’s performance, I would venture to guess that EF is past peak, and will never get close again to the old peak. And, I would guess total EUR is between 3.5 to 5 billion of oil, half of what I estimated before.
Guym,
Thanks. I agree Eagle Ford is beyond peak, but cumulative production plus proved reserves is 7.3 Gb at the end of 2017, often there are probable reserves that are about 30% of proved reserves (4.8 Gb in this case) which would be another 1.4 Gb if the 30% guess is correct, that would bring Eagle Ford EUR to 8.7 Gb, my model using the EIA’s AEO 2018 reference oil price case is pretty close to this estimate with 8.8 Gb and 35,000 total wells drilled (through Oct 2018 I have about 15,000 total oil wells completed in the Eagle Ford play) and cumulative output of 2.9 Gb. Average new well EUR is assumed to be 245 kb in Jan 2016 and well cost assumed to be 6.7 million in 2017$. In Jan 2017 new well EUR increases to 258 kb and it is assumed new well EUR starts to gradually decrease in Jan 2019.
Although 245 kb for average EUR may seem low, the average 2016 Eagle Ford well had 129 kb of cumulative output after 24 months, my “model” new well EUR for 2016 has 24 month output for the average 2016 well at 136 kb at 24 months.
Note that I found a mistake in my spreadsheet so my Eagle Ford model is a bit too conservative and need to be revised. That revised model is shown below, ERR=10 Gb, 43k completed wells.
http://www.pemex.com/en/investors/publications/Indicadores%20Petroleros%20Archivos/eprohidro_ing.pdf
Mexico decline is accelerating – November down 55 kbpd total liquid, 47 kbpd crude.
Anybody know if they’re chasing condensate across the border from the Eagle Ford. That was on someone’s agenda a few years ago.
US consumption (Finished products without LPG)
Up an average +230 kb/day or +1.51% in 2018 Jan to Sept compared to the same 9 months in 2017
https://pbs.twimg.com/media/DvBZffvXQAABp89.jpg
A long term chart for the same numbers as used in the seasonal chart above
https://pbs.twimg.com/media/DvBaWJpXQAAAp23.jpg
Liquefied Petroleum Gases (not included in the charts)
Up an average +315 kb/day or +12.75% in 2018 Jan to Sept compared to the same 9 months in 2017
US consumption in 2018 Jan to Sept compared to the same 9 months in 2017
Finished Motor Gasoline
Average -15 kb/day or -0.16%
Kerosene-Type Jet Fuel
Average +50 kb/day or +2.98%
Distillate Fuel Oil
Average +222 kb/day or +5.70%
Residual Fuel Oil
Average -26 kb/day or -7.71%
US oil consumption last year rose about 1.3% as I recall. Those numbers suggest a similar amount.
India crude oil imports for November 4,139 kb/d
Down -832 kb/d month/month
Up an average +223 kb/d or +5.2% in 2018 Jan to Nov compared to the same 11 months in 2017
Chart https://pbs.twimg.com/media/DvDipi7WsAAMhaJ.jpg
Refinery crude oil processing for November 5,136 kb/d
Up an average +181 kb/d or +3.7% in 2018 Jan to Nov compared to the same 11 months in 2017
Chart https://pbs.twimg.com/media/DvDi0EKWsAApmfL.jpg
https://oilprice.com/Energy/Oil-Prices/UBS-Expect-80-Brent-Next-Year.html
Swiss UBS is rather bullish: its head of asset allocation for APAC, Adrian Zuercher, says Brent crude could rebound to US$70 and even US$80 a barrel over the next 12 months.
…
UBS is not the only bullish bank: Goldman Sachs also expects oil prices to recoup some of the losses they suffered in the last couple of months next year. JP Morgan, however, last month cut its Brent crude forecast from US$83.50 a barrel in 2019 to US$73. Citigroup, for its part, is in the middle: the investment bank does not expect huge changes in oil prices next year as rising production in the U.S. would offset the OPEC+ cuts. Citi expects Brent to average US$60 a barrel.
So basically $60 to $80/b for Brent by the end of 2019 according to some energy analysts. These seem reasonable to me.
Well, Brent has always been the big discussion, but what’s going to affect US production is WTI. It’s been fighting around a $10 a barrel difference, now. But, that’s going to go up. Cushing has been increasing, with good reason. Pipes to the coast are pretty much maxed out, and they opened a pipeline that can move close to 300k from Midland to Cushing Nov 1. Discount will probably increase to Brent. Let’s say Brent is at $60, and the WTI discount goes to $15. WTI gets $45, but it cost to get it to Cushing, so midland price is lower than $40. So, it’s a limbo question, then. How low can you go, before you fall on your ass? And, you can quote all of the BS about Permian profitable at $40. It was there, before, and all operating there lost their butts.
And, if they open 2.5 million bpd of pipeline the last quarter, all WTI will be in the toilet, including MEH. No way to ship that much out. It went over 3 million a day, recently, but only due to LOOP loading three VLCCs. LOOP can not always do that, because it goes both ways, loading and unloading. Best average, is going to be under that, let’s say 3 million as a generous total. It’s almost there with what is currently being produced.
Guym,
The Permian needs $62/b at the wellhead to breakeven (which I consider earning a 7% ROI as “breakeven”). Do we have any information on port capacity, it seems there is a serious logistical problem in the Permian basin, too much light oil for refineries and no way to move the oil to ships or refineries that can utilize the lighter oil. Until the problem is addressed by the US oil industry, tight oil may be stuck at 7 Mb/d.
I assume these analysts expect the Brent to WTI differential to remain about $10/b, if the GOM ports get the ability to export more oil then the WTI/Brent differential may approach zero. Probably will take 5 years to accomplish that, about the time that US LTO will be at its peak of about 9 Mb/d, it would make more sense to slow down the tight oil output and have a longer plateau at about current output levels an there will be less money wasted on building export terminals that will be idle in 2030 due to the decline in tight oil output. Someone needs to talk to the RRC and get them to reduce the allowables in the tight oil fields, rather than depend on OPEC to do their job for them. 🙂
I think it will be decreased, but probably not due to RRC. I think the college of hard knocks will kick in for these idiots. Bad pricing in the meantime.
GuyM,
You are likely correct, RRC would never try to control output the way they did from 1935 to 1970, not politically popular, but it would be the right thing for the oil industry. I imagine there will be a big push to get the port situation sorted.
Found this
https://www.hellenicshippingnews.com/gulf-coast-vlcc-loading-projects-move-forward-amid-rising-pressure-to-export-us-crude/
A couple of projects in the works, not a clear estimate of total capacity, one to be finished in 2020 and the other in 2021. In the mean time, prices may be pretty low in the tight oil plays in Texas, so perhaps flat output until 2020 for Permian and Eagle Ford (which you have been saying for quite a while). If oil prices rise, output could increase, it is really hard to figure out what will happen to prices.
Also
https://www.tulsaworld.com/business/energy/shale-boom-raises-specter-of-gulf-coast-oil-terminal-glut/article_29893a98-46b0-5656-bee8-e5dea9843066.html
and
https://newsok.com/article/feed/4033843/enterprise-to-develop-offshore-texas-crude-oil-export-terminal
There is another offshore VLCC loader being permitted for the Brownsville area. Where, exactly, I have not found out, yet. Small print on most of this stuff shows it will not have significant capability by end of 2020 or into 2021. More docks available by early 2020, and some storage area. Just too late for 2.5 million in pipeline capability. First glance, they try to say the problems being removed, but even six months is too long, and two years is howling and gnashing of teeth. Zoo time.
A lot of the EF can be mixed with existing refineries (my API is 34). The majority of Permian has much higher API, and is useless to most refineries. It must be shipped. Such an idiotic solution. They can build new refineries that can, at least, produce a lot of good gasoline and naphtha, and build them all over the place. We will never be oil independent, but we could hedge against bad times for awhile.
If they try to use the new pipelines without shipping, we will need a storage location about four times the size of Cushing. Every time I try to wrap my head around this, I, well, I can’t. Is there anyone in the oil business that sees any, I mean any sustained thought process in this mess????
WTI down again today. If this persists, then the extra 300k oil going to Cushing from the Permian could be offset by drops on Okla, Bakken, and Canada going to Cushing, so WTI spread could be saved until year end.
I want higher oil prices, but right now, I am rooting for oil prices to go down. US oil production needs to look so sick, that EIA and IEA will quit this damn Permian song, forever. It’s obscuring reality, big time. Ok, the verse has changed from the Permian to US shale, all the easier to remove this song from elevator Muzak.
GuyM,
If oil prices remain where they are for a few months it will be pretty clear that Permian output will not increase, South Texas Light was at $35/b three days ago, nobody is making any money at the typical wellhead prices right now in Texas. Completions should drop like a rock by Feb or March (if it has not already begun). RRC reports about 450 new oil completions in Permian Basin Region (some of these may not be tight oil) in November 2018. In August they reported 296 new oil well completions for Permian region (districts 7C, 8 and 8A). Strangely shaleprofile has 332 wells with first flow for Permian in August 2018, but that includes New Mexico so perhaps it makes sense. In June 2018 RRC reported 521 new oil wells in the Permian basin region.
https://www.rrc.texas.gov/oil-gas/research-and-statistics/well-information/monthly-drilling-completion-and-plugging-summaries/
GuyM,
I think storage facilities may be a much less capital intensive than building refineries, there is not really enough of the light tight oil to make the investment in a refinery pay out.
Consider Permian Basin, with maybe 60 Gb of output, the big refineries in Texas can handle about 600 kb/d, so if Permian produces 5 Mb/d (about 2 Mb/d over current Permian LTO output) we would need at least 3 such refineries to handle the extra 2 Mb/d. It is not clear these refineries would be profitable, but if they were, someone would build them, also existing refineries could be modified to handle the lighter crude, but that might be very expensive. It seems the oil industry has decided that the most sensible path forward is to export the oil.
An explanation of some of this from Robert Rapier
http://www.rrapier.com/2017/10/why-the-u-s-exports-oil/
I just read in some article that some IEA fellow predicts that total U.S. oil output will elapse Russia’s and Saudi Arabia’s COMBINED output by 2025! What do people on here think about that?
I think if the oil price stays about where it is, Columbia’s production may be higher.
And he is serious.
https://oilprice.com/Energy/Crude-Oil/IEA-Chief-US-Oil-Output-To-Near-SaudiRussian-Production-By-2025.html
Sigh! Morons. Serious case of denial. According to their predictions, if US oil does not get that high, we will have a serious supply/demand problem. So, they have to predict that, or acknowledge some imminent disaster scenarios. Ergo, insert head into sand.
In such a scenario oil would stay under $60 till 2025 and beyond. Probably would go under $40 and stay there. But then again if your goal was to keep oil under $60 that is the kind of thing you’d be predicting weather or not it has any basis in reality.
Citi Bank is also goal seeking.
If you go look at spot price CL chart and draw you a trendline off the top of the 2008 highs which is the trendline oil slammed into at the beginning of this most recent downturn. And if you understand time and distance. You’ll see that price won’t challenge that trendline for another 2-3 years. Oil will stay below that trendline another 2-3 year is best case scenario. Could make a new lower low an be 5 years before that trendline is revisited.
The article writer must have been hanging around with Larry Kudlow again.
And probably having a few lines—-
Where do they find these people?
If you follow that trend line, you can expect to see declining production.
Guym,
Many people seem to believe the nonsense that tight oil is profitable at $40/b. A quick look at 10K’s for oil companies in 2016 should convince them otherwise. The tight oil producers in the “best basin”, which is the Permian basin based on well productivity need about $62/b or more to be barely profitable (just able to make a return equal to the average return of investing in the S&P500).
Most people don’t get this, it seems that a bunch of the big banks get this and are predicting higher oil prices (60 to 80 dollars per barrel in 2019). This may not occur in the US due to inability to get the oil to World markets and the lack of refinery capacity that can use the light tight oil (LTO).
A long time ago the oil business was about turning oil into cash, but since the arrival of shale the oil business has devolved into the act of turning cash into oil. This state of affairs is at odds with capitalism, although, it is a natural outgrowth of an easy money mentality. Don’t get me wrong, I am not saying money can’t be made in shale, I believe money can be made in shale at the right oil price since shale is a marginal resource and only works at the margin. There is no doubt in my mind that shale resources would have been tapped sooner or later, but the ferocity with which they are being exploited today, despite low prices, is product of prolonged excess liquidity and to a smaller extent the product of OPEC keeping prices at $100 longer than they should have been. Nonetheless, whether we like it or not, this marginal resource is being developed at a frantic pace, but the pace of this development is bound to slow as interest rates rise, liquidity dries up and oil prices remain relatively weak.
Modelling global oil supply in the age of shale is a tricky business since, unlike conventional resources, the development cycle for shale is compressed in a 6 to 9 months interval and is subject to a number of variables: access to capital, cost of capital, service costs, infrastructure development (pipelines, NG handling), price of oil, hedging, technological development and the extent of sweet spots. I am of the opinion that the oil market will continue to exist in this troubled, volatile state, for the next 2 to 3 years, and so until shale oil matures to a point where 1m+ annual growth becomes an impossibility, aka until decline rates overwhelms drilling/completions, at that point shale will become a floor price balancing mechanism, with production declining as prices dip under $50 and rising back to their previous peak once prices cross above $60, however due geological and logistical limitations shale can’t act as an upward price balancing mechanism since once it peaks it can’t react to higher oil prices in any meaningful fashion.
OPEC is probably 3 years away at the most from regaining control of the market, I expect OPEC+ to continue actively managing the market until that point in time when shale growth stalls, once it becomes clear that shale is unable to grow meaningfully, the OPEC-Russia alliance will likely disband as the need to counter shale becomes mute. The peaking of shale will likely lead to the return of the $100 era, and so until demand growth slows enough in the 2030s/2040s as electrification takes a larger share of the transportation market.
Global oil exports peaked in 2006 and has been on a 37 mbopd plateau for 12 years. During this time global oil production has increased by about 10 mbopd. Exportable oil will likely go to zero sometime in the 2030s/2040s. Not going to be a Global market for it even though everybody must have it. You’ll have a local price for whatever is being produced locally or within the borders of whatever country you reside in. Anything extra will have to be taken by force. World will still be producing quite a bit of oil when oil exports hit zero. Let’s face it though what matters is Saudi and Russian oil available for exports. Europe and Asia. Be thankful if you don’t live on either continent.
I am very curious where you get your data for global oil exports. I have been trying to find a good source for net global oil exports for some time now, albeit not very hard.
Euan Mearns did piece on ELM (export land model) last year. In March i think it was. Data comes from BP statistical review 2016. The fact that all this additional oil has been added since 2006 an global exports have remained slightly down to flat for a decade plus kinda stuck in my mind.
Thank you, I had actually seen Euan Mearns piece, though I didn’t read it at the time.
HHH- “Not going to be a Global market for it even though everybody must have it. You’ll have a local price for whatever is being produced locally or within the borders of whatever country you reside in. Anything extra will have to be taken by force.”
Thus the Silk Road, I suspect.
also- well said Joseph
Electrification is taking a small bite out of the oil market already.
https://www.bloomberg.com/news/articles/2018-04-23/electric-buses-are-hurting-the-oil-industry
Sure, 279,000 barrels per day doesn’t seem like much with a horrific global demand of 99 million barrels per day. And from the point of view of saving humanity from ocean acidification, it isn’t much.
But it’s enough to swing the price.
The diesel demand displacement by electric buses is about 56,000 more barrels/day each year, which will continue for the next 20 years or so. The growth curve seems to have stopped and bus deployment is probably slightly below steady-state now. (This is good. The global transit bus fleet is only about 2.5 million buses. The deployment rate is around 100,000 per year, with 386,000 already deployed — it wouldn’t be sustainable to increase this to more than twice the current rate.)
The gasoline demand displacement by cars is still on the exponential curve. So it’s an additional 16,000 barrels/day of demand elimination for 2018, but it’s growing at about 50% per year. (These are BNEF estimates; I believe based on my other research that they’re low.)
This means it’s necessary to make production cuts of about 0.1 million barrels per day just to keep up with 2019’s drop in oil demand. And repeat, each year. 2025? 0.6 million bpd.
This ignores other smaller eliminations of demand, such as the elimination of oil for electricity generation (mainly used on islands and very expensive) n favor of solar/wind/batteries, deployment of electric ferries, etc.
Oil demand growth in “developing countries” isn’t going to make up for this forever, or indeed for very long.
We probably will see a oil price spike when the shale era ends. But electrification will be WELL in hand by then… who will want to fund new oil drilling when they could finance an EV manufacturer?
BEVs (4%) and PHEVs (2%) are 6% of China’s new car market now. Expect 9% next year, and due to policy changes, more BEVs and fewer PHEVs. Expect 14% in 2020, 20% in 2021, 40% in 2023, 80% in 2025. It’s going to be impossible to keep oil prices high.
Much of what you describe is already factored, calculated, and estimated by the IEA, EIA, OPEC and the oil majors in their long term energy outlooks, yet they all agree that oil demand growth will be sustained for at least another 20 years. Those counting on electrification to break oil prices will be sorely disappointed in my opinion.
If you think electric buses have that cheery of an out look, you should see how Albuquerque fared when the city converted to an electric bus fleet. It was such a fiasco the buses had to be returned to sender, but they were such junk they broke down on the way back! Now the city has had to go back to a diesel fleet after wasting significant money on unusable technology.
Mike ABQ- you will find a different story over the coming 5 yrs. There will be a lot big electric and hybrid electric vehicles rolling out around the world. Buses, cargo vans, pickups.
Seen this one from Michigan?
https://www.cnet.com/roadshow/news/rivian-r1t-electric-pickup-truck/
Don’t be surprised by the price. 2nd gen production will include cheaper versions, and lets not forget. No gas, no oil change, no camshaft, no valve ring….
Can you say ‘0-60 mph in 3.2 seconds’?
New Year Prediction.
My new year prediction is that by September 2019 Ron would have claimed that 2019 is definitely the peak.
OPEC outlook is correct at the moment. US increase in supply is still displacing the need for OPEC and others to increase their supply. Indeed they need to cut production because the price of oil is crashing again. The cut in production will leave over a million barrels per day to come online when US production increase starts to slow down.
Peak oil will not occur before 2021. Iran also has a million barrels of capacity it cannot sell at the moment.
Oil consumption grew by 1.4 million barrels per day in 2018. Supply grew by more than that.
Hopefully electric cars will slow demand growth but much of the growth is due to industry, aviation, marine consumption and HGVs.
I’d be willing to bet we have 5 to 10 years of plateau production between 81 mbd and 84 mbd…unless some black swan in the Saudi fields resembles Mexico of the last 10 years.
NG Price Normalizing relative to Oil!
Seems to me the EIA NG consumption datas doesn’t factor all demands?
“Meanwhile, natural gas has gone in the opposite direction over the past two months or so. Low inventories, high demand and seasonal factors have dramatically tightened the market for natural gas in the United States. Prices hit $4.70/MMBtu in November, up 60 percent since September.
In other words, Brent has lost more than half of its price premium to Henry Hub in the last few months.”
https://www.zerohedge.com/news/2018-12-24/key-indicator-spells-trouble-oil-investors