This post is by Dennis Coyne
The eventual peak and decline of light tight oil (LTO) output in the Bakken/ Three Forks play of North Dakota and Montana and the Eagle Ford play of Texas are topics of much conversation at the Peak Oil Barrel and elsewhere.
The decline rates of individual wells are very steep, especially early in the life of the well (as much as 75% in the first year for the average Eagle Ford well), though the decline rates become lower over time and eventually stabilize at around 6 to 7% per year in the Bakken.
What is not obvious is that for the entire field (or play), the decline rates are not as steep as the decline rate for individual wells. I will present a couple of simple model to illustrate this concept.
Much of the presentation is a review of ideas that I have learned from Rune Likvern and Paul Pukite (aka Webhubbletelescope), though any errors in the analysis are mine.
A key idea underlying the analysis is that of convolution. I will attempt an explanation of the concept which many people find difficult.
At Wikipedia there is a fairly mathematical presentation of the concepts which often confuses people. There are a couple of nice visuals to convey the concept as well see this page.
In the visual below a function f (in blue) is convolved with a function g (in red) to produce a third function (in black) which we could call h where h=f*g and the asterisk represents convolution, just as a + symbol is used to represent addition.

“Convolution of box signal with itself2” by Convolution_of_box_signal_with_itself.gif: Brian Amberg
derivative work: Tinos (talk) – Convolution_of_box_signal_with_itself.gif. Licensed under CC BY-SA 3.0 via Wikimedia Commons.
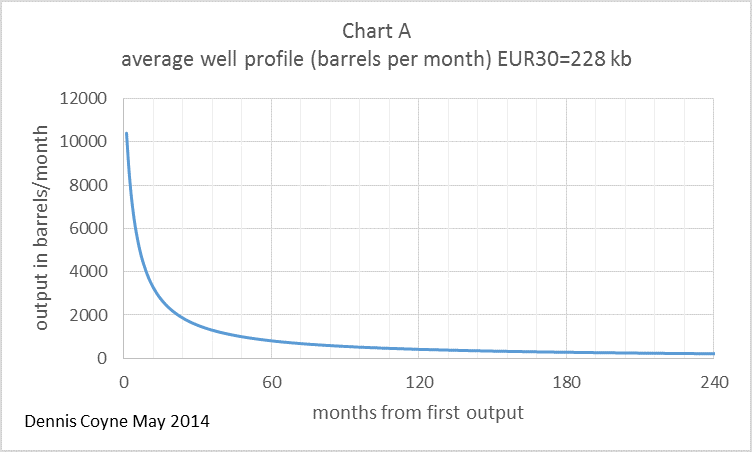
I think the best way to present convolution is with pictures. Chart A below shows a relationship between oil output (in barrels per month) and months from the first oil output for the average well in an unspecified LTO play. This relationship is a simple hyperbola of the form q=a/(1+kt), where a and k are constants of 13,000 and 0.25 respectively, t is time in months, and q is oil output. Chart A is often referred to as a well profile. The values for the constants were chosen to make the well profile fairly similar to an Eagle Ford average well profile. EUR30 is the estimated ultimate recovery from this average well over a 30 year well life.
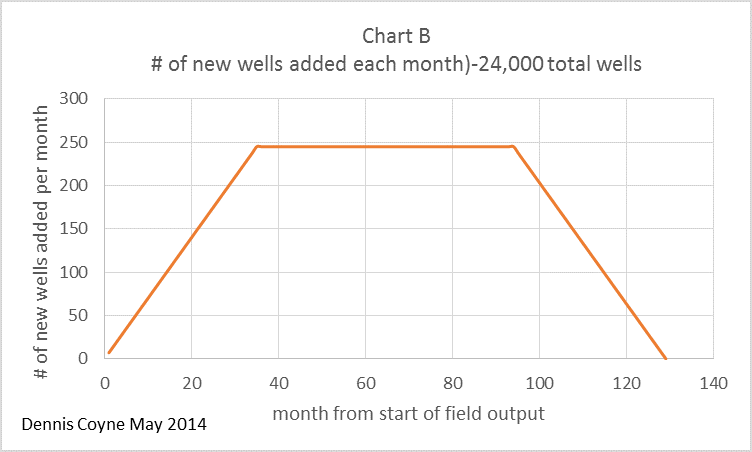
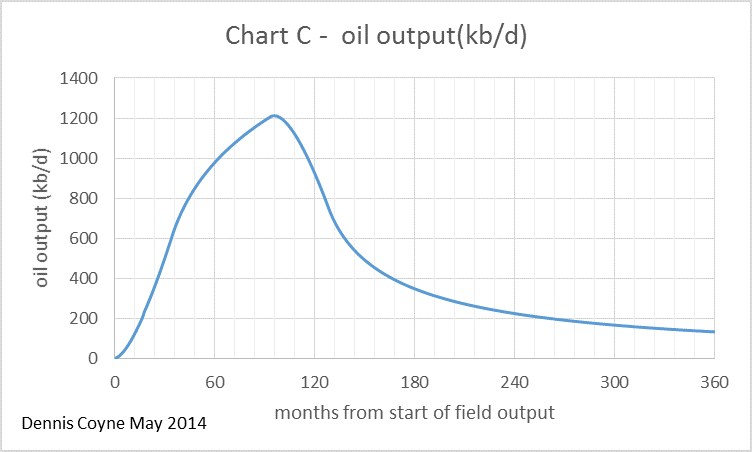
It is indeed strange that two very different shapes (a hyperbola and a trapezoid) would combine to form the shape shown in chart C. A spreadsheet can be downloaded here, with the scenario above laid out.
What was surprising to me when I first tried this analysis was that a combination of the average well profile with the number of wells added each month reproduced the oil output data fairly closely.
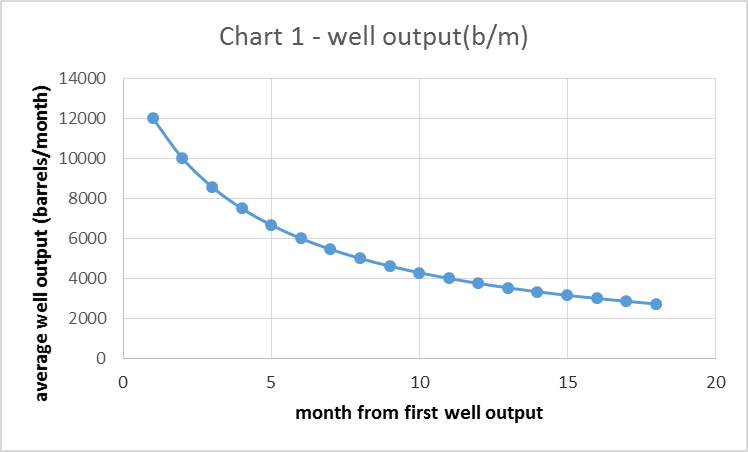
To clarify this further, I have created a simple model. As before, we have a hyperbolic well profile in chart 1 (slightly different than chart A above) and the number of new wells added each month in chart 2, but in chart 2 this is over a short 6 month period. After that time no more new wells are added.
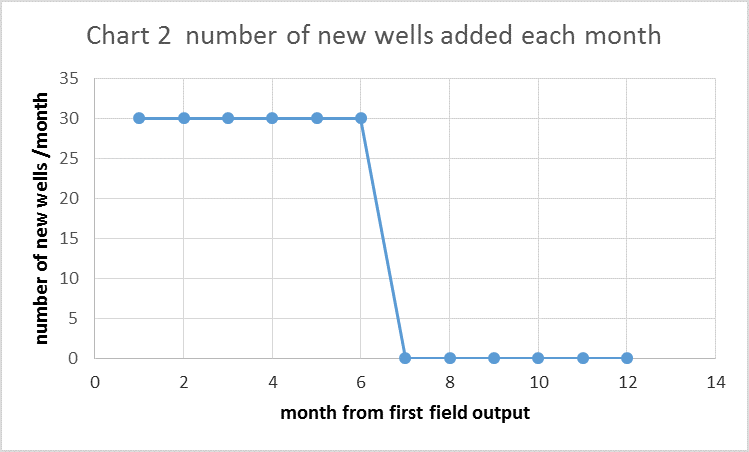
In the chart below I show the output for each group of wells that begins production in successive months. The output from all wells starting production in month 1 are labelled “month 1 wells”, there are 6 of these groups up to “month 6 wells”. The number of wells added each month is shown as a dashed line read off the right axis. Remember that 30 wells are added each month from month 1 to month 6 so output for “month x wells” will be 30 times month 1 of the well profile in month x and 30 times month 2 of the well profile in month x+1, etc.
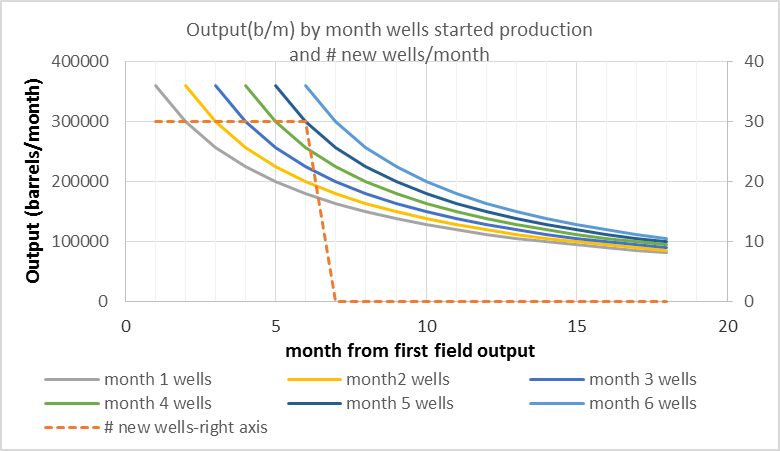
The convolution of Chart 1 and Chart 2 results in Simple oil model 1 shown below.
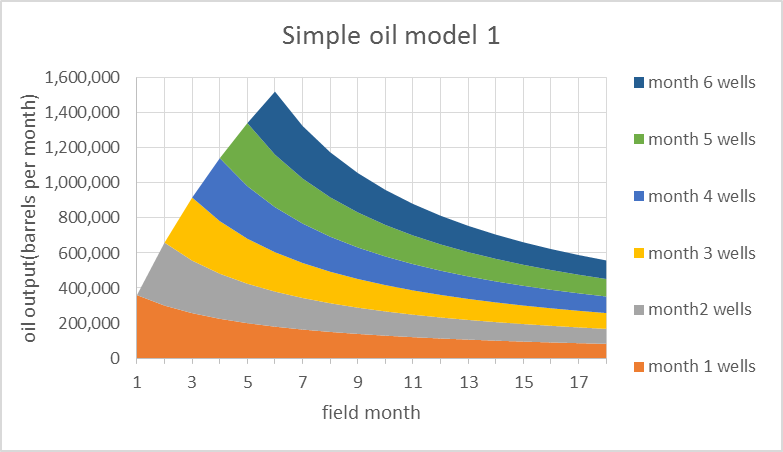
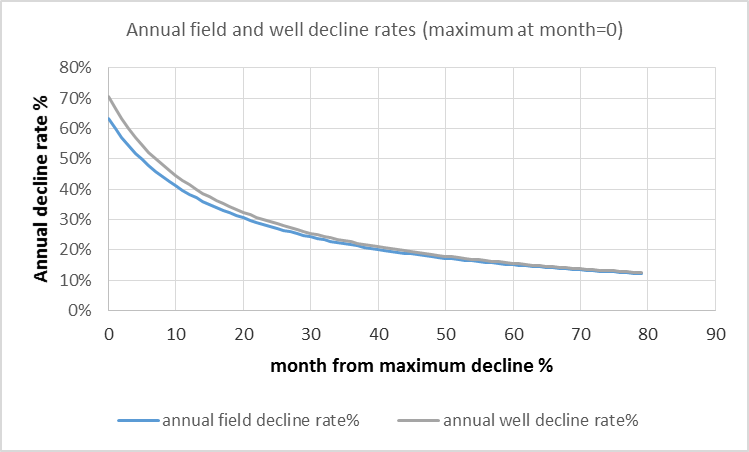
This model is very simple in order to present how the principle works in a clear manner. When the annual decline rate for the “field” is compared to the average well’s annual decline rate, they are very similar for this simple 6 month model. More realistic models are presented later for comparison.
Note that month zero in the chart below is the month of maximum annual decline rate, for the average well the maximum annual decline rate happens in month 13 and for the field it occurs in month 18, the curves have been shifted to the left by 13 and 18 months so that the maximum decline rates match up at month zero for easy comparison.
The spreadsheet for simple model 1 can be downloaded here.
A second simple model with the number of wells added each month rising from 5 new wells per month to 30 new wells per month over 6 months and then falling back to no wells added by month 12 is shown below.
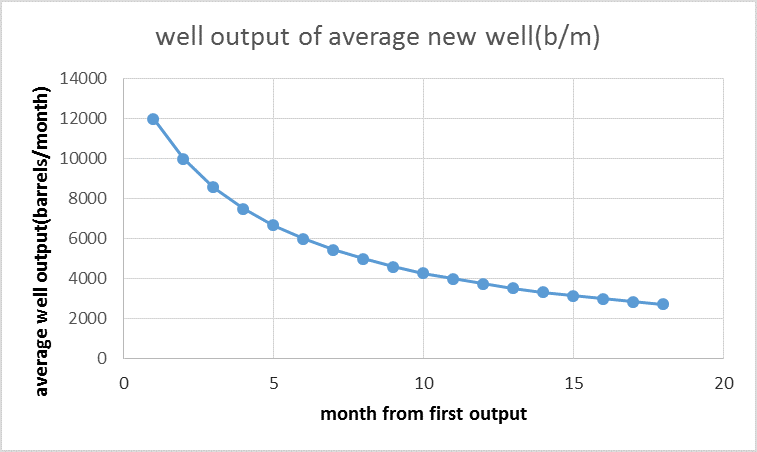
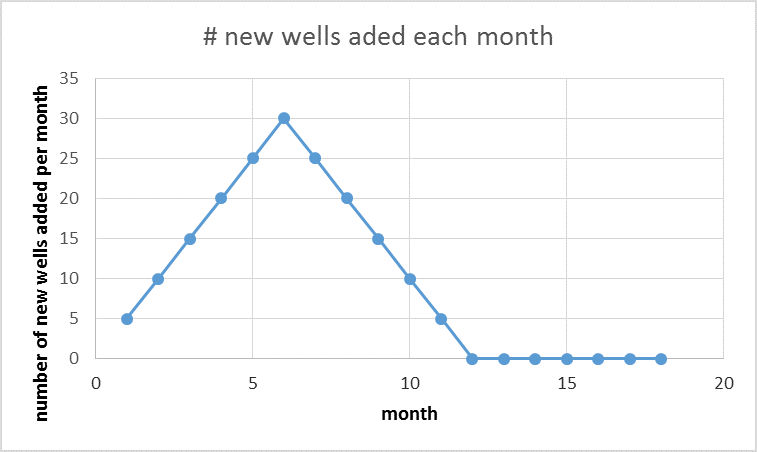
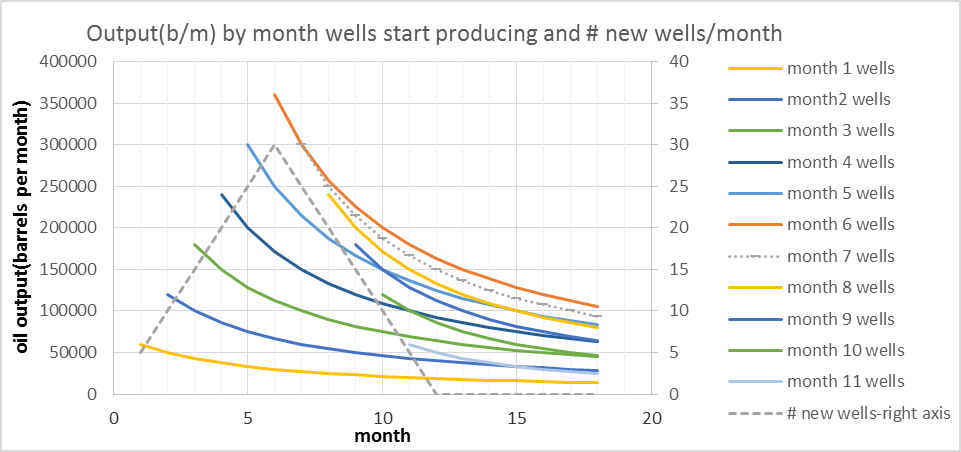
Note that the “month 7 wells” output curve is the same as the “month 5 wells“ output curve, but shifted 2 months to the right. Likewise month 8 is month 4 shifted 4 months to the right and this same symmetry is true for months 9 and 3(6 month shift right), months 10 and 2, and months 11 and 1 where the shift right in the curve is equal to the difference in the month when the well started production (8 months and 10 months for the last two cases respectively).
When all of these 11 curves are added up for each month (the convolution of the “well output of the average new well” chart and the “number of new wells added per month” chart) we get the Simple Oil Model 2 chart below.
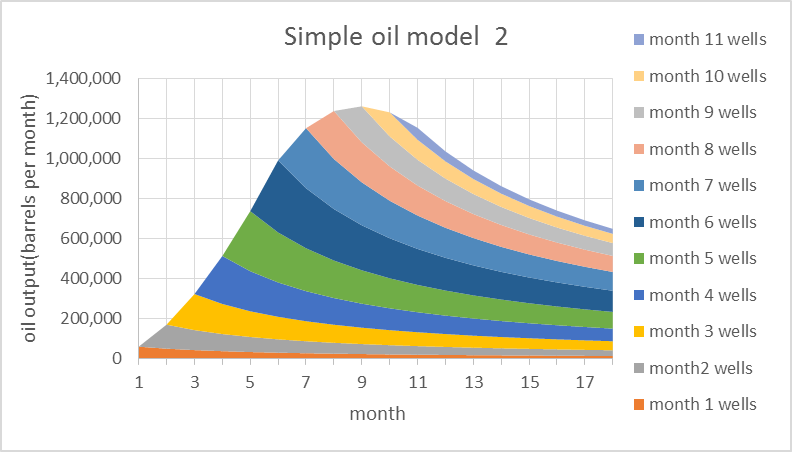
Simple model 2 can be downloaded here.
I now present a different model with a higher EUR well profile (than in chart A) and a lower rate of addition of new wells (than in chart B). This model’s well profile is similar to the average North Dakota Bakken well profile.
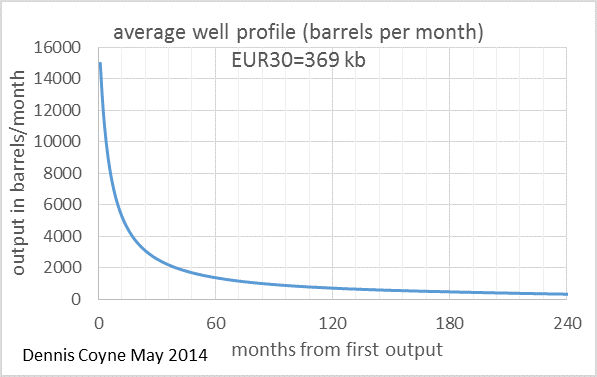

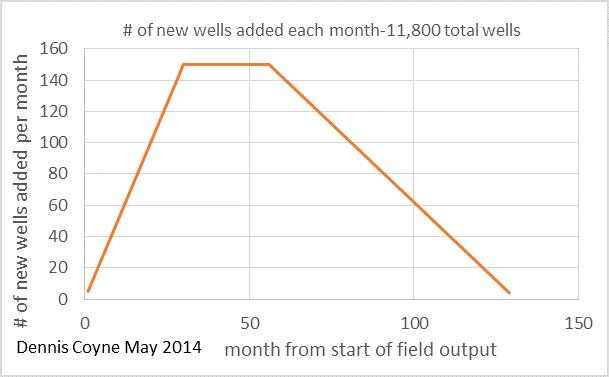
The convolution of the two charts above results in the field output shown below.

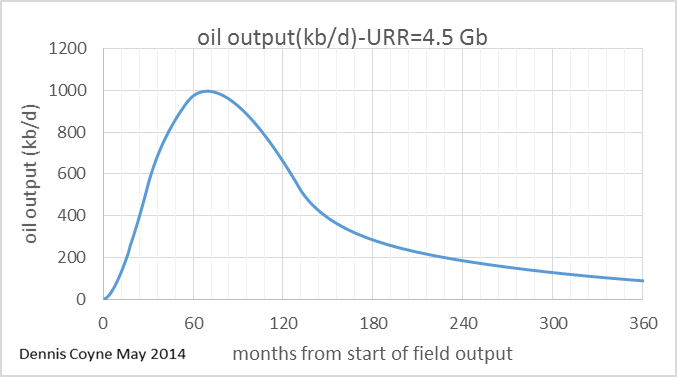
How does the annual field decline rate compare to the average new well annual decline rate in this case? In the chart below we see that a slower decrease in the rate that new wells are added causes the annual field decline rate to be only 22% at most, about 3 times lower than the maximum annual well decline rate.
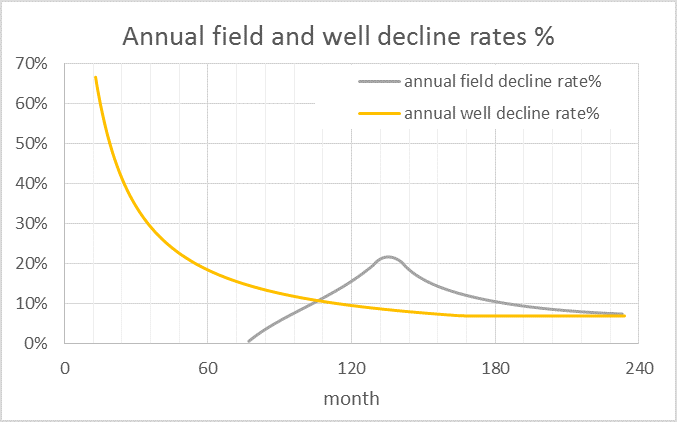
The spreadsheet for the model above can be downloaded here.
As this result is rather counterintuitive, I will try another modification to the model. The well profile remains unchanged, but there is a steeper reduction in the rate that new wells are added to field production.
Such a scenario could occur if there was a steep drop in oil prices as in the early 1980s. It will also occur if there is a decrease in new well productivity which will reduce profits and the incentive to add more wells.
The well profile chart is unchanged, the other two charts are as follows:
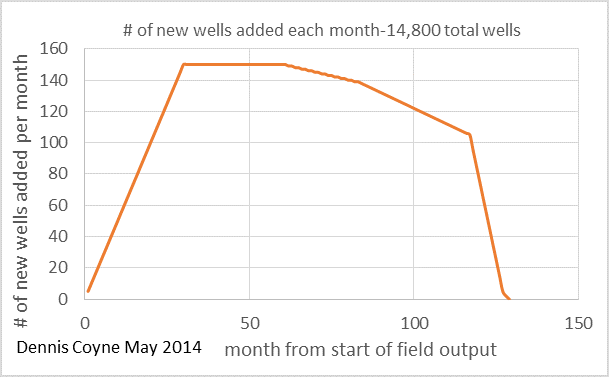

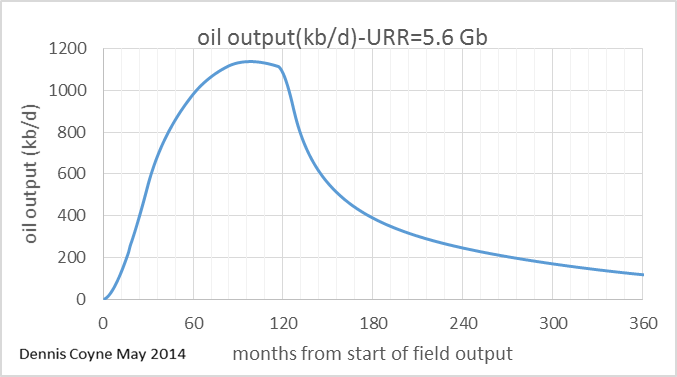
Even in this case the maximum annual field decline rates are less than half the maximum well decline rate. This is because we have almost 15,000 wells added over an 11 year period and their decline behavior in the aggregate is much different than that of an individual well. See chart below.
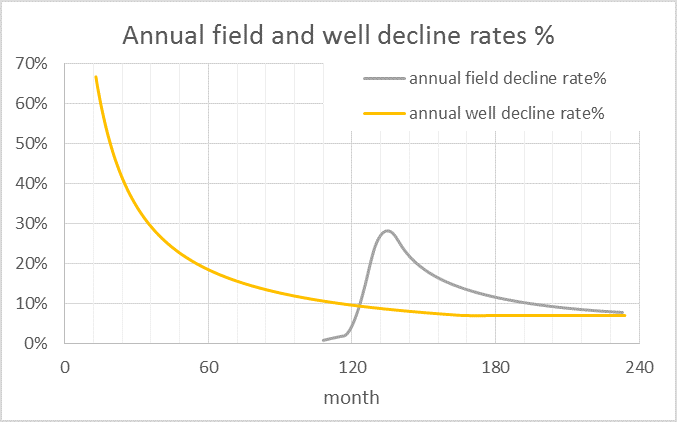
Note that the field decline rate is very high, close to a 30% maximum rate in this scenario. If the rate that new wells are added drops to zero over a 1 to 2 year period and no further wells are added, we would expect the field decline to behave like the gray curve in the chart above. Spreadsheet for the 5.6 Gb scenario can be downloaded here.
Earlier I mentioned that when I first tried this method I was surprised that such a simple model could accurately match output from the Bakken or Eagle Ford fields.
Using data from the North Dakota Industrial Commission(NDIC) on oil output, the number of new wells added per month, and individual well data(from Rune Likvern initially and lately from Enno Peters) I attempted to match scenarios initially presented by Rune Likvern at the Oil Drum.
Below I present the well profile and number of new wells added each month.
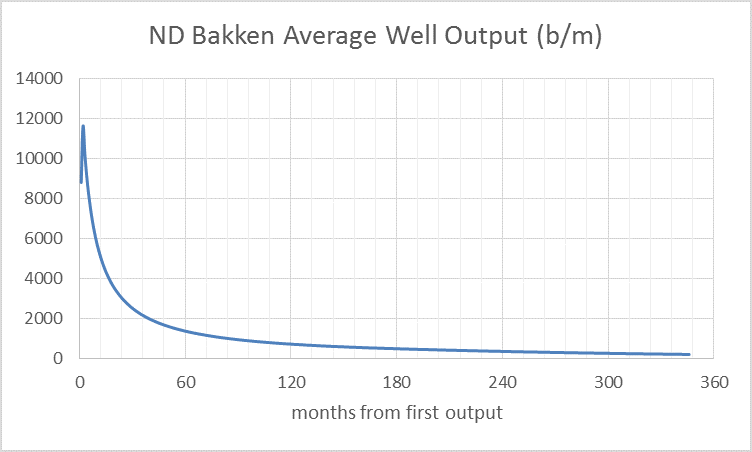
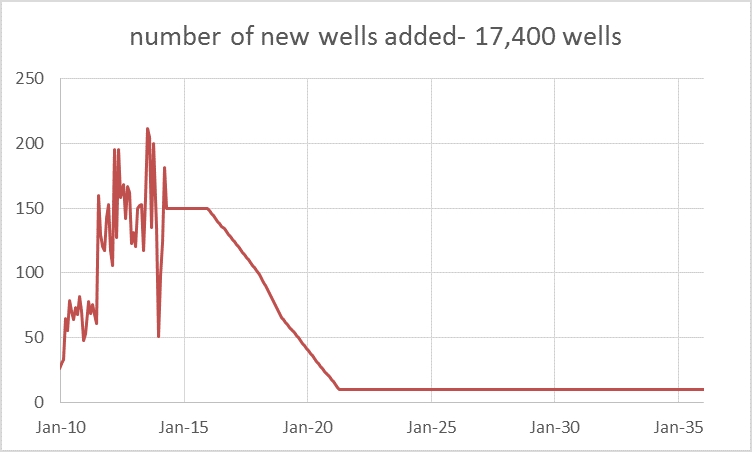
When the two charts above are combined (convolved) we get the output curve below.
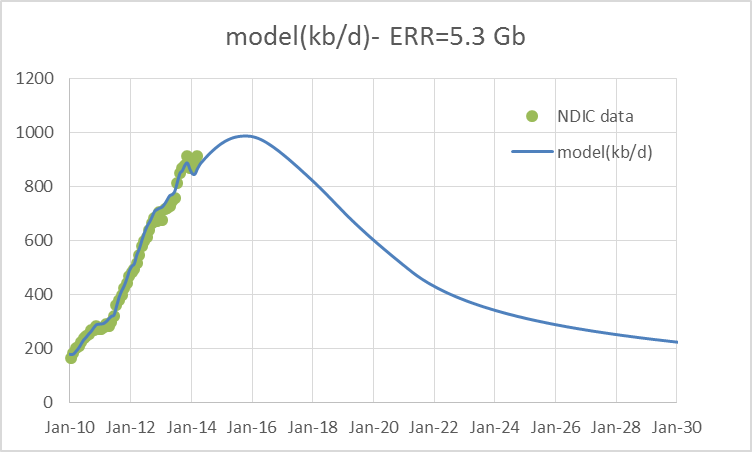
Note that the sharp drop off in the number of producing wells added each month is not very realistic and is an artifact of the way I set up these simple models for illustration (they end at 130 months so the number of producing wells had to be ramped down very quickly).
Such a scenario would be more likely if there was a sharp rise in well costs, or a sharp drop in oil prices or new well productivity (EUR). The field decline rate is somewhat similar to the previous scenario, rising quickly to a 28% annual decline rate which falls to 10% after 5 years and to 7% in 8 years.
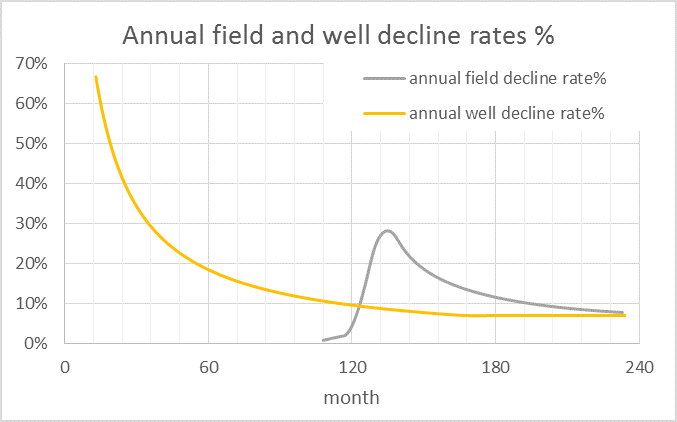
This simple Bakken model can be downloaded here.
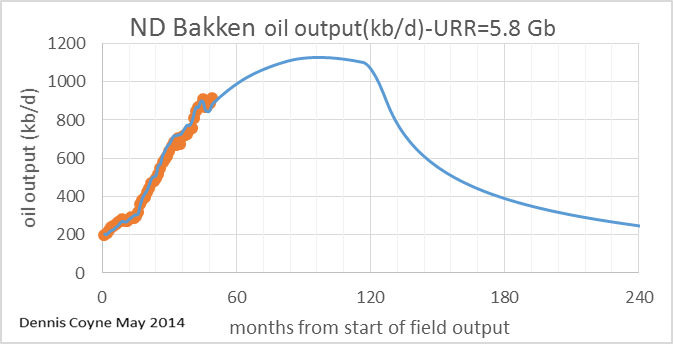
A fairly realistic scenario for the North Dakota Bakken/Three Forks (it is a little on the low end of likely scenarios) is presented now for comparison to the model above. This scenario has an ERR (economically recoverable resource) of 5.8 Gb where the more likely range is 7 to 9 Gb, based on USGS estimates. The average well profile and number of new wells added each month are below.
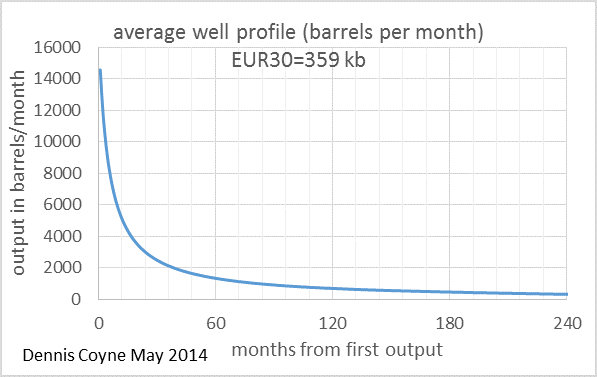
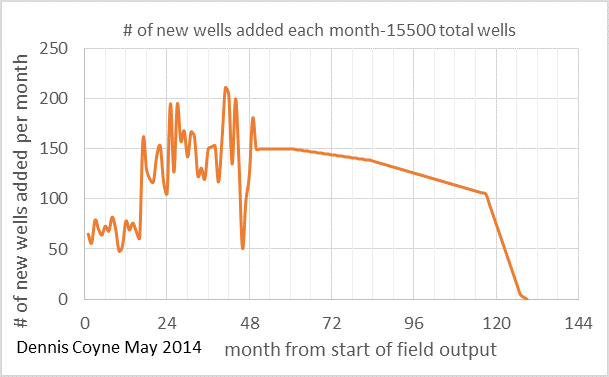
When we convolve the two charts above the following model output results. The match to the data is surprisingly good.
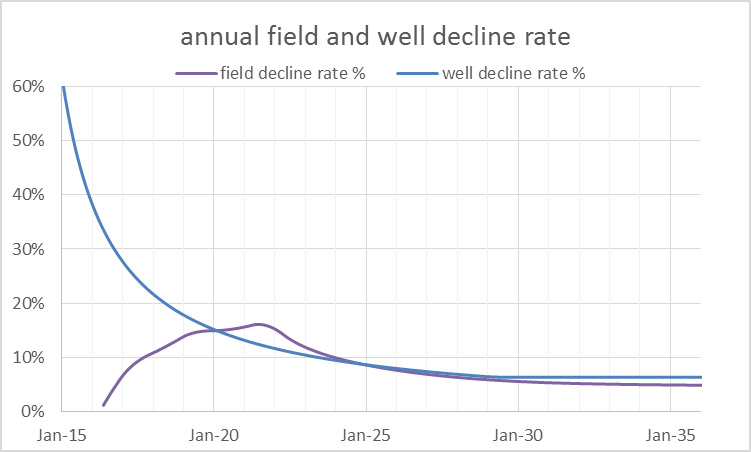
The annual field decline rate and well decline rate are shown below. In this case the maximum annual field decline is about 16% in 2021 and falls to 8% by 2026 and to 5% in 2031, the maximum annual well decline rate is 61%, the well decline rate is shown for a well starting production in Dec 2013.
The spreadsheet with this more realistic model is quite large (18 MB) so those with limited bandwidth may want to skip it. The realistic Bakken model can be downloaded here.
For the Eagle Ford play I was able to collect data on single well leases from the Railroad Commission of Texas, data on the number of producing wells in the play and output data. I developed an average well profile (shown below) and combined it with the number of new wells added each month to produce an output chart.
Note that the output chart is for crude only and does not include condensate.
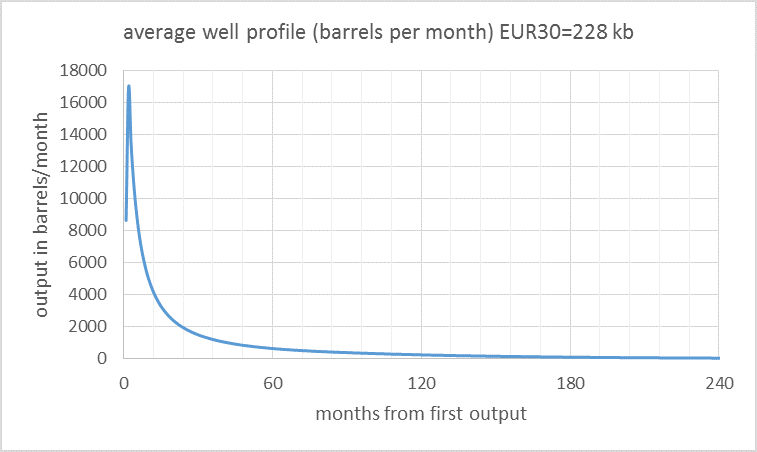
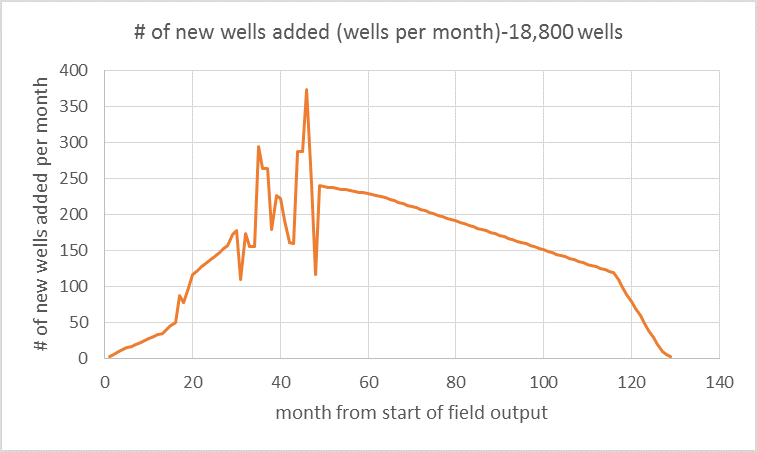
The two charts above are combined (or convolved) to give the output chart below.
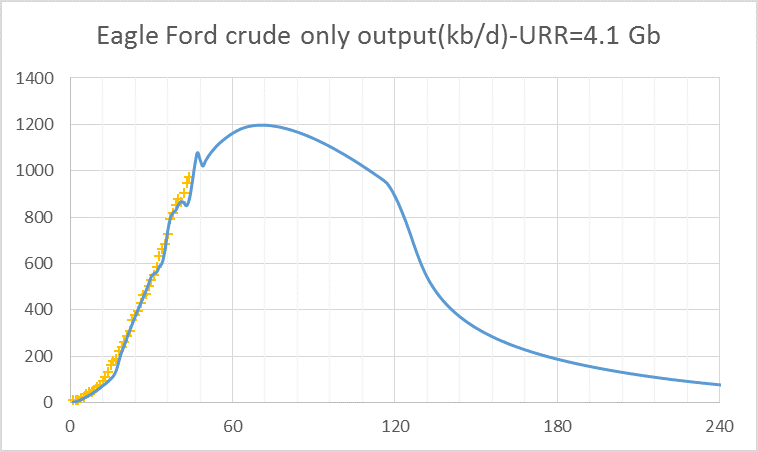
Note that there is about 20% of Eagle Ford output that is condensate, when this condensate is added to the URR above for crude only we get a URR of 5.1 Gb of C+C.
As in the case of the North Dakota Bakken/Three Forks the match between the model and data is surprisingly good considering the simplicity of the model and the complexity of the real world.
Summary
Oil field output can be simulated with the convolution of the average well profile of newly added wells and the number of new wells added each month. I presented several simple models to demonstrate this concept. An obvious weakness for any attempt at forecasting is that the future average well profile may change over time and the number of new wells added in any future month is unknown.
The decline rate of a field of wells will tend to be considerably lower than the decline rate of the individual well. The field decline rate depends on several factors: the decline rate of individual wells, the total number of wells in the field, the period of time over which these older wells were added (whether the period was long or short), and finally the rate at which the number of new wells added decreases as the field begins to decline.
Several models were presented showing how the field decline rate might vary under differing circumstances.
The concepts presented were applied to scenarios which simulated both the North Dakota Bakken and Eagle Ford shale plays with fairly good precision.
In a future post I plan to show how the convolution of two mathematical functions is used to develop the Oil Shock Model.
Ron, this is way off topic but highly relevant. Delete if you so wish.
ISIS, Iraq, Kurdistan and Oil
and Kunstler writes:
Thanks Euan, I never delete posts on oil or any type of energy. And I agree with Kunstler completely. The idea that we could ever bring democracy to Iraq is absurd, and so is the idea that we could ever get the Sunni and Shia to ever stop trying to kill each other.
Americans just do not understand the Arab Mind. Their entire world revolves around religion. There is a religious element in everything they think or do. Their laws are based entirely on their religion. The Koran is to them what our Constitution is to us. There is no democracy or human rights in the Koran.
A poster on another thread explained why the (Sunni) Saudi royal family is concerned about ISIS (also Sunni). He said that ISIS considers the Saudi royal family to be Kafirs:
http://en.wikipedia.org/wiki/Kafir
15/6/2014
World’s untested assumption on 6 mb/d of Iraqi oil by 2020
http://crudeoilpeak.info/worlds-untested-assumption-on-6-mbd-iraqi-oil-by-2020
Does Saudi Arabia think that US shale oil will be increased more? Plus Iraqi oil and that could change Saudi calculations.
My latest analysis:
25/6/2014
Analysis BP Statistical Review 2014: Oil prices started to skyrocket when 1/4 of global supplies went into irreversible decline
http://crudeoilpeak.info/oil-prices-started-to-skyrocket-when-one-quarter-of-global-supplies-went-into-irreversible-decline
Hey Matt just want to say I always appreciate your articles, and aussie focus!
Ditto, from NZ but enjoy hearing about what’s happening across the ditch in the ‘lucky country’.
Matt,
Excellent post! I encourage everyone to read Matt’s work it is excellent.
As a muslim i absolutely disagree with your assertions that there are no human rights in the Quran. Im amazed how a seemlingly intelligent person can have such a ridiculous view. How in the hell can a civilization that is over 1400 years old and was responsible for some of the most amazing cultural centers the world has ever seen (al andalus, Baghdad, Southern Italy, Ottoman Istanbul) have no concept of human rights?
Just logically thinking about it for a second makes your claim ridiculously ignorant.
Well please forgive me for my error. The problem is we have a different view of “human rights”. Women, in the Arab world, have rights, they are just not the same rights as men have. Infidels, or non Moslems, have rights. They are just not the same rights as Moslems have. Every human in the Arab world has the right to express his feelings on the government, just as long as he/she does it in an isolated place where no one else can hear a word he/she says.
Don’t lecture me on human rights in the Arab world. I lived in Saudi Arabia for five years. I know what rights I had while I was there. I know what rights my wife had while she was there. And I know what rights other Saudis had.
How in the hell can a civilization that is over 1400 years old and was responsible for some of the most amazing cultural centers the world has ever seen (al andalus, Baghdad, Southern Italy, Ottoman Istanbul) have no concept of human rights?
Cultural centers, like the Pyramids, were not built with human rights in mind. There is no connection between the two. And I have read the history of the Ottoman Empire. The idea that Mustafa Kemal Ataturk, or any of his followers or successors, or certainly and of his predecessors in the empire, respected human rights is absurd beyond belief.
Just logically thinking about it for a second Koso, makes your claim ridiculously ignorant.
Ah now you’re speaking of your experience of human rights as currently practiced in Muslim world. So by your logic because the constitution in America is being willfully trampled on today by the people who purport to be applying said constitution, the constitution itself is invalid?
Im terribly sorry if you’ve had bad experiences living in the muslim world, but to somehow extroprolate whats happening currently, which admittedly is somewhat of a dark age for the muslims, to the whole Quran and how its been traditonally applied in human societies is a bit of a stretch im afraid, and sorry, its still ignorant.
Just to clear up any misunderstand, where i was lecturing you about human rights in the Arab world? You wont find me disagreeing with you that its woeful.
If i was lecturing you, it was regarding your statement about the Quran, not how its been currently applied by religious demagogues.
Koso, I have never read the Quran cover to cover though I have read parts of it, English translation anyway.
I know there are rights granted in the Quran, however from what I have read and been told there are far more rights taken away by the Quran, or Koran as it is often spelled here, than given.
Mind you, I am not saying that the Bible is any better. All religious texts are the same, they are the work of old men who wish to elevate themselves to the level of prophet or saints and to enslave their followers. No so-called holy book ever written was inspired by any divine being. They are all on the same level, they are all superstitious nonsense.
And speaking of human rights, I am proud to have the right to publish the above paragraph on my blog. I would have no such right anywhere in the Arab world, and perhaps anywhere else in the Islamic world.
I have been told that in Indonesia I would have far more rights than anywhere in the Arab world. I am sure I would but if I were there I would still fear the religious authorities.
My experience in Oman suggested women there have NO rights. But if you live by rules laid down in Fairy Tale texts (including Bible) what can you expect. Do it or burn in Hell!
When I asked my wife if she wanted to join me in Oman for three weeks she laughed and said she’d prefer to spend the time in a NORMAL prison where there’s a lot more freedom.
Probably true.
Squirrel to human: “Say, watcha readin’ there?”
Human: “It’s a [insert sociocultural rulebook of choice].”
Squirrel: “What’s that for?”
Human: “Tells me how to live.”
Squirrel: “LOL”
I must post this. A friend of mine, and a frequent contributor to this blog, just posted it to me. I will not mention his name for fear he might get his throat cut. 😉
Ron, It’s not politically correct to criticize Islam, partly because some critics of Islam have ended up dead, with their throats cut.
Islamophilia – The Left’s Fear of Critizing Islam
I think I’ll jump on Mohammed’s Flying Horse and ride over to where the Talking Snake hangs out, and get his opinion.
Hi Dave,
In religious texts there are often myths, I believe in the Bible there are numerous examples in both the old and new testament.
Making fun of any religion is not very cool in my opinion.
Separation of religion from politics is something that has happened in the West in only the past few centuries.
It is the choice of the people of a nation whether they prefer this separation (if it is a democracy.)
Yes and no, I suspect, and people make fun of a lot of things. Why should religion be any different? I think it has to do with context too, like everything perhaps.
The nation-state is a religion and look what people are doing/have done through it. Uncool to make fun of it? Hardly.
I believe in freedom, but maybe it’s a myth/religion.
In any case my previous post, rather than making fun of religion per se, had more to do with how squirrels, etc., don’t seem to need religion to live on this planet properly or harmoniously…
So I guess I’m kind of “making fun” of my entire species.
My bad.
Hi Caelan,
I was referring to Dave’s comments where he was making fun of the story of the flying horse. My guess is that most people do not take these stories literally any more than many other mythical tales in other religious texts.
I actually am not a religious person, but for some who are, the poking of fun at those stories which are not believable just seems in poor taste.
From my perspective pointing out shortcomings of religion in general is better than calling out one particular faith.
It is just my opinion, people say all sorts of things that offend others (often they do so unintentionally, though I am not convinced that is true in this case) I just was pointing out that it would be offensive to many.
Upon re-reading your comment, I did not find that offensive at all.
So I guess I am sensitive to someone calling out a particular religion.
I also separate “beliefs” such as freedom or the nation from religion for no apparent reason (there is no logic behind it.)
Understood, Dennis, thanks.
About religions !
There are both theoretical and practical considerations to be considered in discussing them in a public forum.
Now as it happens I grew up in backwoods Baptist church environment.My dear departed Momma believed in the KJB word for word and my still living dear old Daddy believes likewise.Probably fifty percent of the people around here take Heaven and Hell seriously. Almost all the other fifty percent are some what concerned but not enough to give up ”sinning”.
Now the most interesting thing about the believers is that just about all of them manage to silmantaneuosly believe in things that are mutually exclusive such as T REX and wooden arks big enough to hold two of all the animals in the whole world and so forth.In the last analysis just about every bible thumper I know understands that a good bit of the KJB is metaphorical but they still believe in the core message.
The better informed believers just refrain from thinking and talking very much about the contradictions such as the world not having four corners.
BUT they feel compelled to defend the literal interpretation of the KJB as a matter of cultural solidarity. Given the choice in a public debate where my face an identity are known I would avoid this subject as a practical matter simply because there is little to be gained but much to be lost in terms of relations with my community and family by advertising the fact that I am a hard core Darwinist.
The point is this. If we make fun of religious people in a forum such as this one, any devout person who happens across it will automatically decide we are fools and idiots if not actual servants of the Devil and ignore the primary message we are trying to get out.
So while I don’t advocate censorship I do suggest that keeping the discussion away from evolution and religion except as it really matters is a good practical policy.
There are many tens of millions of fundamentalists ( ranging from hung ho true believers to camp followers and fellow cultural travelers who understand that half of the KJB is fairy tales) in this country who vote.
Insulting their religion and culture UNNECESSARILY is about as sure fired a way to keep them voting republican as I can imagine.
The republicans don’t take subjects such as peak oil and climate change nearly as seriously as the democrats.
Of course I am frequently guilty myself of forgetting this practical consideration.LoL
But Ron, you could of lived in one of the other bastions of democracy and scientific progress that Islam promotes!
Like, well lets see, there must be one?- well, never mind
(snark off)
Yeah im sure you’re children and grand children will be commending the bastion of democracy and science that you currently live in whilst their baking their socks off paying off debt and residing in a world with a destroyed ecology..great!
Fair point.
Can you say capitalism?
Science is a tool, often used by psychopaths, just like religion is used by psychopaths within Islam.
Blame it on Haber.
http://www.idsia.ch/~juergen/haberbosch.html
But Islam did preserve Greek Thought during Europe’s decline into Christianity, something we all should be grateful for.
Many societies and cultures claim to be Muslim, and they have very different interpretations of what is moral, Islamic, or what the 6th century poetry in the Koran actually means.
Saudi Arabia is at one extreme end of the spectrum. Unfortunately it is a mind set that has been spreading rapidly for the last 50 years in reaction to world events over that time. More moderate Muslims (some of whom I know) and even secular Muslim states like Turkey until recently have been losing ground.
The Koran, unlike the Bible has been passed down the generations almost as it was first written. The bible is a mishmash of writings from the early Christian period brought together and heavily edited by Emperor Constantine in 313 AD, and none of it was written in English.
This makes the claim that the Koran is the pure word of God easier for adherents to believe than the Christian equivalent.
If God (or gods) is so cleaver why didn’t He (they) explain things so mere mortals can figure out what He’s (they’re) talking about? Flying carpets, talking snakes, walking-on-water, Divine birth — bloody nonsense.
What’s wrong with “Do unto others….” and forget hazy-smoky crap? Or, maybe it’s better to terrorize the kids with burning in Hell stuff. That will keep them in line: You might even catch a few grown-ups (really dumb ones) with that one.
“…maybe it’s better to terrorize the kids with burning in Hell stuff.”
Over here, we call that, ‘climate change’.
“Cultural centers, like the Pyramids, were not built with human rights in mind. There is no connection between the two. And I have read the history of the Ottoman Empire. The idea that Mustafa Kemal Ataturk, or any of his followers or successors, or certainly and of his predecessors in the empire, respected human rights is absurd beyond belief.”
Ron, honestly, this is embarrasing. First off, the pyramid were built thousands of years ago and nothing to do with Islamic civilization, im not sure what your point is.
Secondly, Ataturk was the founder of the Modern Turkish state, AFTER the Ottoman Empire collapsed. Im not sure what history books you’ve read but to get such simple facts of history so completely wrong just proves my point.
Look, i highly respect what you do on this site, and i’ve been following this blog for the past 4 months constantly. I dont want to get in a slanging match, it seems you’ve had some pretty horrible experiences in the Middle East, so obviously your aversion to Islam is highly psychological, i honestly feel bad about that.
Im gonna end this conversation here as its obviously not going anywhere. I hope i haven’t offended you in any way, and if i have, my sincere apologies.
All the best.
Ron, honestly, this is embarrasing. First off, the pyramid were built thousands of years ago and nothing to do with Islamic civilization, im not sure what your point is.
Good god, don’t you think I know that. My points was that building anything does not require even one iota of human rights. Your implication was that these great cultures and empires could not have been built without human rights. Many of the world’s great works were built with slave labor. I know there is some dispute as to whether or not the builders of the pyramids were slaves. It is my strong opinion that they were.
And it was you who brought up the Ottoman Empire. And I know it existed well before Ataturk. That is why I mentioned his predecessors. “Predecessors” means those who came before him (in the Ottoman Empire). Koso, honestly, it is embarrassing that you did not know this.
The Ottaman Empire was in bad shape but it still existed when Ataturk came to power.
The Ottoman Empire and Mustafa Kemal Ataturk
Part of the world included the Ottoman Empire, who fell under the western imperialism. Many of its territories were occupied by Russia and other westerners. This is where Mustafa Kemal Ataturk came to protect and reform the Ottoman Empire.
Ron Wrote:
“I know there is some dispute as to whether or not the builders of the pyramids were slaves. It is my strong opinion that they were.”
The pyramids were built by gov’t employees. They were paid to work on moments, as excavations of the worker towns a short distance to the pyramids showed that the workers had high living standards: shoe shops, they ate, beef, fish and fresh bread and drank mead and other alcoholic beverages. Worker graves show that injured workers had received medical care (broken bones being re-set and allowed to be healed)
It was the tax payers of the state that were the slaves that did the real heavy lifting (metaphorically speaking). I recall reading (years ago) that Khufu was extremely unpopular because of the high taxes imposed upon them in order to pay for his tomb. The Tomb builders were on the receiving end of the taxpayer money and graffiti in the tombs indicates they pyramid workers were extremely supportive of Khufu.
FWIW: also consider that Rome uses slaves to pay for monument construction but didn’t participate in the construction (at least on site). Slaves were captured by the state of Rome, and sold on the market to raise cash to pay the craftsman to perform the actual construction. This was likely similar for Egypt. At best, the slaves would have done the domestic labor for the pyramid craftsman (laundry, cooking, cleaning, etc). Slaves (heretics) would not have been permitted to go anywhere near the tombs as it would have been considered insulting as much as letting a Jewish worshipper to enter a Islamic Mosque.
koso–
Do you believe Mohammed had a flying horse, as the Quran stated?
Just so we have a reference point as to your scientific literacy.
koso–Do you believe Mohammed had a flying horse, as the Quran stated?Just so we have a reference point as to your scientific literacy.
Dave, before questioning my scientific literacy, i strongly suggest you read the Quran. You might be surprised to find that no flying horses are mentioned.
“It’s called a buraq, and the myth comes from the hadith, a supplement to the Koran.
Sahih Bukhari Volume 5, Book 58, Number 227 hadith
“I was brought by the Buraq, which is an animal white and long, larger than a donkey but smaller than a mule, who would place its hoof at a distance equal to the range of vision.”
The Journey to seventh heaven
According to Islamic tradition, the Night Journey took place 12 years after Muhammad became a prophet, during the 7th century. Muhammad had been in his home city of Mecca, at his cousin’s home (the house of Ummu Hani’ binti Abu Thalib’s) doing the 5th prayer (Isha’a). Afterwards, Muhammad went to the Masjid Al-Haram mosque. While Muhammad was resting between Baitullah and Hijir Ismail, suddenly the angel Jibril (Gabriel) appeared to him. The angel cut open Muhammad’s chest, took out his heart, and purified it with the holy water of the nearby Zam-zam well. The angel then restored the heart to Muhammad’s chest, leaving no wound. After this, the Buraq arrived. Muhammad mounted the beast, and in the company of Gabriel, they traveled to the “farthest mosque”. The location of this mosque was not explicitly stated, but is generally accepted to mean Jerusalem. At this location, Muhammad dismounted from the Buraq, prayed, and then once again mounted the Buraq and was taken to the various heavens, to meet Allah. Muhammad was instructed to tell his followers how many times per day that they were to offer prayers. The Buraq then transported Muhammad back to Mecca.”
http://en.wikipedia.org/wiki/Buraq
So it was in an addition—-
Sorry if I got a bit confused on the myth.
Your free to call it a myth, fairy-tale or whatever you’d like…just try and get your facts straight first.
When dealing with Magical Books, you can essentially just make stuff up.
So why ask me a question on something you think anything can be made up about? Seems like youre just trying to be offensive because you ignorantly stated something which was patently wrong. Are you that prideful?
Im done with this conversation. All the best to you.
Bronze and Iron Age Fiction is not my genera.
Just saying—-
There are minimal to no human rights for infidels in the koran.
True of many religious texts.
I believe Ron is just about dead center in the ten ring today. Now if we could stay in Iraq a hundred years or so the way the British stayed in India there might be a small chance western political ideas would take root and grow.
Which ever party has the upper hand knows absolutely that the underdogs are going to take their revenge if they are ever able to turn the tables.
The only way there can be peace is if a dictatorship capable of enforcing it arises.
Given the quantity of weapons already on the ground and the numerous sources of more available to either faction peace is a pipe dream for the next few years at least and probably for decades to come.
If it had worked out in our favor the price of our wars there would have been a good deal for the West.
Given the likelihood that things are going all the way to hell in a hand basket in a few more years in Sand Country ( this is what a soldier I know who was there calls the oils producing countries) we would be a lot better off if we had spent all that treasure and blood on energy efficiency, conservation, and renewables plus some nukes.
Even Saudi Arabia is a powder keg that might well explode in the next decade or so, especially if the other countries in the area get involved in hot wars.
Coal to liquid would not be such an incredibly bad option if all new cars got fifty mpg on gasoline and half of them were plug in hybrids or pure electrics.Everything else held equal this scenario would probably produce less co2 than burning conventional oil at half the efficiency.
Half of what we have spent ensuring access to Middle Easter oil would go a hell of a long way building out mass transit and electrifying railroads and installing solar panels in places where the sun shines reliably and building wind farms in places where the wind blows consistently.
Now if there are any engineers or bean counters who can answer this question I will surely be grateful.
Which important industries – if any – can run on intermittent power without too many problems with the machinery and product other than loss of efficiency?
If I were a large scale farmer irrigating corn I could manage pretty well using wind power to run my pumps if the power lines reach the location of the wells.Losing a day or two here and there pumping would not be that big a deal.
Some manufacturing plants might be able to handle shutting down and restarting without too much trouble except for additional expense for labor and the loss of production.
I used to work in a gravel quarry that was mostly electrified. It would not be any problem there to run on wind power if the management were willing to pay the additional labor expenses involved in starting up and shutting down frequently.
The plant typically runs about forty to fifty hours per week from 7 am to about 4 or 5 pm.
It would almost for sure be able to run the plant itself at least that many hours per week on a combination of wind and solar power and still make the same number of tons of gravel.The only real difference would be the need for two or three truck drivers and a loader operator and a plant operator and a mechanic who could come in at night or on weekends.Six people could run a very productive night shift just running the crusher and stockpiling stone.
I imagine the management could find enough things for this crew to do to keep busy when the wind is not blowing, especially if they are on a flex schedule.
And for that matter the drills and loader could be economically electrified if the price of diesel goes high enough. They have to move only a few hundred feet in the course of a months work.
That would leave only the big trucks that haul the stone from the pit to the crusher running on diesel.
There may be a number of other kinds of businesses that can run intermittently without running costs thru the roof.
Diesel fuel is already so expensive that it costs about as much to fuel up a commercial truck as it does to pay a driver in low wage areas.
Electrified trucks that draw power from over head lines for most of a fixed route and have small engines suitable for the last mile or two of the route may be a common sight in cities and large industrial plants in the future.
Or we could just refrain from overthrowing parliamentary democracies, such as Iran in 1953.
http://en.wikipedia.org/wiki/1953_Iranian_coup_d'état
The oil might actually belong to the people on the land in which it is located.
So here comes the concept of planetary resource. No one will be allowed to own it, nationally or corporately. Nip husbanding in the bud.
Maybe Suncor isn’t all that attractive after all. Nor Exxon. And hell, after this idea gets into the lexicon, there may be talk of clawbacks of dividends paid in the past.
Now that it’s been mentioned, the lobbying money out of Exxon and Chevron will flow to anyone with a vote to do their own nipping in the bud.
OFM – Here’s an example of what we would get if we diverted defense, etc. to new renewable energy infrastructure. I’ll focus on wind, as it is the most cost-effective RE right now.
current wind capital costs are about $2,000/gross kW.
Invest $1T in wind would deliver 500 million kW of capacity
Using 30% net capacity factor, net wind power capacity for $1T investment would be 150 million kW.
Annual energy generation from 150 million kW avg generation would be 1.3 million-million kWh.
Per the EIA’s monthly energy review, Table 7.2a, the US in 2013 generated just over 4 million-million kWh. So $1T diverted from defense to wind could install enough generation capacity to meet 32% of current electrical energy requirements. That doesn’t include transmission lines or energy storage (a big factor with wind). Grid stability management will be a real bear as intermittent renewables start to make sizable a dent into the generation infrastructure.
http://www.eia.gov/tools/faqs/faq.cfm?id=427&t=3
Grid scale storage: http://seekingalpha.com/article/2283403-grid-scale-energy-storage-why-working-capacity-and-cycle-duration-matter
That article has some decent bits of information, but much of it’s discussion is misleading. The author is promoting his investment, as he does often online.
That 150GW of average output would be more than enough to power enough EVs to replace all of the US’s passenger car fleet.
3 trillion vehicle miles travelled x 3 miles per kWh gives 1 billion kWhs, less than the 1.3 computed above.
And, of course, it’s replacing oil that we’re talking about here.
“Half of what we have spent ensuring access to Middle Easter oil would go a hell of a long way building out mass transit and electrifying railroads and installing solar panels in places where the sun shines reliably and building wind farms in places where the wind blows consistently.”
The budget of what it cost for military activity in Iraq and Afghanistan is almost always computed incorrectly. The only expenditures relevant to those regions would be “supplementals” added to the usual DoD budget. That’s not really all that much and my recall is a lot of foreign aid was layered into the supplementals (which the Democrats could have obstructed and killed in the Bush years and the GOP could have obstructed in the Obama years).
DoD expenses are mostly salary. Taxes are paid on it so the number is always 30% less than it looks. It goes to pay child college expenses too, so academe would suffer from DoD cuts — since there are no commensurate jobs for those guys and thus those kids don’t go to college.
And, the final killer, if you cut salaries, you’re essentially cutting conventional forces. When you eliminate conventional forces, you eliminate presidential response options in a crisis. Well, not eliminate. Narrow. You narrow them to that which costs the least money — nuclear weapons. So China’s Navy stops a tanker from Nigeria headed to Houston and sends it to Shanghai. There is no longer a US Navy to stop them. What response does the president have? Tell people to get along without that oil? Guaranteed loss in the next election.
not sure about this at all
http://www.hks.harvard.edu/news-events/publications/impact-newsletter/archives/summer-2013/the-costs-of-the-iraq-and-afghanistan-wars
Veterans who retire from the military are entitled to healthcare regardless of where they did their time. So that’s bogus. You can make a case for long term expense paying for wounds, provided you eliminate those expenses expected for injuries occurring by falling off a sidewalk on a base in the US, or training accidents flying over bombing ranges in the US. People get injured doing dangerous things, even if not being shot at. That all has to be deducted.
The bulk of these computations always take the quantity of troops in the region of operations and multiply up their salaries. The error in this is frankly obvious — they were going to be paid those salaries even if they were at a base in the US. They were going to burn fuel training anyway. But the wackos with agendas move past that concept. “They are fighting, not training!!” True, that makes them battle hardened, which is even better training than they’d get in the US.
Sorties flown also are not appropriately added up. Pilots have to fly a certain number of hours per month no matter where they are, so the fuel burn dollars in that region have to have deducted the fuel that would have been burned to maintain flight qualification per monthly hours. These analyses never deal with that.
The correct way to do these computations is with the supplementals. The pure budget itself was going to be spent anyway. Frankly, you have to start deducting money from the supplementals for food shipped there, because those troops were going to eat at home if not in Iraq, and if at the mess hall, that’s free to them and part of the standard budget (and since that food wasn’t eaten at home, those dollars were saved).
Sort of like budgeting your vacation and saying “Hey, I’ll spend $X for food each day.” But this is wrong. You would have eaten at home, too, and if you’re vacationing at Lake Atitlan, the food is cheaper.
The thing that gets me about the standard argument of “if we spent this money on so and so instead of the military” is that it ignores the very simple fact that we would have a hell of a lot less access to energy and resources if we didn’t have that military.
We’re the world’s empire. That empire is enforced via our military, as well as other tools. But, rest assured, without the military might backing up, say, the global trade arrangements that keep us rolling in an abundance of the world’s wealth, we would be a heck of a lot poorer in this country.
America uses roughly a quarter of the world’s energy and a third of the world’s resources with a twentieth of the world’s population. That’s not because we’re just so much super smarter than the rest of the world, or better workers, or because the rest of the world wouldn’t like that wealth–it’s because we have a big military that we use to reenforce our standing as the world’s empire.
So if you get rid of the military, you lose the empire. Simple as that. Someone else will step up and take that away. At that point, our share of the world’s wealth pretty quickly drops to something more proportionate to our share of the world’s population. If we’re in tight with the new empire (think the UK now) than we might have a greater share than our population, but it sure wouldn’t be the share we have now. If we’re an enemy of the new empire, than probably less a share than our population.
So all that money people want to divert from the military to social spending mostly isn’t going to be there without the military. It’s really just one more entitled American fantasy.
Mind you, I think it would be best if we made the decision now to start an organized drawback from being the world’s empire. In the long run, I think it holds more promising options for us than trying to cling to an empire that’s slipping away, though it also holds quite a number of risks. But I don’t see any sign of that decision being seriously considered.
Hi Caelan,
A nice quote. However, since Americans in general are rolling around in the spoils of the American empire and happily wasting those resources, I’d say we’re in on the empire, whether we officially support it or not. Most of us implicitly support it. We like what it gives us.
When I see the vast majority of Americans rejecting the spoils and demanding a different way of interacting with the world, than the “we” can go away. But just changing your language without changing your behavior is one more convenient way of providing a warm moral glow for yourself without having to make any actual sacrifices.
It’s like demanding some new policy to deal with climate change without being the least bit willing to scale back your own life and use of energy and resources.
Which is maybe in part why some would do well to change the language/thinking.
Besides, speaking of the behavior before the language/thinking seems to be like putting the cart before the horse. I suppose it’s possible, but it may be one reason why things are so messed up.
And yet, I see people all over the place who denounce the American empire, denounce government actions, denounce military spending, and still roll in the spoils. I would say the bigger issue isn’t an inability to distinguish between people and state–I see plenty of people who make that distinguishment with little trouble–but in an inability to recognize the spoils for what they are. Or an unwillingness. Take your pick. I imagine it’s some of both.
Honestly, I put more responsibility for our collective actions as a country on the population than I do on the state–the state, by the way, being a product of our collective decisions. I think we’ve come to this point largely through our own decisions and actions, not through some imposition by the political elite. Granted, the political elite have their power and they have worsened our situation to a certain degree, but most of their actions have come with our acquiescence. (Of course, I’m speaking in general here. There is always a subset who rejects the status quo.)
Americans have had opportunities to scale back our lives, to use less, to live better, to live in greater accordance with the ecosystem, to exploit the wealth and resources of the planet to a lesser degree. We have, by and large, ignored those options and instead opted for short term comfort and convenience at the expense of long term well being.
I don’t believe the state forced those decisions upon us. I believe they were the result of individual and collective decisions. As such, spending time separating ourselves from the state is largely ineffective, in my mind. Instead, we need to make different individual decisions and parlay those into different collective decisions. The state will be forced to follow, as it’s ultimately a reflection of the population.
Granted, you may disagree with all that.
How about this, then:
Speak for yourself.
‘We’ doesn’t seem to do that and makes an imposition…
* my italics
Hi Joel ,
I must agree with everything you say.I am fully aware of the benefits accruing to us as the big dog of the world.
But I see our big dog status slipping steadily away. A finance insurance and real estate economy cannot compete in the end with an industrial economy.We have done a lot worse than ”sell the commies the rope they will use to hang us”-paraphrasing Nikata Kruschev.
We have given away our industrial base, lock, stock and barrel for short term paper profits.
”Mind you, I think it would be best if we made the decision now to start an organized drawback from being the world’s empire”.
You have expressed my thoughts much better than I have myself but we are barking up the same tree.I think we should have gotten started on this job yesterday.
Hi OFM,
Indeed. It seems to me it’s slipping away, as well–much but not all of it via self-inflicted wounds. I’ll be very surprised if the American empire lasts through my lifetime. It’s going to be a rough road when it goes.
All the more rough for this country having divested itself of much of its manufacturing base, physical world knowledge, local agricultural infrastructure. I really hope the localization movement ramps up fast enough to get a good chunk more infrastructure in place before things really start unraveling.
We’ll see. It’s going to be hard times, regardless.
Also, wanted to note that I appreciated your reply a couple weeks ago on an earlier post in which I wrote a long reply to you. Don’t know if you recall it. I didn’t respond to your reply–partly due to lack of time–but I appreciated your thoughts, even if I parted ways with you on some of them.
Who’s ‘we’?
Those with guns to their heads and/or threats of imprisonment (tax revolts?) and/or as wage/debt slaves?
Those with land that has been grabbed/stolen/shell-gamed out from under their feet?
It seems strange that some would be identified as part of a terrorist/religious organization, such that the crony-capitalist state is.
Speaking of that ‘industrial base’…
“Joel Caris”
“The thing that gets me about the standard argument of “if we spent this money on so and so instead of the military” is that it ignores the very simple fact that we would have a hell of a lot less access to energy and resources if we didn’t have that military.”
Except that the US spends an awful lot on useless engagement that have no real impact on US control, and appear to only serve political egos: Vietnam, and more recently Afghanistan. Why the hell are US servicemen guarding Afghan Poppy fields which ends up growing heroin sold on US streets?
In addition, recent US foreign policy has weakened the “Empire” by reducing the supply of Oil (ie Libya, Egypt, Syria, etc) as well as aliening its Allies and major trading partners. The Ukraine proxy war is removing Russian Energy resources from the EU and sending it to China instead. This defies all logic!
The US Military operations in the ME probably consume nearly the same amount that Iraq exports. Its odd that we continue to spend billions in Afghanistan which has no energy resources, and fumbles Iraq. The US hasn’t won a war since WW2.
The US leadership is completely inept!
I have great regard for your analytical skills when applied to hydrocarbon production. But in your second paragraph, there is but one valid sentence: the first – and even that might be improved by rewriting with “Ron” replacing “Americans”. It is no more true to say the Arabs “entire world revolves round religion” than it would be true to say Americans’ mind revolves round the military forces. To assume an Arab is a Muslim is like assuming an American or a European is a Christian. Many Aranbs are secularist, and only “Muslim” in the same sense that the President Hollande of France is “Catholic” or Putin is “Orthodox”. Not all Arabs are Muslim. Many are Christian, though we know that recent ethnic cleansing has seen the removal of many Christian communities from Iraq and Syria. There is a powerful anti Muslim force that has swept the Arab world in the last hundred years. Sadam Hussein, Assad, Nasser and Mubarak, other leaders showed much toleration of Islamic fundamentalism. Their laws and the laws of many Arab coountries are not based entirely on their religion. Where do you get the idea that the Quran holds the same place in Arab societies as the Constitution does in the US? Do you mean Sharia law? Saddam had a system of law in Iraq that was entirely sewcularist. Likewise Syria. Likewise many Arab countries. And you do realise, don’t you, that there Islam is not synonymous with Arab? Iran, Turkey, Indonesia, Malaysia, much of Nigeria – all are Muslim – but very definitely not Arab. What you say is said out of ignorance rather than prjudice, I appreciate. But it comes close to being racist. Try this for size: Americans (or Brits, or French, or Germans) just do not understand the Jewish mind. Ther entire world evolves around religion.There is a religious element in all theythink or do. Their laws are based entirely on their religion. The Torah is to them what our constituion is to us. There is no democracy or human rights in the Torah.
It is no more true to say the Arabs “entire world revolves round religion” than it would be true to say Americans’ mind revolves round the military forces.
Absolute bull! You know nothing about the Arab world. Their world does revolve around religion. There is a religious element in everything they do.
To assume an Arab is a Muslim is like assuming an American or a European is a Christian.
More bull. There are a few, a very few Arab Christians but they are a very tiny minority. In Saudi Arabia there are no Arab Christians because all other religions other than Islam is outlawed for Saudi Nationals. There are no churches in Saudi Arabia, only Mosques. (There are, or were when I was there, a few chapels on Aramco compounds.)
There are tens of millions of non-Christians in America and Europe. The number of Arab non-Moslems in Arab nations are likely less than one tenth of one percent. There is no comparison whatsoever between non-Christians in America and Europe and non-Moslems in Arab nations. Only someone who has almost no knowledge of the Arab world even attempt to compare the two.
Many Aranbs are secularist,
If you would call less than one tenth of one percent “many”. Again, you haven’t a frigging clue as to what the hell you are talking about. You are just “assuming”. I have been there. I have lived with them and talked frequently with them. You are totally out of your league Mike.
And you do realise, don’t you, that there Islam is not synonymous with Arab? Iran, Turkey, Indonesia, Malaysia, much of Nigeria – all are Muslim – but very definitely not Arab.
Mike, I am not a goddamn idiot. I know what an Arab is. I know the difference between an Arab nation and a non-Arab nation. On the other hand I think that is what your problem is. You are assuming Arab nations have about the same non-Moslem population as non-Arab Islamic nations do. That is nonsense.
You quite obviously know absolutely nothing about the Arab world.
Note: Some consider any nation where Arabic is the primary language to be an Arab country. But others, like myself, do not. Many nations in North Africa, Egypt and Algeria for example, speak Arabic. These countries are definitely not Arab countries because they are not Arabs. An Arab country is a nation where the majority of the population are Arabs.
Also Note: The Arab World is approximately the same size it was before the British drew lines all over the map, gave them all different names and colored them a different color on the map. That was then, simply “The Arab World”. It is now several different countries. As would be expected the British drew the line around some non-Arab peoples and included these non-Arabs in Arab nations. For instance Iraq is an Arab nation but the Kurds are definitely not Arabs.
Some Arab nations are a little more lax than Saudi Arabia. Kuwait and Bahrain are such places. But even these nations are strict Islamic states. Women must wear their heads covered and cannot even date before marriage. Women have no rights in Saudi Arabia, other than those granted to them by their husbands, and very little rights in other Arab Nations.
On Java, an Indonesian Island, they have beaches where women wear bikinis and nothing on their heads. Virtually all non-Arab Islamic nations, to varying degrees, have more rights than Arab nations.
Thanks Ron. I seem to have a knack of stirring hornets’ nests over here. Note that I am in process of switching site host – more complex than I imagined. The above post on ISIS may disappear – may already have done so. I will re-post it when the dust settles.
The oppressive regime of Saddam Hussein was racked with insurgency, and when vicious repression failed, it delivered a portion of the vast oil revenues to the people in the form of government jobs, social services, and subsidized industries and agriculture. The oppressive United States occupation was racked with insurgency precisely because it tried to harness the country’s vast oil revenues to its imperial designs in the Middle East. The oppressive Maliki regime is now racked with insurgency, because the prime minister refused to share those same vast oil revenues with his Sunni constituents.
It has always been about the oil, stupid!
-MS
Michael Lynch says Peak Oil believers know nothing about science. Apparently he thinks science supports an infinite supply of oil.
Peak Oil 2: The True Believers
In many ways, this is reminiscent of the debate over vaccines and autism, where so much of the support comes from people with no medical or scientific background, but much fervor.
There are two Micheal Lynches.
The one referred to here is a either an idiot or a totally cynical mouthpiece that makes a good living spouting the business as usual line.
The bigger a lie is, the more likely it is to be able to convince the public it is true.
For such a person as this Micheal Lynch the goal is to maintain business as usual for as long as possible.Being right or wrong has nothing to do with such a goal.
My personal take is that he is a totally cynical mouthpiece willing to say anything for a buck.It is hard to imagine that he is convinced that there will always be plenty of affordable oil except possibly as a matter of religious conviction or some similar mindset if he has really spent years and years studying oil in depth.
I would not be surprised to hear his personal portfolio is geared toward a future where fossil fuels are in very short supply and extremely expensive.I hear about an anti gun nut every once in a while shooting some body prowling around their house.Same thing.
I am not a scientist myself but I have been in classrooms run by scientists for years at a stretch and other classrooms on occasion run by economists.
I have never read any thing by a traditional economist that indicates the author has a solid grasp of the physical sciences.All the economists of the traditional type that I have read have a touching but naive faith in human infallibility and technology.
They believe we can innovate and substitute our way out of any problem whatsoever just like my old Daddy believes he is going to Heaven.
On the other hand I can quote the USDA which has this to say about phosphorus.
“THERE IS NO SUBSTITUTE FOR PHOSPHORUS”. caps mine.
There is a zero possibility we can innovate our way out of a shortage of phosphorus with some miracle substitute or a technological work around.We will eventually have to get by with whatever we can recycle.
Lynch intimates that the people he mentions among geologists and physical scientists are the outliers. Nothing could be further from the truth. I doubt it is possible to find more than a handful of geologists who don’t work in the oil industry or some other business as usual industry and thus have skin in the game who do not believe in peak oil.
People whose investments and careers depend on the good will of the corporate world don’t usually say much about such things as peak oil in public.Farmers don’t like to talk about dead zones in the seas near river mouths which are in large part due to fertilizer runoff.
Michael Lynch credentials:
Mr. Lynch has combined SB-SM degrees in Political Science from MIT, and has performed a variety of studies related to international energy matters.
No idea what kind of degree that is, but it ain’t in Physics, Geology or Petroleum Engineering.
from wikipedia
”Political science is a social science discipline concerned with the study of the state, nation, government, and politics and policies of government. Aristotle defined it as the study of the state.[1] It deals extensively with the theory and practice of politics, and the analysis of political systems, political behavior, and political culture. Political scientists “see themselves engaged in revealing the relationships underlying political events and conditions, and from these revelations they attempt to construct general principles about the way the world of politics works.”[2] Political science intersects with other fields; including economics, law, sociology, history, anthropology, public administration, public policy, national politics, international relations, comparative politics, psychology, political organization, and political theory. Although it was codified in the 19th century, when all the social sciences were established, political science has ancient roots; indeed, it originated almost 2,500 years ago with the works of Plato and Aristotle.[3]”
Note that the physical sciences are not mentioned.
I used to hang out socially with a lot of people who majored in the social sciences because I lived in a gentrifying neighborhood close to a big university- where I was usually enrolled in at least one class as a ” special grad student” back in my younger days.
They made good natured fun of me as a cow college guy. I was generally appalled at their utter and absolute ignorance of the realities of the physical world as understood by hard science types.Agriculture is all hard science for the first two years and the second two are hard science and or specialized applications of hard science with a couple of courses in the humanities and social sciences somewhere along the way required to graduate.
This Lynch may actually be a cornucopian true believer. There are many many well educated people running around loose who believe in patently impossible things from talking snakes to an inexhaustible supply of affordable oil.
I have never looked up the course requirements at MIT for a degree in political science but my guess is that you can get one there with one single ” survey ” course in one hard science- taught at about the same level as basket weaving. No math no lab work no outside reading.
Such courses do not make any lasting intellectual impression on those who take them. It is generally in one ear and out the other.
I know this sounds strange considering the rep of MIT but I have looked up the requirements for soft science degrees and humanities degrees at half a dozen elite universities and just one hard science survey course is the norm.
Anybody interested can find such data on line but tracking it down is tedious indeed unless you are better at navigating unfamiliar websites than I am.
The easiest way to get it is with a cell phone( no long distance tolls) posing as a potential student interested in finding out if you have a course or courses that will transfer.
Graduating (from one of the world’s top science and engineering universities by virtually anybody’s reckoning in the case of MIT) without any meaningful training in the realities of our physical existence means that such a graduate is free to believe what he pleases about physical realities in a about the same sense that a person can choose to believe in Jesus or virgins in paradise or the tea party or the flag.
OFM Wrote:
“Political science is a social science discipline concerned with the study of the state, nation, government, and politics and policies of government…”
I think I can greatly simplify the Wiki article:
“Political science is the social science of Bullsh–ing the public” 🙂
I am pretty sure if all of the universities in the world stopped teaching Political science, the world would be a much happier and honest place!
Ron, OFM, and others,
I don’t understand why even bother quoting and discussing Lynch. Nothing can be gained, and after years of him beating a dead horse its not even entertaining anymore. Lynch is nothing more than an American Oil Baghdad Bob
Quote from Cool hand Luke (1967 movie):
“What we’ve got here is failure to communicate. Some men you just can’t reach. So you get what we had here last week – which is the way he wants it”
Hi All,
One might wonder why one Bakken model gives 5.8 Gb for a URR with 15,500 wells and a second “realistic” model results in a URR of 5.3 Gb with 17,400 wells.
I should have included this in the post, but it was getting too long so it was left out.
The 5.8 Gb model does not include any decrease in new well EUR, but simply adjusts the number of wells added after April 2014 to give a reasonable output profile. No economic assumptions were used to create the number of wells added, I used the average number of new wells added over the past 2 years (about 150 per month) and then gradually reduced the number of wells so that the output peak would occur in about 4 years. Each well added is exactly the same as the present “average well” (has the same EUR) over the 129 months covered by the model.
For that reason the model is not very realistic because at some point the new well EUR will decrease. Although we do not know when this will happen or what the rate of decrease in EUR will be when it does happen.
The realistic model of 5.3 Gb assumes that new well EUR starts to decrease in June 2014 and gradually increases to a 20% annual rate of decrease by June 2015. This rate of decrease continues until Jan 2016 when the number of new wells added starts to decrease. As fewer wells are added per month the rate of decrease becomes smaller. For example if 150 wells per month causes a 20% decrease in new well EUR, a smaller number like 75 wells added per month would only lead to a 10% decrease in new well EUR.
The number of wells added is a function of profitability and economic assumptions are used in this “realistic” model to determine the number of wells added.
It is assumed that well costs remain $9 million per well because recent decreases in well costs are being counteracted by new methods using more proppant and frack stages which tend to increase costs. Oil prices follow the EIA’s AEO 2014 reference scenario, transport costs are $12/barrel, royalties and taxes are 24.5% of wellhead revenue. operating expenses are $4/barrel, and the annual discount rate is 7% because all costs and prices are done in inflation adjusted dollars (equivalent to a 10% discount rate in nominal terms).
Much of this analysis is simply a copy of work that Rune Likvern has done and is a point forward analysis where sunk costs are ignored.
Also note that the 5.3 Gb scenario is at the low end of USGS estimates and if the USGS estimates are correct and my economic assumptions are correct there would be a greater than 95% probability that the North Dakota Bakken URR will be greater than 5.3 Gb.
Note also that proved reserves plus C+C output through Dec 2012 in the North Dakota Bakken were 3.9 Gb, so this is just 1.4 Gb more than that. The USGS Mean estimate for undiscovered technically recoverable resources(UTRR) is 5.8 Gb in the North Dakota Bakken and the F95 UTRR estimate is 3.5 Gb.
Chart with 5.3 Gb scenario with number of wells below
Edit: The well costs in the scenario decrease to 7 million by Feb 2016 rather than remaining at 9 million, sorry, I have other scenarios where well costs remain constant. Adding this assumption does not change the peak but ERR is reduced to 5 Gb and total wells are reduced to 15,400.
What is the percentage of recovery for continuous oil fields like the Bakken, using current technology?
Hi Allan,
This is hard to pin down due to the “continuous” nature of the fields, I have seen estimates of 1% to 3% of OOIP, OOIP has been estimated between 300 and 500 Gb. So 3 to 5 Gb at 1 % or 9 to 15Gb at 3%.
The TRR estimate by the USGS is about 8 to 12 Gb with a mean of 10 Gb, the economically recoverable resource(ERR) will be less, probably about 8 to 9 Gb. So if we assume OOIP=400 Gb and TRR=10 Gb that would be 2.5 % and if 8 Gb is the ERR, then recovery is 2%.
Not a very high recovery rate, lots of room for advancing that. Maybe there will be robotic drilling similar to long wall mining, to increase the recovery rate.
I wonder how doubling the recovery rate would effect your models.
Hi Allan,
The optimists think that the recovery rate or the OOIP is larger. If the recovery rate is double and the costs remain the same, output would double.
My models are based on USGS estimates, which are TRR=8 Gb at the 95% probability level and TRR=12 Gb at the 5% probability level.
We will have to see how much technology progresses. A lot of progress has been made since 2007 we may be reaching the point of diminishing returns where extra money spent on technology does not return enough extra oil to pay for itself.
Allen, like Dennis says it is hard to pin down what is meant by “continuous”. But I would submit that the word is meant for permeable conventional reservoirs where there is a “continuous” connection between one well and another. That is where, or if, water is injected along the periphery of a field the oil will be swept across the entire field toward the center, enhancing oil production in all wells in the reservoir.
In shale reservoirs, or light tight oil reservoirs, there is no connection between wells, unless of course a fracture from one well accidently connects to a fracture in in another. In a shale field like the Bakken oil cannot be swept, by water injection, toward the well intake. Therefore it can be said that shale reservoirs like the Bakken are not continious at all. Every well has it’s own tiny reservoir with no connection to the others.
In regard to historical Bakken decline rates, one point to keep in mind is “Survivorship bias.”
For example, if we look at an older Bakken Field (or any field), and if the average stabilized 20 year annual decline rate, after the first five years, is 7%/year or so, this does not mean that all wells that were productive in the first five years showed a long term 7%/year average decline rate over the subsequent 10 to 20 years, because a significant number of wells were plugged and abandoned, long before reaching the 15 to 25 year mark.
I have periodically talked about Chesapeake’s experience with the DFW Airport Lease in the Barnett Shale gas play. In 2007, Chesapeake claimed that the wells then producing would produce for “At least 50 years.” Five years later, about half the wells completed in 2007 had already been plugged and abandoned. So, it was clearly a mistake to apply a kind of multi-decade projected hyperbolic decline rate to all of the wells producing on the DFW Airport Lease in 2007.
I agree Jeffrey. Therefore, in my analyses I keep adding the 0 contribution from dead wells to calculate the average production at each time in the well life cycle.
Hi Jeff,
For North Dakota Bakken wells which started producing between Feb 2007 and Dec 2007 about 6 % had stopped producing by the end of 2013. As Enno points out above he fills in the zero values for all months after the well has stopped producing so the average output for those months is reduced accordingly, there is no survivorship bias in Enno’s data set.
My main point is that it is certainly not the case that 50% of the wells that came online in 2007 in the North Dakota Bakken have now been shut in, though a small percentage of wells (those that were marginal right from the start) have been shut in.
Then I guess we are all in agreement that it’s not realistic to apply a long term single digit projected decline rate to all wells that have been completed in the Bakken Play.
Incidentally, do you have an estimate for total number of wells completed in the Bakken Play for 2007 to 2013 inclusive that are no longer producing?
Hi Jeff,
I only looked at 2007, Enno’s data starts in Jan 2007 and the 1st month includes all wells that were producing that month so it includes about 150 wells from before Jan 2007.
I am pretty sure that the percentage for all of Feb 2007 to Dec 2013 would be lower, but have not crunched the numbers, perhaps Enno has that data.
Some new technology in the energy industry.
Waterless fracturing technology: http://www.expansion-energy.com/vrge_waterless_fracturing_technology
Advances in EOR processes: http://cdn.intechopen.com/pdfs-wm/37036.pdf
Liquid air power storage system: http://www.expansion-energy.com/vps_cycle_for_power_generation_and_power_storage
Linking concentrated solar power facilities: http://www.sciencedaily.com/releases/2014/06/140622142234.htm
“The outcome of this endeavor is our patented “VRGE(TM)” (pronounced “VeRGE”) “dry fracturing” technology (US Patent # 8,342,246) — available for license. Instead of water, VRGE utilizes cryogenically processed natural gas from nearby wells or from the targeted hydrocarbon formation itself as the fracturing medium and as part of a proprietary, non-toxic proppant-delivery system.”
That’s cheaper than water?
If water isn’t available…
Then it would not be cheaper, one guesses, but I don’t know of anywhere facing that.
The use of cryogenically processed natural gas from nearby wells as the fracturing medium sounds like killing EROEI.
Well, I read the whole thing. They were going to use the cryocooler to take waste (flared) gas and cryocool that and sell it as LNG.
I declare it all wacko and am moving on.
Hi Dennis,
Great job explaining a complex topic in an easy way!
This is exactly an item that is often misunderstood by people when they talk about average well/field output & declines. This shows that these functions are highly dynamic and very different from each other.
Two other observations:
– I think it is interesting to realize that the shape of the field as you have presented it also resembles the shape of the output of many of the companies that operate in these plays.
– I actually belief it is quite likely that there will a certain moment in the life time of these plays that there is a (relative) large sudden drop off in wells, and that therefore the shape you have shown is a very good rough approximation. Besides the 3 reasons you already mentioned (price, declining EUR, increasing well costs), there are several others as well, e.g. impact from regulations, weather, etc.
Thanks Enno.
You are absolutely correct that there are many factors that can affect the output curve and most (like the weather) are pretty unpredictable over the long term. The descent will not be a smooth curve as many point out, but on the way up at least the bumps up and down in production follow the model pretty closely. If the decline in the number of wells added (on a 12 month average basis) is anything like the model, then output will follow.
The wells added may drop off sharply, it depends on the behavior of oil companies, if there is a certain risk premium that they are looking for, say 5% ROI above the 10% discount rate they use for their net present value(NPV) calculations, and if this appetite for risk is pretty similar for all the companies involved then when the NPV (on a 15% basis)reaches the point where well costs and NPV are equal then the number of wells added may drop off very rapidly and we may well see the 30% or so maximum field decline, but it will only last a couple of years before dropping to more reasonable levels.
The other consideration is that some areas will be more productive than others so that oil companies will drop out depending on the productivity of the acreage they hold, so everyone stopping their drilling over a very short time period seems unlikely unless there is an outside shock (recession or a drop in oil prices for example).
“The other consideration is that some areas will be more productive than others so that oil companies will drop out depending on the productivity of the acreage they hold, so everyone stopping their drilling over a very short time period seems unlikely unless there is an outside shock (recession or a drop in oil prices for example).”
Or they are unable to borrow more money to support drilling. Once drillers can no longer show strong production growth, I very much doubt they can borrow money at their current rate. Lenders will become more cautious in the future and will not continue let the drillers borrow unless they can proof high returns on capital investments.
Dennis, early in my working days, I learnt about convolution. Back then and even after looking at your article, the math was easy to follow in the examples. What bothered me then and even today are these questions, “When would I use convolution?” “What will it tell me?” Maybe you can use your model to provide an answer. My basic question is “What was the question that you were trying to answer that led to use the convolution theorem?” Thanx in advance.
Hi Ovi,
The basic question is:”If I know the average well profile of a new well and the number of new wells added each month can a model be created which follows actual output?” The answer is yes.
Knowing this model one can predict future output if the EUR of the average new well is unchanged and one can estimate the future number of well added.
The question was prompted by Rune Likvern’s famous Red Queen post at the Oil Drum and several of his subsequent posts on the Bakken. I started with the NDIC data and the well profile which Rune Likvern gave in one of his posts and I was trying to reproduce his analysis.
An early attempt is at
http://oilpeakclimate.blogspot.com/2012/10/using-dispersive-diffusion-model-for.html
and
http://oilpeakclimate.blogspot.com/2012/12/update-on-bakken-model-using-hyperbolic.html
Other posts can be found at peak oil climate and sustainability
I actually did not even realize that I was using convolution until it was pointed out to me by Paul Pukite (aka Webhubbletelescope) in his last Oil Drum post.
http://www.theoildrum.com/node/10221
My motivation for using it here is because it is used in the Oil Shock model extensively and is a source of confusion for many. For those who are adept at mathematics, convolution is not a big deal and it tends to be a staple in areas such as signal processing.
I will not try to go into the oil shock model, but for those who prefer to read ahead see the Oil Conundrum which can be downloaded at the link below (see Chapters 5 and 6). Just click on down arrow on the right next to oil conundrum copy 2.
https://sites.google.com/site/dc78image/files-1
All tight oil production curves that I’ve seen show a hyperbolic decline going to infinity. I’m questioning whether this is a realistic assumption. What could possibly cause small volumes of oil to continue flowing indefinitely? You would think there would be a steep ramp down at some point and then the well would soon be capped.
Hi Frugal,
Many of the 190 or so North Dakota Bakken wells that were producing at the end of 2004 were brought online between 1982 and 1992, more than half came online between 1990 and 1992 so lets say the average age was about 13 years old, in early 2014, these wells were on average about 23 years old, with some as old as 31 years old. About 79 of these wells were still producing in early 2014, when we take the average output for these wells it is about 30 barrels per month, so the well profile may be a bit on the optimistic side at 355 kb over 30 years, note that through 6 years the average well produces 216 kb ( based on actual data from the NDIC). If we increase the annual decline rate on the exponential tail of the well profile to 10 % from 6.3 % the well profile over 30 years decreases by 30 kb, for 15000 wells this adds up to 0.3 Gb (assuming no EUR decrease to make the calculation simple). The decline rate never really becomes steep, the well becomes uneconomic at 1 to 2 barrels per day and the well is then capped.
Many of the 190 or so North Dakota Bakken wells that were producing at the end of 2004 were brought online between 1982 and 1992, more than half came online between 1990 and 1992 so lets say the average age was about 13 years old, in early 2014, these wells were on average about 23 years old, with some as old as 31 years old.
Dennis, these early wells, in the first phase of Bakken production, were conventional vertical wells drilled first in the Antelope Anticline then in the Billings Anticline. The oil seeped from natural fractures in the shale and was then trapped in the anticlines.
The second phase of Bakken production was very similar except it did not involve the anticlines.
A Brief History of Oil Production From the Bakken Formation
The second phase of Bakken activity occurred in the late 1970s and early 1980s (fi g. 3c) along the depositional limit of the Bakken Formation. Only the upper Bakken is present along this trend. Drilling concentrated on structural features over which the upper Bakken had thinned. Enhanced natural fracturing of the shale was expected in these settings based on the idea that the fracture density in thinner units is usually greater than in thicker units (Sperr, 1991). At least 26 fi elds have been established along this trend that extends from the Estes/Mondak area to Little Knife (fi g. 4). Most of the fi elds have multiple pays associated with structure such as folds, faults, or a combination of the two.
I do not think the decline rate from these old conventional wells can be used as a guide for later horizontal multi stage fracked wells.
Hi Ron,
You said,
“I do not think the decline rate from these old conventional wells can be used as a guide for later horizontal multi stage fracked wells.”
You may be correct, we do not know what these wells will produce in the future we can only estimate.
I tend, in the absence of concrete evidence to the contrary, to go with the expert opinion from the NDIC and USGS.
Report from USGS
http://pubs.usgs.gov/of/2013/1109/OF13-1109.pdf
My thinking is that a lot of the wells are in the area where the mean EUR is around 350 kb, as the room runs out in this sweet spot (the Eastern Transitional Zone) the EUR will decline as more drilling moves to the areas with EUR of 250 kb.
I could be wrong. For now the model matches output pretty well, if actual output falls below the model, I will adjust the model to reflect the data.
Time will tell.
“You may be correct, we do not know what these wells will produce in the future we can only estimate. ”
Why?
There is no data. Estimation is pretense that there is.
Very few 1.5 BOPD oil wells in America are economic, even at 100 dollar oil prices. The cost of handling produced water, depth of the well, artificial lift methods, regulatory issues, taxes that often exceed 38% of the revenue stream, and 25% royalty deductions are all extenuating costs that are escalating at incredible rates every year and don’t show up in computer models. Maintaining rod lift systems on low fluid entry, tight oil wells that pump from radiuses at 7000 feet or deeper is an economic nightmare.
No 18,000 ft. TMD horizontal well is ever going to be profitable at 1-2 BOPD, even at 150 dollar oil. At current oil prices, try 4-5 BOPD, but only if that tight oil well does not make water. If that well is making water ten years from now the economic limit will be more like 7-9 BOPD. There will not be enough cement in North Dakota, or Texas, to fill all those little puppies up.
Mike
So when companies abandon those wells whose going to pick up the tab for the cement job. Are companies required to set aside funds for decommissioning?
Yup.
Hmmm. I must look into this.
There are plug and abandon regulations that must be adhered to, but I’ll bet they all predate horizontals.
Mike’s question is powerful. Do you have to plug the horizontal run as well as the vertical? Maybe the cement will stop at the bottom of the hole when it curves horizontal. Maybe not. Hmmm, this is a non trivial question.
Typical borehole widens at the top to 1.5 feet, narrows to about 0.5 feet at the bottom. Call it an average of 1 foot. X 2 miles down.
pi R squared X 2 miles for volume of cement vertical only. 32970 cubic feet of cement. Anybody know if that’s a lot? haha
Dry cement is $80 / tonne UK, and is 42Kg/cu foot. I don’t know what mix with sand and water you use to plug a well, say 1/3 of the volume is cement then that costs
$37,000 not including sand
Prudent operators set aside decommissioning costs but a lot don’t and those wells get orphaned and end up being plugged by tax payers. The number of orphaned wells in Texas is sadly very high. Companies go bankrupt and walk.
The sequence of events that will unfold is that bigger public companies will not be able to operate marginal wells profitably, so they will sell the production to much smaller companies who think they can. They do for awhile but then when those wells become unprofitable for them, they walk.
I’d like to be able to say what it costs to plug an 18,000 TMD well and decommission the location to it’s original state, for instance remove tanks, pick up all the gravel to build the location and disc the soil to a point it will grow stuff again; I can’t. But 100K is a good guess. There are tens of thousands of 460 bbl. storage tanks in this tight oil stuff that in 10 years you will be able to give away on Ebay.
The point is, the economic limit for tight oil wells is much higher than public companies would like for the public to know. Those long fat tails on decline curves are lots of hoopla, IMO. You gotta know stuff like that to be able to make predictions about the future.
Good info Mike, but I wasn’t really thinking about $$$.
There are a lot of wells and the issue of how much cement exists in the whole state was where I thought that was going.
I suppose . . . ooooh, and this is interesting, companies may operate unprofitable wells to avoid the price of Plug and Abandon.
A note to Helmsley might be interesting about orphaned wells and let him heave a hand grenade into the next mtg with operators with a regulation that they must escrow cement costs for every well drilled.
haha what an explosion that will be.
Hi Mike,
When one looks at the older wells from the Bakken (from 1982 to 1992 for start dates), they tend to get shut in at about 1 to 2 barrels per day. The newer wells may behave differently
Hi Mike,
At the end of 2009 there were 222,000 oil wells in the US producing 4 barrels per day or less or 61% of the total number (363,000). Of these wells 174,000 were producing 2 barrels per day or less and 128,000 were producing 1 barrel per day or less.
Whether such low producing wells will be economic for horizontal fracked wells will depend on oil prices.
I would defer to the judgment of someone who is familiar with the costs of operating stripper wells as to what level would be economic at $100/barrel.
Link to EIA data on oil wells in 2009 below:
http://www.eia.gov/pub/oil_gas/petrosystem/us_table.html
I have a bunch of those stripper wells; that is how I feed my family and the families of my employees. Depending on a number of factors, 1.5 BOPD is the economic limit for any well unless it is <1000 ft. deep and makes no water and can be produced one or two days a month to make that amount. All oil wells make water and the older they are, generally speaking, the more water they make. In most places in S. Texas disposal fees are pushing 6 dollars a barrel depending on the length of the haul and the wait time and the disposal facility. A couple more disposal well induced earthquakes at just the right places and hold onto your knickers.
I don't know where the EIA gets it's data and don't much care. It of course does not know how many of those 125,000 1 BOPD wells are set to be plugged and abandoned. 5-6 BOPD is the economic limit on low fluid entry, long lateral, deep horizontal well, bet you the ranch. Ten years from now that will be higher.
Do we know how much bound, interstitial water these shale wells are going to make when they get older?
No.
Keep up the good work, y'all.
Mike
Hi Mike,
Do you expect the amount of water will be different for the horizontal fracked wells than the older vertical wells in the bakken, they have been producing oil in the Bakken since 1953 so there is a little history (not as much as Texas).
There are a bunch of older wells in the Bakken that are still producing at the rate of 1 to 2 barrels per day so I assume they are making money for someone or output would be zero. No doubt you are correct that 5 b/d may be the economic limit at present prices, though I expect that prices will rise.
Dennis, I think produced water will be the single biggest threat to predicted EURs from tight oil resources. Without question. I wish I knew the answer to your question.
I would seriously question whether those Bakken wells making 1.5 BOPD are making anybody money.
Yes, crude oil prices will rise but will that rise match the cost the inflationary cost of extraction? I don’t think so. In just the past 6 years my incremental lift costs per barrel have gone up 65%.
I don’t know how these shale wells will perform. What I do know that it will not be like everybody thinks. I most definitely do not believe that these shale wells will produce 50% of their EUR over a 20 year life span, or whatever the numbers are that you guys think.
The produced water issue to me is the big unknown.
Hi Mike,
Thanks.
If the well lasts for 30 years EUR is 348 kb, at 20 years the EUR is 318 kb. If we assume the average well is capped at 30 years then at 20 years 91% of the EUR has been produced. The model has these wells reaching 10 b/d at 22 years, if that is the limit the EUR becomes 325 kb, about 7% less than the current model.
Mike,
just found this abandonment program doing a google search, and it pretty much fits with what we do offshore.
http://www.epa.gov/region9/water/groundwater/uic-pdfs/el-centro/GeneralPluggingAbandonProcedure_Rev1.pdf
“Schedule for Agency Approval and Reporting of Well Plugging Operations
1. Plugged with cement from 2,740 to 2,200 feet.
2. Plugged with cement from 400 to 600 feet.
3. Plugged with cement 100 feet to surface”
So in short, cement the perfs,ie all the horizontal 7″ liner section, set a 500ft and a 100ft cement plug in the 9 5/8 casing and weld it shut.
So the entire length need not be plugged?
Watcher,
No, the complete well does not need to be full of cement. Just the areas open to the formation, a couple of cement plugs with the space in between full of weighted mud to balance the formation pressure.
The horizontal liner sections are getting kind of long now?
Howdy from the beach, Toolpush. And Watcher, howdy.
I don’t know how much production casing can be recovered from the lateral and radius in these stinking shale wells. Not much, if any. I think it will be SOP to set a big plug at the heel of the lateral and call that a day. But in the vertical section, onshore, in the great State of Texas, we have to have to ask the TCEQ where all the fresh water sands in every wellbore are and each of those sands has to be covered with a 100 ft. plug. You have to then WOC, tag that plug with a mandatory witness, before you can come up and set the next one. Some water sands have to be perforated and squeezed in pipe that is not recovered, WOC 6 hours, then tagged before the next plug can be set. Some wells along the GC require 8 different 100 ft. plugs. I can assure you that as concerns for groundwater protection go up, plugging costs will go way up.
I think in the EF, plugging costs will easily exceed 100K per well and the idea that you will be able to recover pipe, or that salvageable equipment costs will offset plugging costs, is bunk. And try this on, this would give anybody the heebie jeebies, every piece of that iron off a shale well is going to be subject to NORM regulations. Lordy, that is like cancer you cannot ever get rid of.
America will end up footing the bill for this little bump in production rates from tight oil resources, in a lot of ways that it is not even aware of yet.
Mike
Mike,
The 7″ liner set in the horizontal, would be fully cemented and therefore unable to be recovered. On the other hand the 9 5/8″ would only be partially cemented, dependent on local regulations and formations penetrated,eg your fresh water zones. In Russia, the regulations stated every string of casing had to be fully cemented due to permafrost issues. It didn’t seem to matter to the authorities we were offshore in the ocean and there was no permafrost to melt. We had to meet the regulations no matter what.
As for retrieving the 9 5/8″ casing, the only casing we recover is to make way for setting cement plugs across the cut, as we are required to remove the complete wellhead and all casing to 10 feet below the seabed. From the link I posted it appeared that in California at least, the 9 5/8 could be cut in the cellar, welded shut and the cellar filled in. I know this was a for an injection well, but I would have assumed it would be the same for producers as well. Is this the same in Texas? Or is it required to cut, retrieve and then cement off the fresh water zones as well?
As you say, NORM will affect all the production tubing, of which there will be of. Anyone for glow in the dark fence posts and railing?
Toolpush,
When you were drilling offshore in Russia were you on the continental shelf? That’s what I’d expect. If you were in the Arctic Ocean then there was permafrost in the shelf.
Synapsid,
We were off the coast of Sakhalin Is. We could see the beach and 100ft of water. There was ice in the water for 6 months of the year, and ice free the rest.Yes it was cold, but i don’t think there was any permafrost.
Though we did freeze the mud in the casing once in the air gap and had to drill it out. Funny watching ice cuttings on the shakers.
Toolpush,
Thanks. Sakhalin is a long way south; I wouldn’t expect permafrost there.
The stuff in the shelf north of Siberia is thousands or tens of thousands of years old, and is getting lots of publicity because it’s melting now, and that releases methane. Russia is drilling through it; as you found out, they’re used to drilling into permafrost.
All the Muslims have to do is commit apostasy and it all ends well.
Sooner than later the leases are going to expire and when that happens, the play might end. It is highly unlikely to happen, oil companies have built a great deal of infrastructure and aren’t about to abandon any of those hard assets and direct investments any time soon. At 1 million barrels per day production that has to be moved to the market, the industry is going to work to continue the business and it will continue as such.
The Bakken will be drilled for another 20 to 30 years, so the new wells will counteract decline rates. 30,000 wells at 33 bpd production is still 990,000 barrels per day. 100 million dollars of income each and every day speaks a lot of words. A well with an initial production of 300 bpd can decline 85 percent and still be profitable. A well can be reduced to 8 bpd and still be pumped. That would be about a 96 percent decline rate.
Don’t forget coal and potash in North Dakota and it resides in the Bakken only it is all 10,000 plus feet closer to the top ground and is above the Bakken. Oil isn’t the only thing there is for energy sources or other mineral deposits.
North Dakota has 12 percent of all of the world’s coal, so it is a no brainer that the mineral owner has more options available other than oil.
When the oil crisis hit during Jimmy Carter’s presidency what did he do to encourage an energy policy which was believed to be more comprehensive and had some thought involved with the decision? He encouraged more coal-fired power plants.
Coal will be the future that holds the energy picture in clear view. Abandoning coal as an energy source is like a mother abandoning a new born child in the wilderness. It is not going to happen.
Hi nobody will know,
Eventually the drilling will stop in the North Dakota Bakken. Below is an optimistic scenario based on a North Dakota Bakken TRR = 11 Gb, EUR starts to decrease in June 2017 and reaches its maximum annual rate of decrease of 15% in June 2021. Well costs are constant at $9 million and prices follow the EIA AEO 2014 reference scenario. Peak is in 2020 at 1.35 million b/d and 30,000 wells are drilled. See chart.
Peak Oil 2: The True Believers by Michael C Lynch is now available from Forbes https://groups.yahoo.com/neo/groups/energyresources/conversations/topics/67399
The below statement from the Commerce Department is confusing to me. Is condensate “light oil” as the statement suggests? Somehow many posts on this site have suggested otherwise.
The Commerce Department has issued separate private rulings allowing two companies, Pioneer Natural Resources Co. and Enterprise Products Partners L.P., to export condensate — a light hydrocarbon that remains liquid at normal temperature and pressure — under the condition that the condensate will be stabilized and distilled. These are two early phases of the refining process that don’t turn the light oil — which is what condensate ultimately is — into a finished fuel like gasoline, which U.S. companies are allowed to export.
Hi Dana,
Condensate is not really “light oil”, it is sometimes called natural gasoline, it is a liquid, but not really the same as crude oil which can be refined into diesel fuel, gasoline, jet fuel, residual oil, and other products. Condensate can be blended with crude at the refinery, but cannot be used on its own to produce diesel fuel. These days a lot of the condensate is shipped to Canada to blend with oil sands so that it can flow in pipelines. The LTO plays produce a lot of condensate (especially the Eagle Ford) so there is a relative glut of condensate in the US.
Dennis,
I thank you for this outstanding lecture.
I believe indeed the big unknowns are the number of future wells and the future well profile. The data show hints of an already increasing well decline rate, which will eventually turn out to result in an increasing field decline.
Hi Verwimp,
Thanks,
So far, looking at actual well data I see no significant changes in the well profile. Note that when I say “field decline” I am talking about the point at which the entire play starts to decrease in output.
This is different from the legacy decline rate which has been decreasing in magnitude (or absolute value).
Hi Verwimp,
I modified the first Bakken scenario (the less “realistic one) to 4.5 Gb by reducing the number of wells added to 12,070 wells the spread sheet can be downloaded at link below:
https://drive.google.com/file/d/0B4nArV09d398dVhxMS04UGw2UGs/edit?usp=sharing
Just click on down arrow on upper left to download.
I show the annual legacy decline rate from Month 47 (which corresponds to February 2014) and compare with the annual field decline rate which does not begin to decline on an annual basis until month 79. Output is shown on the left axis and the annual decline Rates on the right axis. Chart below. This is a North Dakota Bakken scenario and it is very conservative, I expect North Dakota Bakken URR to be almost double this scenario (or about 8 to 9 Gb) though the peak will only be a little higher maybe 1.2 million b/d in 2018.
Thanks again for sharing your excel sheets.
DC: “I see no significant changes in the well profile”
Verwimp: “The data show hints of an already increasing well decline rate”
Help! We are in need of a statistician 🙂
The reverse engineered Enno-data (earlier version), with the arctan-approach for the cumulative curve, gave me this extrapolation of the production curves (the wobbly parts of the curves are real data, the smooth parts are modelled.)
I have reason to believe the often cited “sweet spots first”-theory is valid. So the future wells may have an even higher initial production (due to technological improvement), but the EUR is lower (due to decreasing “sweetness” of the spot), resulting in a higher well decline rate.
Dennis, what is your opinion on the financial context of the Bakken shale play? Isn’t the debt bubble unsustainable, leading to a rather sudden death of drilling activity?
Hi Verwimp,
Thanks for sharing that. Maybe the difference is that I filtered out the non Bakken wells, you may have done your analysis on all North Dakota wells (which is the data that Enno charts.)
He provided me with the data showing which formations the wells were in and I only looked at Bakken and Bakken/Three Forks wells.
For those wells there has not been a significant change since 2008, I also did not try to extrapolate any trends, except on the “average well” to get a 30 year estimated well profile.
There has been some fluctuation in output from month to month and year to year, but so far it looks like random noise to me.
Hi Verwimp,
I do not think the finances are as bad as some think. If oil prices follow the EIA’s AEO 2014 reference case and well costs remain flat (in real terms) things will depend primarily on how fast EUR decreases over time. If oil prices spike and a depression occurs then oil prices will drop and drilling will cease.
Lots of moving parts, but I think the “debt bubble” is pretty low on the list of potential problems, and there are many of those, all impossible to model.
My models assume we muddle along without major shocks to the system, when these shocks do occur the model will fail badly.
There seems to be some confusion over the export of crude oil out of Northern Iraq.
The flow of Iraqi Oil oil along the Kirkuk-Ceyhan pipeline seems to have fallen from 600,000 to zero.
The flow of Kurdish Oil oil along the Kirkuk-Ceyhan pipeline seems to have increased from from zero to 250,000 barrels per day.
It is the same oil just a different military on the ground controlling the source.
So Euan Mearns is technically correct that Kurdish oil is increasing but the flow is lower overall.
For some details see
the link to this article didn’t work. UPDATE 2-Iraqi Kurds link Kirkuk to own oil pipeline, plan more exports
http://www.reuters.com/article/2014/06/17/iraq-kurdistan-exports-idUSL5N0OY2PI20140617
There is a report tonight that ISIS “have taken control of several minor oil fields”.
I would have been more comfortable with that had it said oil wells. Regardless, they do know how to get this sold around all sanctions.
The fundamental problem I see with the whole partitioning shebang is the Sunnis won’t have any oil. The Kurds would and the Shiites would. So no way that flies. And then there is that pesky little thing about any country’s head of state tolerating loss of territory.
Were I Maliki I would get fighter aircraft delivered (in the pipeline, as it were) and pilots trained and then send personnel up to Kurdish areas posturing as taking administrative charge. If opposed by force, bomb them.
Syrian planes are now bombing ISIS in Iraq, and in typical Assad style this means bombing civilians on the assumption that some of them must be ISIS members.
I wonder if they asked Malaki first.
http://online.wsj.com/articles/share-prices-of-u-s-oil-refiners-tumble-on-obama-move-on-exports-1403715825
It does appear that the refiners have been capturing some excess profits which I suspected to be the case.Otherwise the price of the stocks should not be going down.
Of course some of the savings due to low crude costs may have been passed along to consumers in a few parts of the country.I seem to remember hearing that gasoline in the upper mid west has been cheaper than elsewhere in recent times.
Mid-continent refiners have been happily paying WTI prices for crude oil, but largely charging Brent based prices for refined products. When we saw the very large Brent/WTI price spreads in years past, WTI crack spreads were as high as $30 or so, while Brent crack spreads were more like $10 (the crack spread is the difference between the price paid for crude and the price charged for refined products).
I always post an email announcement to about 125 people when A new post is up. The last one read:
“A new post by Coyne has just been published, Oil Field Models, Decline Rates and Convolution. Hope you like it.”
Jean Laherrere replied.
Ron
I don’t
too much modeling and not enough past data to fit the models
it is necessary to combine outside oil production, gas production, wells, rigs, investments and price
best regards
jean
Sorry Dennis 😉
Hi Ron,
Oh well. The main idea was to show that if we have a well profile and it does not change in the future and know the number of wells that will be added in the future we can predict future output.
We don’t really have either of those things. We have well data (thanks to Enno Peters of late and Rune Likvern before that) for the North Dakotas Bakken, but only since 2008 so for 6 years at most.
Clearly we do not know how many wells will be added in the future we can only guess.
I suppose we can just wait another 24 years and we will have all the data we need. 🙂
In my “realistic” model I ignore gas production (which does not produce a lot of net revenue at present prices) as a simplification, oil prices, well costs, royalties and taxes, transport costs, and the annual discount rate (used to calculate net present value of future oil output) are all included.
Rigs are not a huge factor as there are other bottlenecks (primarily the speed with which drilled wells can be fracked).
You can please some of the people some of the time …
“too much modeling and not enough past data to fit the models”
That is indeed true. Ofcourse. But it takes courage to work on that limited set of data, to try to make some prediction. To, as informed as one can be, taking into account every possible change in every imaginable variable, generate numbers. Numbers that allways seem to be far from “energy independence of the USA”. It takes courage to try to beat the output of MSM, to try to warn people, to give a reality check. And so on. I have allways loved every attempt of making educated extrapolations, since I started reading TOD several year ago. Educated extrapolations is all that Peak Oil is about, no?
ISIS details, source is a think tank funded site that doesn’t seem to be a blog– The LongWar Journal. Shrug.
>>
“Yesterday, ISIS took control of the Ajeel oil wells, which lie east of Tikrit and Bayji in Salahaddin provinces. There are four wells listed in the area: Ajeel, Ajeel 6, Ajeel 24, and Ajeel North 1, and they put out an estimated 28,000 barrels of oil per day. In addition, a natural gas field, also called Ajeel, is situated near the wells.
Today ISIS took control of the town of Mansouriyat al-Jabal, which is just north of the city of Miqdadiyah in Diyala province. An oil well known as Mansuriyah 1 is operated near the town.”
>>
>>
And across the border in Syria, ISIS is said to have taken control of the Al Omar oil field and facility in Deir al Zour province near the town of Al Mayadin.
>>
$2.8 million / day.
http://www.aawsat.net/2014/06/article55333646
Jaw dropping stuff here:
““ISIS have a lot of experts, including oil experts,” said the source.
Read the last few paragraphs about lines at gas stations. We are NOT getting these details in our own media.
That Syrian oil field they have does another 20,000 bpd.
Due to the Sunnis previously running the whole country, then getting completely disenfranchised, I have no doubt that Sunni militant groups with money can come up with any set of expertise Iraq had.
More recent expertise from KSA.
“Rollin’ Coal” Is Pollution Porn for Dudes With Pickup Trucks
Diesel drivers in rural America have been modifying their trucks to spew out black soot, then posting pics to the Internet. They hate you and your Prius
Author: Elizabeth Kulze, Posted: 06/16/14
They will hate me, I just bought my daughter a Mitsubishi Mirage in the US, she found a boy friend over there and is on an extended stay. Brand new out of the box it is doing 49.3 mpg on the freeway and about 45 mph in town. A lot better than the quoted 37/42 for a combined 40 mpg. So I am not sure why the Prius gets all the credit when there are a few other very economical cars running around unrecognized.
I was really surprised at the US car market. I was originally looking at a decent small second hand car, but 100,000 mile cars were going $7,000 plus, due to cheap long term loans, where the loan will most likely last longer than the car. For not much more I think we handed the dealer $12,100 then $1,300 for tax and rego, we got a brand new 5 year full, and a 10 years drive train warranty car with all the latest safety features and astonishing fuel economy.
Natural Gas Weekly Update
for week ending June 25, 2014 | Release Date: June 26, 2014
Producers wait for herd rebuild
PETER KOSTOS, Stock & Land, 26 Jun, 2014 04:00 AM
Methane emissions from cattle likely in decline with diminished herds.
Goldman Says Shale Gas Boom Driving Fear From Market
Gone will be the near tripling of costs to $15.78 as in 2005 as traders remain confident the fuel will be there when needed. Natural gas will trade “largely” at $4 to $5 per million British thermal units for the next 20 years, says Goldman Sachs. Societe Generale SA sees prices at $5 through 2019. Bank of America Corp. forecasts $5.50 for 2017, while BlackRock Inc. projects $4 to $5 for the next decade.
Prices were four times more volatile in 2009 than they are today as production grows for the ninth straight year and new pipelines deliver the fuel to customers. Gas for use next winter costs 3.2 percent more than now, the smallest premium for the peak-demand period since 2000. Stockpiles will start the heating season at the lowest levels since 2008.
“The market is rightfully not that worried because you have so much supply that is coming online,” Jeffrey Currie, head of commodities research at Goldman Sachs in New York, said in a June 23 telephone interview. “We have enough flexibility in the supply system.”…
The U.S. Energy Information Administration forecasts natural gas prices will average below $5 through 2023 and less than $6 until 2030. The fuel will average less than $5 through 2017, based on analyst estimates compiled by Bloomberg.
Fears of gas shortages have dissipated since 2005, when hurricanes Katrina and Rita damaged Gulf of Mexico production platforms. Offshore gas accounted for 5 percent of U.S. supplies last year, dropping from 17 percent in 2005, as shale-gas output, boosted by hydraulic fracturing, or fracking, surged from Pennsylvania to Texas.
U.S. output will increase 4 percent in 2014 to a record for the fourth consecutive year, according to the EIA, the Energy Department’s statistical arm.
You’re paying more for gasoline, and here’s why
Here’s the explanation for the stubbornly high prices: Fear has gripped oil trading markets, after the Islamic State of Iraq and Syria, known as ISIS, seized the Iraqi city of Mosul on June 10 and Fallujah soon afterward.
Financial traders fear a collapse of the Iraqi state that could suck Iran and Saudi Arabia into a regional conflict that threatens oil supplies. And those financial players far outnumber actual end users of oil in the markets where contracts for future barrels of oil are traded.
Iraq is a becoming a more important Middle East exporter over the past five years and is now the second largest producer in the Organization of Petroleum Exporting Countries. But OPEC Secretary General Abdalla El-Badri said this week that there is no oil supply shortage in Iraq and blamed the recent increase in oil prices on speculative trading in the markets.
“Right now the market is very well supplied,” he told reporters in Brussels on Wednesday. He pledged that OPEC could increase production if there is a disruption.
Iraq’s main oilfields are deep in the Shiite Muslim South, an area that is hostile to the Sunni Muslim ISIS. The global energy consulting firm IHS said the fields are protected by government forces as well as Shiite militias, and that an ISIS offensive against them would require substantial fuel and be difficult to sustain for long.
Despite the fears in financial markets, ISIS is unlikely to disrupt Iraqi oil exports, said IHS senior director Jamie Webster, a position widely shared among experts.
Robert McNally, an energy consultant and founder of the Rapidan Group in Washington, suggested that Iraq’s semiautonomous Kurdish region might be able to actually increase oil exports from northern Iraq after seizing the city of Kirkuk in the midst of the crisis.
There have been reports the Kurds already are starting to export oil independently while the central Iraqi government based in Baghdad is in turmoil.
While reports out of Iraq suggest production and export are, for now, unaffected, big global oil companies won’t discuss their production there.
“We don’t have any comment,” said Richard D. Keil, a spokesman for ExxonMobil in Irving, Texas.
There’s little incentive for Keil to discuss production, since the fear gripping financial markets is tantamount to free money for the oil companies. ExxonMobil and other large players reap a windfall from higher oil prices and suffer if prices collapse, as they did during the Great Recession.
What’s particularly galling for many Americans is that the energy industry and its allies in Congress, when pushing for the rights to expand domestic drilling of oil and natural gas, insisted this new production would amount to energy independence and insulate U.S. consumers from events in the faraway Middle East.
John Felmy, chief economist of the American Petroleum Institute, said the Iraq crisis comes at a time when the oil markets already have lost expected supplies of crude from other troubled areas of the globe. He pointed to sanctions against Iran and lost production as a result of problems in South Sudan and Libya.
“It’s not just Iraq, of course. We’ve lost a couple of million barrels per day of capacity . . . at the same time you’ve had growth in world demand . . . about 1.3 million (barrels per day),” Felmy said. “It’s a tighter market, and if not from the increased U.S. production, it would be even tighter.”
As already shown, shut in oil totals of today are small in comparison to historical norms of the past 40 yrs.
And let’s also note that WTI was logging in well north of $100 long before we’d ever heard of ISIS, or before Kiev ever appeared on any headlines.
The really ominous thing? It was doing this in Q1, as the US was doing -2.9% GDP activity, and as we all know, GDP growth is defined by oil consumption.
So that price was there as consumption had to be down, and prior to any geopolitics fears. So, yes, there is a supply problem, but it ain’t from war fears.
People have incredibly short memories- probably some animals have better ones. My old Daddy says that he never caught a fox back in his younger days when he did a lot of trapping for fun and profit at a spot where a fox escaped a trap- not even years later.
In less than a decade, we have as a society almost totally forgotten that oil used to sell for twenty bucks or so a barrel no more than fifteen years ago and that before that five and ten dollar oil was common.
If any other commodity had gone up so fast the people in that industry would never let us forget it -not for a single minute would they quit bragging about how much money they have made by predicting short supplies and increasing demand.
A decade or two is only a yawn in terms of history although big events can turn that yawn into a scream and change the course of history thereafter.
The people who are insisting we are well supplied with oil are counting on us having a collective memory not much better than a chicken.
And sad to say, they are safe in making that assumption.
Noboby has ever gone broke overestimating the gullibility of the general public.
But even chickens can learn a little given repeated opportunities.In another decade or so the public is finally going to gain a glimmer of understanding of depleting natural resources with oil and water being at the top of the list.
IF I were younger and a technocopian optimist I would sell my little farm and invest every dime in Tesla.
I believe Elon Musk is one of the best thinkers in the entire history of industry when it comes to understanding the big picture. Right now my estimation of his strategy is that it is the same as that of Microsoft. To hell with the computer itself,Bill Gates made his money by owning the dominant software.Musk will own the dominant technology in electric vehicles and be licensing out tons of it later at affordable rates to other manufacturers.
Suppose he gets a hundred bucks a car for two million cars a year ten years now.That is a very very conservative estimate of the possibilities in my opinion.That two hundred million would be in addition to whatever he earns on his own cars and most likely by then light trucks too.
A lot of countries are going to enforce the sale of battery electric vehicles by taxing the hell out of imported fuel and imported gasoline and diesel burning personal vehicles. Direct electric vehicle subsidies will not be necessary in a two hundred bucks a barrel oil market in any country that imports both vehicles and oil.
The last people to get it will be the conventional economists of course.
And paradoxically I believe they would be proven right in their faith in human ingenuity if only business as usual could persist for another half a century or a century or so.I do believe that given time enough we could solve almost any sort of problem in terms of maintaining a wealthy industrial society.But ” time enough ” means a LONG time in human terms.
But the oil fueled ambulance that is hauling society to the techno hospital is going to run out of diesel before it makes it to the E R ramp.
OFM: “Musk will own the dominant technology in electric vehicles and be licensing out tons of it later at affordable rates to other manufacturers.”
Ahem:
http://www.forbes.com/sites/briansolomon/2014/06/12/tesla-goes-open-source-elon-musk-releases-patents-to-good-faith-use/
http://www.shaledispatch.com/test-fracking-for-shale-gas-gets-the-go-ahead-in-western-australia/
An article giving the go ahead for tight gas in shale, with the “F” word attached,ie Fraccinf, in Australia.
The interesting line I thought was ” Each frack is predicted to extend up to 100 m vertically and 300m horizontally”. So I am not sure how indicative these distances are of other locations, but it is the first time I have seen anybody quote actual numbers. So just to convert, 330 ft x 990ft.
We maybe could use these number to work out the total number of wells able to be drilled in the Bakken, assuming a horizontal section of approx 2 miles.
Also the max number of wells from a pad, assuming the max deviation of 30 deg at 10,000ft gives 7500 ft displacement from centre. So potentially 7 wells drilled north and 7 drilled south, would mean a max of 14 wells per pad per zone.
It sounds like there is some way to go to intensify pad drilling as it stands at the moment.
Hi ToolPusher,
The distance that a fracture will propagate is dependent on several factors. The density of the stone, the intervening natural fractures, and the grain of the stone. Almost all stones are anisotropic, that is, they are stronger in one direction than they are in the other. Structural slate deposits, for example, may be 20 to 50% stronger “across the grain” than they are “on the grain”. Fracture mechanics is a science all of its own. The best place to get additional information is the Colorado School of Mines. They have a huge library of research information on the subject. You’ll probably have to pay for most of it, but their prices are reasonable. The internet is the only place where people expect to get something for nothing, and the quality of much of it is dubious at best.
Maximum fracture propagation of 1000 feet sounds about right for a shale/slate like formation. That is, if the grain of the stone is perpendicular to the bedding planes. Early frac’ing technology was limited to less than 100 feet, and was done with black powder. If the grain of this Ausi formation lies across the bedding planes 330 feet vertically sounds quite unlikely unless this is a very unusual formation; that is, very weak grained with few intervening natural fractures. 50 to 100 feet would be more likely. Hope this helps a little.
http://www.thehillsgroup.org/
Michael Lynch has another Peak Oil Denier Forbes article up this morning.
Peak Oil 3: Has Production Peaked?
The remnants of the peak oil community cling avidly to the belief that oil production has already peaked and that high prices prove this. “Look at the data” seems to have become a catechism amongst them, and it can be hard to dissuade them otherwise, especially by considering more than one variable as explaining oil supply and price.
Most anyone can understand that high oil prices are no more an indicator of resource scarcity than the occasional spike in coffee, pork or orange juice prices.
That is about the dumbest thing I have ever heard in my life. High prices are almost always an indicator of resource scarcity.
Things happen that can cause prices to rise for a period before supply and demand can re-equilibrate, with oil particularly vulnerable to political disruptions–witness developments in Iraq, Iran, Libya, Nigeria to name the primary ones.
Those things are all examples of causes of resource scarcity just as a hard freeze can cause resource scarcity, and high prices, for orange juice. Just because something caused it does not mean that is resource scarcity.
Well Brent has been above $100 a barrel for about three and one half years now. It is about time it re-equilibrated.
He has to argue that high prices don’t matter, because oil prices have not been at the low levels that he predicted, for years, that we would see.
Michael C. Lynch (August, 2009:
Peak Oil’ Is a Waste of Energy
http://www.nytimes.com/2009/08/25/opinion/25lynch.html?pagewanted=all&_r=0
Hi Jeff and Ron,
Although I disagree with most of what Lynch has to say, he is correct that oil has not peaked. One way to counter the “all liquids” argument is to track all liquids, but discount the NGL and biofuels according to their energy content relative to crude.
It is a painful process to do this, but in rough terms if we take 70% of the barrels of ethanol and NGL, that gets us pretty close to a “barrel of oil equivalent” (boe). Chart below was done a while ago, data through June 2013 from the EIA.
My usual argument.
Hi Jeff,
My point was not to disagree with your point. Just another line of attack.
All liquids increased about 5% since 2005, C+C increased about 3%, maybe crude didn’t increase at all, though for a long time the World has combined crude plus condensate when accounting for oil, so as I have said before focusing on crude plus condensate is best in my opinion.
That link should be sent to Forbes, so they can think more carefully about who they fund.
Forbes knows the hand that feeds them.
Even National Petroleum Radio gets the message:
http://my.firedoglake.com/msmolly/2014/06/27/over-easy-movies-the-koch-brothers-dont-want-us-to-see/
Another example:
http://www.newyorker.com/reporting/2013/05/27/130527fa_fact_mayer
It’s great to find somoene so on the ball
Mike, you mentioned “Dennis, I think produced water will be the single biggest threat to predicted EURs from tight oil resources.”
Until thus far I ignored the water data in the NDIC reports, but it is available. I don’t know the accuracy, but just glancing at the data there don’t seem to be major errors in it.
Below I post 3 graphs:
1) Cumulative oil production per starting year. The same graph I posted before, showing the average oil production for wells starting production in a certain year.
2) Cumulative water production per starting year. This graph is exactly the same as 1), except that it shows the average cumulative water production, instead of oil production.
3) Total water production in North Dakota. This shows that quite some water was already produced with the old wells in North Dakota, until recently. Water production initially slowly increased with the new oil production, but as also can be seen from graph 2), newer wells are producing more water.
I hope Mike or someone else can chime in with thoughts on this average well/overall water production.
The last graph was slightly incorrect, here the update.
Hi Enno,
Very interesting thanks.
I think the water becomes more important toward the end of the wells life. So the ratio of oil to water and how it changes from year 3 to year 7 of the well’s life (as we only have about 7 years of data for Bakken wells).
At this point we just don’t know, but Mike’s intuition is likely correct when these horizontal fracked wells get down to 7 b/d (or possibly even 10 b/d if costs rise faster than oil prices) the wells will be capped. The question then becomes how quickly do we get down to 10 b/d, I am doubtful that the terminal decline rate (exponential tail of well profile) is any larger than 10%. If that is correct the 10 b/d level is reached at about 20 years and the new well EUR decreases by about 7%. Those last 10 years from 20 to 30 years are very low output so it does not really change thing very much.
NoDak needs to think about this in the context of Mike’s comment.
When flow gets low, the big company wants to sell it. They will sell the well to some newly formed LLC that will collect money for a year or so as it flows 7 bpd and then 6 and then 5 and then 4 — at which point, being an LLC with no other assets, they walk away.
And there is the well, unplugged and leaking residual radioactive stage markers onto the surface.
NoDak should refuse to allow purchase of wells by LLCs without plug and abandon escrow.
Watcher, in Texas all operators must now post a bond with the Texas Railroad Commission to cover the cost of plugging abandoned wells. Several years ago the cost of drilling permits was raised significantly and those additional funds were earmarked for plugging orphaned wells in Texas. Also, it is next to impossible to assign, or convey, plugging liability from one operator to another without bonds being in place at the time of conveyance.
I suspect that N.D. has, like most of the world, taken the TRRC’s lead in this regard, as well as most regulatory matters. I hope so, anyway.
Mike
Hi, Enno, that’s some good work; thank you. Cleary the oil to water ratio for North Dakota wells began to increase at the time the Bakken was ramping up and that makes perfect sense to me given the enormous number of wells drilled and that few of those wells make water initially, other than small amounts of induced frac water. Dennis is correct, typically produced water begins to increase as reservoir depletion occurs.
I guess for all the ranting I’ve done about the costs of water production and the effects of water on late-life well economics, it occurs to me that these tight oil wells do not produce from conventional reservoirs that often are associated with structural traps and that often contain underlying connate water. In other words, each tight oil well produces only that oil in place around the wellbore, within the frac radius, that it created for itself. Each shale well more or less makes a space for itself in dense shale, drains that space, and that’s that. Its hard to think of the Bakken as one vast, homogenous reservoir, like for instance, Ghawar where an ocean of oil use to sit on an ocean of water. The big question to me is how much interstitial water there is bound in the shale matrix that will begin to increase over time and reduce OWR. I don’t know, others surely do.
In Texas we do not report water production each month from individual wells. I would not expect a public company needing desperately to sell stock and raise investment capital to want to volunteer something as ominous as increasing produced water rates. So water is like a 4 letter word in the shale patch and it seldom gets uttered. As I drive up and down S. Texas highways, however, the vacuum truck traffic hauling water to disposal systems is enormous and growing. There are waiting lines going into disposal facilities, 24/7. Not all of that is flowback frac water, I guarantee.
If N.D, on the other hand, does require monthly water production on a well by well, or unit by unit basis, it would be fascinating to see if, and to what extent, the OWR is declining on individual tight oil wells over time.
Thanks Mike & others for your comments, very interesting.
Hi Mike,
I really appreciate your comments I have learned a lot from what you have said. Please continue to point out any mistakes I make.
I am no oil man and can learn much from people who actually produce oil.
Thanks, Dennis. We’ll learn together, all of us. So we can take the message of peak production rates to the street.
There is also a question as to often and to what extent that the massive frac jobs break into water bearing zones, and as pressure depletion continues around the fractures, water encroachment from water bearing zones increases.
Westexas, goodonya. Along the EF trend, updip from the shelf margin, there are lots of growth faults associated with sediment slumping towards the basin. These faults often have lots of displacement and grow with depth. In the overlying Austin Chalk carbonate, these growth faults can be connected to the underlying Edwards ocean, so to speak, and lots of very, very salty water was produced from the Chalk when wells were frac’d too close to these big faults. Now and then we’ll hear of a shale well in the EF that is frac’d and makes no hydrocarbons and mucho 150,000 ppm chlorides water…from the Edwards. It is a very good point you bring up.
The natives are getting restless:
http://www.theguardian.com/environment/2014/jun/30/new-york-towns-prohibit-fracking-court-rules
Enno,
That is some excellent charts and information.
To me there are two observations worth noticing;
1) Looking at wells by vintage it appears as water production has grown faster than oil production.
2) It could be interesting to see how the water oil ratio (or its inverse) developed with time. Water to oil ratio appears to be growing with time.
I do not know about the chemical composition from the produced water, but somehow the produced water is disposed of.
Water normally flows more willingly than oil.
The chart below shows the ratio of the water produced vs oil produced, using the same data. The strange peaks/drops at the end of the tails are indeed in the data. I can’t really explain it, except that the number of wells at the last 12 points in each tail is dropping, because wells from those years did not reach that age yet, and therefore the last point only contains the January wells from that year, which can cause some erratic behavior (low denominator).
Enno,
Thanks a lot for your work and sharing!
From your chart(s) there appear to be one trend (barring any noise in the data); the water to oil ratio has increased with time both for the “older” legacy wells, but also for the newer wells.
Water, oil and natural gas flows co-mingled in the wells and looking at your charts it appears as with time, total liquid flow for “newer” wells has increased and so has the water to oil ratio.
Thanks Enno.
Great stuff. Seems like it leveled off in 2013 (similar level to 2012), 2014 probably too early to tell.
Yikes, Enno. I don’t like what I see in your data.
I wonder; I said in Texas we do not report water production per well every month and that is true. We do, however, estimate, loosely, water production per well each annual quarter. I wonder if N.D. does not do the same thing?
The inestimable Mr Lynch is still explaining why guys who majored in the sciences and have spent their life working in the sciences are ignorant of the realities of oil over at Forbes whereas the economists know all about it.
My maternal grand father once had a beautiful 62 Chevy two door hardtop that really was driven only to church and the doctors office. He bought it new after retiring and it had only a few thousand miles on it in the mid eighties when he decided to park it under an old shade tree instead of the carport as usual.We all tried to explain that the tree was rotten and just about dead and thus in danger of falling on the car but the old fellow got more stubborn by the day being close on to a hundred and would not listen.If we had not said anything he would probably have put it back in the carport.
He reminds me of the cornucopian element of businessmen who do not believe something that comes out of a hole in the ground will ever run short.
At one time I battled Lynch when he commented over at http://peakoil.com under the handle “spike”.
Lynch has now inherited the oil business analyst title from his mentor Morris Adelman, who died recently. http://www.masterresource.org/2013/05/peak-oil-dead-adelman/
The guy who wrote that piece, Rob Bradley, was public relations director for Enron and speechwriter for CEO Kenneth Lay
The name Morris Adelman appears in the Warren Commission Report on the assassination of JFK. Adelman is described as a “communist party organizer in the Chicago area”.
Funny what you find when you follow the crumb trail.
The guy who wrote that piece, Rob Bradley, was public relations director for Enron and speechwriter for CEO Kenneth Lay
Late stage capitalism was never going to be fun.
But a bit surreal, and without a moral compass.
RRC PRODUCTION STATISTICS AND ALLOWABLES FOR JULY 2014
http://www.rrc.state.tx.us/all-news/062514b/
“The Railroad Commission of Texas’ estimated final production for April 2014 is 72,632,766 barrels of crude oil”, which means 2421092 bbl/day.
My corrected model gave (reported in the comments of the previous post):
2455818 bbl/day using the correction with absolute numbers
2461750 bbl/day using the correction with percentages
Not bad… I am quite close ^_^ !
P.S. these numbers are for oil only, no condensate (RRC does not give final estimates for condensate)
Hi Dean,
I think if you look back at older reports, you will find that the RRC usually underpredicts even with the adjustment factor.
Thanks. I will have a look at them
I considered for curiosity the data before September 2013 because, for those data, the EIA data and my corrected data show a difference which is smaller than 1%. I found that for 2013 data, the adjusted RRC data are usually underestimated with respect to EIA and my corrected data of an amount close to 5%. For 2012 data, the underestimation ranged between 5% and 10%. However, the level of underestimation tends to decrease over time (I suppose because the oil growth in Texas is decreasing and oil production will probably reach a maximum at the end of 2014 / beginning of 2015).
Fun at Forbes——excerpts
…Michael Lynch, 2 days ago
We don’t plant petroleum but we explore for it.
Reply
Rob Rob 2 days ago
And, as you showed in the graph in Peak Oil 1 – discoveries from exploration peaked in the 1960′s and have declined each decade since. Does that not demonstrate that oil is not “effectively infinite” as some economists have postulated?
Reply
Author
Michael Lynch, 1 day ago
That graph is one of the problems: ‘discoveries’ actually means ‘currently estimated discoveries’. Thus, the amount of oil discovered shown is underestimated. Reserves have not declined because of upward revisions to field size.
Reply
Robert Wilson 2 hours ago
Nature planted the petroleum as noted in Hartmann’s book “The Last Hours of Ancient Sunlight”.——