This is a guest post by Ian Schindler (Schinzy).
The views expressed do not necessarily reflect the views of Ron Patterson or Dennis Coyne.
Introduction
This work is preliminary. It is a preview of part of a paper I am writing with Aude Illig. There are three main reasons I am making this post. The first is as a public service. There are many people reading this blog who are directly affected by oil prices and who have to make decisions based on future oil prices. Having a model to understand the dynamics of oil prices is of use to them. The second reason is that some people reading this blog model oil extraction. These models either omit price considerations or make assumptions on them. Our model is a large improvement on these assumptions so it should improve their extraction models. The final reason is that I consider the quality of the comments on this blog to be high. I believe that the feedback I get from this post will improve the quality of the final paper. Indeed, Dennis Coyne has already provided valuable feedback after previewing the post. This study has been a humbling experience. Get ready to throw out everything you thought you knew about oil prices.
The model does not by any means explain all oil price variation. What is remarkable is that with only one data set, it explains so much. Many factors may affect the price of oil. This model provides a base to which other variables can be added to find what explains oil prices.
I was asked to write a chapter titled “Strategies for an Economy Facing Energy Constraints” for a book last year which I wrote with my daughter. I do not think the book will be published but the chapter may be of interest to some. I have posted the pdf file on line and will refer to it often [2].
I prefer the terminology of Turchin and Nefedov to the term “peak oil”. Because oil is a finite resource, it will have a growth phase, a stagflation phase, and a decline or contraction phase. Turchin and Nefedov characterized these phases in agrarian civilizations [3]. The phases of oil extraction have similar characteristics. I believe that the growth phase of oil ended around 2005 and that the stagflation phase ended towards the end of 2014. The sign that the stagflation phase ended was the drop in oil prices.
The Cost Share Theorem from neoclassic equilibrium theory says that oil and food are not very important in economic production because their cost shares are small. Our price model is consistent with the opposite view: that oil extraction has been extremely important in economic production. In [2] computations show that the dynamics of the cost share is the indicator of importance in an economic production function. In particular, the cost share of important factors have negative derivatives, that is they shrink during periods of economic growth, and grow during periods of economic contraction.
An Empirical Model
George Box said that all models were wrong, but some models are useful. Our goal is to use historical oil extraction data to explain oil prices. If one can explain a large part of oil prices with this data, it can be used to understand what made oil prices move in the past. One can then make predictions with the assumptions that, at least short term, past conditions have not changed too much. If the predictions do not match future prices, this is also information. It means that some past condition is no longer verified. The model can help to determine exactly what condition is no longer verified.
We used price and extraction data for crude, condensate, and NGL from BP’s 2015 Statistical Review because the extraction data goes back to 1969 (actually 1965, we were also looking at cost share and our data set for GWP only went back to 1969). We wanted to include price shocks of the 1970’s.
By p(t) and q(t) we will denote the price of oil and the quantity of oil extracted (in barrels) in year . The data immediately give us a model for the price of oil. It is the average price for the period. Clearly this is not a good model because there are large variations from this average value. What could cause these variations? From Figure 1, one sees that quantities cannot explain price because p is not uniquely determined by q, in other words several prices correspond to the same quantity produced. So we attempt to use autocorrelation: we attempt to explain p(t) as a function of q(t), q(t-1), q(t-2), etc. It is well known that the more variables one uses, the less robust the model is. When we say robust, we mean that the reliability of the model for predicting future prices is impaired with too many variables. For example if we used all the variables q(t-k), k=1, … 44, we could explain all the variation from the mean, but the information would be useless for predictions because we would have been too greedy. There are other factors that effect price such as the weather, strikes, earthquakes, interest rates, financial bubbles, etc. that are not included in the extraction data. Better predictions are made from fewer variables and a fit which is not exact.
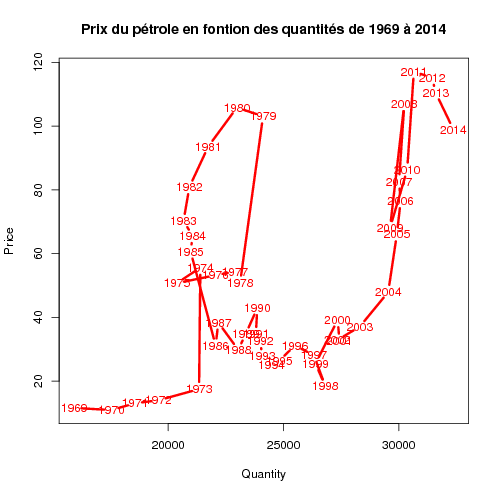
Figure 1: Price vs quantities
We define
Dq(t) = q(t) – q(t-1) (2.1)
DDq(t) = q(t)-2q(t-1)+q(t-2) (2.2)
Note that Dq(t) and DDq(t) are the discreet first and second derivatives of q(t) with time step h=1. The vectors q(t), Dq(t), and DDq(t) span the linear space generated by q(t), q(t-1), and q(t-2) so our methodology is equivalent to using the latter variables. We prefer the former variables because the results are easier to interpret with these variables. I will discuss the following model:
log(log(p(t)))=a + bq(t) -cDq(t)+dDDq(t) (2.3)
where a, b, c, and d are positive constants determined by linear regression (a priory it was not known that they were positive, this was determined by the regression). After reviewing this post Dennis Coyne generously shared his EIA data from 1960. We get a much better fit with the EIA data which only includes crude and condensate production and no NGL so we will use it for the paper.
Equation (2.3) is equivalent to
p(t)=exp(exp(a+bq(t)-cDq(t)+dDDq(t))) (2.4)
The reason that the best linear regression worked for the log(log(p(t))) is because the dependency of price on these variables is non-linear. Linear regression tests for affine functions. The log flattens large values. The log(log) really flattens large values and it was a great surprise that this model gave the best fit with the data we used. This corresponds to the inelasticity of oil prices. That is, small changes in supply provoke large changes in price.
The R output for the regression is as follows:
Call:
lm(formula = log(log(Price71)) ~ Quantity71 + DQuantity71 + DDQuantity)

Residuals:
     Min       1Q   Median       3Q      Max
-0.25737 -0.08838  0.01609  0.08395  0.26496

Coefficients:
              Estimate Std. Error t value Pr(>|t|)
(Intercept)  8.955e-01  1.299e-01   6.895 2.62e-08 ***
Quantity71   1.944e-05  5.098e-06   3.814 0.000464 ***
DQuantity71 -1.412e-04  3.667e-05  -3.852 0.000415 ***
DDQuantity   5.847e-05  2.821e-05   2.072 0.044717 *
---
Signif. codes:  0 ‘***’ 0.001 ‘**’ 0.01 ‘*’ 0.05 ‘.’ 0.1 ‘ ’ 1

Residual standard error: 0.1269 on 40 degrees of freedom
Multiple R-squared:  0.4115,    Adjusted R-squared:  0.3674
F-statistic: 9.324 on 3 and 40 DF,  p-value: 8.45e-05
Adjusted R-squared is 0.367 means that the model explains 36.7% of the variance from the mean taking into account the number of variables. In other words a large part of what is normally called demand is determined by the offer, and it’s first and second derivatives. Frequently demand is estimated by economic growth. Oil price is strongly correlated to GWP. Thus three years of oil extraction can give a good estimate of GWP. This is strong evidence that oil extraction has been a major determinant in economic production. This is much more reasonable than to imagine that GWP this year somehow determined oil extraction this year, last year, and the year before.
The intercept is the coefficient a, Quantity71 b, DQuantity71 -c, and DDQuantity71 d.
Interpretation
If extraction is constant for two years, then Dq(t)=DDq(t)=0. In that case the model reduces to
p(t)=exp(exp(.8955+1.944*10^(-5)q(t))) (3.5)
We call this the basic price formula that predicts the price if extraction is constant. Note that the basic price is an increasing function of quantity. This is another indication that oil extraction is a very important part of economic production because it indicates that the price divided by the cost share is increasing indicating super-linear scaling in GWP [2, Theorem A.1.1]. In Figure 2 we graph the basic price as a function of quantities. Because the exponential is such a fast growing function, one must be careful extending the model to extraction levels much larger than current levels.
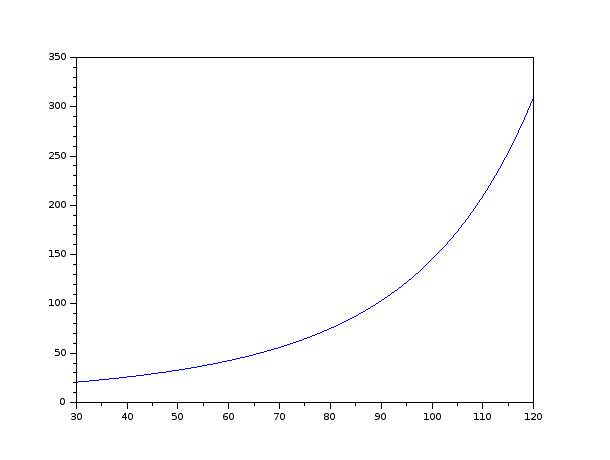
Figure 2: The Basic Price vs Quantities
Suppose Dq(t) is a constant so DDq(t) =0. Then and the model becomes
p(t)=exp(exp(.8955+1.944*10^(-5)q(t) – 14.12*10^(-04)Dq(t)))(3.6)
Note that the coefficient of Dq(t) is about 7 times larger than the coefficient of q(t) and of opposite sign. Thus gives a much larger price signal than q(t). The signal goes in the opposite direction of the change but it only lasts for a year. One might understand this as follows: a rise (fall) in extraction influences the economy much more next year than this year. Imagine that an increase in extraction levels occurred the first of the year. The economy is using a certain quantity of oil at the basic price and suddenly on the first of the year an extra million barrels a day is delivered. In order to unload this extra oil, the price must drop. It takes a while to figure out what to do with the extra oil, but by the end of the year it is sorted out and someone is using the oil to get some work done. This produces economic growth and thus if the same quantity is produced the next year people will be able and willing to pay a higher price to continue using the same amount of oil. Thus the price rises.
Example 1 If extraction is constant at 80 mbd the basic price is
p(t)=$75. If q(t)=80, q(t-1)=78, and q(t-2)=76 then Dq(t)=Dq(t-1)=2 and DDq(t)=0. Then p(t)=$49 because extraction is rising. If q(t)=80, q(t-1)=82, and q(t-2)=84 then Dq(t)=-2 and DDq(t)=0. Then
p(t)=$120 because extraction is falling.
Dependence on the second derivative is more subtle. The second derivative is negative at local maximums and positive at local minimums so that the second derivative will mollify the price change caused by the first derivative. This explains why peak extraction is frequently associated with low prices. A minimum in extraction will thus be associated with relatively high prices. Economically this factor can be interpreted as follows: it takes two years for the economic growth (contraction) produced by an increase (decrease) in extraction to take hold. The first year it is rather fragile and easily reduced (increased) by a drop (rise) in extraction.
Example 2
1. If q(t)=80, q(t-1)=78, and q(t-2)=80, then extraction reaches a local minimum at q(t-1). We compute p(t)=$70 rather than $49 as in Example 1 with the same increase in extraction from 78 mbd.
2. If q(t)=80, q(t-1)=82, and q(t-2)=80, then extraction reaches a local maximum at q(t-1). We compute p(t)=$81 rather than $120 as in Example 1 with the same decrease in extraction from 82 mbd.
3. It is interesting to note that if q(t)=Aρ^t with ρ=(1+r) and the growth rate r in a reasonable range (0<r<.12) then p(t) is an increasing function of q(t). For example if q(t)=80(1.02)^t, then p(3)=$58.3<$60.8=p(4), thus increasing production at a constant rate produces increasing prices. However this price is lower than the basic price at the same extraction quantity which is $87.6.
In Figure 3 we plot the fitted model with the actual data with the model’s prediction for 2015 (based on an increase of 2.2 mbd from the last data point of 92 mbd in 2014). Note that the model does not do well with extreme prices, either high as in the 1970’s, 80’s, and from 2005 to 2014 or low at the end of the 20th century. This is because the model is adjusting to average prices and so will in general be between the observed price and the mean. In Figure 4 we plot the fitted model and the vs the actual price with the EIA data provided by Dennis Coyne.

Figure 3:
Fitted model with BP data discussed

Figure 4:
Fitted model with EIA data from Dennis
For those interested in using the model produced from EIA data, a=0.779552, b=.009443, c=0.058792, and d=0.023649.
Scenarios
The growth phase of oil extraction was characterized by increasing prices well below the basic price of each level of extraction due to short term price signals resisting growth. The high prices during the stagflation phase of extraction can be explained by lower growth in extraction. Thus the short term signals are weaker and prices are closer to the basic price. With production of 92 mbd, the basic price in 2014 was $110/barrel.
We outline 3 possible scenarios for the contraction stage of oil extraction. We assume that peak extraction is 95 mbd which gives a basic price of $120.
- The first scenario is a steady decline in oil extraction. If extraction falls at a constant rate of 1% per year from 95 mbd, then q(t)=95*.99^t, from which we compute q(2)=93 and q(3)=92. We obtain p ^(2)=$145and p ^(3)=$140. Thus the price is high but decreasing. As extraction continues to decline, higher priced extraction will eventually be priced out and closed. This will lead to a faster decline in extraction, lower prices and thus a negative feedback cycle. This corroborates a phenomenon described in [3]: stagflation occurs because the civilization has reached the carrying capacity of the land. Peasants leave the countryside for the cities as they can no longer make a decent living in the countryside even as food production stagnates.
- The end of the stagflation period is characterized by civil war among the elite class [3]. If one equates the oil extraction industry with the elite class, the 2014-2015 price war can be seen as the beginning of a civil war among the elite class. Well financed expensive production (such as fracking) can keep production high to eliminate lower price competition (conventional) in the mistaken belief that lower extraction rates mean higher prices. Eliminating this competition initially creates higher prices due to higher decline rates, but faster decline in extraction quantities leads to faster declines in the basic price which will lead to a faster overall decline in oil extraction.
- A Seneca cliff [1] can be imagined if for example a sudden drop in non OPEC production coincides with war in the Persian Gulf. If extraction rates fall precipitously and remain low for two years, the ensuing drop in prices will decimate the extraction industry and a recovery will be highly unlikely.
Note that in all three scenarios, price considerations from the model speed the rate of decline in extraction.
Conclusion
The model presented supports the thesis that a large part of economic production is generated by increased extraction. The big surprise is that prices increase with extraction levels. The most powerful price signals come from short term effects lasting no more than 2 years. It is hoped that this model will aid modelers, policy makers, and investors understand the dynamics of the contraction phase of oil extraction. Modelers can now estimate the price of oil from their extraction numbers. From the price, investment in oil extraction can be estimated which will lead to more reliable estimates of future oil extraction. The model can also be used to assess climate change mitigation policies. If a policy results in prices significantly below predicted values, it can be considered successful. The model might also be useful in predicting financial bubbles. We believe that our methodology can be extended to extraction of other fossil fuels and sources of energy.
Bibliography
1
Ugo Bardi.
The Seneca effect: why decline is faster than growth.
Blog, 2011.
http://cassandralegacy.blogspot.fr/2011/08/seneca-effect-origins-of-collapse.html.
2
Ian Schindler and Julia Schindler.
Strategies for an economy facing energy constraints, 2015.
http://www.math.univ-toulouse.fr/~schindle/articles/2015-chapter.pdf.
3
Peter Turchin and Sergey Nefedov.
Secular Cycles.
Princeton University Press, 2009.
340 responses to “An Empirical Model For Oil Prices and Some Implications”
Interesting paper – I like the analogies with the agrarian analyses in the Secular Cycles book, and civil wars being replaced by price wars. With hydrocarbons (especially oil) replacing manual labour since the industrial revolution this appears entirely applicable, but I’m sure there are counterarguments – e.g. what would be the modern equivalent of ‘peasants moving to the cities’?.
The model doesn’t seem to do so well over the last 5 years, which is probably of most relevance. Do you think a one year time step is good enough in the high volatility environment that we appear to be experiencing – maybe quarterly data would give better fit given the relevance of first and second derivatives?
The model does not completely explain oil prices because there are factors which are exogenous to the model. My personal guess as to why the model does not do well over the last 5 years is that quantitative easing caused financial bubbles that inflated the price of oil from 2009-2013 and that currently those bubbles are deflating so that the model will overestimate the price of oil for a couple of years as all those bubbles get sorted out.
Would not such exogenous influences tend to increase in a contraction phase as the elites seek to return to growth BAU, or if that proves impossible to protect their hegemony at any cost? So the bubbles wouldn’t deflate steadily, but instead move to some other form of distortion.
“…what would be the modern equivalent of ‘peasants moving to the cities’?.”
An entire generation living online?
Could be – or the whole adult population reduced to debt slaves and addicted to anti-depressants and prescription pain killers?
“e.g. what would be the modern equivalent of ‘peasants moving to the cities’?.”
Solar power, wind power, and batteries (including electric cars). Growth industries, growing very very fast. They can’t train solar installers fast enough.
Peasants left agriculture and went to find industrial jobs.
People will leave the oil industry and the dependent-on-oil industries and move into the industries which are *not* dependent on oil. (Yes, oil will still be used for some plastics and lubricants, but do you realize how *little* oil is used for that? It’s marginal.)
I’m just a visiting layman to the site, but at first glance I would like to make a measured comment. I believe there are more variables than what the model includes, although it was very interesting. I did not see included the effect of propaganda by the industry or those with vested interests. Investment hypes. Refinery limitations. CAFE changes. Population and demographics, certainly slower effects but are there, nonetheless.
In my own limited opinion I believe that if personal transportation was finally returned to ‘transportation’, as opposed to identity and self-worth (“Just have to have that advertised Lincoln or the new BMW series”), if safety requirements were reduced for automobiles (complex designs, air bags, increased structural weight, climate controls, etc) the lowering weight factor of automobiles would produce a huge reduction of fuel useage, thus lowering prices and affecting extraction rates. It is a big jump to forecasting that rising extraction means rising prices. Isn’t price just a lagging indicator?
How necessary is Civil Aviation and air travel? Could there be a rennaisance in rail travel and a slower way of life? How about free mass transportation in walkable cities? Tolls and limits to parking in major cities?
What I found most interesting was your dates and titles, particularly Stagflation as opposed to the Undulating Plateau.
I was thinking this morning of my 1st year university psychology classes this morning and I have no idea why? It was brutal. But it was interesting to experience a class that tried to complex its study of human behaviour into a science, much like economics does. Energy, itself, is life. And how cannot it not be in one way or another? Then surely the understanding of extraction, prices, and trends will be just as mysterious and complicated as people and human behaviour? Even still, as we approach a Senaca Cliff we do not live in a planned and controlled economy to the extent of someone being able to actually do something to mitigate costs, energy use, or extraction rates. I believe it will be a collective WTF moment as society starts to really fall to pieces. And then there are those pesky shareholders. They need a story, maybe a lie, to keep their hand in. Unless, oil production is one day deemed to be vital enough for Nationalization, and we know how well that can work.
Thank you for this interesting post.
respectfully….
When we began this study my hunch was that a great deal of the price of oil was contained in the quantities extracted along with it’s first and second derivatives. In short, I believe that a lot of those factors you mention above are somehow contained in the extraction rate and it’s first and second derivatives. What linear regression does is compute, if there is a function of the type in Equation (2.3), what the “best” coefficients are. It also gives some idea of whether or not the variables explain the variation. It is now the job of economists to find a theory as to why the equation worked in the past to explain the price as well as it does.
You mean commerical aviation, not “civil aviation”. Commercial aviation is transport of paying passengers, domestic or international.
Yair . . .
Just flicking through this very long thread again and, being an uneducated old bush bloke I believe I may have a different take on our problems.
I have no understanding of many of the concepts mentioned on this site.
Folks go on and on about energy necessary to travel but when I fly in over a large city I look at all the buildings cheek to jowl and I work with and know pipes and pumps and I think that one of the largest problems in the future will be maintaining sewerage systems and pumping and treating shit.
The first large engines ever built were specifically designed to pump sewerage in a London with just a few million people and I believe certain modern cities in the Middle East have no sewerage systems and rely on thousands of tanker trucks to transport waste into the dessert every day . . . I seldom see this problem mentioned.
Cheers.
How does this model handle consumption efficiency growth (e.g., moving from 12 MPG to 50 MPG) and substitution, e.g., replacement of ICEs with EVs?
Nick G
Those factors you mention, such as efficiency growth and government mandates will make permanent changes in the demand for oil in a stepwise fashion. I have always assumed that oil production demand will be down to synthetic chemicals, plastics and lubricants by 2035.
I doubt if many people here believe that oil production will not fall over the next 20 years anyway, so replacement and efficiency will be even more in demand.
I came up with a possible answer to this question last night. I would call this model the BAU price model because it explains prices of the past. If civilization decides to preempt the fall in oil extraction by increasing investment in energy transition initiatives, this model could well overestimate the price.
the BAU price model because it explains prices of the past.
It doesn’t explain the past. Prices crashed in the 1980’s in large part because demand crashed. In particular, the US reduced consumption by almost 20% from 1978-1982 despite a (slightly) growing economy. It did so with substitution.
Prices crashed in 2015 – that would not have happened if consumption had been higher. Consumption would have been 10M bpd higher if the US government had not mandated increases in CAFE efficiency over the 1976-2015 period (despite much higher industrial production and overall GDP), and 2M bpd higher if consumption had not fallen in the US from very roughly 2006 to 2014 (despite higher GDP & industrial production).
Prices are a function of supply AND demand.
“Prices are a function of supply and demand.”
That’s not what the empirical evidence says.
That’s an extraordinary statement, and it needs a great deal of evidence. A statistical analysis which finds a fairly weak correlation between production levels and prices doesn’t begin to support that statement.
After all, if both supply and demand dictate prices, then it seems pretty obvious and intuitive that there would be a 50% R squared between production (aka supply) and prices. Demand can be expected to account for the other 50%. Life, of course, is never quite that simple or easy…
Have you absorbed the historical evidence I referred to above? Does it seem at all possible that oil prices could have crashed if consumption was 2-10M bpd higher???
With one data set (EIA C & C data from 1960) and 3 variables the model has an R^2 of .67, that is it explains 67% of the variation in price from its mean. The standard deviation is the square root of the variance, so it explains about 80% of demand (well not exactly it’s the log(log) of demand). I agree that there are other factors influencing demand. But I find truly remarkable that so much of demand is contained within these three variables. I do not think you can understand the dynamics oil prices without
understanding why so much of demand is somehow contained in these three variables. In any case these three variables is where I focus my attention to understand the dynamics of oil prices.
p(t)=exp(exp(.8955+1.944*10^(-5)q(t))) (3.5)
One thing I know for sure is that if I start having nightmares of high school algebra II and calculus again. It is because of this post.
Current demand is subject to decisions that were made 10, 20, 30 and even 40 years ago. If it were me, I would track the ratios between GDP, oil consumption and production cost using forecasting smoothing techniques. Then add back in a standard deviation for market randomness and information time lag.
Now I’m going to go out and get my cardio on a bike ride. Hoping I can get those equations out of my head. But than again, that’s just me. More than 2 standard deviations from the norm.
The purchasers of oil products, fuels in particular are captive consumers, they have few alternatives other than some system changes that will result lower use.
That is changing now and has been changing for a while. Efficiency and alternative energy are two of the big factors effecting demand and price.
Long ago it was steam trains, electric trains and trolleys, now the trolley systems are gone, but they are being replaced by electric vehicles and high efficiency vehicles, which free the consumer and makes it an open market once again. Electric trains still operate and may grow in use, another factor eating into oil demand and causing price fluctuations.
Both geology and technology are placing other dynamics in the cost of increasing oil production. The geology of shale oil forces the use of extensive and expensive technology. Enhancing production in existing oil fields increases the cost of production. Ocean drilling is getting deeper and more expensive. New oil production is generally more expensive. So as the world tries to produce more, costs to producers go up.
As consumers seek efficiency and alternatives, price must go down to compete. Eventually, competition will not be possible since the easy cheap oil discoveries are just about gone.
I said this below, but it fits here as well:
Two thoughts:
How many variables (including variations and transformations of those variables) did you test? 50 years isn’t really a very large or robust data set. If you tested dozens of variables, then there is a very high chance of simply finding spurious correlations.
2nd, have you tested a very simple model of demand’s impact on price: GDP growth vs price changes? Or an extended set of variations similar to the transformations you tried for production?
Also, you said: ” The standard deviation is the square root of the variance, so it explains about 80% of demand (well not exactly it’s the log(log) of demand). ” Are you sure it’s ok to describe it that way? I would have stuck with 67% of variance as “explaining” price variation.
In any case, this model makes sense to me. I have the feeling that it enhances my understanding of price phenomena. I haven’t seen anything better.
With respect to norms, the variance is the square of the L^2 norm which is our standard idea of distance. R squared is a ratio of variances, thus of the square of distances. It is not the same thing as the ratio of standard deviations, but taking the square root gives a an idea of how much distance is explained rather than how much distance squared is explained.
xxxxx
“Prices are a function of supply and demand.”
That’s not what the empirical evidence says.
xxxxx
The theory of supply , demand, and resulting price is CORRECTLY interpreted and applied as a SNAPSHOT of a moving world, a motion picture world.
Any COMPETENT instructor teaching economics , anybody who is not an idiot of one stripe or another, makes this ABSOLUTELY CLEAR within the first couple of days of study of supply and demand.
Such an instructor tells his students that in the real world, there are such things as price wars, cartels, monopolies, oligopolies, rationing, subsidies, punitive taxes, substitution, actual war, and other factors that muddy the waters.
Such factors include the inability of producers to make rapid changes in response to changes in price, in some industries. Oil is one such industry.
There are plenty of reasons, that have been discussed in some detail over the last year in this forum, why oil producers cannot, or in some cases, refuse to cut production in response to a decline in price, especially over the short to medium term.
Let’s not forget that the oil industry is one of the slowest moving behemoths, probably THE slowest moving of all industries, when it comes to lead times, contractual obligations, political entanglements etc.
Most oil is owned by and produced by governments, and we all know governments are rather slow and dim witted when it comes to rapid change, needed or not.
MY lived thru some very bad times in our own industry, twice, when prices were below costs for several years in a row.We hung in there, ate the losses, and eventually made them up. Many of our competitors gave up, some after two or three losing years in a row, some others only after a second losing streak.
The reason the survivors stayed in was that we estimated the cost of abandoning our orchard operations was too high, and that we would lose our asses, trying to sell in such a bear market. In a nutshell, we were going broke if we quit, but we had a shot at surviving by hanging on. So we hung on, and sure enough, the price of fruit went up again.
A lot of oil sellers are desperate enough for cash to sell at an overall loss, on a day to day basis, so long as producing and selling generates SOME cash.
None of these factors prove that there is any thing wrong with the theory of supply and demand determining price.
Sometimes producers can respond quickly. Folks who sell hot dogs on the sidewalk can double production in a day or two, if it’s worthwhile, by hiring a helper, or quit anytime they decide they are in a losing business. It would take me six to eight years, minimum, if I were still working, to double my production of fruit, other than by buying out a competitor.
If I were still working, and losing money, it would take at least three years for me to abandon any significant amount of production. I would sacrifice a few older or sickly trees is all. What I WOULD do is cut back on planned future expansion, or replacement trees.
Note that I was a family operator, and one or two horse family business operations are just about the most nimble of all businesses when it comes to expansion or contraction..
WHY, in view of actual prevailing conditions, should we EXPECT oil producers to cut back production sharply, except in cases where they are actually losing cash short term by producing?
It took me a while to understand my own rhetorical question, because I was under the impression that day to day operations comprised a much large portion of the costs of producing oil than is actually the case. Apparently only a rather minor fraction of world wide production is under water in terms of cash flow, even at thirty to forty bucks.
And even producers who are cash flow negative may be in such circumstances that shutting down would cost them more than continuing to produce.
ALL this sort of thing is taken into account in a technically literate discussion of the theory of supply and demand.
The take away bottom line is that a year, or even two years, is not necessarily enough time for oil producers to RESPOND to changes in price to a substantial degree.
Sometimes I wonder if I am the only regular in this forum who actually took a serious basic course in economics.
Sarc light blinking, I am not trying to insult anybody but rather point out that the theory of supply and demand is consistent with the current price of oil without having to bend it even the slightest bit.
“Sometimes I wonder if I am the only regular in this forum who actually took a serious basic course in economics.”
Really ? Be carefully you don’t fall off that pedestal. You might hurt your ego.
I put the sarc like blinking in the wrong place,a line or two down.
But anybody who actually did take a real university course in econ will understand just how many people, even in a forum such as this one, have a truly piss poor understanding of the law of supply and demand. I would guess that even in this forum considerably less than a quarter of us could pass a first year econ final exam.
I could not pass a first year calculus final, now,half a century later, nor could I pass a first year chemistry final, between having forgotten some of the chemistry and the some of the necessary math.
But I did at least take the courses.
Econ is simpler, and easier to remember, but hardly anybody except biz majors takes econ. I happen to be one of the rare exceptions.
For instance there are PLENTY of people in this forum who insist that traders control the price of oil. They never actually explain how though, except in terms of smoke and mirrors. The smoke is in their own eyes, and they are blinded by the mirrors.
Oil is cheap right now because there is more oil coming to market than the end users want at a higher price. So the price has fallen to the point that the market absorbs all the oil being produced, minus any very minor amount that is being put into storage by the producers themselves.
The price will go up again when one of two things happens, or more probably, a combination of the two.
Producers will EVENTUALLY cut back production, so that less oil comes to market, and or end users will be willing to buy at a higher price in order to get as much as they need and want.
It really is that simple. Even a dumb farmer semi educated at a so called cow college can understand that if producers are trying to sell more than end users want, the price crashes until either producers cut back , or until consumption increases.
It took me quite a while to understand just how long it would take the folks in the oil industry to cut back. The process is no more than just well started even now.
An ocean liner is as nimble as a hummingbird compared to the oil industry.
Understanding this stuff is as simple as falling off a log.
Baseball and other sports are easily UNDERSTOOD, but actually predicting who will win and lose is tough to impossible. There are too many constantly changing variables, and some random variables as well.
Likewise, Nobody should expect to successfully apply supply and demand theory to PREDICTING the price of oil , because both supply and demand are affected in random ways by many different variables, and successfully quantizing all of them is impossible. There are too many and they change too fast.
re: “It took me quite a while to understand just how long it would take the folks in the oil industry to cut back. The process is no more than just well started even now.”
Kicking and screaming until the cash to produce runs out, and the loan tap dries up. Until then, they have to have cash flow, any kind and any amount.
Oil companies make investment decisions based on a price forecast. The price forecasts I have seen come in very diverse shapes. But most of them aren’t constant, and very seldom use the current price.
I’ve made this comment several times to help you understand that behavior is dictated by expectations plus the perceived ability to get the money to spend. In other words, a lot of what goes on is based on perception of what’s going on, and what the future will be.
The law of supply and demand works perfectly. I just don’t know how to use it to understand the dynamics of oil prices.
What’s the goal? An understanding of historical price changes, or a reliable predictive model?
The first is pretty easy. The first place to start is with understanding history. For instance, the reasons behind supply and demand changes. If you don’t know the real, historical details of how those have behaved, you have nothing.
The second…..Well, if you can do it, you’ll be rich. Seriously. It depends on political decisions and events, technical changes, etc., etc. These are very, very hard to predict. For instance, the only people that I know of who predicted the LTO boom were old fashioned analysts that were derided in PO circles as cornucopians. They had faith that higher prices would draw forth more supply, and they were right. I admit I didn’t expect it: I thought supply would be stagnant, and prices would stay high.
Forecasting is very hard, especially about the future.
I only recently learned about the historical (1950s-1960s) Texas state government policy to set a floor on oil prices (propping up the price). Very important fiactor historically…
“For instance, the only people that I know of who predicted the LTO boom were old fashioned analysts that were derided in PO circles as cornucopians. They had faith that higher prices would draw forth more supply, and they were right.”
The thing is that there are TWO possible reactions to higher prices:
(1) More supply — expensive supply comes on line
(2) Reduced demand — people start using existing supply more efficiently, or switch to alternatives/substitutes.
I really expected the switch to substitutes to happen sooner. The switch to substitutes *did* happen for home heating, and for a bunch of industrial processes, and for electrical generation. Transportation fuels have been very stubborn — I expected the switch to be a lot faster. Cars & trains have been cheaper to operate on electricity than on gasoline/diesel when figuring just ongoing costs since the 1970s, and cheaper when figuring Total Cost of Ownership since the 1990s, but apparently the retooling of the economy is slower than I expected.
The essential thing is personal and institutional resistance to change.
Car companies don’t like EVs: it makes individuals’ company and sector-wide institutional knowledge obsolete. They dramatically reduce maintenance costs, which are the majority of dealer revenue.
Oil companies hate EVs, for obvious reasons.
A less obvious factor, but which is immensely important: the Koch brothers, whose “oil oligarch” father founded the John Birch society, have single-handedly, dramatically, distorted US politics in order to prevent change.
I guess I’m not a regular, but I have a very extensive economics background at this point. I only took three semesters in college, but the amount I’ve studied since then is massive.
Each market is different. It’s complicated because
demand in time period 1 affects price in time period 2+
price in time period 1 affects demand in time period 2+
supply in time period 1 affects price in time period 2+
price in time period 1 affects supply in time period 2+
demand in time period 1 directly affects supply in time period 2+
supply in time period 1 directly affects demand in time period 2+
Naive equilibrium analysis as in Econ 101 won’t teach you a thing; the markets are never in equilbrium and never even approach it.
Oil’s an interesting market.
— it has exchanges. In most markets, the seller is a price-setter and the buyer is a price-taker — buyers respond quickly to price, changing demand, while sellers respond slowly to changed demand, changing price slowly. In a smaller group of markets, the buyer is a price-setter and the seller is a price-taker — sellers respond quickly to price, changing supply, while buyers respond slowly to changed supply, changing price slowly. In an exchange, neither side sets the price. This means that price adjusts fast always, making for high fluctuations.
— it is extremely slow to increase supply. Oil exploration takes years.
— it is extremely slow to *decrease* supply. You don’t want to turn off the oil pumps and let the machinery freeze up.
— it is extremely slow to decrease *demand*. People have to replace their gas-guzzlers with alternatives, which takes years.
— it is relatively fast to increase demand.
Now, the basics:
Supply responds to price, but supply is only brought on line if the price is *expected* to exceed production cost of new production. Supply is only reduced if the price is *expected* to cause unending losses.
Demand responds to price, and again it responds mostly to *expected* price. Demand is mainly driven by the price and quality of *alternatives* (substitutes) relative to the price of oil; so a shift of the oil price past a critical alternative price causes (eventually and slowly) a complete shift in the economy, as people and firms retool. (This happened when firms retooled from other fuels to oil; it happened again when they retooled from oil to gas; it happened when people started driving gasoline cars instead of using horses, electric cars, or steam cars; it is happening as people replace them with electric cars.)
If you’re trying to use supply and demand to understand the oil price, naive equilbrium theory is no good — the key is to understand the actual reactions to each shock, and *how long they take to propagate*. How long it takes from the crash in the oil price before the frackers shut in all their wells. How long it takes from the high point in the oil price before companies manage to mass-produce electric cars which are price-competitive with gasoline cars (it’s mostly a matter of economies of scale — the electricity is already cheaper than the gasoline at $20/bbl oil and 14 cent/kwh electricity).
Great posts OFM and Nathanael!
Indeed the multiplicity of lags and delays in responses, together with the mind-numbing complexity of semi-independent market places, including direct sales from producer to refinery, sales from governments to other end-user states via private contracts of variable duration and price, production and sales from the big fuel companies to their service station chains where they set the price on the sign at the gate to reflect the public impression of the price of benchmark crudes regardless of their internal costs etc etc all the way down the rabbit hole…
The overall complexity of the markets (free and otherwise) and the timing and extent of their responses to publicised price data which may have nothing to do with their own cost of production or processing makes the idea of obtaining useful predictive outputs from a simple four variable model seem (at the risk of being unkind) somewhat naive.
Schinzy, your model is not that flash at ‘predicting’ the past is it, as there are unexplained divergences of a scale which makes the tool unhelpful as a predictor even of past actual scenarios.
And what is the ‘price’ anyway? How much oil actually gets traded at the price of Brent or WTI?
Your effort is commendable (as others have said you would be rich if you got it working reliably) but I have done enough modelling to know the dangers of getting the right answer for the wrong reasons or of re-aggregating a highly disagregated reality in an attempt to make some sense of it.
The real world of commodity trading generally and of key resources like energy in particular is subject to so many pushes and pulls, that us folk at the end of the pipe can only be grateful that there is still something dripping out at our end!
How much of the current price war is driven by the fear in several governments that if they stop throwing bread to the masses their own heads will be stuck on the railings tomorrow? How does your model reflect those sad realities?
Predicting the price tomorrow? Frankly I would follow OFMac’s educated guesses ahead of your:
lm(formula = log(log(Price71)) ~ Quantity71 + DQuantity71 + DDQuantity)
Do I have any positive contribution to make to your hard work? Sorry, No. Its all too hard for me to get a function around with any chance of sensible real meaning. I compliment you on the way your equations seem to give some insights into the way your variables interact. That is useful.
But good luck, anyway!
One of the problems with using historical models to make predictions is that when disruptive technology comes along this type of model may have errors that are hard to adjust for.
Many believe that Light Tight Oil (LTO, also known incorrectly as shale oil), is only a high priced flash in the pan, that will quickly die. Over the past few years both of these assumptions are proven to be quite wrong.
The EIA on Sept 24, 2015 came out with an updated report under “Analyisis & Projections” called “World Shale Oil Assessments”
This analysis places the U.S. LTO resource potential at 78.2 billion barrels. A detailed breakdown can be seen by clicking on “US” in the
table.
The U.S. analysis is a bottoms up analysis taking (1) the area of potential, (2) well spacing, (3) EUR per well to determine what they call the “Technically Recoverable Resource ” (TRR). When doing a Peak Oil Analysis, these is what the ultimate recoverable is.
It should be noted that EURs can change quite a bit so for example for the Bakken they sub divided it into 41 subregions.
The other piece of the disruptive technology is the cost of production. Over the last few years this has come down much more than many believe. The lower costs can be seen in two ways.
The first place is in the EIAs monthly “Productivity Report” which shows that rig production in barrels per day per month, for the last five years, in the Bakken has gone from 100 to 230, and in the Eagle Ford it has gone from 100 to 300. This equates to a major reduction in costs.
The second way lower costs can be seen is what ROR the oil and gas companies are expecting. For example EOG is estimating that their ATROR for five different plays is 30% at a WTI price of $40. Just a few years ago the threshold price of LTO was throught to be $80 to $100.
Since the EIA analysis is based on current production, changes in EURs and future areas of derisked production are not included. For example the Permian, and Three Forks have zones that have little production history and are not included. Also plays that are just opening up, like the Unita, which has 1.2 trillion barrels of OOIP, is just now seeing horizontal wells with good results being drilled in zones that has never see this type of drilling.
The beautiful part of this model is that it does not take extraction cost into account. Whatever the cost of extraction, based on what is extracted, this model gives you the price.
With respect to LTO extraction, in my opinion the big revolution is that because of high initial flow rates and short investment cycles, LTO extraction has introduced boom bust economics to oil extraction. In terms of the price model LTO extraction could bring on a faster decline in oil extraction by scaring investors away from longer cycle extraction projects such as deep water. Can LTO extraction replace all other types of extraction? If extraction levels decrease, the model says the base price will decrease as well. This will accelerate the contraction phase.
The beautiful part of this model is that it does not take into account
extraction costs at all. Whatever the technology or extraction
cost, as a function of the quantity extracted, this model will
give you the price.
With respect ot LTO, in my opinion, the big revolution is that
because of high initial flow rates and short investment cycles,
LTO extraction introduced boom bust economics to the oil
extraction industry. This could bring on a faster sharper
contraction phase by scaring investors away from longer cycle
investments such as deep water. The model says that if
extraction rates fall, so does the base price. I do not believe
LTO can replace all other forms of extraction. If these forms of
extraction produce less due to decreased investment, the
contraction phase will be precipitated.The beautiful part of this model is that it does not take into account
extraction costs at all. Whatever the technology or extraction
cost, as a function of the quantity extracted, this model will
give you the price.
With respect ot LTO, in my opinion, the big revolution is that
because of high initial flow rates and short investment cycles,
LTO extraction introduced boom bust economics to the oil
extraction industry. This could bring on a faster sharper
contraction phase by scaring investors away from longer cycle
investments such as deep water. The model says that if
extraction rates fall, so does the base price. I do not believe
LTO can replace all other forms of extraction. If these forms of
extraction produce less due to decreased investment, the
contraction phase will be precipitated.
I believe that what has happened in this cycle in the oil market is that an increase in U.S. production from LTO of one million barrels a day for four years caused the S/D balance to shift to over supply.
The difference in this cycle, making it longer and deeper than expected is the Saudi change in response.
From 1999 to 2013, each time there was a dip in price the Saudis cut their production by an average of 1.5 million barrels a day. This happened five times.
In 2013 as prices started down they started to cut production, but then something changed. As prices went lower instead of cutting production they increased it by over one million a day.
Was it to punish Iran or Russia. I don’t think so. I believe it was to slow down the runaway freight train of US LTO production. I believe that they understand the potential of this new resource to change the oil market.
The Saudis recongnized that LTO production growth was a product of cheap and plentiful financing. They set out to pop the bubble and they have. The bankruptcies are piling up. LTO economics are overstated. The wells will not produce anything close to what the companies claim. LTO could come back if the banks and debt investors are dumb enough to lend to the companies. My guess is that any debt financing will have much higher costs and tighter covenants. Borrowing for 10 years unsecured at 4-5% probably won’t be coming back.
I believe that $100 plus oil prices was the real fuel that fed the growth in LTO production. At that price a very good ROR was made and fund were provided.
Over the past couple of years very high gains were made in productivity, which can be seen in the EIA’s productivity report. The net effect is the breakeven price of LTO has been greatly reduced.
As in every other oil price cycle we have seen funds will come in when oil prices are high enough for a good ROR. I believe that threshold has now dropped to around $45 depending on which play.
The question that needs answering is what was the effect of cheap funding?
The LTO oil boom was the result of companies making a nice return at $100+ oil. At that price range production increased at a rate of one million barrels a day for three years.
If the cost of funding was say 3 to 5% higher what would have been the results?
Companies would still be making money, and they would also be borrowing, but the amount borrowed would have been lower.
At a lower amount of borrowing, production growth would not have been one million per year. One estimate that growth would have been around 750 kbd.
So after three years, U.S. Production would have been 750 kbd lower than it was.
At that growth rate world production would have stayed in balance, prices would have stayed in the $100 range, and the Saudis would not have ramped up production by 1 to 1.5 million a day.
So IMO the net effect of cheap money was to grow production more than the market could use and then crash prices.
In either case, with or without cheap money, the LTO boom would still have happened.
I believe that $100 plus oil prices was the real fuel that fed the growth in LTO production. At that price a very good ROR was made and fund were provided.
It was simply the situation in which Wall Street needed a place to dump money provided by Fed and shale came quite handy.
According to Art Berman, during the 5 year period (2008-2012), Chesapeake, Southwestern, EOG, and Devon spent over 50 billion dollars more than they took in. Such a great profitability.
Most of the companies you talked about are Nat gas production companies. We are talking about LTO.
But Art only talked about what was spent. If you look at LTO what was gotten was in increase in production of about 4 million barrels a day of production. That is a rate of 1,460, 000,000 barrels a year.
That generates sales at $100 oil of $146,000,000,000 per year.
Art Berman talked about what these companies have spent (capex) and what they got (operating cashflow).
During the whole period of the shale boom, shale companies’ capex significantly exceeded their operating cashflows.
That doesn’t mean that all that cash was “burned”. Operating cashflow is what they get from today’s sales. Capex is what is spent on tomorrow’s production. Given that until recently production volumes were rapidly increasing, that partly justified cash overspending.
Not only your calculation is wrong, but it looks like you do not even understand that the hangover for banking industry and seduced by WS propaganda, or way too greedy, or way too stupid investors in shale just started.
Among banks exposed to energy, French Crédit Agricole might have the most difficult “morning after” ( $29.8bn credit exposure to energy).
According to FT investors in energy worldwide lost more than $150bn in bonds, and more than $2tn in equities.
Such losses are not quickly forgotten and some heads already rolled. More to follow especially in pension and mutual funds with such an exposure. Those who survive will be more cautious. Much more…
http://www.ft.com/intl/cms/s/0/d48b1922-eadd-11e5-bb79-2303682345c8.html?siteedition=uk
That means that when oil prices rise, Ponzi financing will not be available like in “good old times”. Even obtaining speculative financing (“evergreen loans”) might be difficult.
Now please answer a simple question: “Where survivors of shale bust find money for “carpet drilling” if and when oil price cross, say, magic level $80 at which shale companies operations can be profitable ?”
They do not have their own funds to finance “carpet drilling”. Everything was done on borrowed money. So at best this might be a “dead cat bounce” followed by price decline that could well wipe the survivors of previous slump.
You need “very high” prices to induce the level of greed at which money will be freely flowing into shale again.
Or may be you think a new generation of oil/energy investors will discount possibilities of the second price crush and “go all in”, repeating the same mistake? that can happen but generally you need at least 5-7 years for forget lessons of the previous crash. After that Ponzi can be played again.
Moreover along with “peak oil” we might have “pick idiots investing in oil/energy” as well. Way too many people were burned. Now they understand that this is a game for big boys and if you can’t buy a tanker of oil, it is extremely stupid to invest your hard earned money in oil futures. In other words the next five-seven years shale industry will have hard times, no matter to what level oil prices recover.
I copied and pasted this comment in at least 15 times before it appeared. I guess that’s why it repeats. The funny part is that it does not include the last paste.
Oil and gas is the biggest industry in the world. There is not a close second. It has gone thru many up and down cycles. The current down cycle is nothing new.
The decline rate of the world’s oil production is estimated to be around 5 million barrels a day. The world needs new production of that much to replace natural production declines. Demand is also on average is increasing by around 1.5 million barrels a day.
The seeds of the next up cycle in oil prices has been planted and watered, as the cuts in cap ex budgets will cause a production short fall with respect to demand. This may happen much sooner than many expect.
As the price goes up the ROR will get better and better money as has always happened money will flow into oil and gas projects.
How does the model explain a 75% fall in the price of oil when the alleged overproduction was at most 3%?
It does not. The model does not use overproduction as a variable.
The best test of a model is to see how well it performs against reality. Figures 3 and 4 do not show a very good correspondence between the proposed model and reality, especially after about 1990. Furthermore, an R-squared around 0.4 is not particularly strong. The majority of variance is not explained by the model. This is a real issue and likely explains why there appears to be weak correspondence between the model and reality–enough of the variance is not being captured for an accurate forecast. You have to work harder and try to bring other variables outside of price and quantity into the model, e.g. a more sophisticated multivariate regression model.
You appear to be aware of this and have spent some time discussing models and over-fitting (i.e. the addition of variables can elevate the possibility of false positives). However, this does not mean that the addition of a few more variables will not help–they could. There are tests for over-fitting that provide some means for helping to assess potential problems with over-fitting. The Akaike Information Criterion (AIC) comes to mind.
The idea that price would be correlated with extraction rates, even over the short term, does not necessarily follow mainly because price could potentially be influenced by many factors including geopolitical ones. I suspect a better model would look at the physical basis of the problem, in other words focus on the extraction process and the operation of an economy thermodynamically. But even in this case the model would likely not be perfect because price may not always reflect the physical reality since price has a human-psychological component.
I see no evidence in this draft to support this statement: “Oil price is strongly correlated to GWP.”? At a minimum, this statement needs a reference.
Of course, this quote from Nicola Tesla is of relevance: “Today’s scientists have substituted mathematics for experiments, and they wander off through equation after equation, and eventually build a structure which has no relation to reality.” Always keep in mind what a model is–an approximation of reality at best. I do applaud your basic approach, but sometimes greater complexity may be needed. It certainly would be prudent to explore a more complex model and see how it works relative to simpler models and also reality.
-best
With the C and C data from the EIA from 1960, R squared is .67. But even with an R squared of .37 compared to other price forecasters I think the model does a great job.
What’s going on is that your model is eliding out (ignoring) a short term dynamic in order to capture the medium-term dynamic.
Short term, high production leads to low prices and low production leads to high prices.
But medium term, high production -> low prices -> higher demand -> higher prices, and low production -> high prices -> lower demand -> lower prices.
The key point here is that the initial-reaction short-term price changes are *not* sticky, but the demand changes are “sticky” and last for years. High demand is due to people buying gas guzzlers which they will keep for 10 years or more. Low demand is due to people ripping out their oil heating and putting in electric heating, which will last for 20 years or more.
This is why your model is working as well as it does.
Tesla’s comment does not apply to this model as it is based on
empirical evidence, and thus reality.
The fit from this model relies on three variables from one
data set. If you can do better, I am very interested.
Two thoughts:
How many variables (including variations and transformations of those variables) did you test? 50 years isn’t really a very large or robust data set. If you tested dozens of variables, then there is a very high chance of simply finding spurious correlations.
2nd, have you tested a very simple model of demand’s impact on price: GDP growth vs price changes? Or an extended set of variations similar to the transformations you tried for production?
I would attempt to build a better model when I am paid to do it, and not before. This kind of stuff should not be given out for free.
I find the R^2 of 0.67 more interesting. An R^2 of 0.37 is rather low, though I suppose if it is better than anything else out there then I can see some rationale for using the approach. The results (Figures 3 and 4) show that the model is having a hard time capturing real price trends, especially after 1990. It makes me wonder if the addition of one more variable–outside of the data you are using–might make a significant improvement. There seems to be some room for a big jump in your R^2 value.
I believe that Tesla’s comments does apply though I understand where you are coming from. All models run into the same problems wether-or-not they are empirically based. You can derive as many equations as you like via statistical methods, but in the end if they are not reflecting reality–the data that reflect what actually happened–then they need to be refined.
Finally, I need to make a correction to my statement: The AIC is useful to evaluate model strength between different models that use maximum likelihood approaches (e.g. Poisson or negative binomial regression). In your case you used a form of linear regression, so a coefficient-of-determination is your main criteria for model strength. Other methods are required to determine over-fitting, and in fact it can take a lot of work, thus the general rule to only include as many variables as you need. I am getting rusty.
Edit: After reading other comments, it seems like others are homing in on reasons for error in the forecast of oil prices, such as changes in the way oil is used in industrial societies. Also, I see that you adjusted price for the change in the value of the dollar over time–this may not be necessary since oil prices themselves are known drivers of inflation (e.g. 1973-74 and 1979-80 oil shocks–at least on price inflation). It might be interesting to see the results without adjusting for the devaluation of the dollar over time. Just a thought.
-best
Using nominal oil prices and a log model from 1902 to 2005 we get the following. The log log model doesn’t work on nominal oil prices less than $1.
To use the model with low prices, it can be altered slightly to do the regression. If there is just one log, you can use the regression:
log(p(t)-p_min+1) = etc
where p_min is the minimum price in the series.
With the log(log) model you have several choices. For example:
log(log(p(t)-p_min+e))
I was able to do a log-log model on nominal oil prices by adjusting the price curve up by $0.4 for all years (40 cents added to the price in every year from 1900 to 2014), then 40 cents is subtracted from the model price.
Regression on 1902 to 2005 has r squared of 0.67. Nominal prices from 1992 to 2015 shown in chart below. This is for those that don’t believe the inflation adjustments. Model price is $278/b in 2015.
Quite interesting. I don’t know how to explain this.
The model above is not correct.
I transformed nominal price incorrectly. When done properly as Schinzy suggested the ln(ln(Price)) should not be less than zero over the range of the regression. Model below is correct for regression on 1902 to 2010 with R squared of 0.93. The 2016 price at 79 Mb/d C+C output is $69/b. Chart below gives the low and high 99% confidence interval for the model (dotted lines.)
You make sense. I did not expect an R squared higher than .4 because I assumed our variables did not account for everything. Einstein said that even if you have a model that explains everything you can observe, you don’t know the model is correct because you can’t look inside nature to see if you are correct. I think the model should be judged by its usefulness.
I am with Nick in that there are many variables left out of the model, that is the nature of the modeling biz. Any model should be interpreted as including in the very name of it the term ” every thing else held the same or equal”.
One pitfall of this model , at least in the context of the short to medium term time frame, is to be found here. It would be good at this point to include the caveat that this statement applies only in the long term to prevent misunderstandings.
“Well financed expensive production (such as fracking) can keep production high to eliminate lower price competition (conventional) in the mistaken belief that lower extraction rates mean higher price ” emphasis.
I don’t think there is a single person who posts here on a fairly frequent basis, with the possible exception of watcher, who will argue that if some oil producing nation, or combination of nations, were to reduce extraction ( which MUST equal production since production IS extraction) say five million barrels a day , that the price of oil would not shoot up substantially and quickly. Even a production drop of just a million barrels a day would soon result in a significant rise in price, unless it is counteracted by a decline in demand due to economic weakness.
In terms of the “very biggest ” picture, it is reasonable to assume that higher production must require higher prices, because the marginal barrels that are produced are high cost barrels. The economies of scale that usually apply in manufacturing or agriculture or retail commerce do not apply in the oil industry, at least not right across the board.
Even in agriculture, the price of a crop must go up if the only way farmers can produce more if it is to bring marginal land into production. Our family farm land is marginal, in terms of climate and topography, compared to Washington state, meaning we need a higher price than Washington state apple growers. We can compete though, because our shipping costs to eastern markets are a lot less.
There seems to be an assumption made by many people that oil production and prices can decline together, and I will not argue that this cannot or will not come to pass.
As production declines, the use of and demand or desire for oil could and might decline even faster than production, due to a weak economy, or to increasing efficiency of the use of oil, or changing lifestyles, or the widespread adoption of electric cars, etc, or any combination of all these factors plus several more.
But while I can easily see this scenario coming to pass, I don’t think it is by any means a water tight scenario.
Production might decline as the result of political, geological, or economic factors FASTER than the overall economy can adapt to using less oil. In my opinion, this is probably a more likely scenario.
There is certainly plenty of oil that will be produced at forty bucks a barrel, for some years to come, enough to run the world economy, IF it declines to the point all the airlines go broke, most people have to give up driving and cars quit selling, people have to give up potato chips for potatoes they cook themselves, etc etc. I really doubt the economy will decline to that point anytime soon, lol.
The end users of oil could and would pay a hundred bucks or more each for let us say ninety percent of current total oil production. How long it might take that price to bring about a recession is an open question of course. It might not even result in a recession, if we were to adapt fast enough. ( Not likely but maybe not impossible. )
The question in my mind is this .
In the short to medium term, how far could oil production decline without the economy seizing up due to a lack of liquid fuel to power our transportation system? In my opinion, the answer is not a whole lot. Four or five percent would play hell with the price of gasoline, plane tickets, truck freight, etc, because the price of liquid fuel is HIGHLY inelastic, at least in the short to medium term.
Does anybody think we can adapt to a low liquid fuel economy or lifestyle in less than a decade or two, without experiencing extreme hardship ?
I am a big believer in the electric automobile, but I really doubt we could get the electric portion of the world automobile fleet up to even ten percent in less than a DECADE.
As Nick and Paulo point out, there are tons of possibilities to be taken into consideration in thinking about the need for and the use of oil in the coming years.
There are TONS of things most people can and will give up, as a matter of necessity if not choice, before they give up driving. I could get by without my cell phone, if it comes down to really needing another five gallons of gasoline a month at ten bucks, or ten gallons at five bucks. I know plenty of people who are supposedly “hard up” who think nothing of paying a buck and a half for ten ounces of sugar water when they stop for gasoline. When they are tired and worn out on payday they are apt to buy take out fast food for dinner. The gasoline retailer is going to win out over the fast food joint. When things get tough, a lot of convenience stores that sell gasoline will close, because their customers will leave off the soft drinks and chips , which bring in more profit than the gasoline itself.
If somebody will finance them, millions and millions of third world farmers who still depend on muscle power will gladly buy a small tractor. Ya only have to feed a tractor when it is actually in use, and that means tractors are infinitely cheaper to use than draft animals, under almost any circumstances, so long as you can get fuel and parts, even at exorbitant prices. This extra demand for oil even at two hundred bucks, meaning eight buck diesel fuel, would be entirely justifiable on rational economic grounds.
In the USA, except for the small portion of us who live where we can get by without a car, we MUST continue to drive, and to drive almost as much as we do today.Most Europeans who drive today are not in a position to give up driving, although a lot of them cut cut back a lot, due to being able to take mass transit at least part of the time.
Only a fool would contend we can cut back sharply on driving , in the short to medium term. Our homes are located too far from our jobs and the places we have to go on a regular basis, and there is nothing much that can be done about it, short term, other than carpooling, and not a hell of a lot in the medium term, meaning the next decade or more.
” ALL MODELS are wrong, but some are useful. ”
I think this one is useful, but my guess is that half the comments will be made by folks who overlook the assumptions, lol.
“Only a fool would contend – – -”
I live on a dead end road. At end of road, some mobile homes peopled by appalachians with 4 kids. Also pa and grandpa and a couple of others, presumably the ones growing weed.
I tend to spend time near the road and see the traffic. At around 4 pm 4 big school busses bring the 4 kids home separately from school to the same door! Each kid all alone. Ditto in morning.
Then, at lunch time, I see maybe 3 of the people go in in their loud junkers and then go back in, all close in time and each all alone.
In bad weather, lots of laments on this or that junker having one or another serious illness, causing compromises to be made, usually missing work.
So, as long-time energy engineer, I think – couldn’t we make some sort of better arrangement that would serve all these folk better and cost less fuel and weed?
GolDangIt! Can’t thinka nuthin’.
Hi Wimbi,
I think the reason you “Can’t thinka nuthin’” is because you have been smelling a little to much of that burning weed. Here is an idea for you to ponder. The kids each get an uber app for their cell phone paid for by the school transportation department. Then uber invests in solar energy and google self driving EV’s. Then the kids could smoke too and from school safely.
Hey XT, think it possible I might have intended a little sarcasm.
Sarcasm? Forbid it Almighty God! Surely no one here is so primitive.
Except maybe XT.
“I refuse to be a member of any club that would accept me as a member”
Sarcasm – “Then the kids could smoke(weed) too and from school safely.”
I know how to play your game. I even gave you a give away line. Surely you know how to play your own game.
Dang it, Wimbi,
Sarcasm aside,
I can’t think a nuthin’ either, at least not anything that will work in the SHORT or NEAR TERM, other than the steel toed boot of necessity connecting hard with the collective backside of society.
Most people are in the habit of living from day to day, paycheck to paycheck, without thinking about the long term, or even next month , and getting them to change their ways is a task that would give pause to a god.
Let’s just be honest and face up to it, most humans are strongly opposed to doing any more thinking that absolutely necessary to survive physically without being hungry or cold for the next few hours or days. That is damned little thinking, in the case of your neighbors and many of mine.
I have lots of neighbors and acquaintances that would be right at home at the end of your road. Some of them are close enough kin that it would embarrass me if I were the sort of guy to give a shit about my social status.
And if it is damned near impossible to get individuals to change their ways, how much harder would it be to get your local gridlocked government to change ITS ways, considering it is composed of people each one mostly interested in protecting his own turf?
For now, the obvious and dirt simple explanation as to why your neighbors and mine and just about all the rest of us yankees of all social classes will continue to drive boils down to this.
Driving allows us to live WHERE we live, the way we WANT to live, the way we can AFFORD to live, a damned sight cheaper than the alternative of moving and changing our ways.
I live in an old but pretty decent farmhouse on a couple of acres in a resort quality area ( I can walk to the boundary of a of national park) in terms of natural beauty, peace and quiet, etc, that I couldn’t rent out for more than six maybe seven hundred bucks. ( My farm is not contiguous to the family home .)
In northern Virginia, my house and grounds would rent for not less than six thousand a month. God only knows what it would go for in some other hot markets, but it would go for well over ten thousand a month in the Silicon Valley.
Getting something comparable any place I could take mass transit, at least any place I have ever lived or visited, including the Big Apple, would cost me three or four or more times more than it would cost me to own and drive a decent new car and live farther out .
Your neighbors can’t AFFORD to move. Most of us can’t afford to move.
Any and all talk about walkable neighborhoods, mass transit, biking, etc is just pure bullshit, in the context of the SHORT TERM, and not much better than bullshit in the middle term out to five or ten years.
Bike lanes, mass transit, etc cannot be expected to come into being in significant quantity any faster, and that is a super optimistic estimate. A few miles worth of mass transit takes YEARS to build. Bike lanes are wonderful, but they aren’t going to sprout like mushrooms in a warm spring rain, barring a miracle.
Your neighbors will give up their cars ONLY when the cost of them rises so high they simply CANNOT pay it any longer.
There will be many tens of millions of old cheap cars around for another couple of decades at the very least. Even ten dollar gasoline in one that gets thirty or more mpg will be cheap, compared to the alternative of doing without that car.
I have an eighty year old neighbor who lived seventy years like every DIME was precious to him. He drove the same pickup truck twenty years, wore his boots until they fell apart, still burns wood to save on electricity, etc.
He eats mostly beans and corn bread.
But for the last ten years, he has driven five miles one way to the local country store, EVERY morning, where he drinks second class coffee at a dollar a cup , to visit with three or four old buddies who are likewise there every morning. I can set my clock by watching him passing on his way to the store. He punched in at seven when he worked, he is there for his coffee and visit at seven. Habit.
He will give up a lot of something else before he gives up the pleasure of that time with his old buddies.
The steel toed boot of necessity may force us to give up cars, eventually, but not in the short term, and probably not in the medium term, meaning ten to twenty years.
The long term is hard, maybe impossible to predict.
I can see super small cars running on batteries and or lawn mower sized diesel engines being very common as long as industrial civilization lasts.
My hill billy neighbors and yours will scavenge solar panels, and have a couple of junkers for spare parts, and keep a car like a LEAF on the road for fifty years or longer. When it comes to keeping the wheels turning, such people prove that they are quite as intelligent and motivated as the rest of us, and possessed of SUBSTANTIAL mechanical skills.
All true, these people are far from stupid. In fact, their daughter contemporary with my son, kept up with him in high school and went on to be a highly regarded member of this community while he deserted our nice peaceful flyover flyspeck and ran off to the rat race called silicon valley.
And her brother, now the lead male of that clan, immediately saw the merits of my PV system, and very quickly had one of his own, slapped together by him alone out of whatever, and almost certainly now attached to the grid without benefit of clergy.
These folk are indeed clannish. So, here’s my plan. (First, check it out with the chief).
Go to their nice stable young granny with offer to get her a good used van, which she is asked to use on call for kids to/from school, shopping trips, ferrying people to jobs when they want and when clunkers sick, and me on rare occasions when I feel a need to go somewhere and wife is busy. Etc. Call it the RIDGE RUNNER.
It of course belongs to the chief, and he does with it what he does, no Q’s allowed.
In return, they give me lumber and carpentry and such stuff as we desire, as well as some chores we two find less and less desirable as the years zip by.
Call it a community. What a novel idea!
I laughed at both your posts. My 74 year old neighbour and good friend takes his ‘drive’ every morning in his ’96 f-100 on a loop around the valley. He hits the metal scrap dumpster, the stack of logging culverts for old 2X4s, checks out the water to see who is fishing, checks out the dryland sort to see what wood scrap is stockpiled, and buys a coffee and has a bullshit at the hwy store. I expect his drive costs $5.00 every day in gas and then the usual wear and tear expenses of owning a vehicle. He may scrounge up $2-$5.00 of scrap steel per week.
The school busses probably pick up at different schools. They try not to lump little kids in with the older kids, plus, it may actually be more cost effective to run the routes that way. Just sayin’. There is usually a reason why it is done that way.
Thanks for all that, Paulo.
What I’m getting at with all this is the simple fact that USA wastes a hell of a lot that even a small management effort could reduce greatly.
If granny picked up her kids in and out, a lot of heavy busses would not and the kids would probably be happier being less picked on.
And that van, even if not all that thrifty, would surely beat that creepy 1960 chrysler boat that old grandpa floats by in every day, as well as those other wheezy junkers.
Sure, it won’t work. Next move?
Read Wilson. Hopeful.
That’s exactly what the model says. But it says that if extraction remains constant at this level for over two years prices then fall. My interpretation is that the economy adapts to lower fuel usage, becomes less dependent on fuel, and the price then falls. There are many ways to adapt. In N. Korea the economy adapted to lower fuel usage during the 1990’s by losing 3-5% of the population to starvation.
What a marvelous adaptive strategy. Gotta hand it to humans. I feel a winner.
What a marvelous adaptive strategy. Gotta hand it to humans. I feel a winner.
No Caelan, you are missing the point! Humans had nothing to do with it! ‘The Economy is a subsidiary of Ecosystems Inc. Which in turn is Nature’s DBA. And Nature doesn’t give a shit! She is a truly heartless bitch…
Utterly, absolutely, and inconceivably heartless.
Mother Nature values the small pox virus and the guinea worm equally with humanity, which is to say not at all, not even at zero.
Sometimes I think that even most biologists don’t understand and APPRECIATE the REALITY of Darwinian evolution, the nature of the beast we refer to as Mother Nature.
The vast majority of biologists apparently do not , judging by the tone of what they write.
I just read E.O. Wilson’s book “Half Earth”.
He says that tribes that cooperated did better than the ones that didn’t, even tho individuals may not have.
Most any ball coach or non-com would agree.
Highly recommended book. Gives the marching orders to the young folks. Now’s the time for heroism, if ever there was.
Mother nature doesn’t even care about a mass extinction here or there. We are part of the product of at least five mass extinctions without which most species and genre currently living would not be here. The world was not destined to us.
Go tellit to Wilson.
My goodness, so unappreciative of what Mother Nature has given you. You have been given an extremely resilient and powerful set of properties. Every minute your body is defending you from the onslaught of environmental and biological attacks. Your body can heal itself from devastating wounds. You are the very best that Nature can produce, evidenced by the fact you survived.
When that cosmic crash destroyed the dinosaurs, your primitive ancestors had the ability to survive the most horrendous conditions. Amazing creatures, try to live up to that.
Yet you want to feel special, you slow, easily chilled, weak, big headed ape-man. You want to be better than a bird that can sit in ice cold water for hours, then get up and fly at 60 miles an hour? Do you want Mother Nature to pat you on the head and say your special and she values you more? How weak. You are the most adaptable and resilient creature on earth since you can make your own choices. That leaves open a whole plethora of bad choices. But it also opens up a world of good choices.
You probably think Mother Nature should coddle you and give you all the answers. Well, open your eyes and mind. The answers are there in front of you.
I just watch my dog, she sneezes and snuffs whenever a car goes by spewing exhaust or we walk through the smoke from a chimney. She doesn’t like it at all. Mark those as bad.
If we pollute the land, air and water, we poison ourselves and everything else. Mark that as a bad choice.
If we change the atmosphere and the ocean, the nice world we grew up in will change in an abnormal way. Bad.
If we learn how to integrate our ways into nature in helpful ways to make things grow better instead of mass killing. Good
If we stop polluting and try to clean up our mess. Good.
If the plastics we make degrade into estrogen analogs that harm our fertility. Bad
If the chemicals we use give us cancer and destroy other life on the planet. Bad
See, you already know everything you need to know. Mother Nature made you that way. Now do something about all that bad and start doing good. More respect and appreciation for your Mother would be a good start. Special? Valuable? Prove it.
So far it looks like humans are mostly destructive and feel sorry for themselves.
“then get up and fly at 60 miles an hour?”
Well, we kind of do. Great post and you didn’t even say the word God once.
Thank Ba Jesus
Understanding evolution by natural selection (and random chance and sexual selection and so on…) really opens your eyes and changes your view of the world. Understanding ecology opens your eyes some more.
Most biologists I’ve met genuinely do understand it. They also just plain love the sheer weirdness, craziness, and Rube Goldberg device character of the world, which is another result of evolution. Not everyone loves that weirdness — if you don’t love it you don’t go into biology.
Well wow you all have good points in various ways by your varied perspectives. Crunched together, I suppose they could be considered POB’s version of a Grand Unified Theory.
I’ve heard of and thought about the ‘Mother Nature being a harsh mistress’ thing, and decided that if she didn’t set things up just so to bring reality into being, we would not be around. The universe or big bang would have just fizzled out.
So, paradoxically perhaps, out of a kind of love of life and consciousness and its creations, she had no other choice but to make things at various scales explode and smash together once and awhile.
And as someone once said on TOD, “I’m made of of Oreo cookie centre stuff“.
2tatis
Currently I am only able to post short comments. I am saving longer comments to and editor in hopes that the problem is temporary.
Just wondering whether you considered adding demand into your equation or whether you already have tested it. I note that in 2013, demand exceeded supply and prices began to climb. However in 2014, supply exceeded demand and prices continued to rise. Maybe some time delay is required to allow the market to realize there is a shift from a shortage to over supply. Just wondering if this might improve the last five years.
I don’t want to put demand into the model. That’s actually the point. I want to estimate demand from extraction levels.
One would need to assume oil in storage remains constant.
Not a good assumption in my view.
The market price will be different from your model price when there is a storage build or draw.
Perhaps changes in storage levels should be in the model.
For a short term model I think this is an excellent suggestion. For a long term model I think things would average out.
Or you could look at first derivative of storage level or first and second derivative. If by long term you mean 5 years, I agree, shorter than 3 years you would need to account for this. Periods where your model underestimates price is probably due to over supply and a storage build and those periods where the model underestimates the oil price are likely due to an undersupply and a draw on oil storage. A problem is that we do not have as good data on this (the BP data includes biofuels in consumption but not in production so that would be a confounding factor). If BP data is used, the data in metric tonnes reflects energy content more closely than the volume data.
That is fine to leave demand out as long as there is someone out there, aka Saudi Arabia, looking at demand and modifying its supply to adjust. As a result your model does reasonably well as long as this was happening. In essence demand is built into the model implicitly.
However in 2011, things began to change. As the US began to increase production and demand increased by close to 1Mb/d, OPEC stood back and waited for the high initial decline rates associated LTO to manifest itself. However as US LTO production continued to increase, surprising OPEC and many of us, and OPEC could see no prospect for growth, they continued to stand by, waiting. Finally in Nov 2014, OPEC thru in the towel and said, lets wrestle. So starting around 2011, 2012, the implicit assumption that demand was partially implicit in supply no longer applied the model began to brake down.
So it should not be surprising that the model breaks after 2010 when the assumptions don’t reflect a step change in the real world that you and the rest of the us could not anticipate.
Maybe we are transitioning into a more normal supply demand situation in the oil market. When oil gets back to the $45 to $50/bbl range, I expect to see some US drillers come back on line and slow the increase in prices. This week’s Baker Hughes report gives the first clue that some driller came back into the market. The increasing supply as the price increases seems to be implied in the oil futures market where the contango from the May to June contract drops to 91¢ while the current front month May to April contango is almost double at $1.70. As we get closer to the end of the year, we may move into backwardation. The next few months for the futures market for WTI are listed below.
April. $39.44
May. $41.14
June. $42.05
July. $42.68
Hi Schinzy,
Are you assuming the quantity of demand is equal to consumer demand plus any increase in oil in storage? There are many cases where if we set oil in storage aside (and the change in the quantity of oil in storage) that the quantity produced is different from the quantity of oil actually used by consumers. In general Say’s Law does not hold.
Hi Dennis,
The model suggests that there is a delay. If oil extraction rises, the price falls and the extraction industry suffers because it must work harder (extracting more oil) for possibly less money. If the extraction level is maintained, the price rises the next year once people have figured out how to put that extra oil to good use.
Hi Schinzy,
The model only says what happens to the price as output rises, there are many possible explanations for the cause. Also the model doesn’t really reflect what happens to the price very well after 2005. The model predicts an oil price that is 25% too low from 2008 to 2014 (using log log model on regression from 1973 to 2014.) This is because the market was under supplied over that period.
Hi Schinzy,
The model referred to above is with nominal oil prices.
I should have said the model gives price based on output and rate of change in output as well as the rate that the rate changes (2nd derivative). We can only speculate as to the cause, there can be both a supply effect (which you focus on) and a demand effect. My point is that both are important in determining the oil price.
We can assume in the long run that an equilibrium will be reached, but that assumption is not proven.
There will never be an equilibrium.
I’ve studied a lot of markets. I’ve never seen one in equilibrium.
Of course not things always change. With no future changes the market might tend towards an equilibrium, in practice the world never stands still.
It is a theoretical construct to try to simplify the complexity of the world, not perfect, but useful.
In reality supply and demand curves shift all the time for a variety of reasons and I agree the market never is in equilibrium, though in some cases it is farther from being balanced than others. In those cases the market price will be farther from a “theoretical” equilibrium price that would balance demand and supply with no future shifts in the supply or demand curves.
Yeah, computing a theoretical equilbrium can be useful for figuring out the *direction of movement*.
But once you know enough calculus it makes more sense to figure the direction of movement directly… I think economists did all this “equilibrium” stuff early on (19th century) because they didn’t know enough math.
Does the model account for the rise and/or fall of the US dollar? I can no longer buy an ice cream cone for five cents.
We used prices adjusted for inflation. Thus former prices were revised upwards though I am a bit dubious about how this is done.
Nobody talk about this?
Crude Mystery: Where Did 800,000 Barrels of Oil Go?
Last year, there were 800,000 barrels of oil a day unaccounted for by the International Energy Agency, the energy monitor that puts together data on crude supply and demand. Where these barrels ended up, or if they even existed, is key to an oil market that remains under pressure from the glut in crude.
Some analysts say the barrels may be in China. Others believe the barrels were created by flawed accounting and they don’t actually exist. If they don’t exist, then the oversupply that has driven crude prices to decade lows could be much smaller than estimated and prices could rebound faster.
Whatever the answer, the discrepancy underscores how oil prices flip around based on data that investors are often unsure of.
…
“The most likely explanation for the majority of the missing barrels is simply that they do not exist,” said Paul Horsnell, an oil analyst at Standard Chartered.
http://www.wsj.com/articles/crude-mystery-where-did-800-000-barrels-of-oil-go-1458207004
I have one simple test for your model.
What’s the price of oil going to be a year from now ?
Hi XT5,
The model below has a price of $56/b in 2016 if C+C output is 79 Mb/d (average for the year). The price depends on C+C output. If you give me your output prediction I can give you the model price.
Output of 78 Mb/d would result in a price of $66/b and output of 80 Mb/d would result in a price of $49/b.
Ivanhoe (1996/1997) discusses variables that might affect the Hubbert model. Hubbert had noted in a Scientific American article that the actual world endowment of oil was uncertain. Estimates varied. If the endowment was 2.5 trillion bbl then the curve would be extended modestly compared to an endowment of 2 trillion. This article has been mischaracterized by M C Lynch and others. http://hubbert.mines.edu/news/Ivanhoe_97-1.pdf
My secret model predicted an average oil price of $65 per barrel for 2016, but I think it’s running a bit high.
Hi all,
I gathered carbon emissions data from 1900 to 1959 and converted to Mb/d for the emissions from liquid fuels. Then I ran Schinzy’s model from 1902 to 2005 using a linear regression to get the coefficients for the model. The model and data for prices as well as C+C output is shown in the chart below. R squared is 0.58 for this very long period (103 years). The model does not seem to do as well after 2005, I am not sure if the model will predict oil prices correctly over a long period of undersupply (as peak oil occurs).
Excel file at link below
https://drive.google.com/file/d/0B4nArV09d398cXg0RDcteXlWalk/view?usp=sharing
Very nice.
Hi Schinzy,
Thanks. Using nominal prices and the log or log log model on 1902 to 2010 data I get R squared of 93%. A problem is that the growth in output changed dramatically in 1973 from around 7% annual growth to about 1 to 2%. Probably a better future forecast would come from a regression on 1971 to 2014 data, though peak oil would also lead to a shift in the relationship. Chart below shows World C+C output on a log scale to show the change in growth rate over time, the curve from 2016 to 2050 uses a medium (3400 Gb) C+C scenario (includes 600 Gb of oil sands.) The shift in 1973 is pretty clear, there will be another change as a peak is reached in 2015- 2025 (2023 in this scenario.)
I agree. The next step is to study how the coefficients change over time and attempt to find reasons for the changes. Then put together a shorter term model for more precise price predictions in the near term.
Hi Schinzy,
A second issue is that the log-log model with real prices and C+C data from 1971 to 2014 results in a very wide 95% confidence interval, in 2014 the 95% confidence interval is $7.50/b to $9813.65/b with a best estimate of $73.71/b. That is a range that is too wide to be useful in my view. The log-log model with nominal prices does somewhat better with the 95% confidence interval in 2014 from $5/b to $1100/b, better but still not very good. Adding in real (or nominal) GWP should help a bit, maybe using first and second derivatives as well. Real GWP per capita data can be found at link below, then use UN population data to find real GWP from 1960 to 2014.
https://research.stlouisfed.org/fred2/series/NYGDPPCAPKDWLD
There is a huge problem with the model from 1990 to 2005. If you restrict to this time frame, R^2 = .02 and the coefficients are crazy. I currently have no explanation for this. As mentioned, this post is premature. There is a lot we don’t understand.
That’s a much better fit than I thought possible. Perhaps a revised model for the early 2000s forward would make up for the spike in demand from China?
If this could be modeled to quarterly or monthly data, it would be a very powerful tool.
Better than I thought as well. The fact that it works so well over the long term means that things average out in the long run. Creating a shorter term model is more challenging. There are lots of things that can push you away from the average.
Hi Schinzy,
You should also check for a structural change (using statistics) from 1902 to 1973 and 1973 to 2014. I am confident you will find a statistically significant difference in the model over these two time ranges. That is part of the explanation for the poor performance of the model from 2000 to 2014.
Totally off topic, but a great short read, and the reach of Trumpism!
http://www.coffscoastadvocate.com.au/news/donald-trump-scores-surprise-coast-council-votes/2970188/
From the article:
Clown (or chimp) seems too charitable a word…
But it kind of echoes in a sideways kind of way my comment under the previous article– my contempt for the system. Let the contempt be manifest in Trump. And let Trump drag the whole bloody thing down. Sooner than later. That won’t likely happen, but I guess we’ll see.
Once again for HRC:
(BTW, this is what I think of the system. Which one is Trump? Who cares.)
With apologies to the real chimpanzees in advance.
Love it! Who is the author of that graphic? I want to ask him or her if we can add features from every country in the world. Here’s mine from Brazil. I will also do one of the Trump Republican party circus and one for Hungary! ,,,,
Wow, not bad, Fred. Your perspective-matching is a little off ‘u^ but it’s a minor niggle, given the effort. What does the Spanish mean?
The author of the work may be Banksy. Another attached may also be.
It’s PORTUGUESE, not Spanish!!! And the perspective is off deliberately and adds to the visual chaos… The high rez version looks a lot better.
The Brazilian flag say “order and progress’ on it I’ve changed that to disorder and regress…
The signs are mostly references to Fifa, Rio Olympics, Odebrecht, Petrobras and the Car Wash, corruption scandals and kickbacks.
Along the sides are some of the left wing political party banners.
At the bottom it says: Same old shit, only the flies have changed!
Cheers!
Nice, and thanks for the elaboration.
Let’s not forget that our neighbors in Cuba are still living under an authoritarian government that tramples human rights with near total impunity.
http://www.nydailynews.com/news/national/cubans-died-sea-18-rescued-cruise-ship-article-1.2570770
I don’t know if Obama’s upcoming visit will help or hinder the cause of the Cuban people, but our past strategies have not resulted in a free election in that country after well over half a century.
Let’s hope opening up will bring about change faster.
Fernando has not posted recently. Hopefully he is ok, and just taking a break.
I have been posting, but with less frequency.
Regarding Cuba, we have slightly different perceptions.
First, the idea that nothing worked is wrong. It may have discouraged other would be tyrants from trying a coup. Economically, whether Castro had economic sanctions or not really didn’t matter, because the dictatorship was able to deal with the Soviet camp, the Europeans, Latinamericans, Canadians, etc.
Second, there’s a hard link between Castro and the Venezuelan autocracy, which is now destroying that country in a fashion similar to the way Castro destroyed Cuba. This means that Maduro and his henchmen are being encouraged by Obama’s spineless approach.
Third, there’s the issue of decency and self respect. Having diplomatic relations doesn’t require that Obama smile at Castro in posed photographs, or that suddenly all sorts of nations send representatives to do business with one of the most repressive regimes on the planet. A regime which advocates a hybrid of communism and fascist militarism, and which is actively undermining USA and EU policies.
Fourth, these struggles last decades and centuries. When people feel there’s no hope for a peaceful resolution to a conflict and human rights abuses (and there’s a conflict between the Castro family and its support cast of military oligarchs, and the majority of the Cuban people, as well as constant and serious human rights abuses for over half a century), they can resort to violence. Violence in this case can involve terrorism, the weapon of the understrength and the desperate which has become such a popular tactic in asymmetric warfare. Unfortunately, I’m already starting to hear rumbles to that effect in the twittersphere and other social networks. Thing is, the ones who rumble aren’t the problem. The ones who worry me are the quiet ones.
For sure more people, more planes, more ships visiting, more stuff being unloaded means more contraband can get in, including weapons.
More contact with outsiders means more opportunities to get together quietly to obtain weapons, and make plans.
The quiet ones worry me too.
I am just a simple country boy rolling stone farmer jack of all trades man, albeit one with a diploma heavy on the basic sciences. No military experience.
But I do read a lot, including military history, and odds and ends such as military training manuals.
I could, all by myself, no help, raise hell on a major scale, killing hundreds of people , without using a gun or any hard to obtain explosives or poisons.
There’s a good possibility I could even get away with it, except that making such a comment as this one has probably put me on a watch list. Fortunately no worry , I have dozens of witnesses that will swear I am never out of the immediate neighborhood for more than a couple of hours, due to family responsibilities, so I don’t expect a visit from the FBI.
It’s a damned good thing the bad guys are generally under achievers lacking in imagination and practical skills.
I wonder if there are some, keeping quiet, waiting for the signal to act. My seat of the pants opinion is that indeed there are some here already. There are probably at least a few more home grown ones as well.
Four or five guys could burn down a fair sized town all by themselves by executing a simple as falling off a log plan requiring nothing more than some easily improvised fire bombs that could be put together with Walmart stuff in a single day.
Any two special ops sergeants could brain storm this problem and come up with the solution in five minutes if they don’t know it from training already. Even a couple of privates barely smart enough to get into uniform could eventually figure it out. It’s been outlined in clandestine warfare training manuals, including some used by Russian special forces guys. I have read translations of portions of such manuals, and some printed in English by other countries.including my own. You can find the damnedest stuff in rat hole second hand bookstores, which used to be my favorite places to explore, pre internet days.
My posts are disappearing
Texas , home of the redneck republicans utterly opposed to any carbon regulation, is proving than integrating a lot of wind and solar power into the grid is a manageable job.
http://blogs.scientificamerican.com/plugged-in/texas-poised-to-integrate-more-wind-solar-energy/
Even after allowing for intermittency, twelve thousand megawatts is equivalent to about three full grown nukes, and the whole twelve thousand will be coming on line within twenty four months.
IT takes that long to get a HEARING scheduled about MAYBE permitting a new nuke.
This means them there devious underhanded greedy business men Texans will have a hell of a lot more gas and oil available for sale later on to the rest of us.
Great news. Three nucs worth of electricity is nothing to sneeze at. Although really its coal generation that is being replaced in Texas.
As I look around at buildings and satellite photos in this country, I am pretty discouraged to see such a small percentage of structures oriented properly for solar exposure.
Google is rolling out a solar mapping service- Project Sunroof that allows one to analyze the solar potential of a roof- https://www.google.com/get/sunroof/about/
The coverage they have achieved thus far is limited, but growing. here is an example of what results you can see-
https://www.google.com/get/sunroof#a=6%20Bennett%20Rd%2C%20Redwood%20City%2C%20CA%2094062%2C%20USA&b=100&f=lease&np=15&p=1
Pretty cool. I don’t know about models. So far, predictability has been unpredictable.
Hickory,
Channeling Rockman again, here (doesn’t anyone else keep up with his posts?):
Insofar as coal use is being reduced in Texas it’s the low price of natural gas that’s the reason; once that goes back up (of COURSE it will, of COURSE it will) to where coal is competitive, coal use will increase. Texas burns its own lignite, and coal from the Powder River Basin that is railed in.
Rockman has said several times that the extensive buildout of wind power in Texas, largest in the country, has added to the state’s energy production and not replaced use of fossil fuels.
He has a long post today on PO.com describing how that wind-power buildout was brought about. It’s a heartening story. The thread is on coal and oil powering development of wind and solar.
Coal’s dead.
Wind is simply cheaper than *everything*. If you can build wind there’s no reason to build anything else.
This is the substitution effect.
Since most people here don’t seem to understand it, a simple example.
Suppose you’re heating a house. You can heat it with oil in a boiler, with natural gas in a totally different sort of boiler, or with an electrically-powered heat pump. *Changing the heating system you use costs a lot of money*.
However, it’s far far more expensive to use oil than either of the alternatives. (Even at $20/bbl.) So at some point every homeowner will look at the costs and decide to get a loan to switch to a different heating system. Demand for oil drops permanently.
And if you’re building a new house, you don’t even *consider* oil heating.
Now, electric utilities (or industries, firms, and individuals in the states with “deregulated” markets) make a decision as to where to get any new electrical generation when they need it. Wind is just plain cheaper than *everything* else. So they will choose wind for new generation. And when the old coal generation needs some repairs… they’ll realize that it’s cheaper to put in some more wind than to keep that coal plant running.
For electrical generation, solar will be cheaper than everything except wind pretty soon, on the current price decline curve (which has been ongoing for 40 years); it’s already winning competitive bids in sunny areas.
The thing about the substitution effect is that a tiny price change causes the entire economy to switch, when it crosses the price of the substitute.
If solar costs $0.051/kwh and coal costs $0.05/kwh, we have lots of coal power and very little solar. If solar prices drop to $0.049/kwh, suddenly we have very little coal power and lots of solar.
“Changing the heating system costs a lot of money.”
Right, but adding insulation to cut down need for heat does NOT cost a lot of money, and is almost always the best first step.
I insulated first, then I went to a solar powered heat pump, on top of a big old cistern. Heat pumped out of nice mild cistern water all winter, and in summer, pumps room heat into nice cool cistern water.
Heat pump thinks it’s in Portland O, instead of right in the big wide 40 north belt band where ordinary folk live, where temps get fairly bad, plus and minus.
All very clean and quiet, and carbon-free, sorta.
Ok, so much for the house, now, how about that car?
You’re quite right — always superinsulate first. (If you do the insulation *right*, remember to install an ERV or HRV).
I was describing the substutition effect, however. Since insulation is an energy-efficiency action, it is subject to Jevons’ Paradox, which has different economic results.
I replaced the car first, and I’ve already superinsulated the house, but I’ve been scratching my head on replacing the heating system. Geothermal is overkill for my tiny house, and I’m not in a position to put in a cistern like you. Air-to-water heat pumps are readily available which work down to -4F, but I need to figure out what I need for a backup system for the really cold weeks.
I find the situation in Texas very intriguing. It will be interesting to watch events unfold over the next few years. UtilityDive.com has some recent articles on Texas:
ERCOT: Wind energy climbs, but February demand drops
Dive Insight:
Wind knocked out nuclear to take third place as one of the major sources of energy in ERCOT’s system this year. Nuclear power met 15.1% of demand last month, coming in fourth behind natural gas, wind and coal.
In February 2015, wind supplied only 11.8% of ERCOT’s demand, behind natural gas at 47.6%, coal at 26.5%, and nuclear energy at 13.7%.
Led by Texas, the U.S. wind industry is booming and is expected to continue record expansion into the early 2020s due to the recent 5 year extension and phase out of its $0.023/kWh production tax credit.
Texas added 3,615 MW of new capacity in 2015, more than twice of Oklahoma’s total of 1,402 MW, according to the American Wind Energy Association. Texas now has an installed capacity of more than 17,713 MW, more than twice of Iowa’s 6,212 MW. Texas also had 53% of all U.S. wind capacity under construction at the end of 2015.
ERCOT: Wind, solar nearly two-thirds new capacity in 2016
Dive Brief:
The Electric Reliability Council of Texas system is expected to add almost 12,500 MW of new generating capacity in 2016, raising total generating capacity from 101,553 MW to over 113,000 MW, SNL Energy reports
New wind capacity is expected to be 7,863 MW or 63% of ERCOT’s new generation, while the grid operator also expects to add 2,124 MW of new solar capacity in 2016, increasing nearly ten-fold compared to the state’s solar generation in 2015.
The amount of wind and solar capacity ERCOT expects to add will boost its renewable resources to 21% of its power mix.
I wonder how long it will be before the addition solar and wind capacity is the norm and the addition of FF capacity or capacity that is NOT wind or solar becomes newsworthy?
“I wonder how long it will be before the addition solar and wind capacity is the norm”
Already is. More solar and wind was added than FF last year IIRC…
” and the addition of FF capacity or capacity that is NOT wind or solar becomes newsworthy?”
The news media is weirdly slow to catch up on trends. So it’ll be completely normal for wind and solar to be added, and abnormal for FF capacity to be added, for *years* before the media starts considering the former “not newsworthy” and the latter “newsworthy”
[…] Source link […]
Ian,
Thanks for the post.
There has been a long history of oil price model failures. I was wondering whether you could comment on how your model has overcome the weaknesses of earlier models. I have the impression that the oil price in the short, medium but also long term depends on many highly non-linear factors. That just makes it difficult for me to see how any model, even just theoretical, could make reasonable predictions.
Suppose there was such a model, that had a little better predictive power than the market. Wouldn’t market participants then not rush in to make money using the model, which would again destroy its predictive power?
Hi Enno,
The idea to use autocorrelation came from just eyeballing Figure 1. Low prices seemed to be associated with constant rates of growth. If the rate of growth decreases or stops, the price pops. I gave a bunch of variables to Aude (who is a statistician) and asked her to look for correlations. She fiddled around with the data for some time trying different transformations. When she came back with what worked I slapped myself and wondered why I hadn’t told her to try that first.
As I said in the introduction, this work is preliminary and there is a lot we don’t know. What I believe is going on is that many variables normally associated with demand are hidden in past extraction data. Exactly which variables are included and which excluded is to be determined.
I think that if traders started using this model to estimate prices the model would work better. It would be a self fulfilling prophecy. The reason for this is that I think price speculation is not included in the variables used, so if the speculators were closer to the “right” price, there would be less variation.
If data were available it would be interesting to split the model by API density using the average price for each tranche of density. The model explained past data much better with EIA C & C data than it did with the BP data that included NGL (as Dennis thought it would).
If you have references to other price models, I am interested as well.
“I think that if traders started using this model to estimate prices the model would work better. ”
Heh, I doubt it. The model depends on the high extraction->low price->high demand move in the short term (to cause the higher price later)… and if all the traders were anticipating it, they’d break it by preventing the low price.
The Chinese may be due for a recession or a depression, but they are still doing some things on the grand scale.
http://www.inquisitr.com/2897792/china-is-building-worlds-largest-waste-to-energy-power-plant/
If they do a good job separating out toxic waste, they can use the resulting ash as a filler in concrete and for other industrial purposes, such as foundation for road beds, thereby saving on fuel, land fill costs, and building materials costs.
In the last analysis, the CO2 emissions of such a plant are not necessarily any worse than coal fired emissions, and can be less, depending on the quality of the coal, how far it must be transported, etc.
If this plant is built close enough to the city’s existing industries, they can also probably make good use of most of the otherwise wasted exhaust heat, at least during winter months when space heating is needed.
A few years back I was convinced energy shortages would mean the end of industrial civilization as we know it, but not any more, at least not any time soon. If Dennis is right, it seems likely that we can effectively manage fossil fuel supply problems for a good long while yet, for a decade or two at least , and maybe a longer.
I read pieces written these days by professional acrhitects to the effect that for an extra ten percent, you can build a net zero energy house, and for four or five percent, you can cut the energy consumption of a new house by half, compared to today’s typical building codes.
Increasing the efficiency with which we use oil by one or two percent a year is child’s play, from a technical or engineering pov.
Substitution of renewable energy in the transportation portion of the economy will come about on a large enough scale to make up any shortfalls not met by improving efficiency, assuming Dennis’s predictions are in the ball park.
Success in managing peak fossil fuels will depend largely on good leadership. That’s where luck comes into play.
My domestic sized waste gasifier is coming along fine and I hope to get a post out soon on the communitysolution. web site , where I also put my fantasies about energy.
http://www.communitysolution.org/
Looks to me like we could make up all the cloudy weather PV loss with nothing but house trash gas going to a honda.
Shower for Free
Some forecast just don’t pan out as expected.
The Unexpected Threat To Our Economic Growth System
Hi Ron,
The IMF does a forecast in real GDP measured in PPP dollars (purchasing power parity) which is shown in your chart above. Many economists prefer GDP measured at market exchange rates and the IMF also does a forecast at market exchange rates which tends to be lower by about 1%. Over the next few years the expected growth rate is about 3% per year.
I looked at past IMF GWP growth forecasts at market exchange rates (for the past 5 years) and found that the forecasts on average were about 1% too high at market exchange rates for 3 to 5 years ahead so a better forecast for growth from 2018 to 2020 is about 2% per year and about 2.5% per year for 2016 and 2017 (the forecasts have been about 0.5% too high for one and two years ahead).
So the assessment is correct forecasts are often too optimistic, though some forecasts are too pessimistic. Almost all forecasts are incorrect.
Almost all forecasts are incorrect.
Hell, who would argue with that? 😉
Light tight oil is not your average crude oil. I suspect it is clogging up US inventories after the import substitution phase ended and after some modifications to US refineries were completed. This glut created the perception in markets that there is a global glut (and contributed to bring down oil prices) while it is not
29/12/2015
Where actually is that much-hyped global oil glut?
http://crudeoilpeak.info/where-actually-is-that-much-hyped-global-oil-glut
That shale oil surplus is the reason why the crude oil export ban was lifted but not much is exported. See slide 4 in Art Berman’s latest presentation
http://www.artberman.com/wp-content/uploads/HGS-Presentation-14-MAR-2016.pdf
In fact crude imports went up again in the last months. Anyway, shale production has peaked now according to the latest drilling productivity report. The following 2014 report describes the mismatch between shale oil production and US refinery capabilities (slides 7-9)
http://www.aspeninstitute.org/sites/default/files/content/docs/ee/3_Kah.pdf
Outstanding work. If world output of oil fell to ten million barrels per day in maybe 45 years, what price can the model predict? Or, would the price be zero and all oil confiscated and devoted for industrial and agricultural uses?
The work is exhaustive, exhausting, and the entry must be read seven times at least. I am too old to bone up on my calculus, even though I still have my calculus textbook for 43 years now. My blockhead will burn wood for days, I will defer to the more studied minds.
It is believed that during the Great Plague the countryside in Europe became flooded with people fleeing the abhorrent conditions that developed in cities across Europe.
Forced to move to avoid death. It was better to be a farmer who could breathe rather than an urban dweller whose chances were 2 in 3 to survive. You knew your source of sustenance. Reduced the danger.
People who died of the Plague were buried with everything on them, clothes, money, shoes, nothing was taken from them. No one dared touch anything. Mass graves have been discovered which point to such evidence.
It was bedlam.
http://www.ancient-origins.net/news-history-archaeology/mass-grave-possible-bubonic-plague-victims-excavated-london-003628
“A mass grave of 30 possible bubonic plague victims is being excavated in London at the huge cemetery of Bedlam mental asylum that was discovered while workers were building the Crossrail subway system.”
“Established in 1247, the notorious Bethlem (“Bedlam”) Royal Hospital was the first dedicated psychiatric institution in Europe and possibly the most famous specialist facility for care and control of the mentally ill, so much so that the word bedlam has long been synonymous with madness and chaos.”
Also:
“A mass burial site suspected of containing 30 victims of The Great Plague of 1665 has been unearthed at Crossrail’s Liverpool Street site in the City of London.”
http://www.crossrail.co.uk/news/articles/suspected-1665-great-plague-pit-unearthed-at-crossrail-liverpool-street-site
http://www.themiddleages.net/plague.html
“Realizing what a deadly disaster had come to them, the people quickly drove the Italians from their city. But the disease remained, and soon death was everywhere. Fathers abandoned their sick sons. Lawyers refused to come and make out wills for the dying. Friars and nuns were left to care for the sick, and monasteries and convents were soon deserted, as they were stricken, too. Bodies were left in empty houses, and there was no one to give them a Christian burial.”
http://www.themiddleages.net/plague.html
It was time to get out of Dodge. One of those variables which will take you by surprise.
http://press.princeton.edu/titles/8904.html
Secular Cycles elaborates and expands upon the demographic-structural theory first advanced by Jack Goldstone, which provides an explanation of long-term oscillations. This book tests that theory’s specific and quantitative predictions by tracing the dynamics of population numbers, prices and real wages, elite numbers and incomes, state finances, and sociopolitical instability. Turchin and Nefedov study societies in England, France, and Russia during the medieval and early modern periods, and look back at the Roman Republic and Empire. Incorporating theoretical and quantitative history, the authors examine a specific model of historical change and, more generally, investigate the utility of the dynamical systems approach in historical applications.
http://press.princeton.edu/titles/8904.html
The end of oil will close the cycle and the results may be similar to the Great Plague. A new Black Death, not enough oil, will take its toll.
“Gloom, despair and agony on me. Deep, dark depression excessive misery.” – Buck Owens with help from Roy Clark
Depends on how output declined. Assuming a constant decline rate the model says around $13/barrel.
At $13/bbl all fields except some of the oldest and some of the Middle Eastern ones shut down, because they can’t produce profitably. I doubt those remaining fields can actually generate 10 million barrels per day, so the output would fall faster.
R Walter
I have a large flock of vultures here that will do extremely well during periods of chaos and misery. It’s not all a downside. The coyotes will like it too. Of course this will cause a surge in their populations and then the inevitable downfall. Seems like a natural thing to happen. The roller coaster ride of life.
A large flock of vultures must mean you live near a state capital or even the nation’s capital. ?
Nope, mine are specialized, just eat the dead. Not like the ones you refer to who get you before, during and after life.
This one is for Darwinian;
“Traditional Economics Failed. Here’s a New Blueprint.
Why true self-interest is mutual interest”
http://evonomics.com/traditional-economics-failed-heres-a-new-blueprint/
“We’ve convinced ourselves that a million individual acts of selfishness magically add up to a common good. And we’ve paid a great price for such arrogance.”
“In a sense, the latest wave of scientific understanding merely confirms what we, in our bones, know to be true: that no one is an island; and that someone who thinks he can take for himself, everyone else be damned, causes a society to become to sick to sustain anyone.”
Schinzy,
Great model. I am surprised that with oil rate of production you are able to capture a significant part not only of oil price, which is kind of obvious, but of oil price action (trends).
I tend to agree with the model because it agrees with something that a few of us, peakoilers, have come to understand during the last year and a half since the oil price crisis started, and that is that a reduction in oil production will feed through as an economic slump reducing consumer affordability and thus depressing oil prices. Now we have a mathematical model that proves we are right. Less oil does mean higher prices only in the short term, it soon turns into lower prices.
Your model is indeed too simple to be of any value at predicting oil prices, but the fact that it works at all, means that it is getting one thing right, and that is what happens to oil prices when the economy demands increased or decreased oil production. If the economy demands less oil that currently produced, prices are bound to go down despite lower production.
In the end you are incorrect when you say that the empirical evidence says that prices are not a function of supply and demand. They certainly are, and what you are doing is removing yourself one step by analyzing the effect of oil production, which in itself is a function of the supply/demand ratio. Oil production increases when there is more demand than supply, as nobody extracts oil that doesn’t have a buyer.
Taking that step back means your model is running late. The peaks in your model take place about 2-3 years later than they have really taken place. Shifting your model those years back very much improves the fitting in figure 4.
It also means that your model has a lower correlation with prices that a model based on supply/demand ratio would have. As proof of this I present a graph published by Ed Yardeni that I have posted already in this blog as an answer to people that still think that oil price is determined politically or from speculation.
The demand/supply ratio captures oil prices much better and coincident in time than your simpler model.
Thanks Javier,
You make good points and suggestions. Precisely why I posted this here.
Hi Javier,
The model has a problem with a very large 95% confidence interval, using the regression over 1971 to 2014 (when oil output was growing more slowly than 1900 to 1970) the model’s 95% confidence interval for the real oil price is $7/b to $9800/b in 2014. Whether affordability will be a problem is an unproven hypothesis, it was not a problem from Jan 2011 to June 2014 when oil prices were over $100/b in 2014$.
Hi Dennis,
Personally I am surprised that the model works so well with just one parameter, production. Schinzy deserves kudos for showing it. I wouldn’t have expected it. I would have said that a model would require both demand and supply to give a curve that would resemble price. To me it demonstrates that production has been capturing a lot of the relationship between demand and supply before 2005, so despite inelasticities supply has been very successful in meeting demand and the delay in doing so has been very important in determining the price.
After 2005 the model sort of breaks because supply was not able to meet demand for a few years, and after 2013 supply was in excess because LTO was responding to a financing bubble not to demand.
Of course anything referring to the future is a hypothesis. However that 100$/b oil was not a problem between 2011 and 2014 also does not say that it wouldn’t be a problem now. The main customer increasing consumption at that time was China, and could afford high prices due to very fast debt expansion. Once debt expansion reduces oil becomes a lot less affordable. Let’s remember that quantitative easing does not reach the final customer, so despite it, the economy won’t be able to withstand high prices now.
I am quite convinced that without low oil prices the world would be in a new recession right now. The economy is tremendously weak and growing more slowly despite low oil prices. You can see Ron’s graph above to see how growth has been doing during those high oil price years.
Hi Javier,
No your assessment of the World economy may not be correct. The chart below gives real GWP growth rates at market exchange rates from 1980 to 2015, the dashed black line is the average growth rate over the period. The growth rate was slightly lower from 2011 to 2014 (2.6% vs 2.8%), this could be due to high oil prices or due to a slow recovery from the GFC. The debt growth is only a problem if it grows faster than GDP. The growth of Chinese debt was due to rapid development and very low debt levels at the start of their rapid growth phase starting around 2000. Chinese debt levels are not a problem.
“the model’s 95% confidence interval for the real oil price is $7/b to $9800/b in 2014.”
I’m still sticking with the Deutsche Bank analysis which predicted humungous swings in the price of oil, increasing in size of swing, *while oil production and demand both declined*. So this confidence interval sounds good to me. I wouldn’t be surprised to see both prices in one year!
“Taking that step back means your model is running late. The peaks in your model take place about 2-3 years later than they have really taken place. Shifting your model those years back very much improves the fitting in figure 4.”
Yes, this is very important for model design.
How Big Oil Conquered the World
Published on Dec 27, 2015
TRANSCRIPT AND SOURCES: https://www.corbettreport.com
From farm to pharmaceutical, diesel truck to dinner plate, pipeline to plastic product, it is impossible to think of an area of our modern-day lives that is not affected by the oil industry. The story of oil is the story of the modern world. And this is the story of those who helped shape that world, and how the oil-igarchy they created is on the verge of monopolizing life itself.
https://www.youtube.com/watch?v=ySnk-f2ThpE&feature=youtu.be
OFM: As someone with a formal education in economics, I’m surprised that you (as most everyone) do not make the distinction between “demand” and “quantity demanded” (and likewise “supply” vs “quantity supplied”). Supply and demand are functions, quantity demanded and supplied are amounts. I’m so used to hearing the two confused that I just don’t pay attention anymore. The fact is that nobody knows what the demand or supply functions are or how they shift over time. All we know is the quantity supplied and demanded at any point in time, which is always the same amount by definition. The rest is purely speculation, and that is why microeconomics is of pretty much no use outside the classroom.
“All we know is the quantity supplied and demanded at any point in time, which is always the same amount by definition”
We may argue about the accuracy of the terminology, but in the real world, all we know about global oil balance is the data provided by the IEA, EIA, OPEC and similar institutions on:
1) “supply” or “production”. Both terms are used, but the meaning is the same. (If you want, you may call it “quantity supplied”);
2) “demand” or “consumption”. Again, both terms are used, but the meaning is the same. (You may call it “quantity demanded”).
By definition, “supply” or “production” is very rarely the same amount as “demand” or “consumption”.
The difference between demand (consumption) and supply (production) is reported as change in stocks (inventories) and miscelaneous balancing items.
What is called “demand” is actually consumption, as it excludes demand for oil, which goes into storage and is reported as “increase in stocks”.
The term “supply” is used because, along with “production”, it includes “refinery processing gains”
But global oil (or C+C+NGLs, or liquids) supply excludes supply from inventories, which is reported as “decrease in stocks”.
In the world of finance, supply is what is available for sale and demand is what is actually purchased. The amount of oil for sale is the economic supply, not all of the oil in the world, a dwindling supply in place, for sure.
I’ll ramble on.
If I hoard 100,000 bushels of wheat, a supply not for sale, it has zero economic impact. As soon as I go to a grain buyer/broker and offer the 100,000 bushels for sale, it then becomes an economic supply, not before. There is no demand, in the financial sense, if the wheat is not for sale, the supply is there, just not available as supply until it is sold due to demand. If the supply for sale dwindles to 10,000 bushels and the demand is 110,000 bushels, the grain buyer will call and offer a price. Since the demand is 110,000 bushels, the grain buyer needs to find a supplier. Right then and there the 100,000 bushels becomes an amount of supply for sale for purchase. You hold until the price rises and it will if the supply for sale is shorter than the demand, the amount wanted for purchase.
People have to eat, there will be demand. I don’t have 100,000 bushels of wheat to sell, I am on the demand side of the equation.
I can retain 10,000 bushels for seed and plant ten thousand more acres of wheat. At 50 bushels per acre, you will harvest 500,000 bushels, sell 400,000 at 5 dollars and have income of 2 million dollars to meet expenses. The 100,000 bushel carryover into the spring, when you get back from your four month winter vacation in Ecuador, can then be sold. The grain buyer will give you another call and your new 100,000 bushels will enter the supply chain once again. Of course, if you want to plant ten thousand acres of wheat, you will need oil and equipment, no way can it be done with horses and twenty mule teams. Machines for agriculture will be in demand, you will need a supply of tractors and implements.
It gets even more complicated, gosh darn it anyhow.
There is a huge supply of rocks in the Rocky Mountains, not many are for sale until there is a demand for Rocky Mountain rocks. The Rocky Mountain rocks for sale would be the rocks of economic interest, not the total supply of rocks in the Rocky Mountains. The demand for Rocky Mountain rocks is going to be less than the total supply, ergo, the amount of rocks for sale is the amount of supply for sale for purchase, the demand, the buyers are not going to buy any more rocks than they need. You go to where they are for sale, not where the source of the supply is.
The rocks in my head can be for sale, plenty of supply, but no demand. Nobody would buy them. Therefore, the rocks in my head are of no economic interest to anyone, even if the supply is limitless. I will contnue to hoard them, even if it does no good. har
I for one find the rocks in RW’s head to be a substantial resource when it comes to generating smiles and chuckles, and occasionally a sharp insight into the doings of naked apes.
Maybe we ought to take up a collection and buy him a few beers or something, lol.
Hi AlexS,
Economists consider oil that is produced as quantity supplied and oil consumed plus any increase in storage levels as quantity demanded so the two will always balance by definition. The way you describe it is much more practical and realistic. Economists still suffer from Say’s assumption that supply creates its own demand as long as prices are set by the market.
This is why unemployment was a conundrum for classical economists, they just thought those unemployed workers wanted some unpaid vacation. 🙂
In the real world wages and prices don’t magically adjust to an equilibrium level, it takes some time for the market to reach equilibrium. I know you know this, sometimes some economists forget how the real world differs from a perfectly competitive Walrasian world where the auctioneer instantaneously determines equilibrium prices. Just like the spoon in the Matrix, there is no auctioneer.
Dennis,
Sure, I know this. But here we are mostly discussing real things.
I think different terms used by different agencies may be confusing for some people:
IEA: supply and demand
EIA: supply and consumption
OPEC: supply and demand
BP: production and consumption
“Economists still suffer from Say’s assumption that supply creates its own demand as long as prices are set by the market. ” Some do, yes, though Keynes destroyed that assumption long ago.
In fact, there’s a more basic point which most economists miss. They think demand is mostly determined by price — and they’re wrong.
Demand is created by *advertising*, mostly. Which is one of the most fertile fields of economics which *has not been heavily studied*. I think any good model of economics needs to include advertising in the *first semester* and they don’t.
By the way, everyone in every business knows this. This is why the doomed coal businesses keep trying to convince everyone that coal is as American as apple pie and that coal is indispensible and so on… this is why the doomed oil business keeps trying to convince everyone that there is no substitute for oil (even though there are lots)… and of course this is why the shift to electric cars didn’t really start in the 1990s when it became *financially* viable, but rather in the 2010s when Elon Musk promoted the hell out of electric cars and made them “cool”.
Hi Nathaneal,
For the mathematical model underpinning neoclassical economics, consumer preferences are a given outside of the model. A new model is needed to account for advertising, it doesn’t exist as far as I know in the main Walrasian model.
Clearly in the real world advertising affects consumer preferences, but it is not well understood in economic theory. Consumer behavior is difficult to model on that we can possibly agree (more the realm of psychology and sociology).
Yes, Dennis, this is exactly what I was saying. 🙂
I really think most microeconomic models are not very useful because of this, and it’s one of the reasons most economics papers are bunkum. (There are some subfields where advertising is irrelevant, such as high-level macroeconomics, but not many; and in high-level macro, politics becomes the most important effect.)
I think it is very much worth doing an intensive economics research program to create models which account for advertising. Advertising is typically a *first order effect* and making models which omit a first order effect gives you really bad predictive value in your models.
Everyone knows economics is applied psychology (it’s a truism), but many economists seem to ignore this.
SVO,
First off I am NOT an economist, I just took the basic courses taught at the sophomore level to econ majors at my university. A fair number of ag majors take these courses,since a lot of us run businesses. We also take a couple of basic accounting courses, sooner or later, most of the time.
I have made you points several times in this forum.
How you could conclude otherwise is beyond me.
Show me comments I have made here talking about supply and demand when I don’t use “production and consumption” rather “than supply and demand” – OTHER than when trying to explain the THEORY of supply demand and price.
I do not agree that microeconomics in this respect is useless outside the classroom.
You do not have to be able to make useful predictions using the theory for it to be useful. It enables you, if you understand it, properly, to understand in large part or sometimes in whole WHY quantities produced, quantities consumed, and prices are what they have been and are.
It enables you for example to have insight into what will happen if supply is curtailed, with end users cutting back, and substituting other products, etc.
Within this key post, or the last one, I have rambled extensively about the factors a good instructor talks about, the factors that mean the theory is useless, or near useless, for predicting prices, namely that there are too many variables in play, and quantifying all of them is just about impossible.
I have made the point that supply and demand is about a SNAPSHOT, not the movie of life.
ACTUALLY UNDERSTANDING the theory beyond the trivial level means you understand it is not very useful except in terms of gaining insight into the workings of the world.
Engineers understand that while the laws of physics are ironclad, they must be in PRACTICE used in such a fashion as to allow for lots of actual real variations in their work. An engine for instance varies substantially in efficiency depending on the circumstances under which in is operated, and how well it is designed, etc.
Economists understand that history is a great source of insight.
No body will produce at a loss forever, and end users will not pay more than they have too.
OVER the longer term, which might be pretty long, the theory says that producers will not produce at a loss. (Calling subsidized production producing at a loss is foolishness, the producer still gets paid for his production, just by someone other than his customer. ) It does not say that producers will not produce at a loss short term.
Likewise it does not say end users will buy more oil at higher prices, short term, but rather less, etc. It does not say that consumers will not substitute in the case of high prices, given time to do so.
I just don’t think you can point out a comment I have made that is inconsistent with supply and demand theory, but I might have made one, sometime when half asleep after having a couple of snorts of sleeping medicine, lol.
Maybe you have read only one or two of my comments on this matter and have a mistaken impression of my overall comments.
You may have been lurking a long time, but otoh, maybe you are a newbie.
Insight is always useful. It sometimes enables you to know some things that WILL NOT happen, even if it cannot enable you to predict what WILL happen.
This is the primary real value of supply and demand theory. INSIGHT.
Yeah. I think there’s empirical evidence which can be used to construct demand curves in some markets: you can discount soap and watch sales increase, and raise the price and watch sales drop.
But I’ve never seen a supply curve in real life. Changes in supply are typically *very slow* — supply doesn’t respond to price in the short term, and it often doesn’t respond for several years, by which time the price has changed. Supply responds to the price last year, or the price 5 years ago…
Once you work out the *lag time* on the way supply responds to price, you can start constructing solid models which give the correct predictions of boom-bust cycles in the market. There is never ever an equilibrium. (But they don’t teach this in most economics departments. Interestingly, the *ecology* departments do teach boom-bust cycles, usually with a gruesome example involving wolves and rabbits.)
Control theory would describe the boom-bust cycles as being due to a control function with a high lag time, and they understand this phenomenon well in engineering — if you have a high lag time, the controller keeps opening and closing and opening and closing rather than stabilizing at the average equilibrium in the middle. In the economy, the suppliers sense a change in price, and they adjust supply, but they always adjust it *too late*. The result is constant swings back and forth, never in equilibrium.
In a market like oil where demand ALSO adjusts slowly, you get even bigger booms and busts.
Thanks Nate. This comment was the most stimulating I’ve read in ages. It’s the lag, stupid!
Hi Nathaneal,
There are always these lags, economics has never proposed that supply and demand adjust instantaneously.
Yeah, but only the very best models actually *include the lag in the model*. Which is a problem for the models which don’t.
Why battery storage is key to a clean energy grid
Former FERC Chairman Jon Wellinghoff argues that storage needs policy support to pave the way for the grid of the future
By Jon Wellinghoff | March 16, 2016 | guest post at Utility Dive
Jeffrey Brown’s ELM gets a mention s this long-ish read.
What Happened to Peak Oil?
How market dynamics have changed the conversation around the availability of oil
by Tam Hunt, GTM, March 18, 2016
Demand is supply… and supply is demand. I think the “peak demand” argument is a bit simplified, and the author points out the physical limits… it’s a whole lot more expensive to get the marginal barrel out of the ground.
No. Demand and supply are different things. Demand only refers to the present point towards the future. From the present towards the past realized demand becomes consumption.
Tam Hunt doesn’t get it. The effects of Peak Oil are the same whatever the cause.
“There’s a good chance we will see peak oil demand arrive before a permanent peak in global peak oil production induced by physical limits.”
I think we saw peak oil demand and peak production happen in 2015.
TransCanada’s Perfectly Canadian Deal
Liam Denning, Bloomberg Gadfly, Mar 18, 2016 12:56 PM EST
TCPL has some solar in it’s portfolio. I expect they aren’t oblivious to the effect solar generation is having, and will increasingly have, on the wholesale electricity market.
I still see this pipeline purchase as a way to, in part, mitigate the valid concern that repurposing the Mainline, which brings gas eastward from Alberta, will leave eastern Canadian home and building owners short on gas on the coldest winter nights.
Solar may shrink the wholesale electricity market, particularly for power burn, but delivering gas to heat poorly insulated Canadian buildings with their high heating demand is “bread and butter” for companies like TCPL. Solar PV is not an alternative for meeting heating demand; essentially a deep energy retrofit of the Canadian building stock is the only way to resolve Eastern Canada’s dependency on gas.
Columbia’s pipeline network can gather Marcellus gas which TCPL could then export north to keep Canadian homes warm, and assuage concerns… that said the Marcellus peaked in June 2015, and is now down 3.4% from peak.
Solar PV + heat pump. Solar PV + storage heaters. Where is the problem?
NAOM
Building heat loss for most Canadian homes and buildings is quite large, and the sun doesn’t shine much when it’s cold out, and not at all when it’s coldest… at night. As it stands Quebec’s electric utility with all it’s hydro power still begs residents to conserve power in a cold snap.
Heat pumps will be needed, but I think they will have to be ground source as they have a much higher COP then air source heat pumps, and the COP stays the same when it’s cold out compared to air source heat pumps.
I still see the need for major retrofits to the building envelope of Canadian buildings and homes. An expensive and monumental task which isn’t on the radar of most provincial governments.
Maybe there will be something in tomorrow’s federal budget. There is supposed to be a lot of infrastructure spending. Hopefully the ratio of useful to useless infrastructure spending is high.
So insulate those homes — those retrofits do need to be done. They are NOT expensive.
_The Super Insulated Retrofit Book_ was published IN CANADA in 1981 and gave the full details. They haven’t really changed.
This still does not solve the demand peak in winter when PV does not deliver. 🙂
Heat pumps plus wind and enough transmission lines are the better solution for cold countries where peak demnad is not in summer months.
Don’t forget big insulated hole in ground full of summer-heated water as heat pump source in winter.
Lots of people have studied year-round heat storage.
I have still to find that this solution – which works for large objects – is useful for smaller buildings as the storage is too expensive, it gives only a small advantage in comparison to a normal ground sourc HP, and you still have the demand peak in winter when PV does not deliver meaningful amouts of energy.
Detail, detail. All depends on detail. In my case, the storage was already there, so no expense.
Another heating resource to remember is tepid water discharge.
Come to think of it, to hell with all this complexity, take the house off the polar bear and wear it yourself, like Inuit do.
Buy a cheap flight to Fla. for the bear.
PV delivers plenty of energy on clear days in winter. If you want to go into real details, the problem which needs a solution is that PV doesn’t deliver much energy *when it is snowing*.
Here’s one that works, if you can get a few friends to join in to get the economies of scale, and reduce perimeter losses from the ground storage.
http://www.dlsc.ca/borehole.htm
For my own home in a climate that swings between summer desert and winter snow I did the maths last night on this. I found that if I want 2 kW out of a water wall panel heater then about 170 litres of water in a tank which is 60C above my room temperature will give me 6 hours at 2 kW output. So a 2000 litre hotwater tank would give me a 6 hour per day 2 kW boost for about 10 days without thermal top up. That requires a tank 1.4 m diameter by 1.4 m high (for minimum surface area) which is pretty small for such a useful and simple space-heating storage device.
Heat with primary solar hot water panels with a superheater of electric resistance from your solar PV or wind turbine to boost to your top temp (say 90C) using a variable speed pump to sustain the required inlet temp in a single pass to maximise stratification in the tank. (You want the hot stuff at the top so you can draw on it at the design temp.)
Likewise when drawing energy use the same pump to vary the flow rate to sustain the required temperature differential across the heater panel in the room. Very low power pump works off your PV system.
Make sure family knows you want insulation batts for birthday and Christmas to lag the tank and room, and away you go!
A fair bit of embodied energy in the setup, but with 2000 litres or more you have a goodly bit of thermal resilience for your well-insulated home with low running cost in perpetuity.
It appears Tesla’s power wall has hit Australia, and our local consumer report site has done a few calculations.
All on grid scenarios, work out to have a pay back period greater than the 10 year warranty . So not many will be sold on pure financial terms. Of course it does form a good UPS system, if guaranteed power is what you need and can afford.
It does sound like a good plug and play package for off grid locations, but certainly at the upper end of the price range for such systems.
Maybe the Giga factory will change the dynamics?
https://www.choice.com.au/home-improvement/energy-saving/solar/articles/tesla-powerwall-payback-time
If Andrew was to install a 4kW solar array on his roof, he could expect to generate around 15.6 kWh of electricity per day, on average. About 7.5 kWh of this would be required to charge the Powerwall due to inefficiencies with the battery and inverter, which could then be used to offset 6.4 kWh of his energy use during the night. This would save him $1.40 per day (6.4 kWh x 21.81 c/kWh).
If we assume Andrew didn’t use the remaining 8.1kWh of solar energy after charging the Powerwall and fed it back into the grid, this would earn him $0.49 per day with a feed-in tariff of 6 c/kWh. Together with the savings from using the Powerwall to store electricity for later use, this will give a total saving of around $687 per year.
With Origin’s total system cost of $16,500, Andrew has a payback time of just over 24 years, or 2.4 times the warranty period.
But since Andrew and his wife work from home part-time, this allows them to make the most of their solar panels. If we assume Andrew could use half of his solar electricity remaining after charging his Powerwall every day, then he would lose $0.24 per day in feed-in tariffs but would save an additional $0.88 per day in electricity costs (4.05 kWh x 21.81 c/kWh). This would save him $2.52 per day or close to $921 per year. This equals a payback time of 18 years.
Obviously, the more solar energy Andrew can use to power his house, the better the payback time will be through lower electricity bills. As a best-case scenario, let’s assume Andrew managed to tap into all of his solar power by increasing his daytime energy use and charging his Powerwall; Andrew would be saving $3.40 per day (14.5kWh x 21.81 c/kWh), giving an annual saving of $1,154 or a payback time of just over 14 years.
I’m sorry but this Andrew and wife scenario is bogus! I could think of a hundred ways they could do things differently. Whoever wrote that piece has no clue about living in a non BAU world.
which could then be used to offset 6.4 kWh of his energy use during the night.
Seriously? They use 6.4 KWh at night?! On what? Neon light billboards?
Fred,
This is not an alternate life style magazine, it is a mainstream BAU consumer choice mag. Has been around for years, around mid 1970’s if I recall correctly. It is a calculation for Joe Sixpack to continue living his same life, as he lead before, using the Power wall.
As for the 6.4kWh during the night. Night time is going to be defined by ,when the sun is not shining, therefore early evening heating/cooling, cooking, washing, drying, entertainment system and hot water if on mains peak load.
But mainly the 6.4kWh is the working capacity of the 7kWh unit at 92% efficiency.
So, my take from your comment is, the Tesla power wall will not in a BAU operation!
On a much simpler note, lets say you can charge the power wall for nothing, and it operates at 100% efficiency. I pay approx 30c/kwh and the power wall stores 7 kWh= $2.10 * 365=$766 in saving per year,on a daily cycle.
$14,000 for the complete unit / $766= 18 year with solar or
$12,000 for just the battery pack/ $766=15.66 years with magical free energy.
Both past the warrantee life, and well past as normally expected commercial payback of 5 years.
It will be sold for the fussy good feeling it gives, rather than on financial terms.
Very similar to buying a Tesla car when I think about it!
FWIW,
How Soon Can Tesla Get Battery Cell Costs Below $100 per Kilowatt-Hour?
by Eric Wesoff, GTM, March 15, 2016
AWS,
From your article, Tesla current battery cost is currently $150-$200. So the battery cost of the 7kWh power wall is $1400, or $2000 if you call it a 10 kWh system.
The cheapest system in Oz was AUD 12,500 * .75= USD9300, which included an inverter. Tesla power wall requires it own special inverter, so you can’t use your old one.
So if battery cost can be cut to $100 kWh, then the $9,300 system can be cut to $8300. I do not believe that this will tip the scales enough to make the Power Wall a valid financial decision. A few more cost reductions will be required to make it main stream.
I’m am not saying there are not nitch markets for the Power Wall, but a lot has to happen to make it main stream!
” A few more cost reductions will be required to make it main stream. ”
I agree. I threw that comment in to point out the cost reduction trend.
In a couple of years I think everyone will have redesigned their inverters to work with the Powerwall. And I think inverter prices will start dropping.
Hi Fred,
We are on the same page just about all the time, BUT
I sometimes burn six kWh over the course of a night, with three large food freezers, a large refrigerator, hot water heater, etc, and the ac running on really hot sticky nights.
It’s not as hot here even in August as most of Australia is all summer.
Sleeping well and resting well in the evening in a cool house means I am far more productive the rest of the day.
Fit to live with, too.
Coming in and resting in a nice COOL room for an hour or two during the hottest part of the day means I can get my old carcass moving again for another couple of hours of serious outside work when the sun gets low in the sky, even if it is still humid and ninety.
A dollar or two a day spent on ac is a bargain, in my book, even though I am a Scots Irish skinflint who drives a seventeen year old compact car, and a twenty five year old pickup truck, both bought with well over a hundred thousand miles already on the odometer and already over ten years old.
I still cut firewood for heat. I get half my clothes at Goodwill. I grow my own beans, mostly.
Personally I will cut back on expensive purchased foods, or entertainment, or meals out, or damned near anything else necessary so as to afford air conditioning.
And yes, I have done everything within reason to make the old house easy to heat and cool, including new windows, doors, insulated vinyl siding, building a sun room that requires no heat at all during daylight hours other than free sun, etc.
We have excellent deciduous shade trees, maples and oaks, ornamental pears, etc. Some were here before the house was built, none are less than thirty years old. The sun barely touches the house in mid summer, but when it hits close to a hundred for a few days in a row………..
Fortunately most nights ac costs me from maybe a dime to fifty cents yankee, and then only from June to September. If it cools off to the mid seventies, I just run fans with open windows.
ONE beer, or one soft drink, costs more.
Eventually I hope to buy up some cheap second hand pv and install it myself, and chill out the house well enough before sunset to not need ac at night.
Now my old Daddy insists on spending his days in the sunroom, looking at the orchard and mountains and birds, and cars passing by, and cooling that sucker with all that glass means sucking up a lot of juice when it passes seventy five outside, even with the shade. I didn’t have money enough for the very best glass, or triple glazed, when I built it, it’s double glazed only.
But a couple of bucks a day to keep a man who worked his ass off all his life comfortable is still a bargain in my book.
A kWh costs me a less than twelve cents. I would pay triple that if necessary for ac, even if it meant all beans and rice and no bacon or burgers.
OFM, I’m guessing somewhere near Johnson City.
I am within hiking distance of the Blue Ridge Parkway and I77.
Any regular in this forum who is ever passing thru this neck of the woods is welcome to dinner on me, his better half as well.
Life is good here, except for all the damnyankees with lots of money moving in and turning this little corner of paradise into a retirement community and resort area.
Local folks are being squeezed out, when it comes to our traditional lifestyles. You can’t make enough money on a mountain farm to pay the taxes since the vacation houses started popping up. It’s hard to pick a path thru the woods anymore without getting arrested for trespassing.
Such people mostly have a zero sense of local community.
In coming here, they destroy what they came for, except when they are speculating in real estate to make money. They usually succeed at that.
Some multi millionaire bitch a couple of years ago literally threatened me that she was going to call the police because I almost hit her kids riding off road vehicles on the public road . They were on the wrong side of the road,in a blind curve, and than sort of vehicle is illegal as hell on a public road to begin with.
So I pulled out my cell phone and took pictures of the skid marks in the gravel, the vehicles, the kids, her etc, and told her that I was calling the sheriff myself.
This xxxxing bitch actually thought she was royalty, and that I had no right to be on a public road maintained and owned by the Commonwealth of Virginia for the last hundred years at least, simply because I was dressed like a farmer and driving a raggededy old farm truck instead of a new Caddy or Beemer.
She whistled a different tune in a hurry when I told her if she could be found when the sheriff’s deputies arrived that she would be arrested for child endangerment, her vehicles confiscated,her drivers permit revoked , and her kids taken at least temporarily into the custody of the state agency that deals with reckless parents, etc.
I haven’t seen this particular bitch since, nor her brats, and good riddance. But if I had actually run over them, I would have had a hell of a time sleeping afterward.
Gotta have another twenty million tons of coal and another ten million tons of oil right away tomorrow morning. Otherwise, it is going to be bad news.
Yankees who pay a visit down South go back home, damnyankees stay.
You have to make the distinction so everybody knows.
If you really want to catch up on American conservative zeitgeist, google ‘lame cherry’. I won’t say right wing. You won’t read anything like it anywhere.
Recommended for everyone’s enjoyment:
Sweet Home Alabama – Lynyrd Skynyrd
Jolene – Miley Cyrus version
Look What They’ve Done to My Song – Miley Cyrus version
An extremely talented singer, Miley Cyrus is really good at her craft.
Poke Salad Annie by Tony Joe White
“Made the alligators look tame”
Also, Charlie Daniels’ Uneasy Rider.
Of course, Joe South’s Don’t it Make You Wanna Go Home is a must.
If you haven’t seen the movie ‘Lady Killers’ starring Tom Hanks, it is worth your time to do so.
I don’t care if you are a liberal and I don’t care if you are a conservative, you are a human first and that is what counts the mostest.
Gotta have another twenty million tons of coal and another ten million tons of oil right away tomorrow morning. Otherwise, it is going to be bad news.
Tennessee ernie Ford – 16 Tons
https://goo.gl/KHDM0q
O.F.M., which would you prefer, climate change or damn yankees building vacation homes? If you had to pick one.
Great point Greenbub. I too watched paradise get built over and paved over. The huge development growth that went on due to population increase and monetary changes is certainly a lot more apparent and a lot faster than the slower, inexorable and chaotic changes of global warming/climate change.
One can get away from much of the development, I did by moving further from it. However, global warming is like a planet-wide steam roller, no one will escape it and no one can move away from it. Trapped, like rats in a maze of our own construction. More people will move to the hills as the real estate near the ocean disappears.
Of course you mean forced climate change, which is already doing bad things to the environment and will do a lot worse as time passes.
IF I were in a position to make such a choice, either / or, one or the other, I would reluctantly accept development as the lesser of two evils, at least at first glance.
But given that I am just one more naked ape more concerned with me and mine than the larger tribe of all apes, I would do everything I could to keep development to a bare minimum in my area, and shift it elsewhere. LOL.
In the long run, development is about the same thing as growth, and excessive growth is much the same as overshoot, I am painting fast with a very broad brush here.
If it weren’t for excessive growth , or development, we wouldn’t HAVE a forced climate change problem, would we? 😉
Overshoot could for real mean the end of life as we know it, and maybe even the end of our species in the NEAR to medium term if the coming resource wars escalate into a flat out WWIII. We must successfully cross all the near term bridges that might collapse under us before we even GET to the longer term bridge of climate change.
Our situation is that we are damned in the long run due to too much growth and development, due to climate change. BUT without more of the same, we are damned in the short run. There is for instance just about a zero possibility that we can give up industrial agriculture at this stage of the game of survival.Damned if we don’t , long term. Damned if we do , short term.
In analogous fashion, I will reluctantly accept HRC as the lesser of two evils compared to TRUMP, but I don’t WANT either one. I detest both, and would rather have Sanders than anybody else running in either party.
I realize that most folks here know I am self identified conservative, and some regularly mistake me for a REPUBLICAN, which I most certainly am NOT.
Coming out for Sanders sounds strange no doubt,coming from me,
BUT
The first and absolutely truly most conservative possible value is to preserve and protect the only home we have, and the only one we ever will have, more than likely.
Of course you have to have at least SOME BRAIN CELLS and SOME understanding of the sciences to appreciate this truth. Fortunately by the luck of the draw I have a sufficient measure of both to understand it.
Only a partisan fool republican, or somebody totally ignorant of the facts, could possibly believe the R party will do as well as the D party when it comes to protecting the environment.
By accepting development in general, a case can be made that you are also accepting forced climate change.
Beautiful locale. If I wasn’t west, I’d be poking around the Smokies.
I can hear Doc and Merle coming up out of the hollow. And smell that cornbread.
Of course, I really am a damn Yankee originally from Pennsylvania.
I spent my tenth year near Johnson City while my engineer father built a post office for FDR.
To a kid, the hills and forests and clear creeks were paradise.
The local hill folk took a dislike to us since our half Austrian Jewish cousins were living with us at the time and obviously “warn’t no kin of your’n”. We were ourselves, equally obviously kin of the locals.
One local bully decided to practice his arts on me, but was easily dissuaded by my nice peaceful demonstration of my skill with a sling, with which I could throw a lethal rock 100 yards and hit my target, or near enough to cause deep unease.
Thus I found my vocation for the next 40 years, making things that could throw things far enough and accurately enough to cause an uneasy peace to settle on this should-be paradise.
That was lovely Wimbi. 🙂
The path’s we inadvertently take.
There are a lot of places in the world that don’t have net-metering, and where power is very unreliable.
Think most of India!
Solar power is far cheaper than diesel generation for day to day power consumption, and a Powerwall gives the diesel continuity & reliability.
Cheap at the price.
Nick,
I totally agree there are nitch markets for the power wall. But it is hard to see the financial sense of installing it in a 1st world country, in a well serviced area.
Off grid installations, as you state, seem to be the most logical uses to me as well.
As for India, I would suggest not most of India, due to the Power walls current pricing, but certainly the richer households in India, and that is still a large potential market!
There are a million households in Hawaii. Call it a niche market, but that’s a lot of Powerwalls in a place where it is economically advantageous… (grid electricity is crazy expensive)
Nathanael,
You have been a busy boy, with your posting, but before you run away,do you have electric costs for Hawaii, and the cost of the power, including inverter, in Hawaii/US? The feed in tariff would also be a useful number.
It would be to see just how economic or not the Power Wall will be in Hawaii.
The main problem I see with the economics to work in Oz, is the high price the utilities seem to asking for the Power Wall in the first place!
In the real world the vast majority of people cannot afford niche energy innovations. That includes photovoltaics in India, where over 1 billion people are just trying to get by each week with food and shelter, not to mention medical/clothing/ transport/ education , etc.
It also includes battery packs in Hawaii where the vast majority do have money allocated to this purpose, they are really more concerned with paying one months electric bill.
Also, wind energy where is is not [very] windy, and PV where it is not [very] sunny, are in no way competitive with coal (despite our desires).
There is an awful lot of naive/fantasy talk on this post at times.
Hi Hickory,
Have you heard of HVDC transmission? The wind and solar power can be moved around, as coal and natural peak, electricity produced by wind, solar, geothermal, and hydro will become less expensive than electricity produced by fossil fuel. Use some imagination! 🙂 Wimbi is a mechanical engineer, do you seriously think he has not thought of these problems?
Hi Dennis. Agree- I was responding to some simpleton statements made above- not wimbi. Sorry for the confusion. Sometimes the posts end up out of the order in which one intended to place it.
On another note- here is a nice summary of the oil production trends that have been discussed here on this site-
http://oilprice.com/Energy/Energy-General/Why-We-Could-See-An-Oil-Price-Shock-In-2016.html
Price of power in Hawaii depends on which island you’re on. I found a current estimate that Oahu electric rates were typically 29.9 cents/kwh. The official schedule of rates starts around 22 cents / kwh but there are probably hidden charges which make it higher.
The power company on Oahu uses oil to generate power; when oil prices were higher, power rates were upwards of 35 cents/kwh.
Oahu is the *cheapest* of the islands.
https://hawaiienergy.com/about/get-the-facts
A lot is written at the moment about shale break even prices of 24 to 40 usd. Every time i try to calculate those numbers, even when using best wells as per shaleprofile.com i cannot get even close to those numbers. Does somebody have the basics behind the above break-evens?
Daniel,
I can highly recommend you reviewing the presentation from Ciaran Nolan on this subject, which was presented here in January 2016.
You also may be interested in the discussion (in the comment section) I had yesterday with Michael Filloon (a writer on Seeking Alpha), in which also a few calculations were presented: http://seekingalpha.com/article/3959718-bakken-update-continental-resources-top-bakken-player-2016
Enno and Daniel. The simple, undiscounted 60 month payout calculation has not been refuted, with really even no attempt to, since I first used it in early 2015 on LTO.
The only real criticism that has been valid has been from Mike, and a few other oil producers, who say 60 months is too long. Mike is probably right, but I am trying to give the companies the benefit of the doubt.
There are outlier wells that work, but Enno’s shale profile.com site is an excellent resource which shows that really no company can make these wells work at prices under $50 WTI, and really that $80+ is needed to have a good business. Remember when CLR cashed their hedges, they said they saw prices returning to $80-$90 soon. They did not. CLR and all others have cut to the bone on costs, but it is impossible to cut enough to overcome a 60-70% loss of gross revenue.
I have posted this model on seeking alpha several times. No successful attacks of my fifth grade math that I am aware of.
Enno, I think you made a good point with me awhile ago that the audience needs it dumbed down. Given few can understand the 60 month payout, let alone discounting future net cash flows, I wholeheartedly agree.
I encourage all to visit Enno’s site. It exposes the 900K EUR fallacy very well. Of course, the 900K is routinely half or more BOE gas, which has been selling below $12 per BOE for months.
There is a producer who posts on Oilpro.com named Jackie, whose posts I really enjoy. He keeps it simple, and I agree with him. If there is less money coming in the bank account than going out, you are losing money. No amount of slick investor presentations can refute that.
Daniel, in 50 years of being an oil producer I had never heard the term “breakeven” until the shale oil industry came along; it is a meaningless, much overused metric. The oil industry drills wells to make money, so we can drill more new wells with net cash flow from old wells. Profitability is all that matters. Reserve growth cannot occur without profitability; unless of course you are in the shale oil business, in which case you simply borrow enough money to grow, in spite of unprofitability, and suffer the consequences down the road. Which is precisely what is happening now.
I don’t borrow money to drill wells (that is a well known no-no) so I can’t wait 60 months to get my money back on a well I’ve drilled and completed. Thirty six months is the maximum and even that is too long. The 150% ROI numbers the shale industry use to throw around regarding “profitability” (but certainly can’t any longer!!) is insufficient return on investment to keep moving forward, at least to me. I need at least 300% ROI. If my CAPEX is risked I need even higher ROI. If I can’t achieve that, I don’t drill the well. I was taught these standards by many before me and they still apply today.
And by the way, anybody claiming that shale oil CAPEX is not highly “risked” I submit to you that the price of oil has fallen 70% in the past 16 months.
With great respect for my friend Shallow sand, I think it would actually require in excess of 120 dollar oil prices for the shale industry to be able to drill wells off net cash flow, in other words, to live within its means and not borrow money it can’t pay back. As far as I am concerned the hundreds of billions of dollars it has already borrowed…we’ll never see that. It’s gone.
Shallow you and Enno did great yesterday on Alpha; Filloon is a big time Bakken cheerleader. Those guys are getting desperate with their we’re OK rhetoric now. Its not about big IP’s and EUR’s, it’s not barrels and mcf’s…its about dollars and cents, nothing else. Keep up the good work, y’all.
Mike
Amen Amen, I say unto you. Welcome back Mike. It’s good to hear your voice
Thank you, John. You and Shallow are doing a fine job without me. Keep a bind on it, pardnor.
G’day Mike,
The boys, certainly did have a good time in Seeking Alpha. I feel Filloon, was getting rather pissed off by the end of the interrogation.
Keep the bastards honest they say!
As always, it is a pleasure to read your “no B.S.” comments. Cut to the chase and tell us like it is. Nice to have people in the reality based world weigh in on the madness.
A Mouthful of Marbles
I analyzed Cheseapeake some years ago. I concluded that their business model was land-flipping.
— lease land by hook or crook
— drill and frack as fast as possible
— announce high first year production
— SELL SELL SELL to an integrated oil company or “investors” at high prices
— laugh all the way to the bank
— landowners discover well casing was improper, water wells are contaminated, poison was dumped on fields, Cheseapeake never made promised royalty payments… but Cheseapeake is gone
— integrated oil company discovers that oil & gas runs out very very quickly, but Cheseapeake is gone
So their business is basically the same as selling swampland in Florida.
As far as I can tell,most of the frackers are in the same business. Given that, of COURSE they’re going to claim that they breakeven at low, low oil prices! They’re trying to sell off their wells to suckers as fast as possible.
Shallow,
I belief my words were that simple messages may be better understood and more convincing. 🙂
Yes, those were your words, not what I typed above.
My words = dumbed down.
I read a lot of Seeking Alpha articles on US E&P. I have trouble connecting with many of them because they just seem rehash company presentations.
I have been stunned at how much companies cut estimates of future production and development costs in their reserve reports from 2014 to 2015 in their 10K. Yet I have found no one commenting on this.
Even with these drastic cost cut estimates, PV10 is still near or below long term debt for almost all US E & P at $50.28 WTI oil and $2.58 HH natural gas. Almost unanimously, US E&P’s long term debt to PDP PV10 at current price decks is greater than 65%, meaning none qualify for bank financing. I see no mention of this either.
I take the above statements back slightly, Rune Likvern mentions these things, as does an author on Seeking Alpha, named Raw Energy.
US E&P long standing borrowing metrics were thrown out the window, and are still being thrown out the window. Shale continues to dig its own grave and is trying to bury the rest of the US industry with it.
I’ll stick to the 60 month undiscounted payout model till it is refuted. It is very easy to understand and gives shale 5 years, which is a long time for these wells.
Daniel,
Don’t waste your time calculating something that is so fuzzy as breakeven price.
Price of oil went up 55% in month and half? So demand went up that much? In middle of winter? 🙂 In the middle of “glut” and oil storages bursting from that overflow of oil? 🙂 Just like that with a snap of finger.
Ves,
Your critique is of course valid. But…
There is a huge difference between daily price curve and average quarterly price curve. Using average price for a longer period instead of daily price helps to smooth abrupt price movements and allow models like presented above to look more reasonable. Think about price curve as the result of juxtaposing of several sinusoid waves with different periods like in Fourier transform. Using average for a longer period essentially filters waves with a short period.
There was pretty long exchange between me and Alex on this subject some time ago that covered those issues.
Thanks all for your answers. Amazing the stories the shale oil companies can spin and that they are taken for true value by media, bankers, etc.
Daniel. I listened to a recording of Apache’s CEO today.
They have cut rigs from 93 to 4, but only expect a 7-11% production drop from 2015 to 2016. Their CEO said this is because, unlike most other companies, the core of their production is conventional. He seemed happy about this.
Interesting comment, I thought.
[…] An Empirical Model For Oil Prices and Some Implications […]
Hi Ron and Dennis
I will send you the corrected data for Texas in a couple of hours: the data reported by the RRC in the last two months showed some anomalous revised data for the case of the last month data (month t). This anomalous behavior took place only for crude oil data, but NOT for condensate and natural gas (which is quite strange). Therefore, the corrected data for January 2016 should be considered with some caution
Enno last time suggested that this may be due to lower crude oil production and therefore less filings to work out (thanks again for the information). The strange point that I found, is that this anomalous behavior took place only for crude oil data, but NOT for condensate and natural gas, which may be due to the fact that these three datasets are managed by different offices.
However, this anomalous behavior is not yet statistically significant and can be only a temporary data anomaly. Therefore, in the plots that I will send you I wrote an ATTENTION remark to be careful about the last corrected data in January 2016.
Ron, Dean
I see the above comment about anomalous data, and with Ron’s stepping back, wouldn’t be surprised at all if you quit publishing posts re Texas production trends. I would be a little disappointed if you quit because whenever I try to look at the incomplete Texas data I always feel something is anomalous, and end up more confused than when I started. So I value your report. Your analysis will be missed, but I and most others reading this blog will understand if you aren’t putting that analysis together anymore. Thanks again for this blog.
I sent my corrected data to Dennis and he is actively working on it. However, I do not know when he will publish the post about Texas
Dean
I took another look at it myself. The three latest preliminary monthly crude oil production reports showed delinquent leases dropping from 9048 for Nov. 15; 7082 for Dec. 15; and 5014 for Jan. 16. No wonder reported crude production increased. I hope you can adjust for the wide variation in reporting going on there.
Can you please send me the link relative to the delinquent leases ? Thanks
Sure, link follows for Jan 16
http://www.rrc.texas.gov/media/32807/own423_20160317_rrc180_jan2016.pdf
Dec 15 follows
http://www.rrc.texas.gov/media/32421/own423_20160212_rrc180_dec2015.pdf
Nov 15 follows
http://www.rrc.texas.gov/media/32022/own423_20160113_rrc180_nov2015.pdf
Texas makes a lot of info available but some is hard to find.
Please look at the second page, (final statements) of each of these reports as well. The number of delinquent leases seem to be falling fast. It seems they are doing something to improve the speed of their tallys. As a result, current month increase may only reflect better reporting, production for the month of January may be down from December. Its hard to tell without knowing which leases were delinquent in each period.
Could the fact that data is now being reported electronically by producers, combined with a decreased number of new leases be the reason?
I also hope to see a post on the Texas numbers. Helping to make sense of the craziness. Especially when Texas should be coming to an important inflection point, if the Bakken numbers is anything to go by.
I feel the EIA, with all its different arms, giving different numbers, is no better than an a shot at the dart board, ,making the picture more confused, rather clarifying it.
“US shale oil producers, we warned that a rebound in the price of oil as modest as $40 per barrel, could be sufficient to get drillers to resume production. ” Are em Clampets bout to open the Spigot?
http://www.zerohedge.com/news/2016-03-21/dreaded-scenario-oil-bulls-becoming-reality-reuters-warns-us-production-coming-back-
Compare with
https://bakken.com/news/id/252936/oil-price-plunge-north-sea-industry-faces-perfect-storm/
If you read it carefully, a bunch of these guys are talking about half-completed wells. Since the first half of the work is a sunk cost for them now, the breakeven price for *finishing* the well is much lower than the breakeven price for starting a *new* well. I can believe that the breakeven price for *completing* a well which is already drilled and shut in might be $40/bbl, but they won’t be doing any new drilling at that price.
Since the first half of the work is a sunk cost for them now
only 1/3 I think. 2/3 is completion costs.
Thank you for the more accurate number. Half was a WAG. 🙂
@ Dennis,
I was out in the woods last weekend, so I didn’t have the opportunity to respond to your questions in last Ronpost.
Dennis: “if you think that LTO output of 4.5 Mb/d can go to zero and OPEC, Canada, and Russia can make up that difference, I believe you are incorrect.”
I believe LTO output of 4.5 Mb/d will go to (nearly) zero rather soon (5 or 6 years, so 2021 or 2022), but I do not believe OPEC, Canada and Russia can make up that difference.
“Is that your assumption? Do you believe OPEC will fill that 4.5 Mb/d gap”
No. My assumption is that gap will not be filled. My assumption is the world will encounter Peak Oil very soon (if not yet).
“What are your assumptions about the future price of oil?”
That’s a tough one. Despite the model provided above by Ian Schindler. Let me take a wild guess: WTI in the $70-$80 range by december 2016. $110 by mid 2017 followed by another collapse of the price, due to real problems in China or India.
“Do you think the Brent oil price will be $35/b in Dec 2016 (STEO forecast)?”
See above: Brent versus WTI will vary within a 15% margin from eachother – mayby Brent being the cheaper one during 2016. (If you ask why?: This is just gut feeling.)
Verwimp,
Thank you for your input. Very interesting considerations, that actually correlate with my own thoughts on the subject. Especially possible return to recession in the second half of 2017 . I also feel that Brent might be very close to WTI from now on. Lifting export ban eliminated premium. Unless “artificial WTI” shipments spoil the broth.
One question. If we assume that is the return to recession in the second half 2017, will it necessary cause another collapse in oil prices; or may be downturn in oil prices will be more muted ?
One feature of the return to recession is the collapse of junk bond market, which makes financing of both shale and oil sands more difficult. And it typically happens before the actual economic downturn. That will make ramping up shale oil production in 2017 extremely challenging. High oil prices will be only of limited help, as there is no return to “good old days” of Ponzi financing of shale.
Even speculative financing (revolving credit, aka evergreen loans) is already under threat and will remain in this condition for the foreseeble future.
So shale players might have no money to re-start “carpet drilling” again.
I think difficult days are coming for US shale/LTO players and even temporary return to above $100 price range might not restore previous financing bonanza for them — with enough financial thrust you can make pigs fly, but you better do not stand in the place where they are going to land.
Of course they may be propped by the next administration for strategic reasons. Who knows…
Hi Likbez,
I don’t know. Really. I’m just trying to get grip on things like most of us.
I’t been a tough day in here in Belgium today.
A lot of game changers might come to surface very soon. I mean very soon.
I don’t know.
Sincerely,
Bruno
This is not investment advice, but I think both of you are correct.
I’ve been working from an old Deutsche Bank analysis which expects big swings in the price of oil. The high prices cause demand to drop and the low prices prevent exploration from happening. Result: total oil production declines continuously.
“Drillers Can’t Replace Lost Output as $100 Oil Inheritance Spent”
http://www.bloomberg.com/news/articles/2016-03-22/drillers-can-t-replace-lost-output-as-100-oil-inheritance-spent
The article is kind of light-weight, but it shows the sentiment is changing.
Laid-off By Oil Sands, Alberta Trades Seek Solar Relaunch
Worker-led initiative forms to retrain 1,000 idled electricians, boilermakers and others.
By Mychaylo Prystupa, Yesterday, TheTyee.ca
Perhaps one might have assumed they’d clean up their own mess; the reality of politics in a petrostate.
Alberta faces growing backlog of abandoned oil and gas wells
Millions needed to clean up sites and mitigate environmental risk
By Terry Reith, Briar Stewart, CBC News Posted: Jul 14, 2015 3:00 AM
Alberta energy minister keen on industry group’s well cleanup proposal
Petroleum Services Association of Canada wants $500M in federal money to decommission inactive wells
By Canadian Press, Erika Stark, CBC News Posted: Mar 15, 2016 12:08 PM MT
Gotta F ing love the Line in this Podcast by Brian @ Bloomberg ..
.. “People use this stuff ….. Gas and Oil” Ya Think 🙂
“The whole nature of the world counting on Energy Forever depends on men like Aubry McClendon” JB
https://audioboom.com/boos/4333059-the-last-days-of-a-legendary-land-man-aubrey-mclendon-bryan-gruley-bloomberg-businessweek
or
http://johnbatchelorshow.com/schedules
“Energy utility Electrabel is evacuating Belgium’s two nuclear power plants in the wake of Tuesday’s terrorist attacks in Brussels.”
http://www.zerohedge.com/news/2016-03-22/belgium-evacuates-nuclear-power-plant-panic-spreads-after-attacks
World-Renowned Climate Scientist Makes Dire Warning About Sea Level Rise, Storms
Dr. James Hansen
http://www.huffingtonpost.com/entry/james-hansen-sea-level-rise_us_56effb51e4b084c67220c630
All that article is telling me is that our globe’s climate will just continue to change, just like how it has as far back as we can think to measure. Oh, the humanity.
Nevertheless on a deeper note, looking through the ‘unspun’ data concerning past sea levels at the website of Virginia Tech Prof. Emeritus David Roper, for example (http://www.roperld.com/science/sealevelvstemperature.htm#MIA), it is easy to see that we’re currently below the sea levels achieved during previous inter-glacial periods. Moreover, extending out the purely natural trends shows that before climate change even entered the picture, we were already set to see additional sea level rise occur due to the behavior of the current inter-glacial period.
Of course, my own opinion is that considering all these changes are set to play out over a timeline of centuries, humankind will have no problem easily adapting in the long-run. After all, we have had to deal with some serious sea level changes and land subsidence throughout most of our known history.
No shit. Jim Hansen has been making the same prediction since 1981.
The New York Times, August 22,1981 Study finds warming trend that could raise sea levels.
“The seven atmospheric scientists predict a global warming of “almost unprecedented magnitude” in the next century. It might even be sufficient to melt and dislodge the ice cover of West Antarctica, they say, eventually leading to a worldwide rise of 15 to 20 feet in the sea level. In that case, they say, it would “flood 25 percent of Louisiana and Florida, 10 percent of New Jersey and many other lowlands throughout the world” within a century or less.”
So here we are 35 years later, a third of a century has past and we have got about 90 mm (0.3 feet) of sea level raise instead of the 5 feet promised for a third of a century. So Jim has only been 94% wrong.
Despite that, he keeps going at it knowing that he will be long dead before he is being called a lunatic. But he has no respect from his colleagues. Kevin Trenberth has said of him: Hansen’s study is rife with speculation and ‘what if’ scenarios, and contains many conjectures and huge extrapolations based on quite flimsy evidence.
Amazing that after 35 years there are people still falling for that old debunked prediction.
Geez Javier, did you read that quote? The rise won’t happen until certain events occur. You pretend it is a linear rise. That is not what the quote says. Purposeful poor interpretation to satisfy your constant hounding of climate science and scientists.
Are you sure you are a scientist? You act more like a religious fanatic.
Hopefully everybody in the forum knows that I disagree with Javier about the gravity or danger of forced climate change, but he does have a point.
The actual risk has been greatly overblown, in the SHORT term, for easily understood reasons. We all like make an impact, and talk of disaster sells.
Now when it comes to the MEDIUM or LONG TERM, thirty five years is not very long at all, even in historical terms. In biological or geological or climatic terms, a human generation is hardly even an EYEBLINK.
And there seems to be plenty of evidence that the rate of rise is accelerating.
THREE feet would be a disaster sure enough, and I personally believe kids alive today see three feet happen if they live to be old.There are a lot of positive feed back loops that will work to accelerate the process. The process is non linear due to these feed back effects, and a faster rise is altogether possible.
Javier’s main point is that we are focusing the vast majority of our attention on this one problem, and ignoring lots of other problems that may well cause MORE trouble sooner. I personally as a critical thinker find it impossible to refute this point.
Let us suppose for a minute that we were to focus as much attention, continuously, on population, as we do on climate. We KNOW how to lower birth rates, and we have AMPLE resources to actually do so, IF we were to make that decision.
Lowering the birth rate quicker and faster would go a HELL of a long way toward solving the climate problem, and doing so would be trivial, in terms of the political and economic difficulties by comparison.
We may in fact NOT have sufficient resources, material and political, to solve the climate problem via frontal assault.
Birth control otoh is DIRT cheap, compared to renewable energy on the grand scale. Birth control has the potential to solve the climate problem, as well as dozens of other extremely weighty problems.
Folks like Javier are priceless, because they force us to step back and take a fresh look at the political status quo once in a while.
And while I do absolutely believe in the scientific establishment status quo, I also believe anybody who does not believe there is a SUBSTANTIAL amount of politics involved in the climate issue is politically as naive as a child.
Once society gets the bit in its teeth, it tends to go overboard in whatever direction it is headed at that time. Take criminal law for instance. There are thousands of people in jail for selling pot, which is demonstrably many times safer than beer, which is legally sold on every corner and results in a hundred people at least dying in an auto accident every week, week in week out.
Glad that you agree with me on certain things, OFM, because I agree with you a lot.
We have very serious problems that are getting worse every day, and most of them come from the fact that we are too many, consuming too much and polluting too much. But that is the elephant in the room that governments and world leaders don’t want to discuss. Much better to discuss about a made up crisis that is totally out of our hands and likely to go away on its own, so they can claim victory without doing much.
Much better to discuss about a made up crisis that is totally out of our hands and likely to go away on its own
Fossil fuel is expensive, polluting and dangerous.
Fossil fuel creates so many problems that the proper public policy is to transition away from it as quickly as possible, regardless of climate change.
This is the single most important question on this forum, I think: “Should we support public policy to accelerate the transition away from fossil fuels?”
The answer is yes. Right??
Yes, Nick G. I agree on that.
Only one caveat. Let’s make sure we don’t blow up the global economy while doing it. The consequences could be much worse.
“Take criminal law for instance. There are thousands of people in jail for selling pot, which is demonstrably many times safer than beer”
Mac you need to read this-
Nixon Aide Reportedly Admitted Drug War Was Meant To Target Black People
http://www.huffingtonpost.com/entry/nixon-drug-war-racist_us_56f16a0ae4b03a640a6bbda1
“The Nixon campaign in 1968, and the Nixon White House after that, had two enemies: the antiwar left and black people. You understand what I’m saying? We knew we couldn’t make it illegal to be either against the war or black, but by getting the public to associate the hippies with marijuana and blacks with heroin, and then criminalizing both heavily, we could disrupt those communities. We could arrest their leaders, raid their homes, break up their meetings, and vilify them night after night on the evening news. Did we know we were lying about the drugs? Of course we did.”
GoneFishing,
I believe in the evidence, as any good scientist must do. You believe in some scientist’s gospel.
In his book of Revelations, John spoke of an Apocalypse that won’t happen until certain events (opening of the seven seals) occur. Frankly I see you a lot closer to religious fanaticism as you abandon reason for revelation.
And I do not pretend it is a linear rise. It is a linear rise. Just look at the data.
And oh yee unbelievers, on the 200th the turkey was not fed but had it’s head removed to become food. All the other turkeys were quite upset except one, who by not seeing it happen, thought everything was linear.
And hear me now sinners, I believe in the burning sun, the warming caused by CO2 and H2O without which your bones would ache with cold and you would freeze, soon meeting your maker or the other one.
But to pierce mother earth, remove the residue of the long dead, to burn and burn, will get you and your heirs nothing but hell and damnation. The innocent shall inherit the earth, and the earth will no longer be good.
Amen
Jarier, give it a rest. You should be relieved it’s only .3 feet. Have you ever watched an ice cube melt ? It sits there for a long time and nothing really happens. Then it warms from 32 degrees to 33 degrees and it all turns into water quickly.
The bigger they are, the harder they fall
Of course I am relieved. In the 80’s and 90’s we all thought that it was going to be a lot more. But now we know better.
What is the point in giving these failed prophets of climatic doom ample diffusion to frighten people that are ignorant of climate change?
By the way, since you talk about ice cubes in water. Do you know how much has sea ice changed in the world in the last 37 years? Nothing.
http://arctic.atmos.uiuc.edu/cryosphere/IMAGES/global.daily.ice.area.withtrend.jpg
“What is the point in giving these failed prophets of climatic doom ample diffusion to frighten people that are ignorant of climate change?”
Javier, with thinking like yours. Then maybe Ron should take down this website named PeakOilBarrel. I mean really, didn’t Ron learn from TOD that peak oil hasn’t happened ?
It’s not a matter of “if” it happens. Climate change a matter of how fast it’s happening.
XT5,
“I mean really, didn’t Ron learn from TOD that peak oil hasn’t happened ? “
What do you mean Peak Oil hasn’t happened? Peak Conventional Oil took place in 2005, Peak Oil Exports in 2007, and Peak C+C Oil in 2015. What Peak Oil hasn’t happened yet?
“It’s not a matter of “if” it happens. Climate change a matter of how fast it’s happening.”
Exactly my point, and climate change, measured by any variable, temperature increase, sea level rise, atmospheric CO2 increase, sea ice melting, is happening as fast now as since 1930 or since we have data. Do not trust me? Just check the data yourself.
It’s march of 2016 and your calling 2015 a peak. What kind of scientific standard did you use for that conclusion? Oh, that’s right. You didn’t.
It is called declining production by the majority of producers in a hostile environment for upstream capital expenditure to sustain production levels.
You can tell me I am wrong when C+C production gets higher than 2015. Until then it is your opinion against mine, but the evidence shows declining production.
Thanks, Jav.
…Thus presumably ‘adding up’, thus, increasingly adding to and/or flirting with other feedback mechanisms.
This presupposes that, to be charitable, you’re correct, even if GoneFishing et al. suggest otherwise.
Javier,
I stopped reading your comment after “failed prophets.” It sounds just like the typical rhetorical denial bullshit I read in comments section of yahoo news. Climate science is not a religion. Surely a scientist such as yourself can find a more even handed way to make your point. Do you consider yourself to be a prophet of the biological sciences?
chilyb, scientific evidence doesn’t tell us anything about the future of the climate, and our level of understanding of such a complex and chaotic system is very low, as the IPCC acknowledges.
Some scientists go as far as projecting current trends into the future and speculate how the future might be if everything remains the same (ceteris paribus). It never does, but that’s OK.
Other scientists build models with current understanding and tweak them to reproduce past climate hoping that those tweaks represent real mechanisms. They then run them forward into the future to make projections. But their projections run too hot indicating that their level of understanding is not enough for the task, and that the future climate is not going to be as bad as they think.
Finally a few scientists engage in fantasy scenarios and unrestrained speculation to predict dire climatic futures. Time and again they are proven wrong, but since some of them are clever enough to put enough distance to their predictions, and the media loves their apocalyptic views, they can enjoy their 15 minutes of fame or even repeat it several times. They are certainly prophets of doom. Sadly that’s the image that most people receive from climatic predictions.
Hi Javier,
prophets of doom, or not, Hansen’s latest work was accepted for publication after peer review – a lengthy and public one at that. I’m not saying this means it’s correct or not controversial (obviously). But probably not a complete fantasy scenario either, which, I’d like to point out, is also just your opinion. Does the publication process work differently in the biology field?
prophets of doom, or not, Hansen’s latest work was accepted for publication after peer review – a lengthy and public one at that.
Exactly! Furthermore a read of his response to the reviewers critique of the paper is also quite enlightening.
http://www.atmos-chem-phys-discuss.net/15/20059/2015/acpd-15-20059-2015-AR1.pdf
You may disagree with the conclusions of the paper but a fantasy, it is not! It is a solid scientific paper which was accepted and published after extensive peer review. As such it is now part of the scientific literature on this subject. If you wish to take issue with the conclusion that a 2C rise in global temps could be dangerous for our existence, then by all means do it but don’t say it didn’t go through peer review.
Fred,
“If you wish to take issue with the conclusion that a 2C rise in global temps could be dangerous for our existence, then by all means do it but don’t say it didn’t go through peer review.”
Try not to raise strawman arguments. Where did I say that Hansen’s work did not go through peer review?
Almost everybody disagrees with Hansen’s opinions on sea level rise. But that does not mean that it should not be accepted for publication. If only consensus science was published, science would advance a lot slower.
But the solidity of a work is given by its importance a few decades later, not by being accepted for publication. A big percentage of what is published does not make any impact and is quickly forgotten.
chilyb,
That it was reviewed and accepted for publication does not mean that we are going to get that sea level rise, does it? Hansen already published his 1981 projections in Science 213, 957-966, and sea level rise has not accelerated significantly in 35 years.
Now IPCC predicts about 0.4-0.5 m by 2100 and is based in an extensive review of the published literature, so Hansen is in contradiction of what the consensus of experts have determined. Hansen would have a point if the evidence was with him, but the evidence is not with him, the evidence points to less sea level rise than what IPCC expects.
It is not just my opinion, that Hansen’s scenario is a complete fantasy. It is also Kevin Trenverth’s opinion. Perhaps I should repeat his words:
“Hansen’s study is rife with speculation and ‘what if’ scenarios, and contains many conjectures and huge extrapolations based on quite flimsy evidence.”
Even Michael Mann has expressed doubts that Hansen scenario is realistic.
It looks to me that a lot of people is willing to concede the benefit of the doubt to the most extreme scenarios that predict catastrophic outcomes, while they refute the much more likely scenario that climate change is not going to be dangerous. That is called bias, and you get it when you divorce yourself from evidence.
yeah man, I already said that the report was controversial. The projections are based on non-linear response. I think we all get that.
Since you mentioned Michael Mann, here is his quote from Tuesday’s Guardian article. We should all read it:
“I’m always hesitant to ignore the findings and warnings of James Hansen; he has proven to be so very prescient when it comes to his early prediction about global warming. That having been said, I’m unconvinced that we could see melting rates over the next few decades anywhere near his exponential predictions, and everything else is contingent upon those melting rates being reasonable.”
So yes, he’s unconvinced. It’s a reasonable response given the implications and the assumptions going into the model. But also a pretty far cry from labeling him a “failed prophet of doom.”
Hell, here’s another quote which contradicts your statement above about the IPCC predictions on sea level rise:
“There is no doubt that the sea level rise, within the IPCC, is a very conservative number,” says Greg Holland, a climate and hurricane researcher at the National Center for Atmospheric Research, who has also reviewed the Hansen study. “So the truth lies somewhere between IPCC and Jim.”
The IPCC report on sea level rise is made by a panel of experts in sea level rise based on the relevant bibliography published on sea level rise. As such most people would agree that the IPCC represents, better than any other else, the consensus scientific view on sea level rise.
Jim Hansen is not only a scientist, he is also a climate activist. He has been arrested for protesting against the Keystone XL oil pipeline outside the White House in 2009 and again for protesting against mountaintop removal coal mining in 2010. He is on record saying that “The trains carrying coal to power plants are death trains. Coal-fired power plants are factories of death.” As such his objectivity in science is questionable.
Does he sound more like a prophet of doom with his factories of death? Essentially his predictions are always extreme alarmist views.
His 1988 climate scenarios show that actual temperatures have followed much closer to the lower emissions scenario in which emissions were frozen constant or decreased with respect to 1988 levels, than to the middle scenario, and specially to the high emissions scenario which is the path our emissions have followed.
The real question is why do we get from the press the really scary scenarios that are based on unrealistic assumptions fed as if they were the conclusion from scientific evidence, when they are not?
The truth does not lie between Jim Hansen and the IPCC. That’s an opinion. We have no idea what the future sea level rise is going to be. It could be less or it could be more than what the IPCC projects, but the chances of it being anywhere near Hansen’s predictions are exceedingly small. He gets all his predictions wrong.
“As such his objectivity in science is questionable…” ~ Javier
Carried over to here…
Every time Javier says something about climate change he embarrasses himself.
This CSALT model is basically the same projection that Hansen made in 1981. Nothing has changed and we are still on track for the same outcome (if not worse) that has always been predicted,
http://forum.azimuthproject.org/discussion/1674/csalt-model-of-global-temperature-time-series#latest
The CSALT model is unpublished. If it is so good you won’t have much trouble publishing it.
So what? It’s an application of a well known multiple regression algorithm.
Are you having problems understanding it?
Do we have yet to be made aware of any published work of Javier’s either?
Sure Dr. Javier Microbiologist, we’ll just take your esteemed personal opinions backed up by zero evidence and research of your own in climate science over all the actual climate scientists in the world engaged in doing the science!
Here is the actual paper, feel free to dispute the research and the data!
http://www.atmos-chem-phys.net/16/3761/2016/acp-16-3761-2016.html
Atmos. Chem. Phys., 16, 3761-3812, 2016
http://www.atmos-chem-phys.net/16/3761/2016/
doi:10.5194/acp-16-3761-2016
© Author(s) 2016. This work is distributed
under the Creative Commons Attribution 3.0 License.
Volume 16, issue 6
Article Peer review Metrics Related articles
Research article22 Mar 2016
Ice melt, sea level rise and superstorms: evidence from paleoclimate data, climate modeling, and modern observations that 2 °C global warming could be dangerous
James Hansen1, Makiko Sato1, Paul Hearty2, Reto Ruedy3,4, Maxwell Kelley3,4, Valerie Masson-Delmotte5, Gary Russell4, George Tselioudis4, Junji Cao6, Eric Rignot7,8, Isabella Velicogna7,8, Blair Tormey9, Bailey Donovan10, Evgeniya Kandiano11, Karina von Schuckmann12, Pushker Kharecha1,4, Allegra N. Legrande4, Michael Bauer4,13, and Kwok-Wai Lo3,4
1Climate Science, Awareness and Solutions, Columbia University Earth Institute, New York, NY 10115, USA
2Department of Environmental Studies, University of North Carolina at Wilmington, NC 28403, USA
3Trinnovium LLC, New York, NY 10025, USA
4NASA Goddard Institute for Space Studies, 2880 Broadway, New York, NY 10025, USA
5Institut Pierre Simon Laplace, Laboratoire des Sciences du Climat et de l’Environnement (CEA-CNRS-UVSQ), Gif-sur-Yvette, France
6Key Lab of Aerosol Chemistry & Physics, Institute of Earth Environment, Chinese Academy of Sciences, Xi’an 710075, China
7Jet Propulsion Laboratory, California Institute of Technology, Pasadena, CA 91109, USA
8Department of Earth System Science, University of California, Irvine, CA 92697, USA
9Program for the Study of Developed Shorelines, Western Carolina University, Cullowhee, NC 28723, USA
10Department of Geological Sciences, East Carolina University, Greenville, NC 27858, USA
11GEOMAR, Helmholtz Centre for Ocean Research, Wischhofstrasse 1–3, Kiel 24148, Germany
12Mediterranean Institute of Oceanography, University of Toulon, La Garde, France
13Department of Applied Physics and Applied Mathematics, Columbia University, New York, NY 10027, USA
Received: 11 Jun 2015 – Published in Atmos. Chem. Phys. Discuss.: 23 Jul 2015
Revised: 17 Feb 2016 – Accepted: 18 Feb 2016 – Published: 22 Mar 2016
Abstract. We use numerical climate simulations, paleoclimate data, and modern observations to study the effect of growing ice melt from Antarctica and Greenland. Meltwater tends to stabilize the ocean column, inducing amplifying feedbacks that increase subsurface ocean warming and ice shelf melting. Cold meltwater and induced dynamical effects cause ocean surface cooling in the Southern Ocean and North Atlantic, thus increasing Earth’s energy imbalance and heat flux into most of the global ocean’s surface. Southern Ocean surface cooling, while lower latitudes are warming, increases precipitation on the Southern Ocean, increasing ocean stratification, slowing deepwater formation, and increasing ice sheet mass loss. These feedbacks make ice sheets in contact with the ocean vulnerable to accelerating disintegration. We hypothesize that ice mass loss from the most vulnerable ice, sufficient to raise sea level several meters, is better approximated as exponential than by a more linear response. Doubling times of 10, 20 or 40 years yield multi-meter sea level rise in about 50, 100 or 200 years. Recent ice melt doubling times are near the lower end of the 10–40-year range, but the record is too short to confirm the nature of the response. The feedbacks, including subsurface ocean warming, help explain paleoclimate data and point to a dominant Southern Ocean role in controlling atmospheric CO2, which in turn exercised tight control on global temperature and sea level. The millennial (500–2000-year) timescale of deep-ocean ventilation affects the timescale for natural CO2 change and thus the timescale for paleo-global climate, ice sheet, and sea level changes, but this paleo-millennial timescale should not be misinterpreted as the timescale for ice sheet response to a rapid, large, human-made climate forcing. These climate feedbacks aid interpretation of events late in the prior interglacial, when sea level rose to +6–9 m with evidence of extreme storms while Earth was less than 1 °C warmer than today. Ice melt cooling of the North Atlantic and Southern oceans increases atmospheric temperature gradients, eddy kinetic energy and baroclinicity, thus driving more powerful storms. The modeling, paleoclimate evidence, and ongoing observations together imply that 2 °C global warming above the preindustrial level could be dangerous. Continued high fossil fuel emissions this century are predicted to yield (1) cooling of the Southern Ocean, especially in the Western Hemisphere; (2) slowing of the Southern Ocean overturning circulation, warming of the ice shelves, and growing ice sheet mass loss; (3) slowdown and eventual shutdown of the Atlantic overturning circulation with cooling of the North Atlantic region; (4) increasingly powerful storms; and (5) nonlinearly growing sea level rise, reaching several meters over a timescale of 50–150 years. These predictions, especially the cooling in the Southern Ocean and North Atlantic with markedly reduced warming or even cooling in Europe, differ fundamentally from existing climate change assessments. We discuss observations and modeling studies needed to refute or clarify these assertions.
Citation: Hansen, J., Sato, M., Hearty, P., Ruedy, R., Kelley, M., Masson-Delmotte, V., Russell, G., Tselioudis, G., Cao, J., Rignot, E., Velicogna, I., Tormey, B., Donovan, B., Kandiano, E., von Schuckmann, K., Kharecha, P., Legrande, A. N., Bauer, M., and Lo, K.-W.: Ice melt, sea level rise and superstorms: evidence from paleoclimate data, climate modeling, and modern observations that 2 °C global warming could be dangerous, Atmos. Chem. Phys., 16, 3761-3812, doi:10.5194/acp-16-3761-2016, 2016.
Give us this day our daily humor, lol.
If Wilhelm Reich’s Orgone Energy Accumulator could just be developed and expanded worldwide, the energy conundrum could have a solution.
Aim one at Greenland, one at Antarctica and voila, no more energy problems, water can be the solution.
The atmosphere could hold more water vapor, twenty times more or maybe even more, the thickness of the atmosphere could increase ten fold to 270 miles.
We’d all be RICH!
It will never be Peak Ether, so there really is nothing to worry about. All of this fuss and bother about Peak Usable Energies would just go away.
Don’t need no stinkin’ prediction models, none of that stuff.
Laugh out loud!
Hi Fred,
RATE OF CARBON EMISSIONS PUT IN CONTEXT
“… researchers have examined ocean sediments laid down during the Palaeocene-Eocene Thermal Maximum – a dramatic warming event some 56 million years ago. They find the amount of CO2 going into the air at its onset was four billion tonnes a year at most. Today’s figure is 10 times as big…”
http://www.bbc.com/news/science-environment-35867438
Meanwhile,
RISK OF MULTIPLE INTERACTING TIPPING POINTS SHOULD ENCOURAGE RAPID CO2 EMISSION REDUCTION
“…… research shows that existing studies have massively under-valued the risk that ongoing carbon dioxide emissions pose of triggering damaging tipping points.”
JOURNAL REFERENCE: http://www.nature.com/nclimate/journal/vaop/ncurrent/full/nclimate2964.html
More important: Astronomers have just found six new millisecond pulsars.
http://phys.org/news/2016-01-astronomers-millisecond-pulsars.html 🙂
Hi Doug,
Yeah, the issue IMHO has always been about relatively small perturbations setting off multiple feedback loops and causing irreversible tipping points in currently stable systems.
Chaos Math For Dummies
http://ed.ted.com/lessons/is-our-climate-headed-for-mathematical-chaos-victor-j-donnay
See also: Butterfly Effect
https://en.wikipedia.org/wiki/Butterfly_effect
Cheers!
P.S. The difference between H2O in a solid state changing phase to a liquid is only 1 C.
Senior Maygar,
Keeping ourselves on the positive side of life’s destiny as the denying dinosaurs post their comments. The world moves forward in reality everyday.
VW BUDD-e EV concept makes US auto show debut; 233-mile range based on EPA cycle; next-gen connectivity and HMI
http://www.greencarcongress.com/2016/03/20160323-budde.html
Salute
Mr. Magyar,
There is no need for me to expend time on somebody’s climate fantasy when the IPCC does a much better job at that. Chapter 13 of the WG1 AR5 is devoted entirely to sea level rise.
If both evidence and consensus climatologists agree that Hansen’s predictions are fantasies, what is there for me to do? Would you care to tell me why Hansen is more credible than IPCC?
IPCC credible emission scenarios project a mean increase of sea level of 0.4-0.5 m by 2100. That’s probably an upper limit since sea level rise has been 2-3 mm/year since the sea started to rise over 100 years ago, so an extrapolation of the past 100 years of global warming gives less than 0.3 m by 2100.
Source of the figure:
https://www.ipcc.ch/pdf/assessment-report/ar5/wg1/WG1AR5_Chapter13_FINAL.pdf
IPCC AR5 WG1 Chapter 13 Figure 13.10 pg. 1180.
Carbon Emissions Haven’t Been This High Since The Dinosaurs
http://www.huffingtonpost.com/entry/carbon-emissions-highest-in-66-million-years_us_56f05144e4b03a640a6b5177
Researchers analyzed the biological signatures of deep-sea sediment samples collected off the coast of New Jersey and found the current release of carbon into the atmosphere is “unprecedented during the past 66 million years.”
Candace Major, program director of the National Science Foundation‘s Division of Ocean Sciences, which funded the research, said in a statement that the study of “one of the most dramatic episodes of global change since the dinosaurs” shows the world has entered “uncharted territory”
Candace Major, program director of the National Science Foundation‘s Division of Ocean Sciences, which funded the research, said in a statement that the study of “one of the most dramatic episodes of global change since the dinosaurs” shows the world has entered “uncharted territory”
Why should we listen to her?! She can hardly be considered a reputable scientist if she makes comments such as that, eh?
She is obviously living in a fantasy world, and is probably in cahoots with the rest climate change conspiracy and hoax perpetrators.
Let’s put all of this to rest once and for all, the climate is not warming due to human induced CO2 emissions and the sea level is not rising and the ice melting off land masses can not possibly affect ocean currents. Oh, and lest we forget the ice caps are increasing. So don’t worry be happy! Just enjoy the herd of invisible pink unicorns cavorting under the rainbow! But don’t look too closely at bleaching tropical coral reefs they will all adapt to much warmer seas and if they don’t there will be a natural mass extinction event, it’s happened before and there weren’t any humans around to set things in motion back then… therefore we can only come to the logical conclusion that humans are having no effect on the climate today! BAH!
Mr. Fred,
Could I interest you in some real estate in south Florida ?
Cash only !
Avoiding a Soylent Green Future by 2040
Report from Global Sustainability Institute ties up peak oil, water shortages and climate change – possible worse case scenario:
https://www.wunderground.com/blog/JeffMasters/comment.html?entrynum=3269
Why? She’s right. We already know that current CO2 levels are elevated compared to the entire Quaternary Ice Age, and to get here in just a few decades it is clear that we have been producing CO2 at very high rates, clearly higher than during glacial terminations.
The question is not if that is right, but what does it mean. Is it a bad thing? How bad?
Well we know that producing faster and more CO2 than during glacial terminations has not given us the warming produced during glacial terminations, only a fraction of it. And having much higher CO2 levels than in millions of years still has not given us the highest temperatures in the Quaternary Ice Age. In fact only 125,000 years ago temperatures were quite a lot higher than now despite much lower CO2 levels.
The evidence clearly demonstrates that CO2 is not the main driver of temperatures. On the other hand increased CO2 increases planetary productivity due to the fertilization effect of CO2 and the increased temperatures.
We already knew what that study demonstrates and I fail to see why we should be alarmed by it. From humanity point of view we are much better with current CO2 levels and current temperatures that with pre-industrial temperatures and CO2 levels. I wish people would knew a little bit more about what pre-industrial conditions did to humanity.
Well we know that producing faster and more CO2 than during glacial terminations has not given us the warming produced during glacial terminations, only a fraction of it. And having much higher CO2 levels than in millions of years still has not given us the highest temperatures in the Quaternary Ice Age. In fact only 125,000 years ago temperatures were quite a lot higher than now despite much lower CO2 levels.
Have you ever seen that cartoon of a man falling off a tall building and as he falls he keeps saying: ” so far so good!”
The evidence clearly demonstrates that CO2 is not the main driver of temperatures. On the other hand increased CO2 increases planetary productivity due to the fertilization effect of CO2 and the increased temperatures.
Sorry! The evidence demonstrates no such thing! You can’t have your cake and eat it too. As for the fertilization effect, yeah it’s great if you are growing fields of poison ivy… Otherwise it’s mostly a pile of crock!
A joke is not much of a scientific argument. You can do better. Calculations of climate sensitivity based on instrumental measures are going down as the time passes. Even IPCC had to reduce the lower limit from AR4 to AR5 to not exclude most of the more recent articles. So no, we are not falling from anywhere.
If CO2 was the main driver of temperatures on Earth, the Eemian, which had significantly lower levels of CO2 (287 ppm according to Vostok, versus 400 ppm now) should have been cooler than present, and not much warmer. It is so obvious that I find surprising that you refute it. We are at the mercy of the orbital cycles.
The fertilization effect of increased CO2 is recognized by the IPCC, and I doubt it is only for poison ivy when farmers have been using it for decades to grow food in greenhouses. Satellites also show that semi-arid regions of the Earth are undergoing a very significant increase in foliage. In my country desertification was a huge problem in the seventies and was on the news and reports quite often. With global warming that problem got so much reduced that stopped being mentioned. But as nobody wants to say anything good about global warming nobody publishes anything about how desertification reverted. We have even got back some wetlands that had almost completely dried out, like the Tablas de Daimiel National Park.
Javier said:
That’s a lie. It really hasn’t changed since the Charney report was released in 1979.
http://imageshack.com/a/img922/9662/e2AFlb.png
WebHubTelescope,
IPCC has reduced the lower limit for ECS in AR5 respect AR4 because of improved understanding and more data that you are not acknowledging.
“The lower temperature limit of the assessed likely range is thus less than the 2°C in the AR4, but the upper limit is the same. This assessment reflects improved understanding, the extended temperature record in the atmosphere and ocean, and new estimates of radiative forcing.”
Aerosols are, by their cooling effect on the climate, thought to have counteracted some of the warming from greenhouse gases. The effect of aerosols is the biggest uncertainty in estimates of total anthropogenic forcing. Knowledge of aerosols is therefore of crucial importance for estimates of climate sensitivity.
And this is where the AR5 report has some excellent news: its estimates of the cooling effect of aerosols are substantially lower than those in AR4. This in turn implies that sensitivity to greenhouse gases must be lower.
The best estimate of aerosol forcing has come down substantially, from −1.3 W/m2 in AR4 to −0.9 W/m2 in AR5. This has the effect of increasing anthropogenic forcing for the same amount of warming with the net result of reducing sensitivity.
“The total anthropogenic RF best estimate for 2011 is 43% higher than that reported in AR4 for the year 2005. This is caused by a combination of continued growth in most greenhouse gas concentrations and improved estimates of RF by aerosols indicating a weaker net cooling effect (negative RF).”
IPCC has resisted giving a best estimate for ECS in AR5 likely because of the growing discrepancy between instrumental and model derived estimates for ECS.
As you don’t seem to be up to date on this issue, you should refrain of accusing anybody of lying. It reflects poorly on you.
It reflects poorly on you. Each of the last 2 lines that you show in that chart states 3.0 C for doubling of CO2.
That has been the same number since the Charney report of 1979.
Continued here…
From the EPA
“After a period of approximately 2,000 years of little change (not shown here), global average sea level rose throughout the 20th century, and the rate of change has accelerated in recent years. 1 When averaged over all the world’s oceans, absolute sea level increased at an average rate of 0.06 inches per year from 1880 to 2013 (see Figure 1). Since 1993, however, average sea level has risen at a rate of 0.11 to 0.14 inches per year—roughly twice as fast as the long-term trend.”
https://www3.epa.gov/climatechange/science/indicators/oceans/sea-level.html
With sea level rise accelerating, how can the data be linear? It’s not, unless one looks at very short time spans, which is the usual gimmick.
GoneFishing,
“After a period of approximately 2,000 years of little change (not shown here), global average sea level rose throughout the 20th century, and the rate of change has accelerated in recent years”
That depends on the definition of “little change”
For example in Grindsted et al 2009 reconstruction of sea levels for the past two thousand years, all changes are of less than one meter, including present ones.
GoneFishing,
“and the rate of change has accelerated in recent years”
EPA should learn from NOAA. The Laboratory of satellite altimetry defends that there has not been any sea level rise acceleration, and they should know as they have the best data.
Which, of course, is only one set of data and shows large differences with tidal gauge data.
And NOAA disagrees with you about the satellite data.
From the NOAA website
“Records and research show that sea level has been steadily rising at a rate of 0.04 to 0.1 inches per year since 1900. Since 1992, new methods of satellite altimetry (the measurement of elevation or altitude) indicate a rate of rise of 0.12 inches per year. This is a significantly larger rate than the sea-level rise averaged over the last several thousand years. “
GoneFishing,
“This is a significantly larger rate than the sea-level rise averaged over the last several thousand years.”
Of course it is. Between 1200 and 1700 sea level was going down. It is consistent with the expansion of glaciers during the Little Ice Age. If you average several thousand years you get a near zero trend, even if you include the 20th century and all 15 years of the 21st.
Why do you think the IPCC predicts only 0.4-0.5 m of sea level rise by 2100? Because the evidence does not show any significant sea level rise acceleration. Otherwise they will include it. What do you think they are? A bunch of skeptics?
You are free to disagree with them, as Hansen and others do, but the evidence of past 35 years of global warming is with them on this issue.
Why a thinking voter in up coming primaries might want to vote for Sanders:
http://www.cnn.com/2016/03/22/politics/2016-election-poll-donald-trump-hillary-clinton/
Go Bernie!
Reuters on shale companies’ hedging:
Scrambling for cover, U.S. shale producers ramp up hedging
http://www.reuters.com/article/us-usa-oil-hedging-idUSKCN0WP09X
Struggling U.S. shale producers have scrambled to sell future output at their fastest pace in about six months in recent weeks, curbing a rebound in prices and potentially prolonging the oil market’s worst rout in a generation, traders say.
As spot prices of crude rallied almost 60 percent from 12-year lows touched in mid-Feb, turnover in the long-dated oil contracts has soared to record highs, as producers started to lock in prices in the $40s, traders have said.
Turnover in the U.S. crude contracts for December 2017 surged to record highs of over 30,000 lots this past Friday while volumes in the December 2016 delivery touched an all-time high of nearly 94,000 lots.
Combined, that equates to almost 125 million barrels of oil worth over $5 billion, a small portion of overall daily volume in U.S. crude futures, but enough to catch traders’ attention.
Now, brokers and traders say that has turned into execution, with some producers willing to hedge in the high $30s or low $40s in 2016 and between $45-50 next year, levels that are just about breakeven for many.
That is also below the $50 psychological threshold that many had thought would be necessary to prompt producers to seek price protection, suggesting drillers have accepted a new reality of lower-for-longer prices as
“The cost of production has declined to the point where at mid-40s they can hedge actively to remain viable.”
Piling on hedges could prevent prices rallying through $45 a barrel while the extra protection may delay further U.S. production cuts, seen as key to eroding the glut
The impact of the pickup in hedging activity was most conspicuous in longer dated oil contracts.
The 2017 WTI price strip has risen only about 15 percent over the past six weeks, much lower than the prompt contract’s gains, while the selling has almost erased the far forward contract’s premium over spot.
The contango, as the structure is known, narrowed to $5.82 on Monday, its lowest in almost nine months, and down nearly two thirds from about a month ago.
John Saucer, vice president of research and analysis at Mobius Risk Group in Houston, said he saw a “material” increase in producer hedging, with most action in this and next year’s contracts, but extending through the whole of 2018.
Lack of forward buying by major consumers, like the airlines, has also meant prices have not received any boost as producers have been selling, adding to the pressure on prices.
To be sure, many hope for prices to go even higher.
“If prices recovered to that range north of $60, we’ll be seriously considering hedging,” billionaire wildcatter Harold Hamm said on a conference call.
Do they really make money on these prices, since most of them where barely profitable at 100$+ oil?
Or do they just log in to make profit by pumping from their already drilled holes while ignoring front load costs?
If they would make money after hedging, why isn’t there a new boom where everybody drills like mad?
“Do they really make money on these prices …?”
Surely they don’t.
They think that the oil price rally is not sustainable, so they want to lock in prices in low $40s, for 2016 and $45-50 for 2017-18.
AlexS One wonders if much of the hedging is being required by banks.
Hedges at these levels likely locks in enough cash flow to pay LOE, taxes, G &A and interest. However, locking in the high side at these levels also locks in a long period of little cash flow for CAPEX and/or retiring debt principal.
An interesting exercise once the hedges are fully disclosed would be to insert the resulting revenue number into cash inflows in the SEC 10K, and then calculating both undiscounted and discounted future net cash flows.
Also, assume we have a Bakken well that produces 120,000 barrels after royalties, that was completed 1/1/15 and has been hedged at an average price of $47 WTI for 2015-17.
A $7 discount puts us at $40. 10% severance puts us at $36.
Our $6-9 million well has only grossed $4.3 million in its first three years. Hedging at these levels locks in many wells to no hope of payout, as we will likely need to subtract another $6-8 per barrel, or more for LOE and $2-3 more for G & A. Oh yes, and another $4-7 more per barrel of interest expense.
Locking in through 2017 scores of wells completed in 2015 that will never payout.
shallow sand ,
“locking in the high side at these levels also locks in a long period of little cash flow ”
Exactly. That’s why I think they will hedge only a small part of their sales at current prices.
According to IHS, as of the beginning of 2016, North American E&Ps have hedged just 14% of their total oil production volumes for 2016 and 2% for 2017.
[ http://press.ihs.com/press-release/energy-power-media/north-american-oil-and-gas-companies-face-difficult-year-2016-stron ]
In January-February, they were not hedging; and some of distressed companies were even unwinding hedges in order to raise much-needed cash.
[ http://www.reuters.com/article/us-usa-oil-producers-hedge-idUSKCN0VL224 ]
Now hedging activity is increasing, but I think most of the future production will remain unhedged.
AlexS. Sub $50 WTI simply doesn’t work for US onshore lower 48 production to any significant scale.
There is a big media disconnect between LOE and CAPEX.
Although a broad generalization, the lower the current LOE, the newer the well and the higher the decline rate in the next year, etc.
For example, California Resources corporation has LOE around $20 per barrel, yet lower decline rates, while US LTO is around $6-9 per barrel, but has high decline rates. Further, CRC LOE will be more stable over time. Without addition of substantial new wells, US LTO LOE will surpass that of companies like CRC in less than 5 years IMO.
Again, I am speaking in broad terms, each well is different from every other, and each varies over time.
My view is Bakken wells producing under 1000 barrels net of royalties per month have LOE of $15+ generally.
I do apologize for mixing up OPEX and LOE over the last year plus.
I guess OPEX includes royalties, lifting costs and severance taxes?
LOE is lifting and operating expense. Same is calculated on net barrels, after royalties are paid. Expenses such as severance taxes, interest and general and administrative expenses are not included in LOE.
Further, always be aware that LOE is calculated in BOE, so gas and NGLs are included. Gas is on a 6 to 1 ratio with oil.
Many US LTO are touting reduced LOE, when the reality is the company wide gas to oil ratio is increasing. One BOE of gas is selling for $6-10 at the well head right now.
CLR is a good example. Their gas to oil ratio has went from 30:70 to 40:60 in about three years. So, part of the LOE per BOE is directly offset by lower realized per BOE prices. Further, gas is usually cheaper to produce than oil on a BOE basis in the US, so this also must be factored in.
I have been looking at Q1 2016 earnings estimates for US E &P, as well as FY 2016 earnings estimates. Horrible. Two years in a row of record losses are coming, with year 2 worse than year 1.
EIA weekly today, production down 30.000/day
Hello cliff!
http://ir.eia.gov/wpsr/overview.pdf
Production down 30 kb/d;
Total crude and product stocks up 6.9 million barrels (to new records);
Net crude imports up 691 kb/d in just one week (!) and 1.1 mb/d from a year ago.
Despite a glut in the local market, U.S. refiners and traders are rapidly increasing crude imports.
Study: 400 million of us will share autonomous cars by 2030
seems unbelievable it could move this fast…
http://www.thecarconnection.com/news/1102996_study-400-million-of-us-will-share-autonomous-cars-by-2030?google_editors_picks=true
I wouldn’t hold your breath, but that would be very cool.
All you need is a couple of bad accidents at highway speeds where the split second decisions of the automatic car are suspect and that 400 million number will be no more.
As opposed to the dozens of bad accidents every day at highway speed where the split-second decisions of the human drivers are suspect? This is the “man bites dog” phenomenon. The autonomous vehicle accidents may be statistically much, much rarer per million miles than human-caused, but precisely because they are rare (and probably have increased accountability, logged-data etc.), they will make more news and attract far more negative publicity and scrutiny, ironically making them less attractive.
Yes, HVACman.
There’s a weird but *very well documented* psychological bias present in most people — they’re much more willing to be killed and injured by *people* than killed and injured by *machinery*.
Self-driving autonomous trains have been *perfected technology* since the early 1970s. We still have train drivers because of this psychology. People demand that the robots be 100 times better than humans — in this case they already *are* and we still can’t get the autonomous trains implemented in most places. Sometimes the train drivers really do nothing except sit still and watch for trouble, and push the big red stop button if they see trouble — but it makes people more comfortable to know that there is a driver. Go figure.
Autonomous airplanes have been pretty close to perfect for decades. Same problem. People demand that the robots be 100 times better than humans.
Autonomous automobiles are actually much harder than autonomous airplanes or trains, largely because pedestrians and wildlife are allowed to cross the road and walk down the road. Same problem. People demand that the robots be 100 times better than humans, and this time they *aren’t*.
As a result we will not see many autonomous cars for a long time, except at ultra-low speeds. Instead, we’ll see more and more “driver assist” features like automatic braking (who can argue with automatic braking? The driver is legally supposed to brake if there’s something in front of him…) and so on, but the driver will remain “responsible” to satisfy people’s psychology.
HVACman, I agree with you.
I speculate, but there are probably thousands of minor accidents per day that are a result of driver inattention, distraction, stupidity, etc.
You may have a point if the “headlines” about the serious actions are typical of what we see today.
oh and add drunk driving
Well, what do the peer reviewed scientists say:
Significance
We present the first, to our knowledge, estimate of global sea-level (GSL) change over the last ∼3,000 years that is based upon statistical synthesis of a global database of regional sea-level reconstructions. GSL varied by ∼±8 cm over the pre-Industrial Common Era, with a notable decline over 1000–1400 CE coinciding with ∼0.2 °C of global cooling. The 20th century rise was extremely likely faster than during any of the 27 previous centuries. Semiempirical modeling indicates that, without global warming, GSL in the 20th century very likely would have risen by between −3 cm and +7 cm, rather than the ∼14 cm observed. Semiempirical 21st century projections largely reconcile differences between Intergovernmental Panel on Climate Change projections and semiempirical models.
http://www.pnas.org/content/113/11/E1434
So in my family we’re preparing for the two entities our beloved taxpayer-funded bureaucrats say could cause the end of the world — ISIS and the man-made climate change schlock.
For one we’ve stockpiled a cellar full of nonperishable food, water, communications equipment, defensive weapons (mostly guns), and ammunition.
For the other we’ve stockpiled cargo shorts, sunscreen, sunglasses, flipflops, and scuba gear.
We should be good to go no matter what happens with either issue, right?
You’re all set against the terrorists, but what about the larger threat?
http://www.snopes.com/toddlers-killed-americans-terrorists/
Make sure to secure your toddlers.
Competent survivalism is all about food and community. I have some friends who have gone heavily into “permaculture” (which is really quite hard to do when the climate is changing, so they have to keep up to date with the climate shift projection maps).
Not my thing. I planted myself in a community which will probably deal with the problems as a whole, unified community (and other people can do the permaculture).
In one of the previous threads, there was a discussion about potential growth in U.S. LTO output in case oil prices remained at high levels and there was no decline in rig count from record October 2014 levels.
According to the EIA’s estimate, under this scenario, by March 2016, oil production in 3 key LTO plays would be significantly higher than actual production, estimated in the Drilling Productivity report:
• In the Bakken: more than 1.6 mb/d vs. 1.1 mb/d;
• In the Eagle Ford: more than 2 mb/d vs. 1.23 mb/d;
• In the Permian basin: about 2.35 mb/d vs. 2.04 mb/d
Thus, according to the EIA estimate, with the rig count at October 2014 levels, combined output in these 3 regions would be around 6 mb/d by March 2016 vs. 4.38 mb/d estimate from the most recent DPR.
The EIA has also modeled another scenario, in which there was no drilling at all since the end of 2014.
In that case, Permian would lose almost 1 mb/d, Eagle Ford about 500 kb/d, and Bakken 400 kb/d.
Relationship among actual, no rig decline, and no drilling output trajectories across 3 key tight oil regions
Source: EIA
AlexS. EIA reported 48% of 2015 US lower 48 onshore production came from wells completed in 2014 or 2015.
shallow sand,
This underscores the importance of new wells drilled and completed in the shale plays.
In terms of variables that affect price, here is an article from insideevs.com that sort of mirrors a discussion here some time ago, about how many plug in cars it will take to have a material impact on oil demand. When Ive got some time, I will dig it up and see whether this guys calculations agree with ours in any way.
Lower Forever: Electric Cars and the Inevitable Reality of the Oil Market
In late 2014 through 2015 a worldwide oversupply of crude oil existed mostly in the order of 1 to 2 million barrels per day according to the EIA. WTI Crude Oil sold off from well over $100 in mid-2014 to under $27 a barrel in February of 2016. As a result of the prolonged oversupply and pricing pressure, oil companies drastically slashed capital expenditures, reduced workforces and reluctantly accepted the “lower for longer” mantra.
But what would it take for the market to accept what electric car advocates already believe – that prices and demand for oil will remain Lower Forever? To begin with, the market needs to observe enough oil demand destruction to conclude that electric cars are having a significant impact on market fundamentals. If this can be observed in the context of an “S” shaped growth curve, market participants will quickly realize that oil will soon reach Peak Demand and then begin falling. A huge psychological threshold will be crossed when electric cars beginning displacing about 50% of annual oil demand growth. At that point it will be pretty obvious that oil consumption will inevitably begin a steady decline.
Ah, hmm, they think 50% of demand *growth* is the number. Interesting.
I have recently been convinced that the growth of the electric car market as a whole will be supply-constrained rather than demand-constrained. I should do a bottom-up model of how fast 13 million cars can be put on the road. I think it takes longer than they are estimating because they’re doing a demand-based growth model.
“The U.S. mining industry—a sector that includes oil drillers—lost more money last year than it made in the previous eight.”
http://davidstockmanscontracorner.com/us-energymining-losses-in-2015-wiped-out-eight-years-of-profits/
In reference to Russia’s Military Threat to NATO:
“But that was all based on the world’s one-time boom in oil, gas, nickel, aluminum, fertilizer, steel and other commodities and processed industrial materials.”
http://davidstockmanscontracorner.com/trump-is-right-dump-nato-now/
Again Yep.. says so : “the world’s one-time boom in Oil, …” Got PV yet?
I got the data & time to do a post on the Eagle Ford earlier than I expected. A new post is
here.
Beings that there are coral reefs from way back when at land locations in Florida is evidence that the sea levels were once higher millions of years ago. The coastline was miles further inland.
Even when the earth was flat, sea levels rose and fell. There are hour long documentaries on youtube ‘splaining, with incontrovertible evidence, how the earth is indeed flat. There are other documentaries revealing holes in the earth proving that the earth is hollow. A flat, hollow earth, whoddathunkit?
The earth is hollow now because mankind has pumped the oil out of the flat earth, all that is left is an empty space taking up time. Now you know the reason why. Just measure the volumes of the hollowed holes inside the flat earth and you will estimate to the barrel how much oil has been consumed. You’ll be able to make a prediction from those numbers.
I’ll go with the ice age documentaries and actual measurements of the size and shape of the earth, not some pie-in-the-sky fantasy with no real basis for proof.
The sun is 93 million miles away and it is visible to the eye. At 800,000 miles across and moving at 12 m per second, it is a sight not soon to be forgotten.
*https://www.youtube.com/watch?v=Va0BIqfzpvo
There is an interesting article on resilience.com on shale debt:
http://www.resilience.org/stories/2016-03-25/shale-euphoria-the-boom-and-bust-of-sub-prime-oil-and-natural-gas
That should give some thoughts to shale enthusiasts. In 2020 the shale industry has to pay back over USD 200 bn. The total revenue is currently less than 100 bn per year. Even if the industry can roll over debt, how will it get more debt for new production in 2020?
Heinrich Leopold,
The chart from Bloomberg shows cumulative debt payments, not annual.
Alex,
Still this is “too late to drink mineral water to cure your liver, damaged by binge drinking” type of the situation.
You think Borjomi won’t help? 🙂
Heinrich,
I don’t believe, anybody is arguing that the price of nat gas does not need to rise for the survival of the companies. It is the time frame and level of the increases that you suggest, that I have always argued with.
The main reason I feel the US shale gas suppliers have a better chance of survival, than the shale oil suppliers, is the fact that, Nat Gas is more of a confined market place. When the producers finally succumb to the lack of cash flow, the US nat gas market place will react, giving the survivors the chance to pay back their loans. On the other hand, the shale oil produces will not necessary get the same timely treatment from the world oil market. Certainly, it will not be on the shale oil suppliers terms.
Right, this is an important point.
Oil demand is traditionally inelastic. However, electric cars are starting to make serious inroads and will be making a noticable if small dent in the oil market come 2020 (I estimate 1/2 of 1% of global demand).
Gas demand… actually, I’m having a lot more trouble figuring this out. So I’ll try one more time.
The main substitutes are wind power and solar power. At current gas prices, the best combined cycle gas plants cost 1.59 in capital costs, 5.36 in variable costs (mostly fuel) and 0.31 in fixed recurring costs (EIA). It’s hard for me to figure out what EIA’s opqaue assumptions are.
New wind and new utility-scale solar are already cheaper than the total levelized costs of gas (Lazard). *Next year*, solar is expected to typically be cheaper than the *ongoing* costs of gas-burning (Lazard), and wind often already is — this is going to cause the boom to end all booms. That is to say, the renewables boom to end all oil & gas booms.
A $1 increase in natgas prices causes natgas electrical generation costs to go up by at least $0.005687/kwh (that’s based on 60% efficiency combined cycle — 43% efficiency obviously causes it to go up faster).
Again assuming 60% efficiency Combined Cycle, Lazard’s analysis assumes $3.50 natgas -> $0.02/kwh in fuel, implying $0.015+ in other costs (they have $.035 as the low-end combined cycle price).
With *current* worst-case utility solar costing about 7 cents/kwh levelized, this implies that a natgas price of $12.30 is the absolute cap on natgas prices before solar gets installed to replace the fuel. However, projected utility solar for 2017 is 4.3 cents, which puts the cap at $7.56. *New* natgas plants get killed a lot earlier: for those the natgas price cap is $9.67 (worst-case solar now) or $4.92 (next year); above those prices nobody builds a new plant.
By the time the current natgas glut is burned off we’ll be looking ata price cap for new natgas plant construction of $3.50 or less and an overall natgas price cap of $6.15 or less.
This phenomenon — where anytime the price exceeds the cap, solar is built until enough natgas demand is destroyed to force the price back down — lasts until natgas is driven out of the daytime electrical generation market completely. At that point, I have to reanalyze! 🙂
Anyway, it’s looking like none of the shale gas plays — except the liquids-rich ones, which are really oil plays — break even at gas prices below $4. Solar could hit 2.8 cents / kwh LCOE by 2019, which would cap the natgas price at $4.10. That’s the *end* for daytime gas generation. Wind will probably also hit that price, which reduces nighttime gas generation too.
After the electricity-generation market for gas is almost completely destroyed, the gas price will likely go back up. But until then, there’s no future in gas exploration. The shale companies will all hit the wall.
From the IEA:
Decoupling of global emissions and economic growth confirmed
IEA analysis shows energy-related emissions of CO2 stalled for the second year in a row as renewable energy surged
16 March 2016
http://www.iea.org/newsroomandevents/pressreleases/2016/march/decoupling-of-global-emissions-and-economic-growth-confirmed.html
Global energy-related carbon dioxide emissions – the largest source of man-made greenhouse gas emissions – stayed flat for the second year in a row, according to analysis of preliminary data for 2015 released today by the International Energy Agency.
“The new figures confirm last year’s surprising but welcome news: we now have seen two straight years of greenhouse gas emissions decoupling from economic growth,” said IEA Executive Director Fatih Birol.
Global emissions of carbon dioxide stood at 32.1 billion tonnes in 2015, having remained essentially flat since 2013. The IEA preliminary data suggest that electricity generated by renewables played a critical role, having accounted for around 90% of new electricity generation in 2015; wind alone produced more than half of new electricity generation. In parallel, the global economy continued to grow by more than 3%, offering further evidence that the link between economic growth and emissions growth is weakening.
In the more than 40 years in which the IEA has been providing information on CO2emissions, there have been only four periods in which emissions stood still or fell compared to the previous year. Three of those – the early 1980s, 1992 and 2009 – were associated with global economic weakness. But the recent stall in emissions comes amid economic expansion: according to the International Monetary Fund, global GDP grew by 3.4% in 2014 and 3.1% in 2015.
The two largest emitters, China and the United States, both registered a decline in energy-related CO2 in 2015.
Global energy-related CO2 emissions
Alberta and oil prices: How Middle East geopolitics and religion affect our future
OPEC has actively managed oil prices since the early 1970s by coordinating production and controlling the global supply. Alberta is a significant oil exporter and has benefited from OPEC’s global oil price management
But recent increases in oil supply came from Alberta oilsands and North American shale oil, not from the OPEC countries.