The EIA has just published their data on World and Non-OPEC Oil Production. All data is through November 2018 and is in thousand barrels per day. All data is Crude + Condensate.
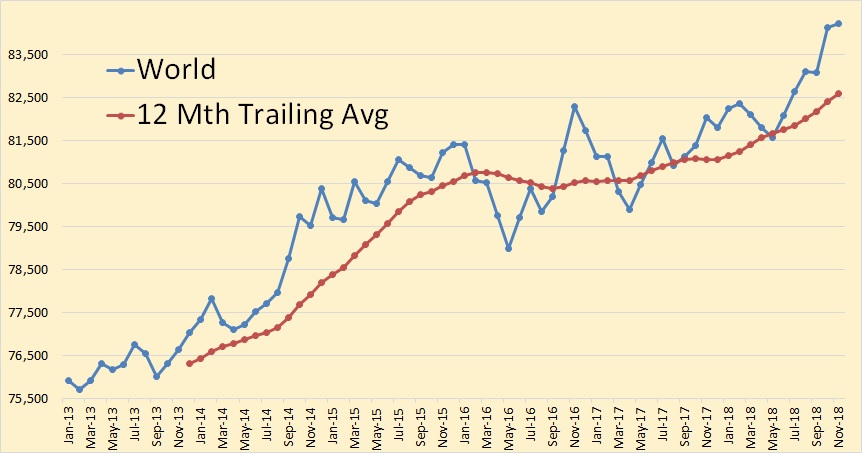
World C+C was up 96,000 bpd in November to 84,225,000 bpd.
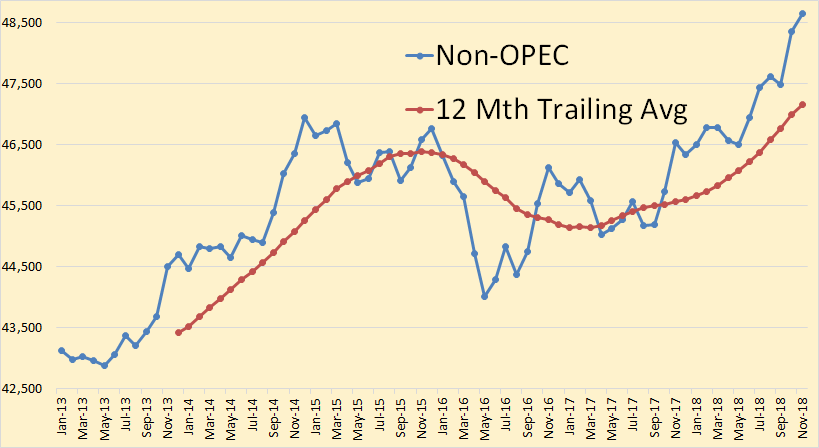
Non-OPEC was up 280,000 bpd in November to 48,638,000 bpd.
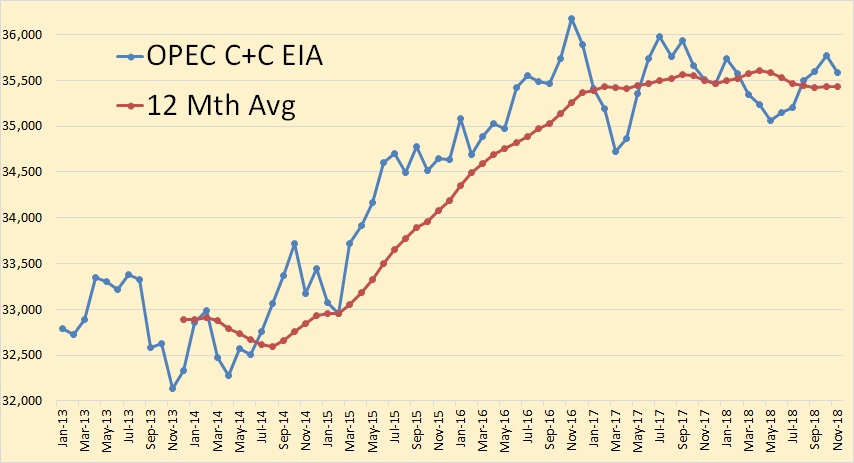
The EIA says OPEC C+C was down 184,000 bpd to 35,587,000 bpd in November.
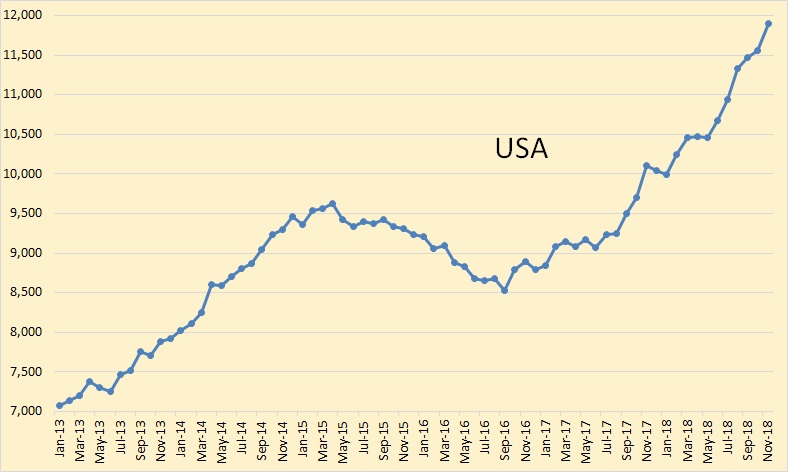
The USA was, by far, the big gainer in November, up 345,000 bpd to 11,900,000 bpd.
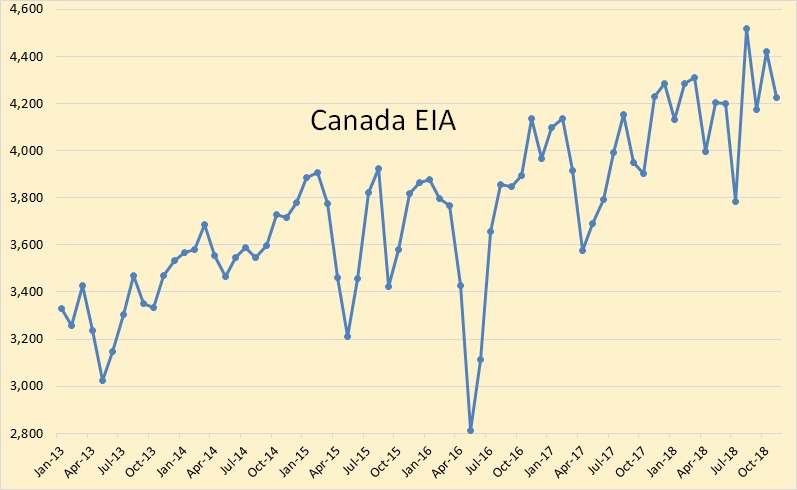
Canada was down 195,000 bpd to 4,295,000 bpd.
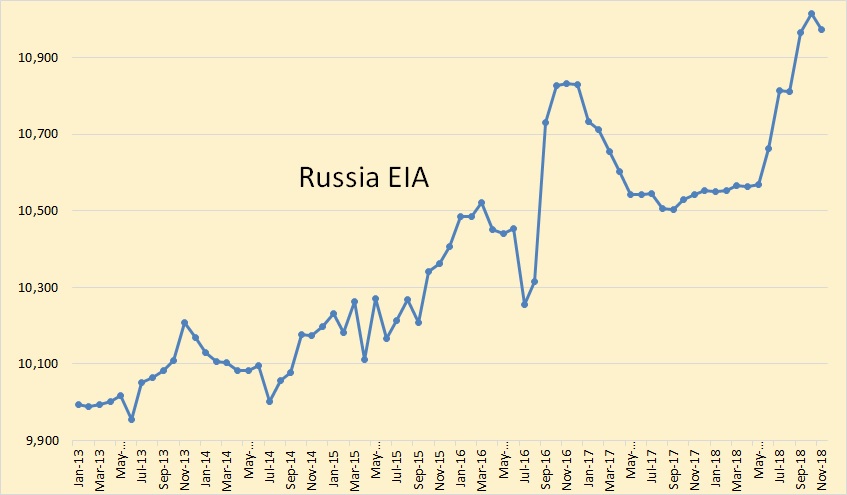
The EIA says Russia was down, in November, 42,000 bpd to 10,972,000 bpd.
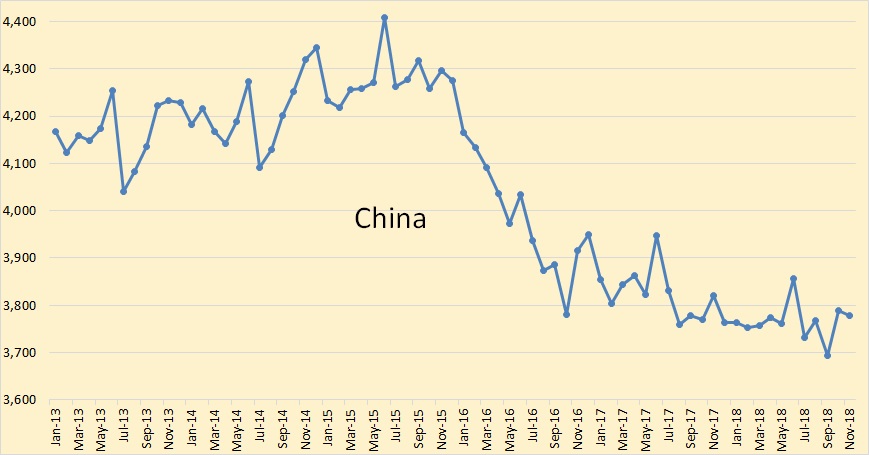
China was down 10,000 bpd in November to 3,779,000 bpd.
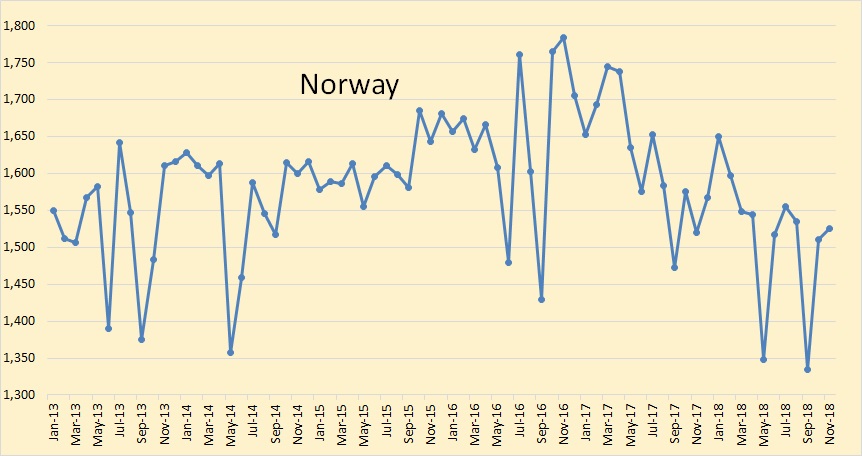
Norway was up 14,000 bpd to 1,525,000 bpd.
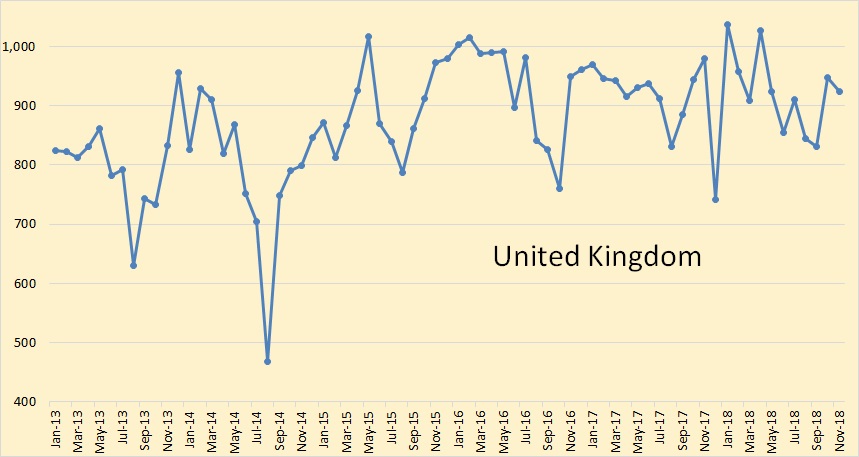
The United Kingdom was down 24,000 bpd to 924,000 bpd.
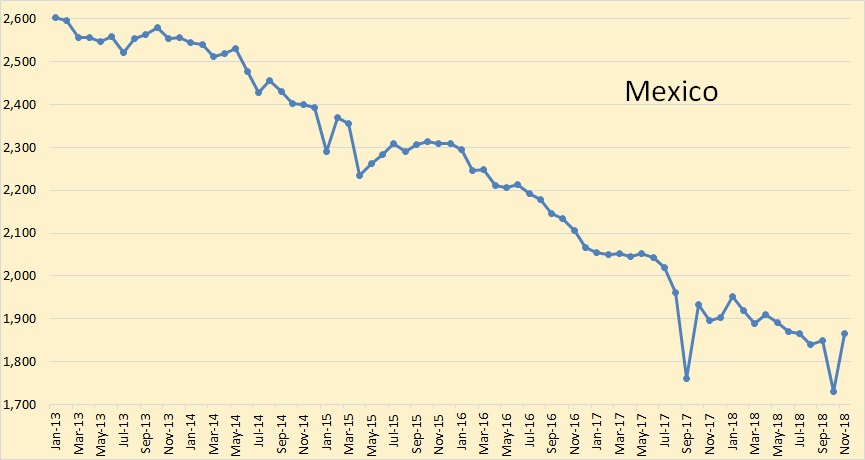
Mexican production was up 134,000 bpd to 1,865,000 bpd in November.
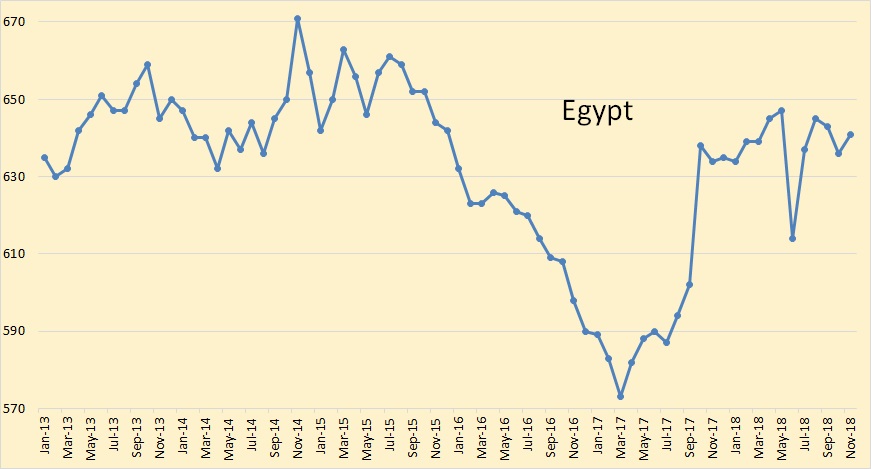
Egypt was up 5,000 bpd to 641,000 bpd in November.
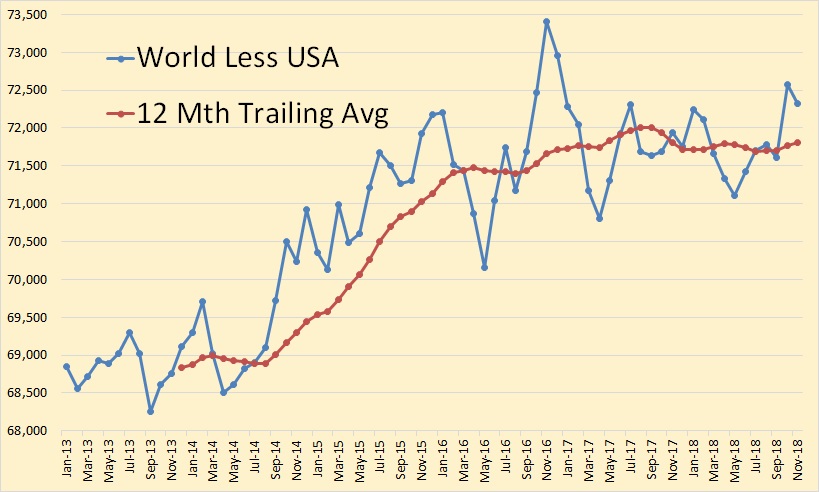
World C+C less USA production was down 249,000 bpd to 72,326,000 bpd in November.
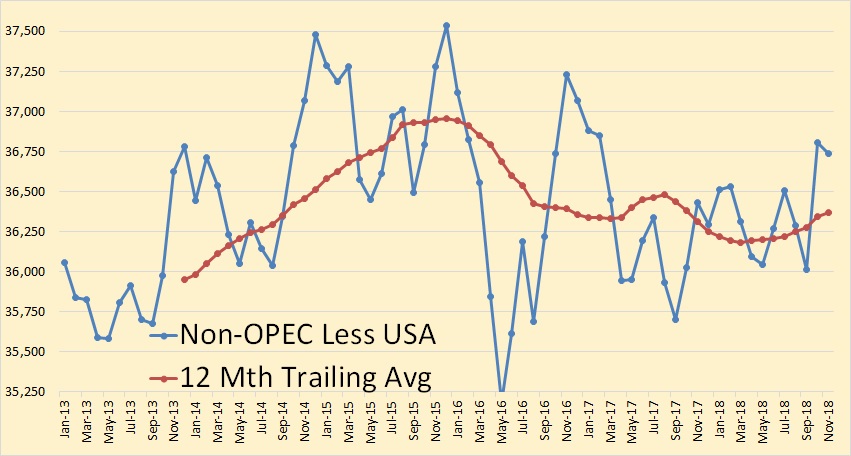
Non-OPEC less USA C+C production was down 65,000 bpd to 36,739,000 bpd in November.
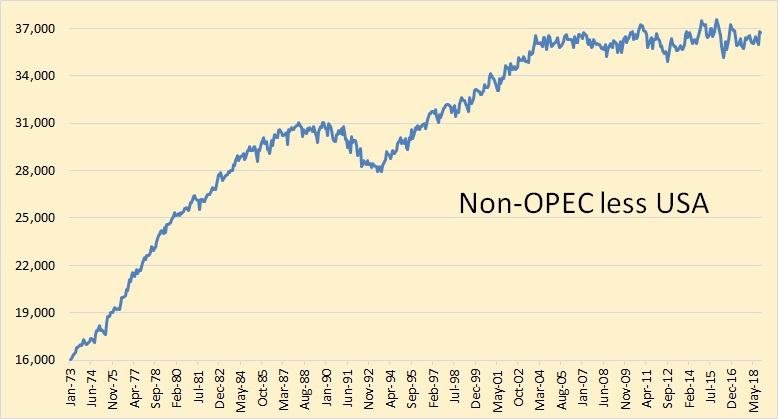
Non-OPEC less USA has been on a bumpy plateau for 15 years. It has been only Russia and Canada that has kept that bumpy plateau going for 15 years.
So it’s up to Canada, Russia and the USA to keep Non-OPEC from tanking. Canada is nearing maximum production due to pipeline constraints and even the optimistic oil experts are saying Russia is near her peak, so it is up to the USA to keep Non-OPEC peak oil at bay. And that means it’s all up to the shale oil patch to keep increasing production.
However….
Olson, Bradley; Elliott, Rebecca.Wall Street Journal (Online); New York, N.Y.
The once-powerful partnership between fracking companies and Wall Street is fraying as the industry struggles to attract investors after nearly a decade of losing money.
Frequent infusions of Wall Street capital have sustained the U.S. shale boom. But that largess is running out. New bond and equity deals have dwindled to the lowest level since 2007. Companies raised about $22 billion from equity and debt financing in 2018, less than half the total in 2016 and almost one-third of what they raised in 2012, according to Dealogic.
The loss of that lifeline is forcing shale companies—which have helped to turn the U.S. into an energy superpower— to reduce spending and face the prospect of slower growth . More than a dozen companies have announced spending reductions so far this year, even as crude-oil prices have rallied more than 20% from December lows. More are expected to tighten budgets as they release earnings in coming weeks.
The drop in financial backing is especially being felt by smaller, more indebted drillers. But even larger, better-capitalized frackers are facing renewed investor skepticism about whether they can keep spending in check and still hit growth and cash-flow targets.
Shares of Continental Resources Inc. fell 5.4% Tuesday after the shale company, founded by billionaire Harold Hamm, disclosed that fourth-quarter spending was almost 10% higher than analyst expectations.
Wall Street support allowed shale companies to persevere through a plunge in oil prices that began in 2014, eventually helping the U.S. surpass Saudi Arabia and Russia as the world’s largest producer of oil , with 11.9 million barrels a day in November, according to the U.S. Energy Information Administration.
Banks have provided financing when producers spend more cash than they take in from operations, something that has happened every year since 2010. They also help companies hedge their future oil production to lock in prices and avoid market volatility, and provide them with revolving loans backed by future oil and natural-gas prospects.
But in 2016, federal regulators concerned about banks’ exposure to shale drillers tightened standards for lending to oil-and-gas companies after dozens went bankrupt amid the drop in commodity prices. The U.S. Treasury Department guidelines require lenders to regard loans as troubled if a company’s total debt reaches more than 3.5 times a producer’s earnings, excluding interest, taxes and other accounting items.
There is more to this article. You can find it by clicking on the link above. It appears that the shale celebration is finally slowing down. But those in the shale cheering section still far outnumber us naysayers.
We shall see.
Another view—
“One thing that Saturday’s events showed is that most Venezuelans know their history. Because of that, they don’t need to be told: Beware of gringos bearing gifts.
“Now let’s see if this same historical sense, combined with the memory of last weekend’s collective victory, can help redirect the Bolivarian Republic to a future conceived along collective and communal lines – the way Chávez himself envisioned it.”
https://www.moonofalabama.org/2019/02/venezuela-no-the-responsibility-to-protect-does-not-apply.html#comments
Just a view from a different perspective–
One might note that Maduro is still the elected leader of the country.
I know anyone with a MSM view has a different perspective.
A different perspective on Maduro’s election
https://www.aljazeera.com/news/2018/05/venezuela-elections-maduro-election-180522054855884.html
A rather MSM objective, even from aljazeera (considered right wing, if you are in the Middle East- liberal on external views).
But, who knows?
Generally a “liberal perspective” , hence the position on Venezuela.
The Venezuelan people believe Maduro is illegitimate, a tyrant backed by gangsters and communist fanatics. Over 60 nations agree with this position, which is backed by the National Assembly, the State Prosecutor (now in exile), and the judges of the Supreme Court forced to flee in 2017 because they weren’t about to follow Maduro’s orders.
On February 23 we saw Maduro and his wife Cilia dancing salsa as his repression forces were shooting up Santa Elena de Uairen, a town inhabited by Pemones who had rebelled against the local National Guard unit keeping away the humanitarian aid convoy coming from Brazil. The next day his Vice President, Delci Rodriguez, a psychopath who stated publicly that the suffering of the Venezuelan people was her payback for the death of her father about 40 years ago, got on TV wearing a Hamas scarf, saying “they haven’t seen but a tiny fraction of what we are capable of doing”.
Yesterday the Supreme Court justices in exile issued a decision supporting the use of force by other nations to provide humanitarian aid and protect the people from the mobster hiding in Miraflores. So the question now for Venezuelans is how to proceed. I realize many communists who write here aren’t about to be swayed by rational arguments, so I’m writing this for decent readers who have common sense:
I have proposed to Venezuelan leaders that a Police Force must be recruited from the Venezuelan exile community, numbering about 20 thousand men and women, which can include military personnel who have fled in recent years (the Colombian government reported yesterday that 160 military had crossed over the border on or since Feb 23, and I’m aware that several hundred Venezuelans are young and fit US Army and Marines veterans). The emphasis is on POLICE, because this force would be heavily armed but its mission would be to escort humanitarian aid and establish law and order over rural sectors of the country where the population is suffering horribly, like Santa Elena de Uairen, San Cristobal, and other areas where almost 100% of the population is against Maduro’s rule and has suffered collective punishment.
Guaidó has the ability to pay $200 million to outfit this force, and additional funds which can be drawn from Venezuela’s state accounts and CITGO dividends. But he doesn’t have the ability to make them into a cohesive force, transport them, or give them priceless air support.
This would have to be provided by others, and the best source would be a US carrier air wing aboard the USS Abraham Lincoln. The logistics support, consisting of the delivery of tons of food, medicine, fuel, water plants, and other consumables can best be delivered to a Venezuelan port controlled by Venezuelans loyal to the Constitution and the National Assembly (Guaidó is Interim President only because he was elected National Assembly President in January 5 2019, and his power derives from this Parliament, which is free to remove him and vote for a different president).
Evidently we want to avoid US boots on the ground, therefore the initial activity to manage the first port taken by the Police would have to be manned by Colombian civilians. It would also be useful to have the Colombian military to provide two battalions of well armed troops to maintain the peace and protect the ports from saboteurs and terrorists. But that’s a bilateral issue between Venezuela and Colombia, the same way any arrangements to stage Venezuelan police forces at Boa Vista before they rescue Santa Elena and the native Pemon who rebelled against Maduro will be a bilateral issue between the two countries.
As the Venezuelan police force begins to free these small sectors of the country we would also need an IMF loan to keep buying large quantities of food, medicine, hospital equipment, camps to house medical personnel near hospitals in well protected settings, seed, agricultural equipment, live cattle, and other items needed to start rebuilding. You wouldn’t understand how much has been destroyed, looted, eaten, trampled or burned by the communists as they tried to implement their “21st Century Socialism”.
So as you can see, I believe the best option is to keep foreigners out of Venezuela as much as possible, for two reasons: I don’t think it’s a good idea for foreigners to die or get hurt when Venezuelan forces can do the job and also because this will water down the propaganda that’s already pouring heavy from the leftist community. But this will work much much better with that US Air wing providing support from a carrier, plus Predators and four AC130’s based in Colombia and at a location I can’t name.
Fernando said:
“I realize many communists who write here …”
You should probably consider crawling back in your hole dude.
Fernando – THANK YOU for your updates, wisdom and analysis on Venezuela. It is great to have a perspective from someone who has real knowledge of what is going on. Please keep these insights flowing.
We continue to pray for the people who are being oppressed and look forward to a speedy resolution to this crisis.
Snowback, you are welcome. I want to emphasize that it’s very important for the US NOT to put boots on the ground, to have Colombian and Brazilian concurrence, and to make sure there’s a mechanism to control the ground using Venezuelan forces. This means that, even though defeating the regime would be easy, the US doesn’t want to “buy” Venezuela the way it bought Iraq. This is why I’m proposing a Venezuelan police force to take small areas, stabilize them, make sure those inside the perimeter are well fed, etc. The Venezuelan Police Force can then recruit more personnel from within the liberated areas, and then hop to a different place and repeat the process. And I’m not proposing capturing oil fields. They are a mess anyway.
Fernando- “I want to emphasize that it’s very important for the US to put boots on the ground”
No thanks.
And no thanks to any move that may end up helping fascists.
I corrected it. I’m opposed to US soldiers fighting on Venezuelan soil.
Here’s a link to a tweet reporting the flow of military going over the border
https://twitter.com/andrewrosati/status/1100421051262083072?s=21
FYI for FL
Key Criminal Revelations From Former Venezuela Intelligence Chief
https://www.insightcrime.org/news/analysis/key-revelations-venezuela-intelligence-chief-maduro/
If one googles ‘Hezbollah + Cocaine’ then one perhaps comes to the realization that this Venezuela thing might be a bit of a sticky wicket if US troops get on the ground. A USA policy failure in Venezuela could be its “Suez Moment”… you know, haven’t won a war in about 25 years (not for lack of trying).
Perhaps China has a Venezuela price?
https://www.independent.co.uk/voices/trump-venezuela-china-us-military-guaido-madero-a8796266.html
USA is turning into a low-energy beta cuck, to use a phrase from the Alt-Right.
haven’t won a war in about 25 years (not for lack of trying)
It is actually quite bit longer than that—–
The author of the Independent article is in la la land, because China has negligible impact on events in Venezuela. Their UN Security Council veto is meaningless because Russia is already set on vetoing resolutions, they can’t project power, see Maduro as an incompetent bumbler who is causing them large losses, and they don’t even share ideology now that China is fascist. Marxists (Socialists and Communists) and fascists are opposed to democracy and human rights, and that’s what glues the dictatorship club together, but it’s not a strong bond, and as Hitler showed, they can easily turn on each other.
The outside agent with the largest influence on events is the Castro dictatorship. The second in importance is Colombia, because it already has 1.2 million Venezuelans who fled Maduro’s misery, and many more are coming. They also see Venezuela serving as a heaven and income source for ELN terrorists, who are now proving the peace process so admired by the left is a failure. This gives Colombia good reasons to support the use of muscle to go after Maduro.
The third influencer is US. After that comes Brazil, and maybe the EU. China doesn’t even make the top ten.
Fernando said:
So then please correct your claim that the readers here are communists. You violated the rules of this forum by spouting sickening political propaganda on a technical thread.
Paul,
Nearly everyone on this thread knows what Fernando’s political agenda is. Is there really any doubt about where he stands? I think quite a few people are interested in his opinions on Venezuela, but you have to realize where he is coming from before forming your own opinion. In regards to the actual technical discussion on oil production, I think he adds far more than most.
The question I have is what about the opening post that started this whole thread about Venezuela? Hightrekker continues to post links to some unknown blog from the “barflies in Alabama”. Who is questioning this political propaganda that is equally sickening to people who see the world differently from you? How about we check in with the opioid addicts in Tennessee or Idaho, or something equally relevant? For being the moderator of this forum you seem to be a little partial yourself in my opinion.
Maybe I don’t really care. Fernando’s not much of a scholar after all.
I wrote
“I realize many communists who write here aren’t about to be swayed by rational arguments, so I’m writing this for decent readers who have common sense:”
It should be evident that a fraction of those who comment here are communists, and a fraction thereof is so extreme that any comments I make will be dismissed. But I also believe the majority isn’t communist, nor do they have irrational and rude behavior like we see once in a while.
Regarding as to why we discuss the Venezuelan political situation, it’s probably in part because as events unfold we can conclude the country will not be producing much oil for years. The other reason may be the way it can influence US politics.
Over 500 active military service Venezuelans have crossed the border into Colombia in the last four days. I understand the regime is trying to seal the border as much as possible, but soldiers in those units are running away if they can. Another 3000 or so have gone absent and are now hiding inside Venezuela.
Fernando, Some time ago, you wrote about a friend of yours who was trying to get out. I hope they have managed to leave, and are safe.
Dclonghorn, if you read my blog, you will see a post called “Beatriz arrived in Chile”. They are now living in Santiago, and just applied for permanent resident status. Chile has a huge flow of inmigrants, including a large number of Venezuelans as well as Haitians flown in by Michelle Bachelet to create a future counterweight to the Venezuelan flow (Bachelet is a communist who just left office, was replaced by Piñera, a center right democrat, the Venezuelans will probably vote right when they become citizens, and this will give the communists a demographic disadvantage).
The large inmigrant flow jammed the government offices handling aliens, so the process has been exasperating. But they are making headway.
Fernando charged with red-baiting “peddling” on lots of science blogs today 🙂
The author of the blog post attacking me in a “science” blog which happens to be heavily laced with politics included this in his material:
https://twitter.com/nevaudit/status/874340837089566720?s=21
In other words, the blog owner, Ken Rice, allowed a committed communist to do a hatchet job on me in his “science blog”. Today a lot of science is hijacked by reds who use it to create Trojan Horses like the “New Green Deal”. And of course the economic impact of a turn of the US towards socialism peddled by marxists will have a huge impact on the world economy…and the demand for oil.
What many don’t understand is that issues such as peak oil, global warming and politics are closely tied. And that’s why the topic is discussed so much. And why the left tries to silence me. I happen to be a student of these subjects and can see how they tie together.
“a turn of the US towards socialism peddled by marxists”
Fernando,
socialism=
Police dept,
Fire dept,
Rural mail delivery,
Highways,
Social security.
Military,
Medicare,
Public schools,
National parks,
NWS,
Coast guard,
etc
You know a little about oil, but know squat about climate.
30 years ago… other people in the seats, same problems.
https://en.wikipedia.org/wiki/Caracazo
There may be a difference. The level of violent repression doesn’t seem as high as in 1989. I don’t say there is no violent repression, just that the situation is not as binary as you describe. Without a clear support of the Venezuelian army to a political side, the use of armed men and weapons to enforce a change would only end up with escalation of violence.
Out of curiosity, what do you think of the opinions of Edgardo Lander? He was a supporter of Chavez, but became critical of his politic since 2005 and is opposed to Maduro. He is also critical of the intervention of the US.
The level of violence is much higher than during the Caracazo in 1989. That event lasted two days, involved looting and chaos similar to events seen in the US such as the Watts riots, but much larger scale, and with excessive police shooting because they lacked tear gas.
The repression now is continuous, day after day, arrests, torture, murder, tear gas, destruction of property, more arrests, occasional rape, more murder, lots of wounded, more tear gas. It’s a grind.
The repression in Santa Elena involved over 100 wounded, I’m not sure how many were killed.
I don’t know Lander. The majority of the lower ranks in the military doesn’t support Maduro, but they are kept in check by a corrupt senior officer corps, and a spy network, plus there are Cuban military placed in the command chain. This is why the repression is carried out by a small group of National Guards, about 5000 National police (PNB), and the colectivos, armed motorcycle gangs.
Venezuela: US increasingly isolated as allies warn against use of military force
https://www.theguardian.com/world/2019/feb/25/venezuela-mike-pence-maduro-guaido
And this is a MSM perspective.
The US should avoid the use of military force at this time. The number of Venezuelan military crossing to Colombia since 23 Feb is up to 340.
Let’s be clear: The Cubans are calling the shots in Venezuela. This became evident when Maduro refused to follow Cabello’s plan to let the food in, and ordered the harsh repression in places like Santa Elena. The Cubans want the US bogged down in Venezuela without support from other nations, because that would help a Democrat win in 2020. They know all the Democrats have is radical candidates, the communist Sanders who spent the last 50 years drooling over the USSR and Fidel Castro, and the others would then proceed to help the Castro dictatorship, withdraw from Venezuela and that poor country would become a Castro colony they can rape at will….with US Democrats providing cover.
This is why the flow of military personnel from Venezuela has to continue for a while, and why they will eventually have to create a Venezuelan police force.
Many countries in this world want the USA bogged down in Venezuela. It’s a great place to engage the Great Satan militarily without having to play “home team”, which usually sucks even if you “win” (like in Vietnam for example)
http://tinyurl.com/y2psgevd
That’s right. I have proposed a countermeasure which I think will get rid of Maduro while avoiding US involvement other than remote air and naval support, and their goodwill with the IMF. And a few hours ago I saw a Bible quote come back in a message which implied my idea was being considered. This is really interesting, I sit here writing emails, comments on blog posts, make a few phone calls, send out tweets, and I actually seem to have a bit of influence on things.
Anarchist here…
Neither Dictatorship Nor Democracy, Our Proposal Is Conflict: Statement by Anarchists in #Venezuela
Many conceptualize the world in large part through a ‘nation-state schema’. Tragic really: Glorified open-air prisoners like those of Plato’s Cave.
Borders come and go, along with notions of WTF being Venezuelan or American mean, and in the high-energy-depletion scheme, many borders and notions will go and be forgotten.
Circa ~2250: “We are people of this lake here… just beside it. See? Look. It’s nice.”
This “Fernando” stuff is blogspam, and should be deleted.
It’s off topic for one thing. Isn’t this thread supposed to be about oil production?
It also encourages others to give off topic responses, a practice sometimes referred to as threadshitting. When you respond to a loser like this, you are distracting from the main topic of the thread, which is oil production. The only way to win this game is not to play.
Finally, it’s overlong content pasted from a crappy blog nobody reads. Basically the author(s) are hijacking this blog because nobody would read their stuff otherwise. If they were getting hits on their blog they wouldn’t resort to this obnoxious behavior.
My advice to other readers is to put this user login on ignore and not to respond to it.
Venezuela is an OPEC nation, and my comments about what goes on are intended to give the readership a better insight on how the country is being taken apart by communists.
“Beware of g****** bearing gifts.”
Do we really need to delve into racism?
CLR. Net operating loss carryforwards for years. For years to come the company will pay zero Federal, North Dakota and Oklahoma income tax.
IMO they haven’t grown enough to justify this.
See the most recent conference call for details.
Looks like a glut of condensates has developed and is getting worse.
Another thing to ponder about shale oil: falling capex, but solid production growth And that’s after three bad years (2015, 2016 and 2017) and low current prices.
Do the US shale oil producers want to establish some kind of “world record” and then “The last one out please turn off the lights.”
How can such a miracle happen?
The US oil production is really Alice in Wonderland phenomenon.
Hi Ron,
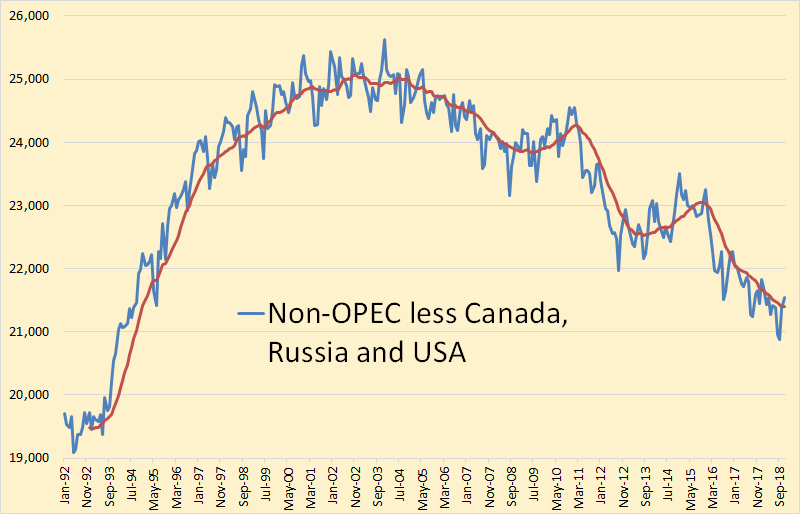
From 2003 to 2018 Non-OPEC minus US, Russia and Canada fell by about 1% per year. If we assume the decrease is linear, it has averaged about 235 kb/d each year over the past 15 years. At some point US, Russia and Canada and OPEC will not be able to make up for this decline, my guess remains 2025+/-2 World C+C output begins permanent decline, about a 68% probability it falls in the 2023-2027 range with a 16% probability it occurs before 2023 and a 16% probability it may occur in 2028 or later.
Wow! How did you arrive at those probabilities?
In November of 2018, OPEC was producing flat out. In that month they produced just over one million barrels per day less than they produced in November of 2016. OPEC is not making up for any non-OPEC decline. It is very likely that Russia+ Canada will peak within the next two years. And is very likely that Russia + Canada + OPEC will decline slightly within the next two years. Only the USA has any chance of increasing very much. It’s all up to those shale fields, fields that have a legacy decline of about 6.5 percent per month. Lot’s of luck with that one.
I don’t think that there is any doubt that non-OPEC less USA has peaked. And it is my opinion that World less USA has also peaked. It is all up to the good old US of A.
Ron,
> It is very likely that Russia+ Canada will peak within the next two years.
I agree that Russia is close to its peak. But, at the same time, Russia has a huge Arctic territory with a very low density of population (due to harsh conditions), which probably is not explored that well. Also with their gas reserves, they might be able to increase the condensate production considerably, repeating the USA path.
The other possibility is Russia sliding in chaos after Putin retirement, as there is no any politician of equal caliber able to pick up the helm among the current elite. And there will be “external helpers” like after Brezhnev’s death who will try to get some comprador at the top. Also, the leadership change historically is a huge problem in Russia.
See https://www.quora.com/What-will-happen-after-Vladimir-Putin-steps-down-or-passes-away . This Igor Markov sounds like a typical neoliberal propagandist salivating to plunder Russia the second time as Harvard mafia did in the past, but the problem does exist.
Russia is a kind of ‘A riddle wrapped up in an enigma.’ Everybody wrote Russia off in late 90th. It is difficult to make predictions about Russia.
If I remember correctly, Fernando Leanme used to work at Russia in the past, and he might share his thoughts about this issue.
What is interesting is that due to the use of natural gas in transport, Russia does not consume that much oil internally, which makes an important difference with KSA.
Increasing Russia’s Arctic production is feasible, but this will take many years, and I don’t think it can offset decline to make much of a difference. Yamal has huge gas condensate reservoirs located under the Cenomanian, but they need many more wells. I believe they can produce 1 mmbopd of condensate, but that would take 15 to 20 years.
I believe Putin is smart enough to set up a successful replacement, and the Russian elite will also be keen on a smooth transition because they think they are under attack (yes, they are convinced the USA, Germany, France and others are very keen on making them submit).
1.Russians are not very happy with Putin
2. Most Russians will support him in any circumstances. This is a principle. Otherwise, chaos.
3.95% Rosiyan has a negative attitude towards liberals, as well as to “democratic values” (this is a declaration that has no common with reality)
4.Most Russians dissatisfied with property inequality that appeared in the last 25 years
5. The greatest dissatisfaction is the destruction of industry. The lack of productive labor. (We live with the income of hydrocarbons, the country-gas station). The consequence of globalism.
Sounds reasonable. Putin would be more popular if he did little things, like being stricter giving driver’s licenses, fixing roads and intersections to reduce accidents, and putting in more real pedestrian crossings. Reducing corruption would be a huge plus, but that requires more of a free press and decent justice system, but this is contrary to the Russian soul, which relishes living in pain and writing great books about it.
Putin is unlikely to be able to change the situation
He is forced to balance between the owners of big business oligarchs, which are embedded in the system of corruption and in turn dependat power that can deprive them of their freedom for real crimes and the need to win the election, and for this you need to maintain the necessary minimum level of consumption, pensions, wages, health and other
The level of consumption in Russia does not correspond to the level of development of the productive forces. It is compensated by hydrocarbon production.
Russia is cut off from foreign markets, in the country of the current regulatory bodies (tax, environmentalists, firefighters), the rules are very complex and uncertain, they do not allow production to develop.
And more. Whom Putin will appoint as his successor, the majority will support. Although 60-80% of citizens want the system to be like in the USSR (of course within the geographical boundaries of 2019).
https://en.wikipedia.org/wiki/68%E2%80%9395%E2%80%9399.7_rule
The percentages are from a 1 sigma deviation. The real question is where the years came from.
Jay,
I assume about 3100 Gb of World C+C URR, based on my evaluation of publications by Jean Laherrrere. Steve Mohr, Richard Miller, Steven Sorrell, and the USGS.
https://royalsocietypublishing.org/doi/full/10.1098/rsta.2013.0179
This is combined with Paul Pukite’s Oil Shock Model discussed in detail in
https://www.amazon.com/Mathematical-Geoenergy-Discovery-Depletion-Geophysical/dp/1119434297
I assume 2800 Gb of Conventional C+C URR, 100 Gb of tight oil URR and 200 Gb of extra heavy URR, the extraction rate is for conventional oil only, extra heavy and tight oil are modelled separately.
The range of the peak for plus or minus 2 years is a guess as future extraction rates and rate of development of discovered resources is of course unknown.
The number of potential future paths for extraction rates, development rates, oil prices, technological developments, as well as unknown unknowns is infinite. This is but one realization of the infinite possibilities.
Russia would have declined by now without huge, fracking like CapEx in existing fields. This was from one year ago.
https://www.worldoil.com/news/2017/12/19/rosneft-board-agrees-on-samotlor-development-program
>>>
During 2016-2017 Rosneft and the Russian government have been elaborating in details additional options for the development of unique Samotlor field. As a result a joint decision was made for an investment incentive in the form of an annual mineral extraction tax reduction of RUB 35 billion during 10 years.
ThebBoard has confirmed the Company’s obligations to drill over 2,400 wells during 2018-2027 that would provide additional output in the amount of more than 50 mtoe. The extended Samotlor development program would result in an increase of tax liabilities to budgets of all administrative levels to RUB 1.7 trln. The investment incentives should give new momentum to the development of one of the largest fields in the country and bring significant multiplicative effect for Russian economy.
<<<
2,400 wells in a decade is 240 a year. This article is discussing just Samotlor.
A conventional field drilling a well more often than once every two days. Quite a bit more than that I imagine in the good time of the year with the swings in Siberian weather conditions.
That's nuts. It's also going to shark fin at some point.
Interesting, Schlumberger said during q&a in their q3 they they had a contract for 400 wells 2019-2021 for the saudis, it was ghawar and one neighbouring field to the west that i cant remember name of that all 400 wells were going into. They were also quite honest about its purpose that it was to mitigate declines.
So that makes it pretty much exactly 50% of the russian drill rate per day in samotlor you mention abowe.
I asked in previous thread why that many wells were needed if we are to believe saudis 200gb+ of world class reserves remaining. In my opinion i didn’t get any answer to that question.
Baggen,
Wells need to be drilled to develop oil resources, it really is that simple.
I have never suggested the resources are “world class”, oil is oil, some may be easier to develop and other resources perhaps less so, generally the easiest resources to develop that have been discovered are developed first.
Hi Dennis,
I understand that easiest resources will be developed first, witch ties into my second question why have they developed offshore if they say they have 200gb of reserves, i assume a majority of those 200gb is located inland.
My question wasn’t especially directed at you, im not question your expertise or such im more expressing a general question in hope of receiving some initiated opinions from knowledgeable posters on this site where i do include you among many others.
(I really appreciate your posts and effort btw)
So my “world class” was not addressed as some thing you said, it was my assumption about what saudi considers their remaining reserves officially and if their quality is on par with existing developed fields and resources.
I understand it needs to be drilled to be developed, but then it becomes a bit of the hen or the egg for me. These 400 wells in the coming 3 years would they unlock part of those 200gb assumed reserves or should they be viewed as they will add even more on top of those 200 already existing (well atleast on paper ?) reserves?
Baggen,
My understanding is that there are proved undeveloped reserves, those require new wells. Also note that we have very little information on what the ratio of developed to undeveloped reserves actually is in Saudi Arabia.
In addition the so called “proved ” reserves are likely 2P reserves in KSA.
My guess is that the developed offshore reserves are in shallow water and are relatively easy to develop, but that is a guess.
My understanding is that there are proved undeveloped reserves, those require new wells.
Dennis, I need to know just how you arrived at this understanding? It is my understanding that these are infill wells. The word “infill” implies developed, not undeveloped.
infill drilling Bold mine.
1. n. [Enhanced Oil Recovery]
The addition of wells in a field that decreases average well spacing. This practice both accelerates expected recovery and increases estimated ultimate recovery in heterogeneous reservoirs by improving the continuity between injectors and producers. As well spacing is decreased, the shifting well patterns alter the formation-fluid flow paths and increase sweep to areas where greater hydrocarbon saturations exist.
Infill drilling does increase the ultimate recovery as it gets gaps near the top of the reservoir that otherwise might be missed. But mostly it just pulls the oil out faster. That is most of the oil recovered by infill drilling is not oil that would otherwise be missed.
There are many very small undeveloped fields in Saudi. They are small and remote and are not economical to develop. The larger fields are all very well developed Ghawar, and I assume the field to the west is Khurais. Both fields are not just developed, but overly developed. They have been doing infill drilling in Ghawar for almost two decades. I assume these new Ghawar wells will be in the very southern two fields.
Ron, it’s not gaps near the top of the reservoir. We infill to establish better connection between injector and producer, and this works fine in a reservoir with horizontal layers. I would have to draw you a sketch to show you how reservoir continuity works. Somewhere around here I have a turbidide core photo which shows how it can happen in sand and shale reservoirs I used for a seminar about 30 years ago. Let me see if I can find it.
Hi Ron,
In general, most nations have both developed and undeveloped reserves, I doubt that Saudi Arabia is an exception to this general rule.
Actually, I just realized the term used by the United States is proved non-producing reserves.
The society of petroleum engineers uses the term proved undeveloped as on page below
https://www.spe.org/industry/petroleum-reserves-definitions.php
In any case, it is not clear what the distinction between “proved undeveloped” and “proved non-producing” reserves actually is precisely.
For the US at the end of 2017 41% of “proved reserves” were “non-producing proved reserves”.
My guess is that some of the proved reserves in Saudi Arabia may be classified as non-producing proved reserves.
We have very little information on Saudi reserves, so perhaps all reserves are proved producing reserves.
Perhaps a person experienced in petroleum engineering could comment.
Dennis, the comment went:
Interesting, Schlumberger said during q&a in their q3 they they had a contract for 400 wells 2019-2021 for the saudis, it was ghawar and one neighbouring field to the west that i cant remember name of that all 400 wells were going into. They were also quite honest about its purpose that it was to mitigate declines.
Ghawar, and the field to the west of Ghawar is Khurais. Both fields are 100% developed. So obviously these are infill wells.
Khurais went on line in 1963 but was never fully developed because of very low reservoir pressure. The field was re-developed in 2006 and went on line in 2009 with the aid of a massive water injection system.
There are still places in both Khurais and south Ghawar where infill drilling could mitigate decline. And that is exactly what Saudi hopes to do withthese 400 wells. As the post stated, no one is denying that. But Manifa, which came on line after Khurais, was the last, the very last, undeveloped field giant fields in Saudi Arabia.
Yes, there are a lot of small undeveloped fields in Saudi Arabia. But these fields lay in the empty quarter, deep in the sand dunes. Water would have to be piped in for water drive and pipelines laid through the dunes to get the oil out. If oil goes to $300 a barrel or better we may see some of these fields developed. But I doubt it.
Look up
“Spatial Variability in Carbonates Reservoir Quality: Case Study from the Middle Miocene Dam Formation Outcrop, Eastern Saudi Arabia”
You can read the abstract, and you will get an insight on why an infill well usually accelerates reserve recovery, and also increases reserves. Many of us visualize reservoirs as layer cakes, but reality is much worse. In most cases the rock layers lack continuity, and this leads to poor drainage and sweep.
40 years ago I was taught why a pattern flood was much better than a peripheral flood for optimum recovery, and we studied field performance in cases where the field had been infilled and sweep had improved a lot. Today we understand and model this much better, and it’s likely Saudi reserves include undeveloped oil found in areas they already developed, which eventually will be “infilled” and converted to a tight pattern flood. They may even be including enhanced recovery from CO2 and ethane injection, polymers, soaps, etc. They don’t have to follow SEC guidance, therefore their numbers can be much higher than a company selling stock or bonds in the US can use.
They may even be including enhanced recovery from CO2 and ethane injection, polymers, soaps, etc.
Of course they will. They already have. This headline is from four years ago:
Saudi Aramco testing C02 to get more oil from giant Ghawar field
KUWAIT (Bloomberg) — Saudi Arabian Oil Co. started injecting carbon dioxide to try and boost extraction rates from the world’s biggest oil field as the company steps up plans to recover more crude from its deposits.
Saudi Aramco, as the company is known, already started injection and will put 40 million cubic ft of CO2 into the Uthmaniyah area south of the Ghawar field, it said Thursday in an Arabic statement on its website. About 40% of what’s injected will be stored in the field.
“The project aims to enhance oil recovery beyond the more common method of water flooding, and is the largest of its kind in the Middle East,” it said. The project is part of the company’s efforts to reducing domestic carbon emissions and meeting environmental goals, it said.
Saudi is trying every way possible to mitigate the steep decline in Ghawar. Of course they say they don’t really need to do that. It is all because they are very enviromentally conscious. And if you really believe that????
From what I understand it was also stated by Schlumberger that they are in-fill (infill?) wells… Just sticking more straws in an almost empty bucket. It seems to me that that will bring forward future production(to sustain a plateau) and the eventual decline rate in the future will necessarily be steeper, like a bell curve vs a Seneca Cliff type curve.
I would suggest infill drilling is a good indicator of what KSA feels it’s oil development priorities are. One could make an assumption about why they feel that way. I assume it’s because they don’t have anything better to do with the drilling rigs.
Yes it was stated they were infill wells and i dont know if it was a slip but from memory MD? Also said purpose was to mitigate decline rates.
“I would suggest infill drilling is a good indicator of what KSA feels it’s oil development priorities are. One could make an assumption about why they feel that way. I assume it’s because they don’t have anything better to do with the drilling rigs.”
Could be.
Could also be that they’re looking at the opportunity cost involved with having that money in hand to invest, or stash in secret accounts or London real estate, compared to leaving the oil in the ground to sell it later.
If oil goes up five percent annually, and the stock market goes up eight percent, they would be better off with the money in the stock market.
They need cash, they have an ENORMOUS welfare state to support to keep the priests happy, and the rulers may believe it’s time to stash every thing possible outside the country, against the day they are beheaded unless they flee.
They may actually believe people like Tony Seba, who believe that electric vehicles will become so numerous that the market for oil crashes, in which case it would be better to sell all they can now, rather than later.
Any combination of these and other factors could be in play, between the ears of the Saudi royal family.
That’s not a big deal. 40 years ago I worked in an operation which produced 50,000 BOPD. We had about 800 wells and drilled and completed 50 per year to offset decline, and we also abandoned or converted to injection about 40 wells off the existing producer stock. I believe the staff had about 15 engineers, five geologists, one geophysicist. This included the civil and mechanical staff doing the surface stuff. Later it was decided to raise production to 80,000 BOPD, which required 150 wells per year, as we started developing poor areas. But the business was viable, and some years it made a ton of money.
Hi Ron,
The probabilities are subjective. Just putting a number to what I think the odds are.
As oil prices increase things may change a bit on oil output. My estimate assumes that oil prices will increase at least the 12 month average price over the period from 2019 to 2031, if there is no severe World Depression in 2030-2035 (I think the odd are less than 1 in 3 that this will not be the case) oil prices might continue to increase until either there is a Depression or EVs and Transportation as a Service start to reduce demand for oil (not likely to make a dent until 2035).
I think the peak in US tight oil will probably coincide with the World peak in output and believe this will occur in 2025.
Ron, what is your opinion on Saudi Arabia? A I have said here before, I think that the Ghawar could water out at any time, reducing Saudi output by somewhere in the region of 3 mbpd in short order. It could happen tomorrow, next week, next year, who (outside of Aramco) knows?
Islandboy, Ghawar is not one field, it is five fields. From north to south there is Ain Dar, Shedgum, Uthmaniyah, Hawiyah and Haradh. Ghawar was developed from north to south.
Ghawar Oil Field
Ghawar is currently estimated to account for about six percent of the world’s total daily crude oil output. The field’s production peaked at 5.7million barrels per day in 1981 and later slipped below the five million mark. The development of the southern Hawiyah and Haradh areas during 1994 and 1996, however, raised the production to five million barrels per day again.
Ain Dar, Shedgum, and Uthmaniyah are all in decline and likely in steep decline. Hawiyah and Haradh likely have not yet peaked. However, it is production from Khurais and Manifa and Shaybah that is keeping the decline in Saudi production from becoming obvious. All other fields, other than the bottom two Ghawar fields, and these three latest developed fields, are in steep decline.
Khurais and Manifa were in mothballs for decades. Then they were brought on line, at great expense, to counter the decline in all the other super-giant fields. But the decline in these old super-giants is getting steeper.
Ron,
Weren’t they also brought online before original intended schedule?
Remember i red it somewhere perhaps it was from you.
No, you did not hear it from me. I have no idea if they were brought on line before schedule. But everything that is happening in the Saudi oil patch these days is to mitigate decline.
Their decline rates are increasing so lots of new infill wells are necessary. These infill wells slows the decline rate but increases the depletion rate. So the production profile of the field will not be a bell curve but a curve that has a very slow decline until it doesn’t. And that “doesn’t” seems to have arrived in most Saudi fields.
https://www.google.com/amp/s/mobile.reuters.com/article/amp/idUSKCN1QB1Y2
Thanks.
Interesting, New, Informative
article
Alexey Evgenievich Anpilogov
(Алексей Евгеньевич Анпилогов):
http://zavtra.ru/blogs/novie_tyomnie_veka?fbclid=IwAR2s559y2EhRioWaBUv4X-YW8AzbQFdK1bzvAE1pFzxUHNdFGmpXnKzkm3A
Start:
New “Dark Ages”?
human energy future
Alexey Anpilogov
In the third decade of the XXI century, which is about to come, one of the main problems facing humanity, again, as in the 60s, will be its energy supply, as well as the search for the main “energy carrier of the future.”
The three whales that the world’s energy industry today holds: oil, natural gas and coal are, by their nature, non-renewable sources of energy. True, with regard to oil and gas, this thesis is actively debated at the academic level, but for practical purposes it is indisputable: modern civilization consumes so much hydrocarbons that their natural substitution, if it exists, is not able to compensate for this exemption. The energy sources mentioned above in 2017 accounted for about 81% of world primary energy production, and they still define the image of our modern industrial world, while all renewable energy sources provide only about 14% of primary energy production, and about 5% The balance comes from nuclear energy (International Energy Agency, 2017).
At the same time, the situation with renewable sources is not at all as rosy as it may seem at first glance: out of 14% of renewable sources, 10% is the energy from burning wood and biomass, and 2.5% is hydropower. At the same time, the “fashionable” in the last decade, and having received at the same time gigantic, almost trillion-dollar investments in solar and wind energy projects, are not as high as 2% in the overall balance of the production of primary energy. At the same time, it is not even about the absolute figures for the introduction of new capacities of green energy, which may seem impressive, but about the exponential dynamics of the relationship between “oil-coal-gas” and “green” in the long term. After all, a decade ago, in 2008, the world balance of power generation looked like this: 78% were oil, natural gas and coal, 5% were atomic energy, 3% were hydropower, about 13.5% were wood and biomass, and 0, 5% produced wind and solar energy. Surprisingly, over the past ten years, the transition from “wood and straw” to the energy of oil, natural gas and coal, which occurred naturally, turned out to be two and a half times more significant for the global energy balance than the development of “green” energy technologies.
The phenomenon of such meager growth of “green” energy is interesting in itself: for the first time the capitalist mode of production, in which investments in fixed assets imply quick returns in the form of profits, gives an obvious, albeit programmed failure. Its essence becomes clear if we take into account in the picture the “quiet” transition of the world from “firewood and straw” to oil, gas and coal, which lasted throughout the decade of 2008–2018. This process, which no one financed in a targeted manner or advertised in the world media or Western scientific publications, went forward thanks to economic expediency. At the same time, the planting of green energy was accompanied not only by a powerful public relations campaign and trillions of financing, but also forced almost all countries to accept special, non-economic overpriced tariffs for the purchase of green energy in order to somehow force capital to finance unprofitable production. energy with wind turbines and solar panels.
World energy: a general view
Several reputable organizations are engaged in the problem of the global energy balance. These include the United States Department of Energy (DOE), the International Energy Agency (IEA), located in Paris, and the well-known oil company BP (ex-British Petroleum). Each of these organizations publishes annual reports on the situation in the global energy industry and the prospects for its development. These reports are compiled on the basis of an analysis of the mass of primary information, often of an incomplete and contradictory nature. Nevertheless, due to a certain averaging of all the initial data, the annual reports of these organizations quite fully and clearly reflect the overall world dynamics. In this article, in order to bring the data to one standard, we will rely on the annual reports of BP, unless otherwise explicitly stated in the text.
In accordance with the latest available BP report, global energy consumption reached 13,511 million tons of oil equivalent in 2017 (TNE, eng. “Tonne of oil equivalent”, TOE). At the same time, over the decade between 2007 and 2017, world primary energy consumption grew by an average of 1.5%. That is, the dynamics of energy consumption correlate well with the observed growth rates of the global economy over the same period – an average of 3.2% per year (World Bank and IMF, 2018).
The fluctuations of this second parameter, associated with economic crises and recessions observed in the period under review, make it possible to evaluate the contribution of the notorious “energy efficiency” to the global growth in demand
“this thesis is actively debated at the academic level”.
What does that hint to? Abiotic oil?
No, there does not even remotely a hint of abiotic oil. Read the last two paragraphs again. That is what it hints to. An average growth of 1.5% in energy consumption and a growth of 3.2% in the global economy has been enabled by a continual growth in energy efficiency. This cannot possibly continue, especially the 3.2% growth in global economy. When the global economy does not grow it receeds. This is called a recession.
Ron,
World Real GDP per capita has been growing steadily from 1971-2017, at some point this may slow down, it is not clear when this begins, perhaps in 2030.
https://fred.stlouisfed.org/series/NYGDPPCAPKDWLD#0
Data from
https://fred.stlouisfed.org/series/NYGDPPCAPKDWLD#0
Charting least squares fit on natural log of World Real GDP per capita in 2010 US$ gives average growth rate in World real GDP per capita (constant 2010 US$) from 1971 to 2017 of 1.45% per year. R squared is 99%.
from what I recall the global debt to GDP ratio is about 320% in Q4 2018. GDP growth will cease when debt expansion ceases (FWIW I suspect widely acknowledged peak oil in the rear view mirror, so to speak, will likely play a role in the realization that event)
https://blogs.imf.org/2019/01/02/new-data-on-global-debt/
In 2008 the size of the US economy was $14.5 trillion. A decade later, the size of the economy is $19.7 trillion, so about 36% greater.
Over the same ten years the national debt has grown from $9.4 trillion to over $21 trillion- about 123% greater.
It’s hard to pretend that’s not a problem, but people still do try.
Interestingly enough….
Census Bureau, Treasury, EIA Detail American Insolvency
“And comparing the US primary energy consumption versus the Wilshire 5000 (representing the value of all publicly traded US equity), a funny thing shows up. Flat to declining energy consumption vs. surging asset valuations…this is typically understood as a red flag for phony wealth creation via market manipulation, monetization, and banana republic central banking.”
https://econimica.blogspot.com/2019/02/census-bureau-treasury-eia-detail.html
Phony wealth creation is synonymous with phony GDP.
Survivalist,
Took a quick look at the IMF blog, not sure where 320% comes from, from the IMF:
Global debt has reached an all-time high of $184 trillion in nominal terms, the equivalent of 225 percent of GDP in 2017.
Data from Bank for International Settlements (BIS) at link below
https://www.bis.org/statistics/totcredit.htm?m=6%7C380%7C669
Latest data through 2nd quarter of 2018 has Global credit to non-financial sector at 233.7%, it was 192.7% in the first quarter of 2002 (earliest data point from years with a full 4 quarters of data).
To look at the rate of increase I took the natural log of the debt to GDP ratio to the non-financial sector for all reporting nations, then fit a least squares regression to the entire data set. The average rate of increase in Debt to GDP ratio has been 1% per year.
Real GDP is measured in real goods and services adjusted for inflation.
The measure is far from perfect as unequal income and wealth distribution is not taken into account, also health care services, freedom of choice and many other factors are not taken into account.
There are no perfect statistics, especially in the social sciences, though it is a problem everywhere.
320% comes from IIF in January 15, 2019, sorry Dennis- wrong link
https://www.iif.com/Research/Capital-Flows-and-Debt/Global-Debt-Monitor
According to same Global Debt was 244 Trillion … 318%
Survivalist,
Not a member so I cannot read the report. Two respected organizations give a very different estimate. Generally financial debt is ignored. This bank to bank lending does little to affect the real economy. It is borrowing by private households, businesses, and governments that matters.
Dennis doesn’t believe debt is bad.
Debt, per se, is not bad. Debt is necessary in a growing capatilist society. Without debt, very new homes or automobiles or a lot of other stuff would be sold.
Saying “debt is bad” is like saying “people are bad”. Some people are definitely bad but most are not. Ditto for debt. Some debt, like debt you cannot pay back, is bad. Too much national debt is bad because it causes a high inflation rate. But there is nothing wrong with most debt.
Ron Wrote:
“Debt, per se, is not bad. Debt is necessary in a growing capatilist society. Without debt, very new homes or automobiles or a lot of other stuff would be sold.”
before the 1970’s people paid cash for cars. Now everyone needs a an auto-loan. People that could not afford a new car got a used car. Issue is that Auto loan durations keep going up. Auto-loan durations are now exceeding the operational life of the car. Debt from the old car is rolled over into the new car when purchased. I think we are getting close to the end when most people can afford cars.
Today home buyers don’t need to put any money down to buy a home. Up until about the early 1990’s buyers had to put 20% down. Meaning they have the means and will power to save money & live within their means.
I think most debt is bad. Most people use debt for instant gratification. People are spending well beyond there means and its going to bite back. There are people who are facing retirement, still paying off student loans, mortgages as car loans and have zip saved for retirement. I cannot see how any of this will be good.
SS runs out of money in 2034 (In the very best case). Mostly it will run dry in the mid to late 2020’s and most of the boomers that delayed retirement are forced into retire do to health issues.
My Guess the crap starts hitting the fan in the mid to late 2020s. Some time between 2022 & 2024 it will take every tax dollar just to pay for entitlements, pensions, Interest on the debt & welfare.
“Too much national debt is bad because it causes a high inflation rate”
I don’t see that happen. I see the US and the rest of the world just monertize the debt. Really the USA is the only major nation that isn’t doing QE at the moment. Japan, EU, China, India, etc are all still doing QE since the started more than a decade ago (Japan has been doing QE for more than 25 years). Central Banks will just continue to prop up asset prices, and suppress interest rates from ever rising. US interest rates peaked late last year and likely will fall or remain flat for the next decade or more via Central bank control. No way can the US afford Treasure rates to go up since it would force the US to default on its debt. Its already paying about $400B in Interest. If the rates doubled so would the interest payments.
All that is needed is a for the global economy to breach its tipping point. Perhaps its a decline in Oil production, or some major nature disaster. The global economy is dangling by one arm over an economic precipus.
“SS runs out of money in 2034 (In the very best case). Mostly it will run dry in the mid to late 2020’s and most of the boomers that delayed retirement are forced into retire do to health issues.”
The USA federal government is broke, busted, by any sort of honest accounting, because most of the money that has been promised, as future spending, is OFF THE BOOKS.
The SS trust fund is nothing more than a bookkeeping smoke and mirror trick. There’s no money in it, there’s no third party trustee making sure it’s honest, Uncle Sam is playing all roles. In a REAL trustee situation, one party is paying, a second party is receiving, and THIRD party is playing the role of administrator. The administrator puts the money in trust into something safe( assuming there IS such a thing, lol) and disburses it according to established terms of the trust.
Uncle Sam is running in the hole, and the money in the SS fund is a figment of the imagination, because it is entirely dependent on future tax collections. It’s not held in the hands of a third party waiting for it to be collected, in a real trust, it would BE THERE, not WAITING on it. I’m painting fast with a broad brush, please understand that.
So called monetization of debt can as far as I can see, kick the can down the road, but ultimately…….. government must be able to collect enough revenue to cover it’s promised spending, and that can ONLY happen in a real world situation where the economy is still growing, because the amount of spending that has ALREADY been promised, but OFF the official debt, cannot POSSIBLY be paid, unless the economy is expanding at a rapid rate.
Who believes the man and woman with two kids will be able to enjoy social security, medicare, etc, on the taxes that can be paid by their own two kids?
A typical retiree is now supported to the tune of well over 20,000 bucks annually via SS and Medicare alone. So one parent, onepointone kid, the kid pays 20,000 JUST to cover Mom’s or Dad’s SS and Medicare ? How much MORE to cover everything else?
And lets not talk any bullshit about the taxes business pays. I’ve BEEN in business all my life, and I PASS ALONG my taxes to my customers. The vast majority of all taxes are ultimately paid by consumers. The guy who shows up and cuts your grass for thirty bucks, cash, can do that only because he’s not paying any income tax on that thirty bucks. The guy who takes your check to the bank and puts it into his account necessarily charges forty bucks. YOU THE CONSUMER pay that ten dollar difference.
Money is indispensable because it enables trade and commerce to be carried on efficiently, and it’s a super duper way of keeping track of obligations, who owns what, who owes who what, etc.
But it is not in and of itself anything that actually produces food or clothing or shelter or OIL. The early commies DID know a few things.
At some point, possibly within our own personal lifetimes, a shit load of debt is going to go belly up. The question is this, WHO will get paid, and who WON’T? SOMEBODY , a lot of somebodies, are going to lose their collective ass.
There is a flip side . Generations to come are going to inherit a world with built infrastructure that will mostly last, and all the knowledge and technology so far accumulated and invented. That will help enormously in terms of offsetting their tax burden.
Looks like the House is looking to put in a SS fix.
“House Democrats have proposed a bill that, if passed, would extend the payroll tax to earnings above $400,000 as a way to keep the Social Security fund solvent for at least 75 additional years, according to CNBC. Currently, there is an earnings cap of $132,900; any income above this level is not subject to Social Security tax. The proposed legislation would leave income between $132,900 and $400,000 untaxed but reinstate the payroll tax for income above $400,000. Beyond this, it would also increase the payroll tax generally to 7.4 percent by 2043, up from 6.2 percent currently. “
Raising the cap to 400K won’t fix the problem since so few people make above the current cap of $132K. I am sure they will do the following in the early 2020’s:
1. Start raising the retirement age. This has been the plan since the 1980’s but they won’t do it until they have to.
2. Start increasing taxes for the working class. They likely target Medicare since it already runs about $500B in the red every year and the current Medicare tax is 1.45 * 2. There is no cap on the Medicare tax.
The only reason SS hasn’t need major changes yet, is because older boomers have been delaying retirement having gotten wiped out in the Stock & housing bubbles and getting next to ZIP on CD’s and other Bond investments. However, health issues & perhaps layoffs when the next recession hits will push them into retirement.
I bought my first car in the 1960’s when I was 17, put $500 down and got me a bank loan for $1200. As far as I know people with good credit rating could borrow money and did it. I remember my mom bought a bed on credit at Sears, and later I bought my first color TV on credit to watch the Super Bowl.
Whether or not debt is good or bad is a normative statement, it’s a value judgment.
I’m interested in positive statements- like; the debt is large and much of it will perhaps be defaulted on.
Not saying he is wrong. But from the dialogues we had it seems that articles like this:
https://www.zerohedge.com/news/2017-01-04/global-debt-hits-325-world-gdp-rises-record-217-trillion
Doesn’t worry him much. Or is not a big issue.
Iron Mike,
Incorrect.
Dennis does not believe in absolutes.
The disagreement is how much debt is too much.
Do you own a home? If so, did you pay cash?
I would rather own my home than rent and pay someone else’s mortgage, without debt that would not have been possible.
I think that too much debt is bad, I think too little debt (as in the Great financial crisis when credit markets fell apart) is worse.
Do you believe there should be no debt?
Generally GDP is considered roughly the equivalent of national income in economics.
Mortgage lenders generally consider a debt to income ratio of 3 to 1 as a “safe” level. The same rule could likely be applied to World debt to GDP levels, more than 300% is a problem. At 234% debt to GDP, the World is fine, though lower debt would probably be better, maybe 190 to 200% debt to GDP for the World.
Japan has been over 300% debt to GDP for over 15 years, notn great for their economy, but their main problem is an aging population structure.
Thanks Dennis,
I think with regards to the economic system. Necessities like housing shouldn’t be subjected to speculation. The government should be able to lend out money for housing and other necessities debt free. Luxury items can be debt based. To be perfectly honest, i am out of my depth. But from my limited point of view, the whole global economic system seems to be nothing but a ponzi scheme on a gigantic proportion.
Iron Mike,
My preference is for government involvement in the economy to be minimized.
A properly regulated free market system is efficient and tends to maximize choices by individual families.
People should be able to risk their savings as they see fit.
Perhaps it is different where you live, but generally in the US the government doesn’t choose your home and only the very wealthy tend to own homes without using debt to purchase. One exception would be homes that are inherited.
Most people don’t have that luxury.
Dennis Wrote:
“Do you own a home? If so, did you pay cash?”
Yes.
Dennis Wrote:
“I would rather own my home than rent and pay someone else’s mortgage, without debt that would not have been possible.”
Your still renting: Interest payments + Property Taxes. Stop paying you property taxes to see who really owns your property.
These days most people don’t even bother with a down payment. They are really just renters with a buy option, especially those with interest only mortgage payments. Yes banks are *Still* issue interest only mortgages.
“Japan has been over 300% debt to GDP for over 15 years.their main problem is an aging population structure.”
Japan’s debt is the cause of their demographics problem. When the debt got out of hand and the cost of living soared, the Japanese stopped having kids. Same is true in Europe and the USA. Only the very poor are having Children in the USA or Western Europe. In Japan not even the Poor are having Children.
Dennis Wrote:
“I think too little debt (as in the Great financial crisis when credit markets fell apart) is worse.”
Too much debt was the reason for the Great financial crisis. it was so bad that the bottom the credit markets collapse. It wasn’t until Central banks stepped into to pump trillions into the credit markets. Now the West is trapped like Japan in a Asset bubble or everything Bubble. CB cannot sell off there assets, nor can they ever raise interest rates without triggering a deflationation collapse. Probably with in the next 12 to 24 months the Fed will restart QE again. They have too as the Credit markets are once again drying up. Home sales & Auto sales are declining as borrowers are cutting back on new loans.
Techguy,
That’s great that you can afford to pay cash for a home, most people cannot.
Debt is not a bad thing, too much debt is.
Basically debt to income under 250% can usually be handled easily. The world is slightly under that level according to the Bank for International Settlements (the so-called Central Banker’s bank).
Dennis Wrote:
“Basically debt to income under 250% can
usually be handled easily”
LOL! Try than when Interest rates are at 12% to 14% as they were back in the late 1970’s and early 1980’s!
Debt is completely out of control, Cheap & easy credit is driving up asset prices and driving everyone into bankruptcy. From student loans, auto loans that are in Mortgage amounts, and astronomically housing costs (Rent or mortgage) These days people are paying about 29% of their gross income on housing costs. If I recall correctly people now spend about 10% to 12% of their gross income on car payments. At this point people no longer have the means to save for retirement. 78% of all American workers live paycheck to paycheck.
Again Please explain why debt is a good thing?
>In 2008 the size of the US economy was $14.5 trillion. A decade later, the size of the economy is $19.7 trillion, so about 36% greater.
Over the same ten years the national debt has grown from $9.4 trillion to over $21 trillion- about 123% greater.
You are confusing debt with national debt. Most debt is private, not public. National debt has no influence on oil production.
Is a slow recession a tragedy, with chaos necessarily baked into the equation?
If we are lucky, that will be the global challenge.
If not so lucky, recession will be depression.
Some places more than others, of course.
Russia may be be looking more solid than most in the 2030’s.
Western Europe, not so good.
Hickory,
I imagine growth rates will slow as the World economy becomes more developed (wealthier), just as has occurred in the OECD. Also population growth is likely to slow down over time. It is possible that after a population peak has been reached and started to decline at more than 1.4% per year (perhaps by 2100 to 2150) that World real GDP will decline while per capita GDP continues to increase, though in my view it would be better to reduce the growth rate in GDP for environmental reasons. Many would not agree.
I also think wealth redistribution through highly progressive income taxes and a substantial wealth tax with all loopholes removed is good public policy, and again many or probably most would disagree.
Overall, I was referring to the conditions that will likely ensue after peak fossil.
As very well stated in the post by Opritov Alexander above (and by Ron so many times), the hurdles to replace fossil energy are insurmountable, by and large.
As you have pointed out before, there is a big risk for economic contraction around the time of peal oil.
I expect it to be severe in degree, especially among countries that are elderly, heavily indebted, and heavily dependent on imported energy. And many of these places are your trading partners, no matter what country you hail from.
Indebtedness is not just a transitory or ‘paper’ issue, IMHO. The cost to attempt transition to non-fossil energy will be huge (beyond huge). How do you buy a second home (renewable energy on a countrywide basis), when you are already maxed out on your credit for the 30 yr loan on your current one (maintenance of your current economic activity and dependents)?
As a slight aside, GDP is not very useful when determining the wealth of a country, since it includes frivolous activity that will evaporate in tough times. Financial transactions, hair dressers, restaurants, sports and music entertainment, weddings, luxury items such as fancy cars, boats and fashion, advertising , are examples of GDP components that can evaporate almost immediately when the times get tough and the velocity of money heads towards zero.
GDP considers natural disasters like earthquakes, floods, tsunamis and hurricanes as being favorable to the economy. Add to this the fact that these disasters are hated by the common people who rightly pray that this destruction happens as seldom as possible. Once again, due to the poor fundamentals of the GDP system, the entire science of economics is branded as being anti social. Once again, the true economic fundamentals are not being considered or else the question of economics being an anti-social science does not arise. In this article we will first consider the prevalent viewpoint and then we will debunk the myths pertaining to it.
https://www.managementstudyguide.com/gdp-and-natural-disasters.htm
When a metric values natural disasters as favorable to the economy then you know somethings being missed. I would suggest that repairing after a storm is not growth. GDP makes no distinction between Construction and Reconstruction.
Burn Your House, Boost the Economy
Why GDP is a Flawed Measurement
https://fee.org/articles/burn-your-house-boost-the-economy/
“… GDP is more accurate than GDB since the GDP is linked to the work done to produce a larger interface between civilization and its sources of energy and matter. It’s the interface size that is linked most directly to burning, less so growth of the interface… sustaining home value requires constant burning by civilization.” ~ Tim Garrett
http://nephologue.blogspot.com/2018/09/on-origins-of-economic-wealth.html?showComment=1536674737631#c4191973140713430153
GDB got started here I think
https://un-denial.com/2018/02/08/on-burning-carbon/
Nate Hagens started the idea of GDB, as your link explains.
Jesus H. That is one incredible rant.
Hickory,
If there is a depression many debts will be defaulted on.
So while you are correct that income will decrease, debt will also decrease.
Most of the money is owed to the wealthy so the debt defaults will essentially be a flow of wealth from rich to poor.
The fossil fuel will not cease to be produced overnight. As supply becomes short prices will rise and scarce resources will be put to their most important uses. The high prices also create opportunities for EV producers, solar PV, wind, heat pumps, HVDC transmission, light rail, electrified rail, efficiency improvements in existing buildings and new construction.
A severe depression caused by peak fossil fuels could also lead to a Green New Deal where governments facilitate and accelerate the transition away from fossil fuels.
Imagine a WW2 type effort where the battle was not against the Axis, but against climate chaos.
The nation state has a lot of power to do both harm and good, perhaps many nations will choose the latter.
It is a choice we have to make.
1848 — England: In London, 29-year-old Karl Marx publishes The Communist Manifesto.
Yes indeed, true, read too quickly ..
“The phenomenon of such meager growth of “green” energy is interesting in itself:”
I find this characterisation of “green” energy growth as meagre interesting. All the regulars here should know that I have a particular focus on alternatives to a FF based economy, with an emphasis on battery powered vehicles and solar PV. Solar energy produced less than one hundredth of one percent (<0.01%) of world electricity in 2007 or thereabouts. By 2017 this percentage had climbed to somewhere in the region of one percent and currently is approaching two percent, so one hundred fold in ten years and looking to double in another two. This is meager growth? To put this in perspective, if this growth were to continue at a similar rate for the next ten years, the implication is that all electricity would be coming from solar.
Of course that proposition is ridiculous since we all know that continued exponential growth in a finite physical system is impossible. The question is, when will the growth in solar capacity go linear and finally start to taper off? If we were to trust the projections of the usual suspects, the EIA, IEA and BP among them, this has already happened but reality tells quite a different story. Auke Hoekstra, a senior advisor smart mobility at the Eindhoven University of Technology in the Netherlands has a graphic pinned at the top off his Twitter feed that tracks the projections for global solar capacity installations, from the IEA’s World Energy Outlook, against the actual capacity installations going back to about the year 2000. As seen from the resized graphic below, the IEA’s track record of forecasts for solar PV growth are shockingly bad! Their methodology seems to be, forecast flat to declining capacity additions every year and hope that one day the reality matches their forecast!
If this is the guidance that continues to be given to the FF industries, it could end up being very costly for them. If one does not believe that renewables (and EVs) can have an impact on fuel consumption in the foreseeable future , one will tend to make investment with long term horizons that end up being blindsided by developments that should have been foreseen.
In my neck of the woods, the local electricity utility, with a peak demand of about 650 MW, is on track to commission a brand new 190 MW CCGT supplied by LNG outfit New Fortress Energy. The plant is close to completion and the floating regasification vessel is already in place so, I would imagine they are very close to carrying out tests of the fuel delivery and possibly plant operation. In August 2017 the utility singed a PPA with New Fortress South Power Holdings Limited, which is constructing a 94MW power plant, scheduled for completion by February 2020, on the grounds of a bauxite to alumina plant less than nine miles due east of the new 190 MW plant. I was unable to find any sources for details of the PPA
In May 2016 an outfit won a bid to supply 37 MW of PV power at US 8.5 cents/kWhr for twenty years. Between the winning of the bid and the start of construction it was agreed for the capacity of the facility was increased to 50 MW. This project is under construction and scheduled to start delivering power to the grid before the middle of this year. I suspect the the price of electricity under the PPA for the solar plant is lower than that from the NG plants with the disadvantage that the output will vary with the sunlight the plant receives, while the NG plants can be called upon at any time.
Going forward, the price of PV technology can be expected to continue to fall and one wonders, if a bid were opened for additional supplies to the grid from renewable sources today, what would the bid price be? What about two years down the road or five or ten? In addition, adding grid scale (MW) battery storage to the grid is looking like an increasingly competitive option and if one factors in the fact that individual consumers, from households, to institutions, commercial premises and industrial facilities, all have the option of adding PV (and batteries), the outlook for the existing FF powered electricity generators, going past about five years into the future, is not altogether very good. This is just in my little corner of the world.
missing graphic from post above.
The IEA has quit this kind of prediction. Here is a current one:
https://www.iea.org/tcep/power/renewables/solar/
https://en.wikipedia.org/wiki/Growth_of_photovoltaics
Keep in mind that world electricity consumption is currently about 21-22% of total energy consumption.
Transport makes up another 25% or so. That is why I’m interested in battery electric vehicles. Eventually the vast majority of vehicles will have to be battery powered or just something other than petroleum based fuels. My hope is that the good people in the oil patch can keep things going long enough for the transition to get started in earnest.
I did an exercise once in which I calculated that, for a particular year, it would required less than 20% of the electricity produced in that year to power an all electric, light vehicle fleet in the US. If renewables were to grow fast enough to dominate the US electricity markets by say 2030, dealing with the additional demand from EVs should not be an intractable problem.
@islandboy 02/26/2019 at 3:39 pm
We need to try to see a bigger picture. EV does not exists in vacuum. They need infrastructure such as lithium battery producing plants, charging stations, and more powerful electrical grid (in case they reach substantial proportion of private cars)
We also need to understand that that the energy needed to create a car lithium battery is close to energy required to driving a medium size diesel for over 8 years (which might last 20 years or more with proper maintenance — even Prius can last over 10 years and 200K miles). If this is not an exaggeration, than this is as close to a death sentence for EV vehicles as one can get from “saving energy” standpoint.
Precise economic calculations does not favor EV. Looks what is happening with the demand for Tesla cars. It’s not pretty. Despite all hoopla, they were forced to lower prices to sustain the demand.
The largest part of electricity produced in the USA now is produced using natural gas, so in this sense pushing electrical cars in the USA without pushing nuclear power plants is a very stupid idea. But it is a good idea for France.
But nuclear power plants have their set of dangers and problems, as we know from Fukushima.
In does not make much sense to waste 30% or more of natural gas this way, in comparison with using nat gas for transportation directly. So this is not a progress, this is a regress.
So things are more complex then they looks but IMHO currently economics does not favor electrical cars too much, in comparison with alternative. Although large scale experiments like Tesla are necessary and make sense as they prepare us for a very uncertain futures and we need to keep all options on the table.
But again the fact that nothing is done in the USA to stimulate usage of cars on natural gas is a sign of stupidity and regress, not a sign of progress.
Please remember that the road to hell is paved with good intentions. That actually should be tattooed on Elon Musk forehead ;-).
likbez- watch China, rather than Tesla. They are ahead of the trend on this, and are reaping the economic benefits of the early transition.
Somewhat aside, I doubt that Russia and other big exporters will have any trouble selling all the fossil fuel they want over the next two decades, assuming the price is affordable- I don’t know that price level, but its a lot higher than now considering the value of the product.
Beyond two decades, I’ll refrain from going further out on the limb.
Hickory
China has terrible pollution and is killing thousands every week, a human tragedy and a massive financial one.
The pollution is also destroying untold amounts of food.
https://www.scmp.com/news/china/science/article/2166542/air-pollution-killing-1-million-people-and-costing-chinese
Some economic benefit
t the energy needed to create a car lithium battery is close to energy required to driving a medium size diesel for over 8 years
That’s way too high. What’s your source?
Let’s assume that cost of the battery is $12K ( https://forums.tesla.com/forum/forums/tesla-model-s-85kw-battery-replacement-cost ) which is probably too low (some cite the price $45K for 85KW battery). Other assume that it is 50% of the price of the car.
Assuming the cost of diesel $3.3/gallon you can buy 3.6K gallons of diesel for this price.
Assuming 40 miles per gallon you will get 145K miles (https://www.edmunds.com/car-reviews/top-10/10-best-gas-and-diesel-cars-that-get-40-mpg-on-the-highway.html)
Some drivers claim much higher figures for WV Golf diesel (up to 50 MPG on highway). For example:
Assuming 12K miles per year you get 12 years.
So 8 years is not unreasonable and probably is too low (sorry I can’t find the academic reference I used right now)
BTW replacement cost of the battery for Leaf is around $5.5K and even for Leaf you get something like 6 years.
Well, that’s a financial ROI analysis, not an energy EROEI analysis.
If you look at a factory, whether it’s making cars, or making batteries (or other parts), you’ll find that only roughly 5% of the cost is the energy inputs: diesel, NG, electricity, etc.
Additional it is much more easy to make this CO2 neutral – put the battery plant beneath a solar / wind far, a hydro plant (Sweden) or even an atomic reactor.
Much more difficult to make Diesel CO2 neutral.
In does not make much sense to waste 30% or more of natural gas this way, in comparison with using nat gas for transportation directly
Natural gas can be burned at 60% efficiency in central electrical generation plants, which is about 3x as efficient as NG cars. So, EVs make perfect sense, even if the grid is 100% NG. But…the grid isn’t 100% NG, and EVs can charge when wind and solar are strongest and need the extra demand: 2 AM and 2 PM.
A very good point.
But assuming 10% losses in transmission and 20% losses in charging
0.6*0.9*08=0.43
In the past years, GDI (Gasoline Direct Injection) increased the efficiency of the engines equipped with this fueling system up to 35%. I think natural gas has similar efficiency.
So EVs beat natural gas auto by around 8% in optional temperature for EV (60-75F range) and I was incorrect. Sorry about that.
In colder weather gas powered cars will always beat EV due to losses in EV for heating.
I think that might be true for driving with air conditions too.
What advantages of natural gas remain? I think the only one is that you can use existing cars with a very small modification of injection system.
NOTE: It looks like cited by you efficiency of 60% is the upper limit of gas turbine efficiency (38% might be more reasonable):
https://www.brighthubengineering.com/power-plants/72369-compare-the-efficiency-of-different-power-plants/
I would think semi trucks might be a good fit for natural gas engines.
Yes. The only question is whether electric trucks might come soon enough to strand the investment in vehicles and infrastructure. Truck fleet operators are very conservative about big investments like this.
Current ICE efficiency is about 21% (5.91 quads transportation energy services / 28.1 quads energy input).
https://en.wikipedia.org/wiki/Energy_in_the_United_States#/media/File:Energy_Flow_US_2017.png
The EIA reports that NG plants have an average efficiency of about 44%: (3,412 BTUs per kWh/7,812 US BTU electrical generation heat rate)
https://www.eia.gov/electricity/annual/html/epa_08_01.html
So, even with efficiency losses EVs get roughly 75% more power from NG (44% x 80%, divided by 21%).
The lower efficiency natural gas plants are used to follow the load, the combined cycle plants used for standard baseload can follow the load to some extent, and their efficiency is higher than 60%
There’s possibly food for thought in what this Alexey Anpilogov has to say, but he’s full of shit , up to his nose, unless he’s speaking in a vernacular unfamiliar to me.
” Its essence becomes clear if we take into account in the picture the “quiet” transition of the world from “firewood and straw” to oil, gas and coal, which lasted throughout the decade of 2008–2018.” This is a crock of shit, in no uncertain terms. The richer countries of the world, which consumed and still consume most of the fossil fuels, transitioned to fossil fuels a full fucking century back. The increase in consumption in third world countries during that time frame was modest , in terms of total consumption world wide.
HERE is a fact that is ALWAYS overlooked by fossil fuel cheerleaders when discussing the supposedly poor deal the public gets by supporting renewable energy. The production of wind and solar electricity is now up to the point that it is substantially reducing demand for coal and gas as generating fuel, and promises to soon substantially reduce the demand for gasoline and diesel fuel as well, as the number of electric vehicles on the road grows, and that number is growing at a VERY fast pace.
Lower demand for fossil fuels means the market is a buyer’s market, and I believe we have collectively gotten back everything we have spent subsidizing wind and solar power already, and that we will earn a very handsome return on these subsidies as time goes on, in terms of saving mega bucks we would otherwise have to spend to buy coal and gas to generate electricity, and oil to run cars and trucks.
It’s not just the QUANTITIES involved, it’s as much or more about depressed fossil fuel prices as the result of competition from renewable energy.
And while the energy derived from fossil fuels has increased faster, over the time frames mentioned, than renewable energy has increased, in absolute terms, renewable energy has been growing at an astounding rate, in relative terms, from one year to the next for the last decade plus, which is deliberately overlooked, in respect to analyzing present and future energy needs and priorities.
OFM- Interesting that we see this presentation of ideas so differently. I do not see the information as cheerleading, but more as realism. I see the development of renewables as crucial, but very early phase compared to the energy consumption of the world. Its a huge hurdle to overcome the massive dependency on fossil fuel energy, as is so well pointed out here. And we don’t have long to get the job done. The better we understand that challenge, the more emphasis on implementing adaptation we may attempt. Renewables will not prevent the big shakeup thats around the corner, except perhaps in a few favorable places, IMHO. Its a race against time, and the urgency is generally missing.
I believe that ‘firewood and straw’ statement was a typo. Caught my eye too.
The “firewood and straw” statement was talking about the shift, in mostly un(der)developed countries, from some lesser percentage of fossil fuels, to more fossil fuels and less wood, over the period 2008 – 2018. I don’t believe it is in error or a typo, just worded poorly, most likely due to the translated nature of the writing. He was not speaking of the wholesale shift to fossil fuels, just the continuing shift that is occuring in many areas.
In that time period there was indeed some amount of shift away from wood toward fossil fuels, as more areas industrialize. Keep in mind that many people today still use firewood, so this process has plenty of room to continue so long as the fossil fuels are available.
Thanks for that clarification Niko.
I suppose the statement referred to the massive growth in numbers of people who have gone from ‘primitive’ fuel use to internal combustion engines for work and transport over the past several decades in widespread areas of Asia, Africa and Americas. Billions more fossil fuel consumers in just a short time.
he’s full of shit , up to his nose
Yeah. So much BS, so little time.
Hi!
does anyone know why the Texas RRC is still not publishing the production data for December 2018?
Thanks, Dean
They report computer, or software problems. It was posted on the site once, not there now.
Thanks!
RRC December out now. With pending data totals, I’m calling it flat from November’s.
Thanks. Given that today the EIA will publish their monthly production data, I prefer to wait some hours to put all together.
EIA out, and 36k increase. That’s pretty much flat.
Somebody way up above said because Russia uses natgas for transport they don’t consume much oil.
Gas consumption growth last year was 1.3% Oil consumption growth was 1%.
Russian car sales grew 18% last year after a double digit gain the previous year. Lada dominates their sales, and as best I can see they are all petrol fueled. Hyundai and Kia are a substantial presence as well, but I see no evidence in general of natgas dominating transport.
American model sales seem at best obscure. It’s Lada, Hyundai, Kia, BMW, VW.
The statement about Russia using natural gas heavily for transport is simply inaccurate. Russia “only” consumes 3.2 million barrels per day of oil. But that’s more because the country does not have anywhere near the continent-wide car infrastructure and other wealthy sprawl the United States built out.
Russia per capita oil consumption is 0.0229 barrels/person/day. This is about 1/3 US consumption rate. It’s higher than most countries.
Consumption is high as Watcher pointed out. So I was wrong.
But 1/3 of the USA consumption for a country as large as the USA is not bad, either.
The personal cars in Russia are much smaller. From what I have seen usually Corolla size and below. Typical size of the engine is only 1.8L and below with higher ratio of turbo: annual tax on car (in the USA disguised as the registration fee ) depends on the size of the engine, not on the weight as in the USA. And is highly progressive.
Taxies and buses run almost exclusively on gas in large cities. Drivers complain about high cost of gasoline, so this is probably one reason why.
Same is true for Ukraine: Most cars are either dual fuel or can be re-tuned to natural gas for less then $100.
The quote is per capita. The US does not have the highest per capita oil consumption in the world. There are odd numbers for countries that would not seem to warrant having high per capita consumption, so it is a data item that has to be looked at carefully.
For example, Singapore has very high per capita oil consumption, and almost no one has a car. A lot of that has to do with having been configured as a refinery center for other Asian countries. The crude is not really consumed.
There are other countries that clearly, correctly have higher per-capita consumption in the US. Canada is one. The Middle Eastern oil exporters also have high per capita consumption.
As has been discussed before, China and India are spiking upward their per capita consumption. No sign of that ending.
> China and India are spiking upward their per capita [oil] consumption. No sign of that ending.
Well, one sign is that car sales fell in China last year after being the main engine of car sales growth worldwide for over a decade. Another sign is that EV sales in China boomed amid the bust, with something like 60% growth. They are now at 7% of the new car market.
EV sales don’t hurt the oil industry in the short run, because the ICE fleet is so huge, but they are the canary in the coal mine. The car industry is panicking right now, but it will take 5-10 years for the oil industry to feel the pain.
Russian buy a lot of German cars, or they have been until the fallout between Russia and Western Europe over Crimea & Sanctions.
As for debt bad or debt good.
US national debt is over 100% of GDP. There is sub 3% inflation. Ditto real GDP growth, sub 3%.
Japan national debt is 250% of GDP. Inflation 0.3%.
UK 85%. Inflation 1.8%.
India 69%. Inflation 3.2%.
Italy 132%. Inflation 0.9%.
Economic laws are only laws of agreement (aka self delusion). Not of nature. Money is created from thin air. Come societal destruction from oil scarcity, and an enclave in southern Kansas has well water and crops for its 40 people, do you really think they will trade pieces of paper among themselves for potatoes? Or trade them with another enclave 50 miles away?
Potatoes have value beyond delusion. Paper . . . nope.
There is sub 3% inflation. Ditto real GDP growth, sub 3%.
I think real inflation is at or slightly above 3%. Last year except for Dec, Stocks were up. Auto prices were up, Home prices were up, Food & energy prices were also going up. While Home & Stock prices have flatten food prices have gone up between 5% and 8% between Jan & February.
I think we would have rolled over into a recession if the Fed continued QT (Quantitative Tighting) & raising interest rates. This might be the first time since 1913 that the Fed actions didn’t trigger a recession or depression (1925 & 1932). Powell is probably the first Fed Chairmen that realize they were close to tipping point and backed off.
Public debt is small compared to private debt. You are a victim of Republican tax cutting propaganda. Your analysis means nothing.
I think not all
followed the link
article is big.
Maybe someone will be interested
I will write here in several posts.
I hope someone will be interested.
I continue:
The fluctuations of this second parameter, associated with economic crises and recessions observed in the period under review, make it possible to evaluate the contribution of the notorious “energy efficiency” to the global increase in energy consumption. In a situation of almost “zero growth” of the world economy, which occurred in the period 2008–2009, the consumption of primary energy decreased by 0.8% per year. At the same time, for each percent of economic growth, it is necessary to “pay off” by increasing the consumption of primary energy by about 0.6%.
In an expected way, an improvement in energy efficiency was reflected in monetary indicators: in 2017, each TOE of consumed energy generated $ 8,617 of global GDP, which corresponds to 1.7% of annual growth over the period 2007–2017.
Of course, the world’s primary energy is not evenly distributed across countries. Even the top five leaders in the use of primary energy: China, the United States, the European Union, India and Russia – have completely different consumption patterns, which are associated with the historical, geographical, economic and political differences of these countries.
Thus, as of 2017, China has already been the largest global consumer of primary energy: its energy consumption has reached 3.132 billion TOE, which is equal to 23% of the global consumption of primary energy. The growth of Chinese energy consumption is also impressive: in the period from 1990 to 2013, per capita energy consumption in China increased from 0.602 TOE to 2.14 TOE — that is, almost four times. Since then, energy consumption growth in China has somewhat slowed down, and by 2017, per capita energy consumption there was only 2.26 TOE, which is not only still significantly lower than per capita energy consumption in countries with developed capitalist economies, but and corresponds to an increase in energy consumption of about 1.5% per year (and an economic growth of 2% per year).
If we consider the inertia of this historical trend and additionally take into account the fact that the new policy of the ruling CPC implies a transition to stimulating consumer demand within the country, then we can assume that by 2050 per capita energy consumption in China should reach 5-5.5 TOE. This figure takes into account, in addition, the observed impact of energy efficiency (the same 0.8% per year), but suggests that GDP per capita in China will grow to about the equivalent of $ 50,000 by 2050. At the same time, it should be understood that in a part of the population, a conservative forecast is adopted, according to which the population of China will reach a peak by 2030 and decrease to 1.36 billion by 2050. Taking into account these factors, China’s energy demand in 2050 will exceed 7,000 million TOE, i.e., it will grow 2.23 times and make up more than half of the current volume of primary energy production. Information that, according to fertility data, the population of China in 2018 decreased by 1.27 million people, has not yet been officially confirmed, and it is clear that the above figure can be significantly adjusted downward, but in any case, China will pull the world energy “blanket” on themselves.
The United States is the second largest consumer of primary energy in the world. In 2017, the US energy consumption amounted to 2,235 million TOE, which corresponds to 17% of world primary energy consumption. US per capita energy consumption peaked at 8.01 TOE in 2000, which was a historic peak. For the period from 2007 to 2009, per capita energy consumption in the United States decreased from 7.7 to 7.04 TOE, and in 2017 it reached the level of 6.87 TOE. Nevertheless, the United States continues to be the most “voracious” consumer of primary energy per capita, and their ability to further reduce the achieved level is very slim if they are not linked to the global restructuring of their economic and social structure, which is highly unlikely without a deep national crisis. An additional factor is the steady growth of the US population, which has no tendency to slow down until 2050.
Still continuing (3):
The European Union is the third largest consumer of primary energy in the world. In 2017, the energy consumption of the European Union amounted to 1,689 million TOE, which is equivalent to 13% of world primary energy consumption. Historically, EU per capita energy consumption was the highest before the onset of the 2008 crisis and amounted to 3.71 TOE in 2006. In the future, the European Union immediately fell into a double crisis: the global economic year 2008–2009 and its own financial one, connected with the debts of the Mediterranean countries, first of all – Greece. This led to the fact that energy consumption per capita in the EU was reduced to a minimum of 3.2 TOE in 2014. By 2017, per capita energy consumption in the EU was only partially recovered and reached 3.29 TOE. At the same time, its value has a very pronounced country differentiation, and if for Germany in 2017 this figure was 3.86 TOE, for France – 3.61 TOE, then for the UK – 2.72 TOE, for Poland – 2.71 TOE, for Portugal – 2.23 TOE, and for Romania – 1.69 ToE. In general, this level of per capita energy consumption quite adequately reflects the EU’s longstanding efforts towards supporting energy efficiency, but also vividly shows the limits of what can be achieved within the framework of a concept combining a set of measures for energy saving and green energy replacement. As we see, as a result of the implementation of such programs, the European Union did not become “European China” at all, although it became less like “European America” in the energy issue.
Thus, it can be assumed that in the long-term trend, the per capita energy consumption of EU countries will decrease slightly, only by copying the general trend of slow increase in energy efficiency.
India is the fourth largest consumer of primary energy in the world. In 2017, energy consumption in India increased to 754 million TOE, which is 5.6% of the world. India, like China, is characterized by very rapid economic growth, which was expressed in terms of per capita energy consumption: more than twice since 1990, when it amounted to 0.225 TOE, to 0.562 TOE in 2017. If per capita energy consumption in India continues to follow the same pace, by 2050 it should reach a mark of 1.21 TOE, while India’s GDP per capita will reach approximately 19 thousand dollars. It is expected that by 2050 the population of India will grow to 1.72 billion people. That is, it can be expected that by 2050 India’s energy demand will exceed 2 billion THN – or it will grow 2.65 times, overtaking even China in terms of relative growth, and in absolute figures ahead of the European Union.
And finally, the Russian Federation, which is the fifth of the world’s largest energy consumers. In 2017, primary energy consumption in Russia amounted to 698 million TOE, which accounted for 5.2% of world primary energy consumption. In 1990, when Russia was still part of the USSR, per capita energy consumption in Russia was 5.8 TOE. Over the past years, Russia has already passed its historic low, when the economy of the new country was torn to shreds by neoliberal “shock therapy”, the short-sighted policy of rapid privatization and the total introduction of the “wild” market – including in the energy sector. This was reflected in the fact that the minimum energy consumption per capita in Russia was achieved by 1998 and amounted to 4.03 TOE. Smaller values of per capita consumption, apparently, are simply impossible in a cold and harsh Russian climate, since heat supply is a vital function in it – therefore, a value of 4.03 TOE can be considered the level of “basic survival” in Russia. An interesting fact: in Canada, where the climate is very similar to that of Russia, per capita energy consumption is 9.5 TOE as of 2017. At the same time, no one in Canada speaks of “cheap electricity” or “too high costs for heat supply,” realizing that this is the necessary conditions for the survival of the country’s population.
Since 1998, per capita energy consumption in Russia has been steadily growing and reached a level of 4.83 Toe in 2017, which corresponds to about 0.8% per year. Most likely, this trend will continue in the future, since the living standards of the Russian population are still lower than the living standards in the European Union or the United States, and the Russian level of per capita consumption lags behind the level of the late USSR, even taking into account the accumulated “bonuses” in energy efficiency.
World energy: forecast
As noted above, the parameters of GDP and total energy consumption – just as the parameters of per capita GDP and per capita energy consumption – in the current economy have a strong correlation.
Moreover, almost all the leading countries of the world fit into a very clearly traceable ratio, which corresponds to 10 thousand dollars of per capita GDP for every one TOE per capita consumption. Smaller values of this parameter are characteristic of a number of underdeveloped and developing countries, which leads to a “average” value of $ 8,617 per 1 TOE for global GDP.
There are deviations and “up” on the scale of specific energy – this is already mentioned in the text of Russia, Canada and the United States.
For Canada, Russia and the Scandinavian countries, you can build a separate branch of the graph, on which for the “northern” economies it turns out that for every 10 thousand dollars of per capita GDP they need to spend about 2 TOE per capita consumption – twice as much as for those living in tropical or subtropical climate of China or India.
The phenomenon of “overconsumption” of the United States, as is clear, has a different nature – it is associated with the actual “imperial” energy tax for the whole world, which allows the United States to still maintain excessive energy consumption, which is in no way connected with the country’s climate the political structure of the United States, which is the world hegemon.
It is important to emphasize that, if we exclude from consideration the “imperial” United States and “northern” Russia and Canada, then the correlation between oil consumption and the GDP of a particular country acquires almost 100% of its character. For example, Japan, not mentioned above, was the sixth largest energy consumer in the world in 2017 and surpassed most EU countries in terms of both per capita GDP and per capita oil consumption! Although, it would seem, the southern conditions of Japan, almost completely located in the subtropical and tropical zones, suggest lower figures for per capita oil consumption.
In 2017, energy consumption in Japan amounted to 456 million TOE, which amounted to 3.4% of world primary energy consumption. Historical peak energy consumption per capita in Japan reached in 2005 and amounted to 4.15 TOE. Since then, energy consumption in Japan has tended to decline, as the country’s national economy fluctuated between a hidden recession and sheer economic stagnation. The effect of the largest nuclear accident at the Fukushima nuclear power plant in 2011 is indicative in this respect: despite the radical restructuring of the energy sector in Japan caused by this catastrophe and the almost complete closure of nuclear power plants in the country, the consumption of primary energy in the Land of the Rising Sun has not undergone such a sharp falls: almost all the “fallen out” volumes of atomic energy were promptly replaced by increased consumption of oil and natural gas. And the general trend of growth or reduction of primary energy consumption still showed a correlation with only three parameters: the country’s population, the level of per capita GDP of the national economy and the general trend of improving energy efficiency, which in the case of Japan describes the same energy saving parameter of 0.8% per year .
By 2016, per capita energy consumption in Japan decreased to 3.55 TOE, which was even lower than per capita consumption in 1990, with a fundamentally higher GDP and a practically stable population (an increase of only 3 million people with 123 million in 1990). In 2017, per capita energy consumption in Japan grew only slightly to 3.6 TOE, which is quite consistent with the very modest growth of the national economy.
As already mentioned, the practical economic result of “green” energy, observed for the period 2007–2017, can be optimistically described as “zero” or “poorly distinguishable from statistical error”. Of course, one can complain that the sun and wind today give only 2% of the global primary energy production and you need to “just give them more time (and money)”, but the sad reality is this: supposedly “promising” new energy sources affect the economy. Their implementation in the countries of the European Union did not affect the picture of energy efficiency and did not alter the ratio between GDP and tons of oil equivalent spent on its production, while the global crisis and the debt crisis of the EU itself turned out to be much more significant factors.
Still continuing (4):
A simple forecast follows from these sad conclusions: even if over the next decade the volume of “green” energy again grows 4 times, then its share will reach only 8%. However, even this level is an almost unrealizable dream: according to most forecasts – for example, the IEA in 2017 and the Energy Information Administration (EIA) in 2018 – the actual relative growth of renewable energy sources will be only about 2–20 years before 2030. 2.5 times. Unknown conclusion: even by 2030, the share of oil, natural gas and coal will be at least 75% of the total primary energy level, which will be related to nuclear and hydropower and the continuing relative waste from the use of wood energy and biomass. During the years 2030-2040, the year can be almost fantastic, and all this will be due to the difficulties that must be achieved in the field of oil, gas and coal in the balance sheet. energy.
An extremely unpleasant situation with such a pessimistic forecast is expected with world oil production. At the moment, its growth was concentrated in only nine oil-producing countries. As an example, oil production in China is expected in 2015, after which it was not even possible to achieve an increase in Chinese oil production.
Today, this “growing oil subsoil” includes the following countries (the estimated year of oil production and data source are shown in brackets): Canada (peak in 2049, BP), USA (2042, EIA), Iraq (2042, BP) , Kuwait (2040, BP), Iran (2039, BP), United Arab Emirates (2037, BP), Russia (2033, IEA), Saudi Arabia (2030, BP), Brazil (2024, BP).
The exit from almost all the “growing” sources of oil production in the world is caused by a drop in production from 2030 to 2040, which means the global energy crisis of humanity. and there is “tasty”, and there is energy, and all this economic strategy of modern civilization.
Of course, partial replacement with liquid motor fuel, which is easily obtained from petroleum, can be carried out using natural gas, as well as using chemical reforming in various types of liquid hydrocarbons and molecular hydrogen.
However, this situation is hardly optimistic. In 2015, the world’s peak production was observed. Currently, natural gas production growth is concentrated in only ten countries (the estimated year of natural gas production and data source are shown in parentheses): Canada (2074, IEA), USA (2063, EIA), Iran (2046, BP), Qatar (2043 , BP), Saudi Arabia (2037, BP), Algeria (2027, BP), China (2027, BP), Australia (2026, BP), Russia (2026, BP), Norway (2023, IEA).
It is easy to see that already after 2030, the natural gas market will, like the oil market, be practically monopolized by four or five countries, each of which will be able to easily manipulate prices by simply adjusting its own production, since other players simply will not have any -or free capacity. Unfortunately, in the case of Russian oil, and when analyzing the prospects for Russian gas in such an oligopolistic market, it can be noted that Russia will be in the “first echelon” of losers, at whose expense they will try to solve world problems with the energy balance.
Of course, a partial replacement of natural gas and oil can be expected in the form of a return to more “dirty” and expensive coal. By the way, it was precisely such a strategy that China and India chose in the 1990s, who, without having wide access to the oil and natural gas market, relied on their own deposits of hard coal. The incidental damage to ecology and human health in this case was the price paid for the rapid industrialization paid by Indian and Chinese society.
However, even on the “coal” path, humanity has its own problems. Today, the rapid growth of coal production is possible only in four (!) Countries of the world. All other countries have already passed their peak of hard coal mining, some of them more recently, such as the USA (2008), China (2013) or South Africa (2014).
According to estimates by international energy agencies, today, growth in coal production is possible only in the following countries (in brackets is the expected year of peak coal mining and source of data): Russia (2112, BP), India (2052, BP), Australia (2032, IEA) , Indonesia (2031, BP).
I apologize for
posting an article here
– It was designed for a reader in Russia.
Ending:
Mirovaya energiya: stsenariy
I
World Energy Scenario
The inertial scenario of the development of mankind suggests that by 2050 the world consumption of primary energy will increase one and a half times and will be about 20 billion TOE. This indicator takes into account both the observed effects of energy conservation and a very conservative estimate of future economic growth – within 2–2.5% of the annual increase in global GDP.
However, crisis tendencies will be waiting for us much earlier than in 2050: it seems that the gap between supply and demand on the global energy market will be formed by the early 2030s, when global energy consumption will approach the level of 16-17 billion TNE . As already mentioned, peak years for world production of oil, natural gas and coal are coming in the very near future. According to the IEA, the peak of world oil production will come as early as 2022, when all of humanity will be able to provide about 4,530 million TOE with oil. According to the same forecast, coal will be at its peak in 2028, when at the expense of it it will be possible to get about 6 billion THE (which corresponds to about 8.4 billion tons of physical coal mining, due to its lower energy value). And finally, global natural gas production will peak in 2036, when this energy carrier can provide 3.9 billion ToE.
It is easy to understand that, taking into account the predicted share of oil, coal and natural gas in primary energy of about 75% by 2030, the sum of peak production (14,430 TOE) almost fully corresponds to ¾ the lower bar of estimated consumption in 2030 (16,000 TOE) . It should be understood that the peak values for oil and hard coal in the world will be reached before 2030, after which these energy carriers will only decrease in the volume of physical production. In part, this effect can be compensated for through the involvement of more low-margin fields (as it happened with shale oil and gas), but the limits of such compensatory mechanisms are not unlimited. In addition, a significant increase in the price of primary energy in itself is a sign of the crisis of the existing economic structure, which clearly links social stability with economic growth, and economic growth is fueled precisely by the available (both physically and in price) energy.
Of course, the increase in the price of oil, natural gas and coal will improve the economic prospects of “green” energy (simply due to the banal high cost of any energy available to humanity), but this also means that within future economies huge amounts of energy will simply be spent on maintaining the internal structure economies and the livelihoods of the critically needed primary energy sector.
An idea of this kind of economic structure may well be given by the economic model of the USSR, where such a bias towards the enterprises of “Group A” was dictated by military and state construction, while consumer goods of the enterprises of “Group B” were in short supply. However, in the USSR this mechanism was a reflection of the planned economy, in the case of the supposed “peak” scenario of 2030, it would be formed by purely market mechanisms within the framework of the “classical” capitalist economy.
It is clear that this implies a “contraction” of the final consumption of the population, which will be caused by the forced flow of capital to the high-yielding primary energy production sectors, forced and natural in the framework of the capitalist economy. At the same time, the “welfare society” of the model countries of the “collective West”, such as the European Union and, in particular, the United States, will collapse. Faced with this kind of crisis, the “overconsuming” Western countries will unambiguously join the battle for the remnants of mineral energy resources. Such events and wars are likely to surpass even the current “oil conflicts” in the Middle East, North Africa and Latin America, in which the United States and its European allies are directly involved.
Probably, Russia will again be hit, which remains the “last natural storeroom” for large reserves of sufficiently cheap oil, natural gas and coal. Most likely, the “energy predators” will try once again to control the richest natural resources of our country, which, under various pretexts, will strive to declare “the heritage of all mankind”. In fact, we will talk about the banal energy robbery of our country, which will hide behind the fig leaf of propaganda.
Another disappointing conclusion follows from the energy “poverty” of the “world of the future”: Russia today has to prepare for the fact that our “four hard-earned oil equivalent per capita”, which, as noted above, is the basic condition for survival in Russia’s severe climate should be in the future provided for the population of the country from sources other than oil, natural gas and coal. The challenges facing the world are facing Russia, but what the United States is the reason for the rejection of overconsumption turns out to be another challenge for Russia in the face of cold and death by starvation.
Unfortunately, the “world of the future” does not promise to be a pleasant and comfortable place to live. And we should prepare for such a negative scenario today.
Thank you for the thought provoking thoughts Opritov Alexander.
It is useful to hear these ideas from the perspective of those from various countries, such as yours.
The data dovetails closely with what has been presented from other sources, by and large.
The geopolitical ramifications of these challenges is obviously paramount.
I am concerned that countries will be pressured to go to war over the shortfall in energy, through desperation.
A few points about different countries-
The USA could likely decrease it energy use/capita considerably (perhaps 30%), without severe economic repercussion. But it is not taking the issue seriously.
Some countries like Korea will have a very hard time decreasing consumption. They are cold, and heavily industrialized. And rely almost entirely on imported fossil fuel.
I expect India, and China, to lean heavily toward suppliers of fuel as they plan their position in the world and choose allies. Iran and Australia both seem to be prime suppliers considering proximity.
Concerns over global warming will be swamped by concerns over energy shortage, despite the severity of the change, such as food supply disruption and forced migration. These climate problems will likely be much more severe after energy shortage problems develop due to the lag in CO2 effects.
Do you see these issues differently?
Mostly I agree with you.
It’s hard to imagine the future.
Much will depend on politicians and the willingness of peoples to reduce consumption for the sake of an acceptable standard of living in the future.
Passing the peak of energy consumption will lead to a decrease in global GDP.
This means a decrease in per capita consumption.
Reduced consumption = reduced demand = industrial workload = crisis.
I believe that in order to save people, they will live in multi-storey buildings, perhaps without an elevator (of course, it may not be soon for 50 years), the transport will be public, there will not be enough private cars.
In addition to the peak of hydrocarbons, the peak of copper, gold, silver, tin, and a lot more is coming. How to solve these problems I don’t want to dream
Post scriptum. The problem of CO2 and the problem of global warming in Russia is not a popular topic. So much that everyone refuses to discuss it and even think about it. Approximately as an alien topic.
I should have added Russia to the list of few countries that both India and China (and many others) will be turning to eager for more energy supply.
Secondly, regarding global warming, Russia may experience a large degree of immigration pressure in later decades.
1. Global warming is a hypothesis, not a scientifically reliable fact.
Temperature fluctuations have been throughout history.
Temperature changes are influenced by many factors.
How this happens is authentically unknown. Scientifically not proven.
2. With a decrease in hydrocarbon production, a person’s influence on temperature changes will also decrease.
3.to stop countries from using energy from burning hydrocarbons — impossible.
4. Let everything go naturally, we will not interfere in the process.
The planet is of course overpopulated. I am afraid what will happen as with Easter Island: There was a beautiful island in the ocean with various vegetation and wildlife, then several groups of people got there in a short time they multiplied, developed culture, writing. The population reached 20 thousand people. destroyed the whole animal and plant world. Then they degraded, forgot their history and writing, became horsemen. When the Europeans discovered the island there lived about two thousand savages, there was not a single tree and living trees except rats. e I want it to happen again on a large scale.
As far as CO2 causing increases in global temperature I would be grateful for any research you have links to that show that in any past event that stepped event of a doubling or more CO2 caused a decrease in average global temperatures .
All research I have seen on past CO2 events , albeit by the proxies used ( obviously as we we not there to see the events ), have indicated that such events lead to temperature rises regardless of the geographical configurations of the continents or other factors such as Solar isolation , etc.
such event also appear to have coincided with methane concentrations being increased by substantial amounts , although not in all cases ( as far as we can tell with current research) .
—
on the Easter Island analogy , reduced energy for travel will mean places we could reach will not be reachable or livable , these areas , such as isolated islands , will recover diversity , even if its roots are based what survived mankind ( over geological time scales of course) . Even the tropics may be excluded from humanity’s influence if air conditioning is not available for example.
I do not exclude the possibility that mankind could destroy the biosphere* – we are persistent bu@@ers after all ….
Forbin
* yes we making a mess of it , time to tidy our room up
forbin Wrote;
“I do not exclude the possibility that mankind could destroy the biosphere* – we are persistent bu@@ers after all ….”
That is all but certain, but not because of climate change, but because of the pending Third world war:
1. US, China & Russia are now locked into a new arms race. All are modernizing there nuclear weapons.
2. All of them have very large Multi-Mt bombs. Russia is deploying its Poseidon 100Mt Sub-drones designed to take out the US atlantic and pacific coasts. As well has hypersonic cruise missiles to bypass missile defense systems.
3. The US just left the INF treaty and has increase its defense spending close to $750B. Russia’s defense spending is about 28% of its GDP, and China is close to $250B. Most of NATO has also increased Miltary spending too.
My guess is that when the global economy sags from problems grow due to demographics and Oil production declines, its going to create a whole world of unhappy campers. When your hungry and desperate just to survive, than you are willing to try anything to get out.
Thuis will lead to Crazy leaders taking over and doing really crazy things. Recall that the 1930’s depression was the catalyst for Hitler, Stalin, Tojo, Mussolini, and enabled the to use the crisis to take control and go nuts. Fortunately for humanity, no Nukes or Biological weapons to wipe out billions in the 1940’s.
But all you need to do is pick up a newspaper or turn on the TV\internet News and read about people with really crazy ideas looking to get into power.
When people are hungry, cold and cannot find jobs, they get very angry, They tend to over throw governments (aka Arab spring) or elect nut jobs who make grand promises to the meek masses. No this time won’t be different!
I believe. We have a chance.
Four hundred years ago.
There was no industrial revolution.
People could live in dignity.
Since then. We have learned a lot.
In place of Homo sapiens
Nomo will be responsible
And yes.
I want to add .
The global crisis associated with a decrease in hydrocarbon production in my opinion will reduce the possibility of a global war. This is good.
Because:
1. It will become difficult to increase the cost of armaments; armament is expensive.
2. Now another generation, there are no citizens willing to leave their homes to go to war. Severe discipline is not possible, and this is necessary. Only professional armies will be able to fight, and also with restrictions.
And internal wars, civil wars, protests, robberies, attacks will be possible. If the governments are able to bring order, and start to tighten the screws.
Opritov Wrote:
“The global crisis associated with a decrease in hydrocarbon production in my opinion will reduce the possibility of a global war. ”
Unfortunately it doesn’t work that way. when Oil product peaks its not going to collapse. Thus providing the means for countries to use their Military power to secure remaining supplies. Just like the US is doing. Notice that the US has focused Military invasion and occupation just about all of the worlds exports. Except perhaps KSA which has been a vassal of the USA since WW 2. The US now has its eyes on occupying Venzuela.
Consider the infamous Dick Cheney Presentaion back in 1999 when he said “The USA need another Iraq” for Oil. who would have guess that the US would create fake evidence to invade Iraq when Dick Cheney was VP?
I am sure China already knows what’s going on as it doing its own operations to obtain control over Oil Exports already not under the US thumb.
Then there are minor players like India and Pakastan fighting over water in the Kashmir region. Just this week Pakastan shot down two India jet Fighters and nearly seized a India submarine found in pakastan waters.
USA pulled out of agreements and even the INF in the past 30 days. Now China,Russia, & USA are building new nukes and hypersonic weapons.
The Third world war could start any day, perhaps if Pakastan and India start a full hot war and start launching nukes at each other. Perhaps China takes sides with India in order to secure the region that India and China are in dispute. then other nations are drain in like bar fight that ungulfs everyone in the bar.
There is also the Iran & Israel war, Both Nations have Nukes and now that Israel’s PM Netanyahu has been indicted, perhaps he’ll try to start a war with Iran as a distraction. After all he’s been trying to get the US to attack Iran for over two decades.
“And internal wars, civil wars, protests, robberies, attacks will be possible. If the governments are able to bring order, and start to tighten the screws
When that happens what if the replacement gov’t is run by another Hitler or Stalin. After all Both Hitler & Stalin rose to power, preaching to the worker classes.
“Now another generation, there are no citizens willing to leave their homes to go to war.”
You don’t need to send troops to launch a bunch of ICBMs at your enemies. As nations like Pakastan & India have no issues sending their sons to die in Battle. Ditto for muslims (martyrdom).
Consider that if your country is in a recession or depression and your gov’t offers you food shelter, for military service, their will be plenty of volunteers. After 9/11 lots of Americans enlisted: 1 because they bought into the propaganda, and 2. because there were a lot of unemployed due to the Dot-com crash.
“As far as CO2 causing increases in global temperature I would be grateful for any research you have links to that show that in any past event that stepped event of a doubling or more CO2 caused a decrease in average global temperatures .”
—
I do not know of any such research.
It is known that throughout history the climate is constantly changing ..
To determine on the basis of what factors this happens is not possible.
_____________
“All research I have seen on past CO2 events , albeit by the proxies used ( obviously as we we not there to see the events ), have indicated that such events lead to temperature rises regardless of the geographical configurations of the continents or other factors such as Solar isolation , etc.”
—-
I have not studied this problem. I completely trust you, perhaps this is true.
Perhaps this is scientifically proven.
But time will pass and everything will change again.
It bothers me more how my grandchildren will live when hydrocarbon production is reduced by a factor of several.
_____________
“on the Easter Island analogy , reduced energy for travel will mean places we could reach will not be reachable or livable , these areas , such as isolated islands , will recover diversity , even if its roots are based what survived mankind ( over geological time scales of course) . Even the tropics may be excluded from humanity’s influence if air conditioning is not available for example.”
—
Man is such a creature that can adapt to any extreme conditions, the main thing is to properly motivate
Unfortunately there is no “Reply” button
“1)Opritov Wrote:
“The global crisis associated with a decrease in hydrocarbon production in my opinion will reduce the possibility of a global war. ”
Unfortunately it doesn’t work that way. when Oil product peaks its not going to collapse. Thus providing the means for countries to use their Military power to secure remaining supplies. Just like the US is doing. Notice that the US has focused Military invasion and occupation just about all of the worlds exports. Except perhaps KSA which has been a vassal of the USA since WW 2. The US now has its eyes on occupying Venzuela.”
—-
1)Opritov Wrote:
“The global crisis associated with a decrease in hydrocarbon production in my opinion will reduce the possibility of a global war. ”
Unfortunately it doesn’t work that way. when Oil product peaks its not going to collapse. Thus providing the means for countries to use their Military power to secure remaining supplies. Just like the US is doing. Notice that the US has focused Military invasion and occupation just about all of the worlds exports. Except perhaps KSA which has been a vassal of the USA since WW 2. The US now has its eyes on occupying Venzuela.
—-
2)”“Now it’s another generation.
You have to send a bunch of ICBMs at your enemies. As nations like Pakastan & India. Ditto for muslims (martyrdom).
Consider your health care, it offers you a lot of volunteers. After 9/11 lots of Americans were enlightened: 1 because they bought into the propaganda, and 2. because there were a lot of unemployed due to the Dot-com crash.”
—-
Of course, it is necessary to prevent any wars, to seek to solve the matter by negotiations, but the war between the countries mentioned will not be a world war, but will become local. All countries will stop supplying military items to howling, only humanitarian aid. The conflict will gradually die out even if Nuclear Weapons are used
The US has no interest at all in occupying Venezuela. But a large number of Venezuelans who think a US invasion is desperately needed.
The strategy being used by President Guaidó involves a phase of increasing labor strikes, which will eventually lead to an oil worker strike. If it succeeds we will see Venezuela production drop below 500,000 bopd, and exports will be below 300,000 bopd. Stay tuned.
Fernando Wrote:
“The US has no interest at all in occupying Venezuela. But a large number of Venezuelans who think a US invasion is desperately needed.”
Sorry that’s not correct. I know of a Washington insider. They do indeed want control over VZ, at least control of the Oil Resources.
Plan is to install leadership that will make that put VZ under US control, If that fails, they’ll roll the troops in. The Shale boom is going to come to an end and most of the Middle East production is posed for declines.
Venezuela and its oil is right in the USA’s backyard, along with some Russian bombers.
John Pilger: The War on Venezuela is Built on Lies
“Since Chavez’s death in 2013, his successor Nicolás Maduro has shed his derisory label in the Western press as a ‘former bus driver’ and become Saddam Hussein incarnate. His media abuse is ridiculous. On his watch, the slide in the price of oil has caused hyperinflation and played havoc with prices in a society that imports almost all its food; yet, as the journalist and film-maker Pablo Navarrete reported this week, Venezuela is not the catastrophe it has been painted.
‘There is food everywhere’, he wrote. ‘I have filmed lots of videos of food in markets [all over Caracas] … it’s Friday night and the restaurants are full.’
In 2018, Maduro was re-elected president. A section of the opposition boycotted the election, a tactic tried against Chavez. The boycott failed: 9,389,056 people voted; 16 parties participated and six candidates stood for the presidency. Maduro won 6,248,864 votes, or 68 percent.
On election day, I spoke to one of the 150 foreign election observers. ‘It was entirely fair’, he said. ‘There was no fraud; none of the lurid media claims stood up. Zero. Amazing really.’
Like a page from Alice’s tea party, the Trump administration has presented Juan Guaidó, a pop-up creation of the CIA-front National Endowment for Democracy, as the ‘legitimate President of Venezuela’. Unheard of by 81 percent of the Venezuelan people, according to The Nation, Guaidó has been elected by no one.”
See also:
The Making of Juan Guaidó: US Regime-Change Laboratory Created Venezuela’s Coup Leader
Opritov Alexander- In regard to your comments on global warming, I see that this trend is very much against the interests of Russia, with Russia being very cold, and very dependent on the fossil fuel economy.
This combination of factors is no stronger anywhere in the world.
People in general have a very hard time accepting a reality that runs contrary to our interests [‘inconvenient truth’].
In my opinion, its a matter of timing. Just how quickly do these various trends manifest themselves.
I wish your country no ill-will, but like the rest of us, we’ve got a big problem [understatement of the millennium].
I offer you this research to consider (from Natalia Shakhova of the Univ of Alaska)-
https://phys.org/news/2010-03-arctic-seabed-methane-destabilizing-venting.html
“It is very much contrary to the interests of Russia, since Russia is very cold and very dependent on the economy of fossil fuels.”
—-
It’s not like that, just the majority of Russian citizens don’t want to waste time.what to influence can not.
And yes, of course, we agree that warming is considered to be useful. This, of course, contradicts the interests of some countries. I consider the anthropogenic influence of people on the climate to be minimal.
Thanks for the link.
But now busy with several projects, there is no time to study carefully.
Read the article by Shakhov
I do not know how right she is.
Maybe so, maybe not.
The topic is fashionable, you can count on grants.
Possibly article biased.
“The topic is fashionable, you can count on grants.
Possibly article biased.”
And that is a fashionable method of discounting what is inconvenient to your economic/political message. It is indeed an inconvenient bit of science for us all.
What do you want me to blame?
Yes, I understand that global warming is happening, this is a scientifically proven fact. And I observe throughout my life (60 years) that there are changes.
I have no idea how obektivny research Shakhov.
I know that this topic is untwisted, committed to engage in it prestigious.
I understand that warming gives way to cold snaps.
It happens all the time.
Anthropogenic impact on climate is considered minimal.
And soon it will end (together with the depletion of hydrocarbon deposits).
Mankind cannot change anything in this area. If somewhere in Europe they use less coal, in other countries it will not stop. Then, when oil and gas run out, they will start to use coal in Europe.
I agree with you you here- “If somewhere in Europe they use less coal, in other countries it will not stop. Then, when oil and gas run out, they will start to use coal in Europe.”
All the fossil fuel that can be put on the market for a reasonable {?} price will find a buyer, atleast for 2 decades, in my opinion, and perhaps for much longer.
And of course people will also burn lots of wood.
Where is we might not see things similarly is the repercussion of all this burning. It looks to me like we are in for heavy warming.
https://www.nature.com/articles/ncomms15872
This is an update on the research by Shakhova from 2017 (or 7 years later). The “fingerprints” of accelerated melting are being found.
Opritov Alexander,
Not horsemen. None of the Polynesians had horses, including the Easter Islanders. Were you thinking of another word?
Yes of course. It doesn’t matter whether the horse was or not.
At first they developed. Writing, developed religion, appeared. Then they destroyed (ate, burned) resources.
GDP per capita has fallen. War has begun, degradation. I think that if isolation continued, then over 100,000 years they would turn into animals
‘they would turn into animals’
Hah. We are already animals.
Actually there is a pretty simple solution to primary energy demand: renewables.
40% of the land for corn (maize) crop in the US is for ethanol. Roughly 90 million acres are used for corn, so that’s 36 million acres for ethanol. There are about 4000 m2 to the acre, so 144 billion m2 are being used this way.
In Iowa, about 4 KWh /m2/day is available to horizontal solar panels. At 20% efficiency, that’s 0.8 KWh / m2/day. That’s an annual average, so it’s about 300 KWh /m2/year.
The US uses about 4000 bn KWh /year of electricity. That is the theoretical output of roughly 13 bn m2 of solar panels.
So it seems you could replace the output of the entire US electricity industry with less than 10% of the land now used to produce ethanol. Another 10% would be enough to replace the entire oil industry.
Similar calculations apply to countries like Germany, where rapeseed is used instead of corn.
You may be wondering how this is possible, but keep in mind that 10% of the liquid fuel consumed in the US is ethanol, and its production is based on photosynthesis, which is about 1% efficient. Cheap mass market solar panels are are 20% efficient, and really good ones are nearly 50% efficient.
This may seem a bit off topic, but I think it is food for thought for anyone watching the insanity of the fracking boom, which is producing nearly nothing compared to what serious investment in solar would produce.
Tanks Ron for sharing this important EIA overview and the shale play from an investor view. Well I recognize a pipeline with capacity 200 000 bpd was finish 2 month ahead of plan and oil inventory is decreasing . Than it is exspected one pipeline that is modified from gaz and condensate soon will be compleated , that add 300 000 bpd transport capacity. Than there is a huge investment regarding 4 pipelines that will add a significant capacity from 4th quartile 2019.. Without investors or majour Company willing to invest billions of dollars thoose pipes might never been filled with oil. All Companies have their requirement related to net profit, a Company like Conoco Philipps , Exson will never invest in shale and loose money. Than they stop and wait to the oil price is at a profittable level , this we know from history. The higher production the higher possible loss.
International Energy Agency – Oil Market Report 13th February 2019
Now available to non-subscribers – download from here
https://www.iea.org/oilmarketreport/omrpublic/currentreport/
OECD gasoline inventory seasonal, chart: https://pbs.twimg.com/media/D0Z3QSLXQAIcn-D.png
OECD middle distillates inventory seasonal, chart: https://pbs.twimg.com/media/D0Z34ajWwAEF7N9.png
OECD total (crude oil + distillates) inventory seasonal, chart: https://pbs.twimg.com/media/D0Z4kFsWoAAwJPD.png
Japanese weekly inventory change (million barrels)
Crude Oil -1.73
Total Distillates -1.47
Total (Crude + Products) -3.20
Source: PAJ
https://pbs.twimg.com/media/D0ZjG38XQAAAGYi.png
Fujairah weekly inventory change, total Products +52 kb
Source: FedCom/S&P Global Platts
https://pbs.twimg.com/media/D0ZjYx7W0AcPC0y.png
Another net exporting nation about to become a net importing nation.
BP puts Mexico’s 2017 total petroleum liquids consumption at 1.9 million bpd. Assuming no change in liquids consumption, Mexico has probably approximately averaged zero net oil exports for November, 2018 to January, 2019 (when total petroleum liquids production was 1.9 million bpd):
PEMEX Monthly Petroleum Statistics
Thanks to Jeffrey Brown for this information.
Big draw -17.9 million barrels including LPG
U.S. Petroleum Balance Sheet
Crude oil stocks down -8.6 million barrels
Crude oil exports over 3 million barrels per day again
Crude oil imports lowest since 1996, Bloomberg chart: https://pbs.twimg.com/media/D0bD6v5X4AEpx6R.jpg
EIA pdf file: http://ir.eia.gov/wpsr/overview.pdf
Oil import by country, Saxo Bank chart https://pbs.twimg.com/media/D0bGhyRXcAAUdDO.jpg
Oilytics chart summary https://pbs.twimg.com/media/D0bG34CWwAAQ1TS.jpg
For people interested in forward looking perspectives on what the shale E&Ps are doing, Whiting’s presentation the other day describing different completion strategies for closer/farther spaced child wells gives a glimpse of how far technology has progressed.
Graphics are shown on slide #12.
Essentially, the technology has progressed to the point where more closely spaced wells can be completed in a high intensity, near wellbore fashion while the frac half lengths are constrained.
For more widely spaced wells, a large frac geometry completion can be implemented to capture a high proportion of existing hydrocarbons with fewer wells. (This is exactly what the Rice brothers have said in their takeover attempts at EQT).
Whiting now claims 21% recovery rate of OOIP with their new wells.
Any projections of future production from unconventional development will continue to fall short without incorporating this ever evolving, highly dynamic culture of non stop innovation.
“Any projections of future production from unconventional development will continue to fall short without incorporating this ever evolving, highly dynamic culture of non stop innovation.
“
The real issue is that they already shot their wad. There are no do-overs on land that has already been developed.
So, for example, if they had used this new approach on a fresh area, they may have produced 150% instead of 100%. But when they try it on a partially exhausted area, they will get an additional 15% instead of 10%.
And think of all the NG that has been flared off. If only we can use the new technology to recapture that! 🙂
🙁
Whiting is a company with oil in decline.
I looked at Ennos oil site, selected whiting and looked at their production.
2018 production was a little bit better than 2015, but worse than 16+17.
Their new breakthrough technologies don’t show up in production yet. Normally, recovery rate in shale oil is at round about 5%, so they should even get 1 million barres out of a C class area with this technic.
Even their 2016+17 wells will be round about the same total recovery than their 2010 wells, not reaching 2008.
So no magic bullets for them.
I have a newbie question: the USA was very much in classic decline for many years, but now thanks to the application of new technology has sharply increased production from geology that was previously tapped out or uneconomic. That production may or may not require higher oil prices to be economic, but suffice to say it exists, and currently is being produced helter skelter.
My question: what is preventing this same technology from being applied in other oil provinces, whether ones in decline like China or near/past peak like Saudi or Russia? Is there any reason not to expect this knowledge to migrate outward and spur local booms in other places, keeping a ceiling on oil price for decades to come?
You should read the abundant posts on previous threads on this forum.
But the short answer is the US is pretty much unique in terms of size and quantity of shale basins. The rest of the world has adopted the new technology and is as we speak horizontal drilling and fracking the crap out of everything.
Lightsout
The only thing unique about the US shale industry is how it managed to con hundreds of billions in loans out of the financial institutions.
They have been lying about the break even cost in order to pull in more and more money.
http://priceofoil.org/2018/11/05/us-shale-companies-facing-catastrophic-failure-over-ballooning-debt/
Oil prices were over $60 for most of last year yet debt has increased substantially. Oil prices will have to be over $100 for these companies to pay back all that debt and produce oil from ever poorer areas.
The Russian companies simply do not have access to billion of dollars given by mugs. They have to develop what will pay, once oil goes over $100 they will start to develop the Bazhenov formation.
https://www.forbes.com/sites/kenrapoza/2017/08/29/when-russia-finally-hops-on-shale-bandwagon-opec-is-finished/#6d0f4de81af0
You make some valid points there. I have always suspected that financing for shale has been implicitly backed by the USG for years now (for the sake of broader macroeconomic & geopolitical imperatives) This is of course sheer speculation on my part, but I think it may be a distinct possibility.
Moreover, I am amazed by the blind insistence of so many oil commentators that Russia’s oil production is just about to peak and then tip over. This claim has been made time and again for well over 20 years now. Yet, nobody seems to be learning anything from being wrong *all of the time*
Fracking costs a lot of money, takes a lot of manpower and requires resources that extract well for it. It also has a huge surface and side effects footprint compared to conventional oil. The USA has large, sparsely populated basins that can still be reached by the necessary work force and logistics.
Most places in the world that aren’t the USA don’t want it for externality reasons, can’t make it work economically, can’t make it work geologically (China has this issue) or a combination thereof. The Saudis could frack but with huge conventional production with some of the lowest costs in the world they’d be insane to do so. Saudi isn’t known for having fresh water so it would be even more expensive per well there than it is in North America.
Not sure if the following is already shared here:
https://www.zerohedge.com/news/2019-02-27/have-we-already-passed-world-peak-oil-and-world-peak-coal
Is there a graph anywhere of supply versus consumption?
The difference between supply and consumption are inventories. When supply outpaces consumption, inventories grow. When consumption outpaces supply, inventories shrink. But over the long run, supply will always equal consumption because the price will mitigate the two.
A graph showing supply versus consumption would simply be a graph of inventories.
Crude Oil Inventories
There is an interesting article in the Journal Of Petroleum Technology which summarizes an SPE article by Schlumberger.
“Yet another SPE paper has concluded that old wells outperform new ones, but this study offers a lot more detail about development in the Permian.
The paper, authored by Schlumberger (SPE 194310), offers comparisons of five major plays in the Midland and Delaware basins, including details down to the pounds of proppant pumped per foot, that show that completions are becoming increasingly similar.
“In general, normalized production from child wells is lower than parent wells,” said Wei Zheng, production stimulation engineer for Schlumberger. Older wells outperform newer ones even when adjusting for the fact that new horizontal wells extend further through the reservoir and more proppant is pumped.
“We are getting the same result as 5 years ago when we were spending less,” she said during a presentation at the recent SPE Hydraulic Fracturing Technology Conference.”
Figure 2 which adjusts production for lateral length and proppant is particularly interesting.
https://www.spe.org/en/jpt/jpt-article-detail/?art=5164
The following article there is interesting, too.
It describes especially most comapanies going to a more wide well spacing – so total recovery of the basin will fall, but drilled wells will be more profitable.
Thanks Ron,
I’m more interested in global consumptuon/ supplies. I guess it’s probably not collated anywhere reliably?
Sean,
See BP statistical review of world energy.
Thanks Dennis!
2019-02-28 (EIA 914 Survey) US December crude oil production down -56 to 11,849 kb/day from 11,905 kb/day in November (Nov revised from 11,900 kb/day)
Prior November estimates
Average of the weeklies: 11,655 kb/day
February STEO: 11,926 kb/day
February IEA OMR:11,908 kb/day
This EIA web page will not be updated until next week
https://www.eia.gov/petroleum/production/#oil-tab
But here is an updated pdf file: https://www.eia.gov/petroleum/production/pdf/table1.pdf
Gulf of Mexico -125 kb/day
Texas +35 kb/day
North Dakota +18 kb/day
New Mexico +13 kb/day
EIA – because of the government shutdown and the resulting delays to certain trade data, EIA will release the Petroleum Supply Monthly with December data on March 8th. Today’s PSM release revises the November PSM with updated petroleum export data.
Some international inventories week/week changes (million barrels)
Total Distillates: -4.52, (Light: -3.13, Middle: -3.02, Heavy: +1.63)
Total https://pbs.twimg.com/media/D0hFu3eWwAAK67T.png
Light & Middle https://pbs.twimg.com/media/D0hF4I7WkAAWqow.png
Good news for some people in the petroleum patch, and the gas biz, and the coal biz, and a bunch of others, but not so good for ANYBODY, collectively speaking.
The Three Stooges could do better draining the swamp.
https://www.washingtonpost.com/climate-environment/2019/02/28/andrew-wheeler-former-energy-lobbyist-confirmed-nations-top-environmental-official/?noredirect=on&utm_term=.7fb2099e02a9https://www.washingtonpost.com/climate-environment/2019/02/28/andrew-wheeler-former-energy-lobbyist-confirmed-nations-top-environmental-official/?noredirect=on&utm_term=.7fb2099e02a9
The EPA Green Power Plam issued during Obama administration, was supervised by a radical environmentalist named Gina McCarthy. I looked over the documents and found out they used a climate model with CO2 emissions on steroids, which yielded even more warming than the infamous RCP8.5 used by IPCC propaganda as “Business as Usual”. Amazingly, the Republicans tend to ignore this weakness, and have allowed it to stand.
In other words both sides gave chosen radicals to man government agencies to further their political agendas, and both are screwing up.
says a man [foreigner] with no credibility on such issues.
Got his butt kicked out of Cuba, as the revolution won, then escaped to Fascist Spain under Franco.
Was young, so family directed a sorry history.
His output is rather predictable once you grasp his apparent ideology
UK December crude oil production at 1,069 kb/day. It seems that the official figures did not include 2 new projects until now. The last 11 months have been revised. November was revised up +114 to 1,019 kb/day.
Chart: https://pbs.twimg.com/media/D0hjvFMWkAcqQmi.png
Average 2018 985 kb/day
Average 2017 892 kb/day
2019-02-28 Table 3.10 Indigenous production, refinery receipts, imports and exports
In this publication crude oil figures for 2018 have been revised to take account of data that had previously not been captured. Two new projects (the Western Isles FPSO and the Catcher area development) have increased production figures from the previously reported flat trend to an increase of 9.2 per cent.
https://www.gov.uk/government/statistics/oil-and-oil-products-section-3-energy-trends
There should be a new UK forecast released sometime this month, this one is from Sept 2018. (units: million barrels)
Some informative shale play article from rigzone
https://www.rigzone.com/news/wire/shale_firms_face_investor_frustration-28-feb-2019-158273-article//?all=HG2
Seems investor trust rate in the shale play are free falling also in the Permian. When the sweet spots are starting to be fully utilized every barrel of shale oil will have increast cost, depleation rate will increase. In addition it seems they planned 1000 wells each Acre and end up with 600 wells.. to get same flow from the child wells as mother wells. This strongly indicate lack off investment , more DUC’s and reduced number off riggs . With WTI in range 50-60 usd/bbl US shale will peak in 2019.
You misread it Freddy. The word was “acreage”, not “acre”.
“You’re getting data points every quarter from companies where they talk about, ‘Gee whiz, I thought I could drill 1,000 wells on my acreage and it turns out I can only drill 600 wells on my acreage’ because of, essentially, parent-child issues,” he added.
But thanks for the link, it was interesting. Actually they get from 4 to 16 wells per square mile, 640 acres.
The Permian Basin by the Numbers
Shell likes to drill between four and eight wells per section, but, notes Gerges, other companies are “more aggressive,” poking as many as 16 wells into a given square mile.
But they don’t get near than many wells per square mile in the Bakken.
Digging Deeper into the Bakken: The Three Forks Oil Formation
At first, producers drilled Bakken wells on 640-acre spacing, one per square mile. Then they moved with good success to 320-acre spacing. With shale formations, the worry is that wells drilled too close together tap into the same oil and limit each other’s productivity. (The industry says that wells are communicating.) However, this year operators started to test 160-acre spacing – and met with great success in some areas.
The thickness in depth of that field is known. It varies geographically but the varying that takes place is known.
It certainly seems likely that the volume of rock containing oil in one of these 640-acre chunks of land should be measurable, not estimated, given this communication event. The thickness is 150 to 250 ft. This represents a known volume of rock.
Surely those guys at those companies who are observing when communication takes place on adjacent wells over a known amount of acreage and a known thickness of oil-bearing rock beneath . . . This really should not be EUR. It should be calculated ultimate recovery.
Interesting developments in Saudi oil exports:
https://oilprice.com/Energy/Crude-Oil/Saudi-Arabia-Oil-Exports-To-US-Nosedive.html
Yes, except some tanker tracker sources say Saudi exports are up again in Feb (overall, not especially to the US) and contango once again forming in Brent. Oil prices are nosediving today. The conflicting and inaccurate information provided is just why it is difficult to say anything about what is happening in the market – but I have to say this massive uncertainty building smells like Trump’s making. Negotiating for the win…, until the balloon bursts.
I think there are a lot of people that need a delusion check. Because a surpluse of oil is adovcated by “western trustable sources” against the natural investment circle of the oil industry does not automatically mean that the market balance is under control; it is in fact never going to work. The whole “political play” going on now seems to be Trump pressuring Saudi Arabia (and OPEC) for the assumably extensive spare capacity that they have. But the problem is, the reality is high oil prices were needed to avoid a defecit in the whole scheme of things. I still guess reality will be hard late 2019/20 as has always been my prediction.
It is difficult to change my mind about the oil market; after all it is not supersonic speed in this mature market. The digitalisation of data gathering (seismic and resovoir control) together with horisontal wells represent probably huge gains and I would guess alone can explain why for example Russia has been doing so well the last decade. The next point is that the world is not running out of oil yet, but potential oil reserves are not under western control (most potential reserves are in Africa, Middle East, Ex USSR countries and the Arctic). And that makes for an unstable political future between the west and the rest of the world.
To avoid blackmail when it comes to oil the future; sooner or later there is going to be a transition to natural gas (for some decades) and renewables in the West and Asia first. That is how the story goes in my view. The transition to renewables is most likley not going to be smooth, but hurt someone (some part of the population and some countries maybe). Interesting future…energy and other resources (e.g lithium, cobalt, nickel and rare magnet ingredients needed for batteries) are going to be even more in focus than today I guess.
Baker Hughes Weekly Rig Count
Oil -10 to 843
NatGas +1 to 195
California +3
Permian -7
http://phx.corporate-ir.net/phoenix.zhtml?c=79687&p=irol-reportsother
Alberta (AER) January, the first month of curtailment, crude oil production is at 3,409 kb/day down -268 from December (unrevised number)
(The revised Dec numbers don’t seem to be up yet but they never revise them by much, if at all)
Record high August 2018: 3,729
Average 2018: 3,490
Average 2017: 3,184
Chart: https://pbs.twimg.com/media/D0pL3zGX0AA-5yc.png
Change month/month 1000 barrels per day
Light & Medium -12
Heavy & Ultra Heavy -2
Condensate +1
Non-Upgraded Total -296
Upgraded Production +40
Total Production -268
Chart: https://pbs.twimg.com/media/D0pML34X0AEGN8E.png
Alberta (AER) January closing inventory 69,091,000 barrels. Down -4,603,000 barrels from December (-148 kb/day)
Chart: https://pbs.twimg.com/media/D0pM57QXQAE3opi.png
The IEA OMR had Canada penciled in for a -344 kb/day decrease in January (without NGLs)
As far as I understand it, this is almost no curtailment –> 2019-03-01 (Bloomberg) Alberta Eases Oil Output Curtailment as Prices Rise, Glut Wanes. Cap raised by 25,000 barrels to 3.66 million barrels a day. That was the second increase since start of curtailment.
Originally the curtailment baseline was the average of the 6 highest production months, at the time that was equal to 3,508 kb/day”
The record high (without condensates or NGLs) was 3.63 million b/day in November 2018. And so it’s just a cap now there’s no curtailment…
(Alberta) Starting in April 2019, Alberta is increasing production to 3.66 million barrels a day of raw crude and bitumen – a 100,000 barrel per day increase from the January limit. This does not include pentanes or natural gas liquids.
Since the production limits were introduced, we’ve amended the formula that determines how to allocate space under the production limit. Starting in February, each company’s baseline production level will be based on its highest level during their best single month from November 2017 to October 2018. This is a change from the original formula where the baseline was established on a company’s highest six-month average over the same time period.
https://www.alberta.ca/protecting-value-resources.aspx
Bloomberg chart for Russian production up to February
https://pbs.twimg.com/media/D0owP7DXQAA2957.jpg
In this 4Q presentation from EOG Mark Papa answer some questions from investors , other intresents and it seems now they have started listening and accept reality . He dont see any growth in their production in a WTI 55 usd world , and he believe WTI price need above 75 usd bbl before they will have money to invest in more Acre that seems already to exspensive in Areas with ootential. When they have small acres they can not drill 2 miles latherals but use 1 mile that increase cost each barrel.
He also considder EOG as the Company with the best Acre and they also have infrastructure to sell gaz as not need to flare it. Seems from this Pioneer most companies are struggeling , and lots off Company will be consolidated or bought, alternative bancrupted. Else he stated that in their Area considering as the best child wells seems to gett 20% increased decline rate compared to mother wells .
https://www.google.com/amp/s/seekingalpha.com/amp/article/4244404-centennial-resource-developments-cdev-ceo-mark-papa-q4-2018-results-earnings-call-transcript
Yes I think Mark Papa’s comments are worth reading
They’re waiting to see how much the OPEC cuts tighten the market and so remain unhedged
They don’t intend to pursue significant production growth in a $55 oil world.
He comments on other companies reporting of parent/child issues
Mark Papa, founder and former CEO of EOG Resources. Now CEO of Centennial Resource Development Q4 2018 Results – Earnings Call Transcript
https://seekingalpha.com/article/4244404-centennial-resource-developments-cdev-ceo-mark-papa-q4-2018-results-earnings-call-transcript?part=single
Anticipate a notable drop in Bakken production for the month of February when the numbers are released. February 2019 was the 2nd coldest February on record in Williston, North Dakota and the coldest month recorded there in 36 years. Average temperature was -4.5 °F, with 13 nights below -15 °F (preventing diesel from gelling becomes increasingly difficult at those temperatures).
Bob, do you think the record cold in North Dakota is due to global warming?
It could very well be due to climate change. There were a lot more warm records set in the last six months than cold records. But extreme weather is happening all over the world. That is the epitome of climate change.
Australia experiences hottest summer on record
You remind me of Senator Inhofe.
Senator Throws Snowball! Climate Change Disproven!
If Archie had an ounce of genuine curiosity, he’d find that explanations abound:
Jennifer Francis: Crazy Weather and the Arctic Meltdown
The cold was probably more of an organic development. The initial catalyst was a strong sudden stratospheric warming event in December. After that, the ENSO setup this year may be why the jet stream was positioned in an ideal way for cold air intrusions, and the cold was presumably amplified due to being in a solar minimum. Lastly, an abnormally deep and widespread snowpack over the region prevented the Arctic air from modifying as quickly as would have been the case if there had been limited snow or bare ground.
In This Oil Boom Town, Even a Barber Can Make $180,000
By Christopher M. Matthews and Rebecca Elliott
https://www.wsj.com/articles/in-this-oil-boom-town-even-a-barber-can-make-180-000-11551436210
West Texas has seen its share of oil booms, but the people there say this one is unlike any they’ve seen.
Driven by shale drilling, a gusher of crude production has transformed the Permian Basin into America’s hottest oilfield, turning what was a remote stretch of towns spread among mesquite trees and scrubland into an industrial zone, seemingly overnight.
Fortunes are being made in this fracking-related gold rush, and money and workers are flooding in. But many necessities in the area now cost a small fortune, creating opportunities for businesses selling everything from dipping tobacco to sand for fracking. It can be hard to get a haircut, grab a plate of good Texas barbecue, or find a table at a popular bar, because demand outstrips supply. Housing is scarce and hotel room prices sometimes rival those of New York City at more than $500 a night.
Oil prices have fallen about 25% since October to around $57 a barrel. But West Texas residents are hopeful the boom won’t go bust soon because companies have pumped billions into building out the oilfield, and drilling is not expected to peak for years.
The Permian produced an average of more than 3.9 million barrels per day as of January, according to the Energy Information Administration. Analytics firm IHS Markit estimates Permian production could top 5 million barrels a day in 2023, surpassing Iraq.
It is interesting to note the entire shale boom owes itself to easy credit and easy tax policy.
For example, Pioneer Natural Resources, one of the largest Permian producers, has managed to rack up $4.2 BILLION in net operating losses from 1/1/2012 to 12/31/2018. This was achieved through easy Wall Steet debt and equity, plus Federal Tax laws which have allowed Pioneer to pay almost zero cash federal income taxes from 2012 through 2018. Given the huge NOL carry-forwards noted above, it is doubtful Pioneer will pay any cash federal income taxes for at least another decade, unless it stops drilling and oil prices spike.
In fact, the story is similar for almost all shale E & P in all US basins. Multi billion dollar net operating losses have also been incurred by the likes of EOG, Concho, Continental, Whiting and Apache, just to mention a few. Read CLR’s conference call recently, where CEO Harold Hamm states that NOL carry-forwards will wipe out the company’s cash income liabilities for many years.
The juniors, such as Diamondback, QEP, Oasis, etc also have net operating losses, which have also caused them to pay almost zero in Federal income taxes for many years. However, as they are smaller companies, their NOL’s are only in the hundreds of millions of dollars, instead of billions.
I don’t think most people realize shale pays almost no federal, nor state income taxes, and won’t for a long time. Elimination of corporate AMT effectively sent cash tax bills to zero for all of these names.
So, Wall Steet and taxpayers are subsidizing the $180K barber.
I suspect if a Democratic Green wave hits the White House and congress in 2020, there will be elimination of IDC expensing. If this were to occur, plus large limits to NOL carry-forwards, the shale story will be over.
Us little stripper folks won’t like to lose percentage depletion, which I am sure will also occur. But, assuming that Democratic Green Wave hits, expect
A. Elimination of IDC expensing.
B. Drastic changes to net operating loss carry-forward rules for the fossil fuel industries.
C. A dramatic drop in rig count and a dramatic drop in DUC completions.
D. A dramatic drop in US oil production (possibly as much as 2 million BOPD by the end of 2021).
E. An oil price spike over $100.
G. World wide economic slow down.
Just a prediction. But I think it is either completely unknown, or underestimated by most, how big of a part IDC expensing has played in the shale boom, especially 2012 and later.
I admit I didn’t realize it myself until I started reading some notes buried in the middle back parts of the shale 10K’s in the past week or so.
These huge NOL’s could be why we don’t see the integrated majors snapping up the shale independents. It appears change of control rules cause the integrated companies to lose the ability to use the shale NOL’s to offset the integrated company income. That is just a guess on my part, but it makes sense to me.
I went back and looked at some independent company 10K pre shale boom. There were NOL’s at times, but they were nothing in magnitude to what we see now.
For example, in I think 2005 or 2006, PXD had production of about 100K BOEPD and incurred a NOL of about $100 million. As oil prices rose, they used it up, and as of 12/31/2011, had zero NOL carry-forwards. From 2012-2018, PXD has consistently added NOL, particularly from 2015-2018, where the number rose from $1.2 billion to $4.2 billion.
The NOL carry-forward figure comes straight from the Form 1120 that each company files with the IRS. So, this is not fluff, these companies are truly overspending this much.
However, for the EV folks, sorry to say but EV tops shale when it comes to net operating losses.
As of 12/31/2018, Tesla has $7.30 BILLION of net operating loss carry-forwards.
Of course, unlike shale, Tesla also receives direct tax payer supported payments and buyers of its products also receive large taxpayer supported discounts, dependent somewhat on the state the buyers live in.
So, don’t get any ideas that EV’s financially compete with ICE, at least not yet.
Hi SS,
Personally I believe there will be a very good market for all the oil you and your kids, if you have kids in the business, can produce until they hit retirement age.
And while oil companies aren’t getting much in the way of direct subsidies these days, they have gotten plenty , over the years, indirectly. Tesla’s will run on roads built with tax money, just like conventional cars, but conventional manufacturers and oil companies have been making out like bandits for going on a hundred years due to vastly more money being spent on roads and road related public infrastructure than has been paid in fuel taxes.
The conventional fleet isn’t going away until it’s worn out, and it costs more to maintain an old car than it does to buy a new one. That’s not going to happen for at least twenty years, probably thirty years in my estimation.
All sorts and kinds of industries get subsidies, direct and indirect. I don’t generally approve of them, but in the case of electric cars, I do, because I’m VERY afraid that the real issue with oil, equal to the pollution issue, is that we may fight WWIII over access to what remains of it. Nobody will be paying much attention to climate if the nukes fly, and just a handful of rogue biologists decide to turn loose their dogs. In another ten years, any biologist specializing in genetic engineering with access to a good university teaching lab will probably be able to whip up something capable of killing people by the millions.
And while WWIII may be fought with weapons not yet invented or at least not yet publicized, the next war after that will be fought with sticks and stones, spears and swords.. there’ll be plenty of old car springs and axles that can be hammered into swords and spears.
Oil is going to leave us, it doesn’t grow back like potatoes and peanuts, and we have already been at war over access to it for going on a century now, sometimes hot, sometimes cold, but history books will describe the last century as one dominated by access to oil, to a very substantial extent.
The rats (people) are in the (oil) corn crib, and the oil rat population is increasing fast, while the fixed amount of (oil) corn is being used up fast.
The way the arithmetic works out is that when the shit hits the fan, it will hit hard and fast with only a little warning.
A so called Seneca Cliff is a VERY real possibility.
This cannot possibly end well, unless by some miraculous stroke of luck we find affordable ways to give up our oil habit within the next generation or so.
Politics is the art of the possible, and the only solution I can see that’s even remotely possible, politically, that we can give up SOME of our need for oil is to go electric in transportation as fast as we reasonably can.
The number of cars that will get electric vehicle subsidies under current Yankee law is trivial, in relation to the number of cars sold every year. But these subsidies are helping the ev industry and tech grow up fast, so it will be bigger and stronger and cheaper, later on when we are going to REALLY need it.
The six biggest manufacturers, combined, can get a federal subsidy for only a million and a half cars. That’s it, under current law. That’s less than ten percent of the number sold in ONE year, total, forever, unless new subsidies are put into place.
In the meantime, I strongly urge everybody to pray to the Deity of his or her personal choice that we don’t run short enough of oil that we DO wind up fighting WWIII for access to whatever is left at the time the fight for it turns hot again.
Oil is the life blood of industrial civilization. We must forget this fact, and we must not forget the equally important fact that oil will inevitably run short, with consequences so awful words cannot describe them…… unless we have a substitute ready to go AT SCALE.
OFM- this bears repeating (although I think he intended a ‘not’ as the third word in the second sentence)
“Oil is the life blood of industrial civilization. We must forget this fact, and we must not forget the equally important fact that oil will inevitably run short, with consequences so awful words cannot describe them…… unless we have a substitute ready to go AT SCALE.”
Amen. [says the non-believer]
Back in the 70’s and 80’s there were lots of public and private limited partnerships which effectively transferred the IDC and percentage depletion to the limited partners. There were a lot of uneconomic Sprayberry wells drilled back then. The odd thing about the uneconomic horizontal wells being drilled today is that most of them do not transfer the tax bene’s to the investor, they just accumulate.
dc
I have read about those.
I’ll bet none of those ever kicked off IDC deductions in the billions.
NOL rules were changed as part of the reduction in corporate rates. Can now only offset 80% of operating income, but instead of a 20 year period, they can be carried forward indefinitely.
Of course, since none of these companies ever have operating income, they just build and build.
I guess what has hit me after looking at this is the magnitude. Some have NOL carry-forwards that are more than company market cap.
I also think there is a good argument to be made that public companies should disclose taxable imcome per share, in addition to GAAP.
I wish you had a wider audience, shallow. Think about writing a piece on this for Seeking Alpha maybe. Or Zerohedge?
Greenbub.
Wish I had the time. But I have a lot going on most of the time.
Also, the tax stuff gets very complex, and I always worry I’m not completely on top of it.
Just think the net operating losses are something that should at least be acknowledged.
Thanks for the kind words.
Hi Dennis and Ron,
I enjoy Bob Frisky, he’s the funniest guy posting here, for now.
But in accordance with the established policies of this site, he should be banned from the petroleum thread, but allowed to post on the non petroleum thread.
I suppose he would need a new email address or at least a new handle, but simply adding one letter to his present handle would do it.
Diesel prices are rising back up to their 2018 averages.
Delhi Retail Petrol Price (Rupees/Litre)
March 02, 2019: 71.94
2018 Average 75.61
Delhi Retail Diesel Price (Rupees/Litre)
March 02, 2019: 67.27
2018 Average 67.47
https://pbs.twimg.com/media/D0wc75hXgAAhAX9.png
Eurozone Retail Euro-super95/Gasoline (Euro/Litre)
February 25th: 1.398
2018 Average: 1.473
Eurozone Retail Automotive gasoil/Diesel (Euro/Litre)
February 25th: 1.339
2018 Average: 1.338
https://pbs.twimg.com/media/D0wdVgHW0AA8zHh.png
EIA Weekly U.S. No 2 Diesel Ultra Low Sulfur (0-15 ppm) Retail Prices (Dollars per Gallon)
February 25th: 3.048
2018 Average: 3.18
https://pbs.twimg.com/media/D0wdkmfXgAwXYWc.png
Investors are growing impatient with even the largest oil companies, as the FT reported. In the short run, low oil prices, and the threat of higher U.S. shale supply, completely saps investor enthusiasm around the oil industry. But in the long-term, the prospect of peak oil demand is an even larger problem. A deceleration in demand growth, and, ultimately, a decline on an absolute basis, throws into question the valuations of multinational oil and gas companies.
At worst, the majors may not be able to produce all of the oil and gas reserves on their books, and the amount of “stranded assets” could balloon if governments eventually get serious about addressing climate change.
https://oilprice.com/Energy/Energy-General/Activist-Investors-Force-Change-In-The-Oil-Industry.html
The $32 Trillion Push To Disrupt The Entire Oil Industry
Global oil and gas companies are increasingly facing an uphill battle as global warming policies are taking their toll. Most analysts and market watchers are focusing on peak oil demand scenarios, but the reality could be much darker. International oil companies (IOCs) are likely to face a Black Swan scenario, which could end up being a boon for state-owned oil companies (NOCs).
Increased shareholder activism, combined with global warming policies of institutional investors and NGOs, are pushing IOCs in a corner, constricting financing options for oil companies.
The first signs of a green revolution in the shareholder-investors universe are there, as investors have forced Dutch oil and gas major Shell to officially change its strategy, investing in more renewable energy and energy storage. The Dutch IOC wasn”t forced by to do so because of mismanagement or a lack of reserves but due to a well-orchestrated investor/stakeholder offensive. Several other peers, such as BP, ENI or Total, are expected to experience comparable situations.
http://321energy.com/editorials/oilprice/oilprice022819.html
Someone above quoted oil sands production excluding NGLs.
So I did a bit of digging. The most prominent quote is one third of all Canadian natural gas consumption is involved with oil sands. The gas heats up water for steam and helps deal with the bitumen. 1/3 is a lot.
But what I was really curious about is to what extent natural gas is found around the oil sands in the context of geology. It would all derive from the mid Cretacious or whatever Western Interior Seaway that stretched from there down to Texas. But the maps do not suggest there is gas near the oil sands fields. It appears to be piped in from elsewhere.
I think I would expect that, though I don’t know why.
Watcher,
The Montney formation in NW Alberta and adjacent BC is gas-rich and I believe it has been a source of supply. You can check. I do know that both the Montney and the neighboring Duvernay have been seeing a lot of attention and development from majors and juniors both.
The Alberta Deep Basin is also a source of NG but that one I know nothing about.
I suppose I was not clear about my curiosity. When I said gas nearby I meant gas geologically related to the oil sands. Not so much gas created from completely different rock.
The locations you provided, and thanks, would not be part of the same rock. They are somewhat distant.
The concept is API degrees of produced liquid. The bitumen is very low in API number, and any liquids from those gas fields would be very high in API number. So one would not expect the same rock to produce both.
Or something like that.
Behind a paywall but looks interesting.
Shale Companies, Adding Ever More Wells, Threaten Future of U.S. Oil Boom
Newer wells drilled close to older wells are generally pumping less oil and gas and could hurt output, leading frackers to cut back on the number of sites planned and trim overall production forecasts.
Shale companies’ strategy to supercharge oil and gas production by drilling thousands of new wells more closely together is turning out to be a bust. What’s more, the approach is hurting the performance of older existing wells, threatening the U.S. oil boom and forcing the maturing industry to rethink its future.
To maintain America’s status as an energy powerhouse, shale companies in recent years have touted bunching wells in close proximity, greatly increasing the number of wells…..
And that’s all I could read without a subscription.
Looks like an interesting article, especially in the context of the previous WSJ article, “. . . . as the industry struggles to attract investors after nearly a decade of losing money.”
If anyone can add to this story it would be appreciated.
Thanks to Jeffrey Brown for the link.
Ron.
Read Mark Papa’s comments which are in links above.
Papa was formerly the boss at EOG and is considered one of the key leaders of the US shale boom.
Think shale play status is now significant and growing sceptical from investors wall street that have payd the losses so far and not seems to get back what was promized. Shell desided to sell huge acres becaus they see money could be used with more interest elsewhere. The best companies like EOG need 75 usd each bbl before they could pay divodend to shearholders acc. to Mark Papa and I believe this might increase every year. What now happens will soon force Saudi to open all up their cranes … Donald Trump have made it clear WTI 55 usd is to high… think the summer in Shale Play will be very hot….
Shallow, it would be interesting to see disclosures of taxable income, but I think it would be a major problem to come up with the basic info on a timely basis. Usually taxable income is determined after extensions, and in some cases actual taxable income is very different from financial tax accruals.
CLR reports ttm profit 2 of last 4 yrs
ditto EOG
Whiting profit last year, loss previous 3
Oasis profit 2017, loss the other 3 of 4
this is all trailing twelve months, not fiscal year
2019-03-05 (ShaleProfile) Permian – update through November 2018
https://shaleprofile.com/blog/
2019-03-05 (Bloomberg) Permian Watch: Chevron has significantly upgraded its guidance for Permian shale oil and gas production, reaching now 900,000 boe/d by 2023 (previous guidance was 650,000 boe/d by the end of 2022 — that’s the dotted line on chart)
Chevron chart: https://pbs.twimg.com/media/D05bD0TXgAEZoaS.png
March 5, 2019 (Houston Chronicle) Exxon, Chevron plan to dominate Permian, grow as others cut back
Both Exxon Mobil and Chevron said they will each churn out close to 1 million barrels of oil equivalent a day just from the Permian by 2024. That’s nearly triple Chevron’s current output and about quadruple what Exxon Mobil is pumping out. Both already rank near the top of Permian producers.
The two Big Oil giants are advantaged because of their scale with large acreage positions, greater access to pipelines and guaranteed sales to their own refineries along the Texas Gulf Coast.
https://www.chron.com/business/energy/article/Exxon-Chevron-plan-to-dominate-Permian-grow-as-13663733.php
From OilPrice.com
Be Wary Of Unrealistic Shale Growth Expectations
Suddenly, there is evidence that the industry is running into a wall. The Wall Street Journal reported that shale wells placed too close together are starting to report unexpectedly disappointing results. The thinking is that the wells are interfering with each other. Adding more wells seems to be reducing the productivity of all the wells situated in close proximity. This so-called “parent-child” well problem, in which additional wells (the “child” wells) undercut the performance of the original well (the “parent”), may be the beginning of a larger problem with the shale industry.
The WSJ says that some of the newer wells are producing as much as 50 percent less than the parent wells. Ultimately, when all is said and done, adding more wells may actually result in less oil and gas recovered since the pressure drops and the reservoir suffers damage. Not only are child wells less productive than the parent, but they actually cannibalize production from the parent wells by sapping reservoir pressure and in some cases flooding the parent well with fracking fluids from the child well.
For instance, wells placed 375 feet apart may produce 28 percent less than wells produced 600 feet apart, the WSJ analysis finds. The figures grow worse the more the wells are packed tightly together – placing them only 275 feet apart results in a 40 percent decline in output relative to those placed 600 feet apart.
But companies can’t simply space out the wells and still achieve the same production targets. They have finite acreage, sometimes carved up in a patchwork, so it’s not always possible to simply stretch out the same number of planned wells over longer distances.
In other words, the parent-child well problem may mean that companies will have to drill fewer wells than they had anticipated. That means that they could be facing “an industrywide write-down if they are forced to downsize the estimates of drill sites they have touted to investors, some of which promised decades’ worth of choice spots,” the WSJ concluded.
There are enormous ramifications for this problem. The valuation of shale E&Ps is based on forecasts for long-term production. As the WSJ reported in January, many of the rosy production forecasts from shale drillers over the past few years have not come to fruition.
But the implications stretch beyond the share prices of individual companies. Medium- and long-term oil market forecasts depend very heavily on robust U.S. shale growth. In other words, global supply 5 and 10 years from now will be affected by the parent-child well problems. A study by Wood Mackenzie found that the Permian could undershoot expected growth by 1.5 million barrels per day.
https://www.ogj.com/articles/2019/03/exxonmobil-plans-to-produce-1-million-boe-d-in-permian-by-2024.html
I see that Exxson se 10% profit at their Permian activity with oil price WTI 35 usd bbl. They will continue to invest as production is supposed to reace 1 mill bbl in 2023. EOG Pioneer believes they have some of the best acres and dont see any profit or increase in a 50.usd bbl world. They had also good gaz handling and no need for flaring to get rid of it. It will be very i teresting to follow with Exxon suxsess in permian in the year to come.
So shale oil is all about infill drilling just like the Middle East.
No, that is not what the article is saying. They are just saying that wells placed closer together produces less oil per well. They still get more oil overall. But because more wells are required that produce less oil per well, the oil cost a lot more to produce.
There are undrilled fields in the Middle East. However, in the vast majority of cases they are just too small to be economical, especially in Saudi Arabia. The Middle East has tiny fields scattered all over the desert. Laying pipelines for water in and oil out would, in most cases, cost more than the limited amount of oil would bring.
However even if that limited amount of oil does become economical, due to the rising oil price, it would be too little to make much difference.
It’s more a reality check on the total resource recovery estimates that stem from multiplying tightly packed well counts by best performing rigs in best performing rock. I don’t think many people really believed it was anywhere near that simple, but that’s what was being sold by both the frackers and the EIA.
Now this sounds more like real oil wells.
“Reports that Libya’s National Oil Corp. restarted limited production at its giant Sharara oil field, after the removal of gunmen who had occupied the field for three months. The Wall Street Journal reported “that the two wells at the Libyan field, which normally pumps 315,000 barrels a day, or nearly a third of the country’s average daily output, reopened late Monday, the person said.” Phill Flynn.
And that is some of the best oil on the Planet.
Scientists will identify “gas mounds” dangerous for local residents in Yamal
March 05 / 08:32
Tyumen. Experts plan to predict the appearance of new gas emission funnels on Yamal. They are dangerous for the indigenous people – migrating in the area of reindeer herders, and for buildings.
“Territories with a large number of wells, drilled both during exploration and exploration of deposits, and directly for construction, are likely to“ relieve ”gas pressure, form elevated permeability zones to the surface and thus reduce the risks of uncontrolled avalanche-like methane release,” Doctor of geological and mineralogical sciences of TSU Marina Leibman.
They made a map of the forecast of the danger of the formation of “bumps” on the basis of a medium resolution satellite image. But there are shown only large areas in which, by a combination of factors, the danger of their occurrence is high, the press service of the TSU reports. Among the factors are shallow occurrence of stratal underground ice and a significant concentration of methane in the upper horizons of rocks. However, the main method of searching for specific hazardous areas is still the search for “gas” mounds – those positive landforms that formed on a variety of surface elements, but grew in a short time (several decades).
As Marina Leybman explained, the dynamics of mounds-predecessors of well-known gas emission funnels has already been traced from materials of space images. It turned out that for 40-43 years, the mounds increased in size by about 2 times – from about 20 to 40 m. Experts plan to supplement the morphometric indication signs of the predecessor mounds with their spectral characteristics. In addition, in the tasks there is a morphometric analysis of digital elevation models to search for objects similar to these mounds, as well as an adjustment of the existing landscape mapping techniques for analyzing the danger of manifestation of cryogenic processes and mapping the depth of ground ice.
From here: http: //www.angi.ru/news/2869525-%D0%A3%D1%87%D0%B5%D0%BD%D1%8B%D0%B5-%D0%B2%D1%8B% D1% 8F% D0% B2% D1% 8F% D1% 82-% D0% BD% D0% B0-% D0% AF% D0% BC% D0% B0% D0% BB% D0% B5-% D0% BE % D0% BF% D0% B0% D1% 81% D0% BD% D1% 8B% D0% B5-% D0% B4% D0% BB% D1% 8F-% D0% BC% D0% B5% D1% 81 % D1% 82% D0% BD% D1% 8B% D1% 85-% D0% B6% D0% B8% D1% 82% D0% B5% D0% BB% D0% B5% D0% B9-% D0% B3 % D0% B0% D0% B7% D0% BE% D0% B2% D1% 8B% D0% B5-% D0% B1% D1% 83% D0% B3% D1% 80% D1% 8B- /
Inventories about level, crude oil up and products down.
Line 13 Adjustment at +700 = there must be something wrong somewhere ??
U.S. Petroleum Balance Sheet
EIA pdf file http://ir.eia.gov/wpsr/overview.pdf
Saxo Bank chart summaries
https://pbs.twimg.com/media/D0_GE40XgAEmqMe.png
https://pbs.twimg.com/media/D0_HsWXX0AAQ3Uk.jpg
Oilytics chart summaries
https://pbs.twimg.com/media/D0_HG_hWoAEzjMS.jpg
https://pbs.twimg.com/media/D0_KRFAXcAEgz2l.jpg
Exxon announced this morning a big gas find off Cyprus. 6ish Trillion cubic feet of gas. (being called a resource, not anything more certain than that)
14,000 ft depth in 6000 feet of water. Exxon owns 60% of it, Qatar Petroleum owns 40%.
Exxon making cautious noises. Cyprus govt is already spending the money.
Can’t find anything about typical recovery factors for offshore gas. 60%? Flow rate typical for finds like this, also not clear.
EU hyping less GAZPROM dependence, Europe total consumption last year was 51 billion cubic feet oops, that’s 51 billion cubic feet PER DAY, so 19ish trillion cubic feet for the year.)
Touted as the 3rd largest gas find of past 2 yrs.
Didn’t realize Europe consumption so high. This ain’t much.
As I read it is not sure if this gaz field could ve developed. This in a disputed Area between Tyrkey and Cyprus. Some year ago They also drilled in that area and when they should move to new location the drill ship was forced to leave the Area by Tykey marine. It will also bee need to invest in huge gaz prosessing plant….
To put that 6 Trillion cubic feet in perspective, Pennsylvania alone is expected to produce 7 Tcf in 2019.
Combining the output from West Virginia and Ohio, 2019 Appalachian Basin production is on track to exceed 11 Tcf.
Over 10 Bcfd in additional pipeline capacity is currently being built or has already been permitted.
The amounts of gas coming from the Permian, Oklahoma, and the Appalachian Basin are in the early stages of upending the word’s energy markets as the innovations surrounding LNG ensures that this energy source will be utilized throughout the world.
This may even include Australia as there are now proposals to construct up to 5 LNG import terminals using FSRUs.
So this field only contains the gas of one US state and represents what, about 1/3 of one year of Europe consumption.
What’s the point. Looks like a non event to GAZPROM.
The new (past 7 yrs) underwater gas fields in the discovered in the territorial waters of Eqypt (the largest), Israel, Lebanon, Palestinian Territories, Syria, Cyprus and Turkey may not be massive on the scale of a Gazprom or Marcellus, but they are very big news for these countries. Domestic supply of gas for the next decade or three gives them time to work on the transition to beyond fossil fuel.
The combined resource is estimated to be greater than 35 Tcf.
Hi Watcher,
According to BP Statistical review 2017, the USA consume above 70 Bcf per day. Per inhabitant, it seems US citizens (and industries) consume twice as much as EU. Note it is about the same for oil and coal.
EU population: ~510 million
US population: ~329 million
Note that according to IEA, in 2017, renewable consumption was 10.2% of the total consumption in the US while 17% in the EU.
Peak Oil is not the problem it was 15 years ago.
In 2005 when the subject of peak oil was hitting the headlines there were real concerns it would damage the world economy. Today however there are real alternatives to oil and can be rolled out quickly enough to make up for any decline in oil production.
15 years ago there were no electric vehicles to speak off which could replace an ICE car on a practical level. Today there are quite a few, and the number is growing at a prodigious rate.
https://www.autoexpress.co.uk/best-cars/electric-cars/86169/best-electric-cars-on-sale
LNG trucks have improved a great deal over this time and could easily replace all trucks driving on diesel.
https://www.volvotrucks.com/en-en/trucks/volvo-fh-series/volvo-fh-lng.html
LNG powered ships are now a much better proposition than bunker fuel ships.
https://www.lngworldshipping.com/news/view,big-boys-join-the-lngfuelled-fleet_51714.htm
https://www.lngworldnews.com/south-korea-to-back-construction-of-140-lng-powered-ships/
Peak oil was only ever a problem if there were no alternatives to oil. This is no longer the case.
All that fuss over nothing.
I see that you’re not in the subject. Electric cars are a joke. There is not enough natural gas for CNG trucks, and there is not enough natural gas to power ships. And it’s all more expensive than oil. Every year we have new oil consumption record. One year with lower oil consumption rate was 2009.
Podpis
This could be an instructive learning moment should you choose to spend a few minutes reading about this stuff.
Start with the ‘fast ferries’ that are rolling out of US, Australian, and Norwegian shipyards for a starter.
LNG fueled, these fast movers use reciprocating engines with the LNG stored/replaced with modular cylinders that are easily swapped out dockside.
Not only is this way cleaner than traditional bunker fuel, this design is leading to a resurgence of water borne transportation in different parts of the globe.
Early days, yet.
Your use of “CNG trucks” may have been meant to be “LNG trucks” as only short run garbage trucks and busses currently use CNG.
LNG is actually spreading on over the road applications as there is more ability to carry the heavy, bulky LNG tanks onboard.
Car transportation may well be adopted via CNG when storage tank issues are resolved, (MOF technology is almost at this point right now).
Your statement regarding cost is 100% off the mark.
The heat energy available in natgas form that costs about $17 is equivalent to oil based heat energy costing $56.
There is enormous incentive to capture that economic spread.
Regarding supply … you would need to do only a minimal amount of checking to see the vast, vast amount of gaseous hydrocarbons known to be recoverable across the globe.
Podpis- “Electric cars are a joke.”
I know people who drive all over, but haven’t been to a gas station in years. Its a good joke for them, not a tragic one. You are so 1990’s.
Even if 100% of cars were electricity powered, 63.5% of that power would still come from fossil fuel.
U.S. electricity generation by source, amount, and share of total in 2018
Ten years ago, back in 2008, when the first Tesla cars, the two seater Roadsters, were just beginning to roll off the “production line” the situation was even worse. The share of electricity being generated by FF was about 71%, with 48% being generated by coal.
In another couple of years we could easily see coal’s share falling below 24%, half of the 2008 share. It is also likely that the FF share will fall below 60% by 2025 so, things are moving in the right direction. Things just need to happen a lot faster if the aim is to “make up for any decline in oil production” when Peak Oil finally happens.
Robert Hirsch wrote in his 2005 Hirsch Report that, a crash program to transition the worlds transportation fleet away from oil needs to start twenty years before the peak to avoid fuel shortfalls. I wouldn’t call the current pace of the transition a crash program but, if you take 2008 as the start, if oil production peaks before 2028, there will be fuel shortfalls according to Hirsch. Replacing the ICE fleet with EVs (100% EVs) in time, is still looking like a very daunting challenge.
Looking at the data from the EIA’s latest Electric Power Monthly if the estimated output from distributed PV installations (not utility scale) is included, the share generate by solar climbs to 2.3%. This “Estimated Total Solar” is the figure I use in my report on the EPM because, it seems somewhat unwise to ignore one third of the output of a particular source.
Sure Ron.
But of course it varies with your location.
Some states have close 100% fossil fuel derived electricity.
Others have high percent of renewable electricity.
Biggest state in the country- [47%]
Lets consider states that start with ‘I’- [percent renewable]
Indiana [6%]
Illinois [7%]
Iowa [39%]
Idaho [82%]
These figures do include large hydro in the renewable category, but not rooftop solar or nuclear power.
Nahhh, 32 percent of EV owners have PV on their roofs.
Last night (March 6), Tesla launched their new DC fast charger, Supercharger v3. It will facilitate adding 200 miles of range in less than fifteen minutes when the battery is close to empty. The aim is to redeuce the average time spent per car at these charge points from half an hour to fifteen minutes, LOL!
When one considers that this relatively tiny, fifteen year old company can manufacture 8,000 units a week (400,000 a year) at it’s existing factory, with another factory currently under construction in Shanghai, China targeted to be completed before the end of this year with an initial production rate target of 250,000 electric cars per year, it’s only a joke if you’re not likely to lose market share to Tesla.
Hugo- “Peak oil was only ever a problem if there were no alternatives to oil. This is no longer the case.”
Well, there is that little problem of time and space, and scale-
Time- Its takes time to transition- we may not have the time, given the lack of urgency and the unknown oil resource in places like the middle east.
Space- some places have plenty of oil, like Venezuela or Norway. Others have none, like Japan or Germany. Being from Europe, I would think you would be well aware of the kind of problems this can bring.
Scale- globally, it is questionable whether the job of energy replacement can get done. It takes a huge amount of money, material (such as copper), and energy to build-out the replacements for oil.
Hickory
You make some fair points. I have pointed out research that says we need to spend 10 times as much on renewables and electrification to avoid climate change. I think it is $2.4 trillion a year instead of $250 billion, difficult but achievable.
This would also avoid any effects of peak oil and gas.
The fact is alternatives are there. It is quite something else to be faced with problems where there are no alternatives.
https://www.youtube.com/watch?v=2zMN3dTvrwY&t=123s
We do not have alternative Oceans, nor alternative soils to grow wheat and corn.
Agree.
Anyone know the relative estimated recoverable total energy equivalent for oil and nat gas of
Permian/Eagle Ford vs Marcellus/Utica?
Hickory
Using the 2016/17/18 USGS assessments for the Eagle Ford, Spraberry, Wolfcamp (Midland sub basin), Wolfcamp and Bone Spring – at al – (Delaware sub basin), gives the following (rounded) numbers … oil 80 billion barrels, natgas 370 Trillion cubic feet, NGLs 24 billion barrels.
All Technically Recoverable Resources (TRR).
Using the 2011 and 2012 USGS assessments for the Utica and Marcellus would not be meaningful as the 120 Tcf TRR is grossly underestimated.
(Haynesville/Bossier is 300 Tcf. Small sample of Upper Devonian from 2017 USGS assessment is over 10 Tcf).
Most recent, comprehensive evaluation stems from the consortium led by West Virgina University which pegged Utica recoverable at just under 800 Tcf, comparable, in their words, to the Marcellus.
Using a combined number of 1,600 Trllion cubic feet, one can see how this compares with South Pars/North Dome, as well as other gas rich regions.
The Chinese and Argentinian shale gas potential is also enormous in size.
Baker Hughes (GE) International Rig Count
Total up +3 to 1027 in February
Oil +10 to 817
Natural gas -6 to 185
Misc -1 to 25
Split: Land -5 to 777 and Offshore +8 to 250
Offshore chart: https://pbs.twimg.com/media/D1E9NnXXcAIkQm4.jpg
Oil & oil production chart https://pbs.twimg.com/media/D1E93SVXQAEYc5o.png
(Total oil+gas)
Argentina -7
Ecuador -3
Indonesia +4
Iraq +5
Myanmar +3
Norway +3
Saudi Arabia -7
UK +3
http://phx.corporate-ir.net/phoenix.zhtml?c=79687&p=irol-rigcountsintl
Oilytics regions chart https://pbs.twimg.com/media/D1Ev9GJX4AA-vPV.png
Oilytics Account -> https://twitter.com/OilyticsData
As the conclusion to this post that is reported on Peak Oil Barrel states that 2018 was peak. A reversal to your argument against my prediction, but probably accurate. Although peak is not much of a peak, rather more of a plateau.