World Oil Production

A guest post by David Archibald

The views expressed in this post do not necessarily reflect the views of Dennis Coyne or Ron Patterson.

The BP Statistical Review of World Energy has oil production data by country up to the end of 2015. This is what that looks like from 1988:

chart/

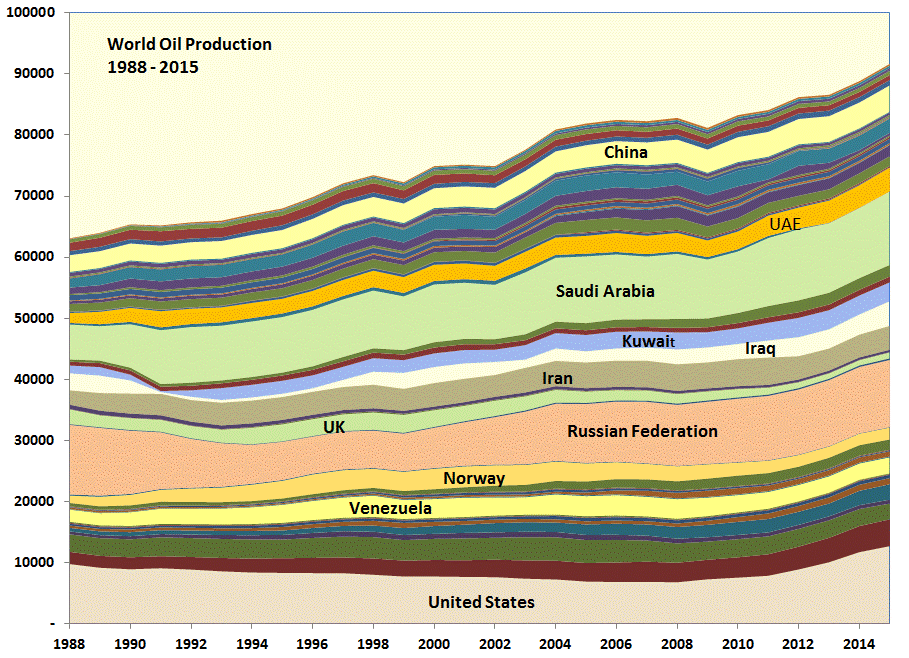
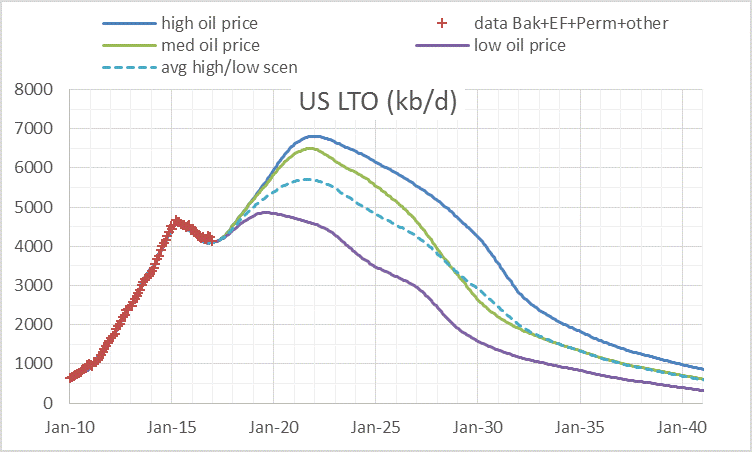
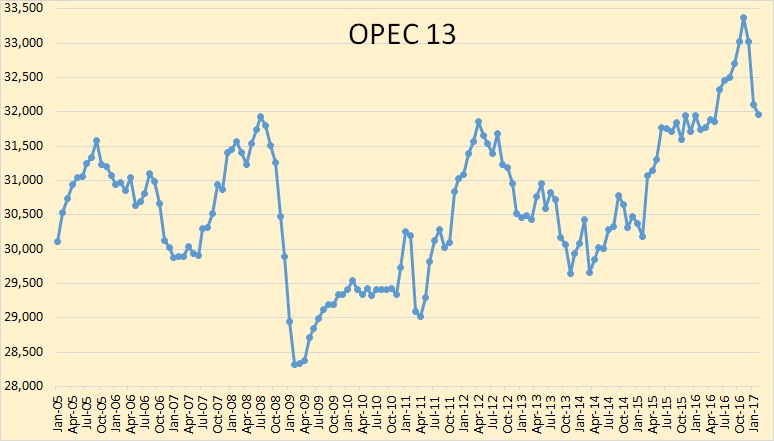
The United States increased production by 5.1 million barrels per day from 2010 to 2015. The increase in production from countries around the Persian Gulf over the same period was slightly less at 5.0 million barrels per day. The increase in total world production was 8.4 million barrels per day so the rest of the world declined by some 1.7 million barrels per day. This was despite Canadian production rising 1.0 million barrels per day from oil sands developments plus some other increases from Russia, Brazil, Colombia etc. Most oil producing countries are in well-established long term decline or plateau at best. How these trends will interact can approached from a bottom-up basis. To that end, the following graphs show likely production profiles by region for the next five years. Read More

Future US Light Tight Oil (LTO) update

In a previous post on US LTO future output there were suggestions that a bottom up approach might be better than the top down approach and I agree. I will attempt the bottom up approach here. The chart below is a quick summary, based on three different oil price scenarios (high, medium, and low). The dashed line is just the average of the low and high oil price scenarios. Data is from Enno Peters’ website shaleprofile.com and the EIA. (Click on “Tight Oil Production Estimates” for tight oil output data.)

chart/

Read More

OPEC February Production

The new January OPEC Monthly Oil Market Report is out with crude only production numbers for February 2017. All charts are in thousand barrels per day.

All data below is in thousand barrels per day and is through February 2017.

OPEC crude oil production dropped to 31,958,000 bpd in January. That was a drop of 140,000 bpd. In January OPEC production dropped 930,000 bpd for a two month total of 1,070,000 bpd.

Officially OPEC agreed to cut production by 1.2 million barrels per day beginning in January. So they are getting close.

OPEC’s November production of 33,374,000 represented an all time high for the Cartel.

Read More