This is a guest post by Javier
Javier holds a PhD in Biochemistry and Molecular Biology and has been a scientist for 30 years in molecular genetics and neurobiology. He wrote a blog on macroeconomy and investments from a cyclic point of view for over two years and currently writes a blog in Spanish about the economic crisis, energy crisis and climate change at http://www.rankia.com/blog/game-over/ . Javier goes by the name of Knownuthing on his blog.
Opinions expressed in this post are those of Javier and not necessarily those of the blog owner Ron Patterson. This post was translated from the Spanish by computer and may therefore contain some grammatical errors.
The Problem of the Human Population
The question of whether or not overpopulation in the world is clearly debatable. For starters there is no agreement on what should be the world’s population and is also clear that currently the world is able to withstand the seven billion people who live and there is little doubt that it can support more, as the number increases constantly.
However, there is concern for decades that in a finite world at some point should be the limits of the world’s population, and that may not be very smart to reach those limits. Although efforts to limit population growth in some countries like India or China, today these efforts have been abandoned or are abandoning were made in the second half of the twentieth century, mainly due to the pace of population growth is declining alone globally.
As in all matters based on the laws of nature, we can use science to analyze the problem of the human population. The science that helps us in this case is ecology, which has a specific branch of human ecology . Anyone who thinks that we do not apply the laws of biology, is that it has lost touch with the reality of human nature. For very rational to presume to be, we are still animals and not very rational forget.
1. How many and how fast we grow?
The world’s population at the time of this writing is 7,301,880,780 people on the face of the Earth. You can see the current figure on pagehttp://www.worldometers.info/world-population/
Seven 1300 million and growing at a rate of 1.1% per year, ie 80 million people each year , the equivalent of two Spains completely filled each year.
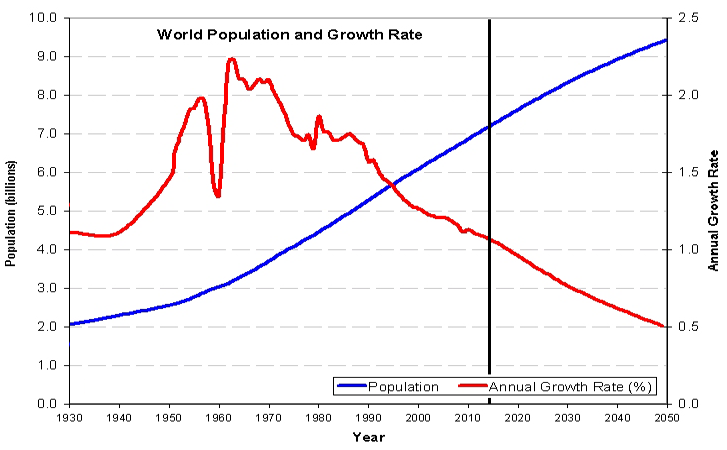 Fig 1 Growth of world population and growth rate estimates up to 2050. Source: World Population Data