World Oil Production, September Numbers

The EIA has published International Energy Statistics with Crude + Condensate numbers for September 2014. As most of you know I only follow Crude + Condensate because I believe that biofuels and natural gas liquids should not be part of the peak oil equation.

The data in all charts is thousand barrels per day with the last data point September 2014.

World

World oil production was up 1,270,000 barrels per day in September. This was somewhat of a shocker. I had expected production to be up about .9 mbd but not this much.

Non-OPEC

Non-OPEC nations accounted for 833,000 bp/d of the increase.

OPEC C+C

And OPEC nations accounted for 438,000 bpd of the increase. The EIA said OPEC produced 32,734,000 barrels per day of C+C in September. OPEC’s “secondary sources” said OPEC produced 30,560,000 barrels of Crude Only in September. OPEC’s crude only production had dropped to 30,053,000 bpd in November, or over half a million barrels per day lower.

Read More

Bakken, A Tale of Two Counties

North Dakota publishes their Historical Barrels of Oil Production by County which gives county by county production back to 1951. The data here does not include confidential wells but they publish the last couple of months production data that does include confidential wells here: Oil and Gas Production Report. Looking over this data I found something very strange. In October Bakken production was down by 1,598 barrels per day and all North Dakota was down by 5,4054 barrels per day.

All data is in barrels per day with the last data point October 2014.

McKenzieMcKenzie County was up 19,609 barrels per day or 4.88 percent. In October McKenzie was up even more than it was in September when the Bakken was up 52.5 thousand barrels per day.

Mountrail

Mountrail Countywas down 18,728 barrels per day or 6.42 percent. There is  more on this story below.

Dunn

Dunn County was down 3,527 barrels per day or 1.83 percent.
Read More

Bakken New Wells Producing Less Confirmed

It is has now been confirmed. The first measured 24 hour production from Bakken wells is a very good predictor of the future production of that well. And it has also been confirmed that new wells with higher well numbers are producing a lot less.

In the NDIC’s Daily Activity Reports they publish “WELLS RELEASED FROM “TIGHT HOLE” STATUS” as well as “PRODUCING WELL COMPLETED”. By searching these two lists, then eliminating the duplicates that appear on both lists, we find that perhaps 70 to 80 percent of all wells report their first 24 hours of measured production.  It is listed as “BOPD” (Barrels Oil Per Day) and “BWPD” (Barrels Water Per Day). An example below, and notice the second well listed does not give any production numbers:

Producing Wells Completed

The “per day” in this case is the first 24 hours of measured production and not necessarily  the first 24 hours of preduction. I have collected, from this source, the data from 2,565 wells dating from November 1st 2013 to the present date. Enno Peters gathered data from several thousand Bakken wells dating from the early Bakken t mid 2014. Using the well numbers, I have managed to match 1,127 wells in my database with the same well number in Enno’s data. There were a more matches than this but had no data or incomplete data. But it was mostly because only a little over half my data overlapped his.

From his data I used the 2nd and 3rd months production data because the first month’s data was often for less than one full month. I converted his monthly data to barrels per data by dividing the monthly data by 30.417. There were sometimes great anomalies in the data so to smooth things out, on the first three charts below, I used a 50 well average. Here are the results. The horizontal and right axis is first 24 hour barrels. The “First 24hr Barrels” is a smooth line because that was the sort column.

24hr 1

When I sorted the data by production in the first 24 hours I found a strong correlation with the second months production. This was especially true with first 24 hour production up to 1,050 barrels. The “First 24hr Barrels” chart line is smooth of course because that is the sort index.

24hr 2

Sorting all wells by the second months production we see a very strong correlation to the first 24 hours of measured production.

Read More

Texas RRC October Oil & Gas Report

The Texas Railroad Comission has updated their Oil & Gas Production Data Query to include the production numbers for October. The Texas data is always incomplete so the charts all look like there is a big decline in the last few months. This is not the case, the charts only reflect the data that has been received and the production numbers will look a lot more positive after several months.

That being said there is something that can be gleaned from these numbers. Even though the data is incomplete, if production is increasing then last months incomplete numbers should be higher than this months incomplete numbers. Using that logic, there seems to have been a strong slowdown in Texas oil and gas production.

All the last data points are October and is in barrels per day.

Texas Crude Only

In June and July there was a strong increase in production reported to the Tesas RRC by the oil companies. But in August, September and October things slowed down considerably.

Texas Condensate

Texas condensate production has slowed down a lot more than crude. Most Texas condensate comes from their natural gas wells but there are a some wells in the Eagle Ford that produces mostly just condensate.
Read More

Will the Bakken Red Queen Outrun the Growth in Water Cut?

This is a guest post by Rune Likvern 
Who’s Website is: Fractional Flowa

This post presents a closer examination of actual data on Light Tight Oil (LTO) extraction, developments in water cut and Gas Oil Ratio (GOR) for some pools and individual wells in the Middle Bakken and Three Forks formations in North Dakota.

LTO extraction’s primary drive mechanism is (differential) pressure and there are some noticeable trends for LTO extraction from Bakken:

  • LTO productivity (measured as average totals by vintage) in 2014 have increased, most notably from the Middle Bakken formation which has better well productivity than Three Forks.
    There are differences to LTO productivity developments amongst the pools.
  • Water cut; generally increases as the wells ages.
    An indicator for depletion.
  • Water cut; generally increases for newer wells.
    This suggests that the areas with the highest oil saturation has been developed.
  • Gas Oil Ratio (GOR, produced and expressed as Mcf/Bbl); generally increases as the well ages.
  • What appears to characterize a Bakken sweet spot is the presence of natural fractures (favorable geology), high oil saturation and a pressure above hydrostatic pressure.

Further, this post also has a brief look into well economics and describes how well manufacturing is likely to be affected by the decline in the oil price and what this may entail if a lower oil price ($70/Bbl, WTI) is sustained.

Rune 1
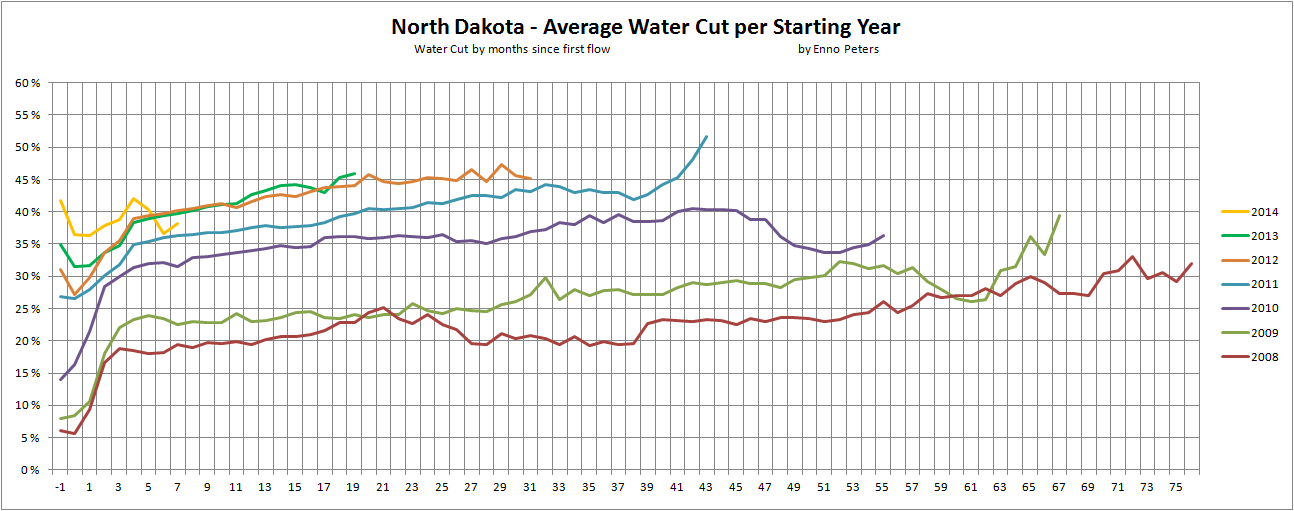
Figure 01: The chart above shows development in the water cut [water cut = [water/(water + LTO)] for the “average” wells by vintage in North Dakota. Produced water (brine) is transported to dedicated disposal sites.
Chart by Enno Peters.

What is fascinating about LTO wells in Bakken is that the individual wells appear to have their own “personality” when it comes to productivity, surrounding rock properties, water/oil saturation and GOR which makes well management (of close to 9,000 “personalities”) a paramount task.

This post contains in total 30 charts that hopefully are self explanatory.

Acknowledgements

This post was made possible by contributions, comments and suggestions from several professionals within the oil industry and the academia.

The invaluable talents and expertise of Enno Peters made it possible to transform the NDIC monthly production data with the formation data into spreadsheet format.

The spreadsheet format allows to sort well data by formation, pool, vintage, company and much more.

NOTE: Actual data used for this analysis are all from North Dakota Industrial Commission (NDIC). Some data are missing for some wells and after discussions, the consensus was that the presented average LTO numbers after the first 12 months should have around 5% added to account for missing data from some wells as well as adjusting for the effects from assuming all wells starts at day one of its reported first month of operation (on average each well flows for half a month during its first month of reported operation).

For wells on confidential list, data on runs was used as a proxy for production.

By adding around 5% of the presented average flows for the first 12 months and around 4% after 36 months numbers should come close to actual.

Production data for Bakken, North Dakota: Monthly Production Report Index

Formation data from: Bakken Horizontal Wells By Producing Zone

Water cut is the ratio of [produced water/(produced water + produced oil)] and expressed as a percentage.

Water cuts for individual wells may swing from 0% to 100%, suggesting a shut in well or data not reported. For the early months of a well’s life the water cut may be influenced from water used for fracking.

The important messages from this analysis are the trends in well productivity, water cut and GOR on an aggregate level and by vintage.

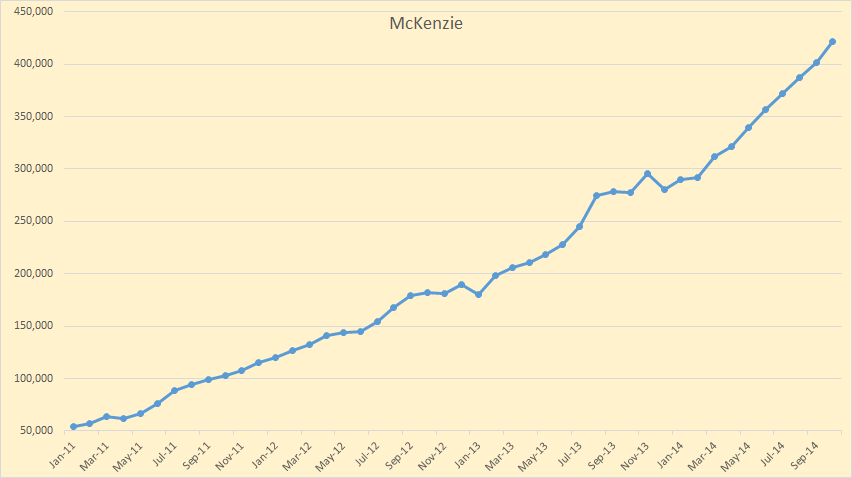
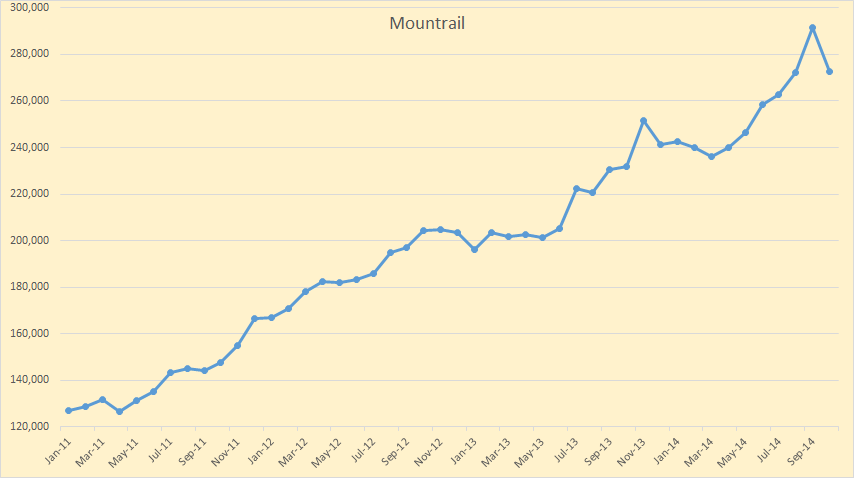
For this presentation wells from two pools in Mountrail (Alger and Van Hook), McKenzie (Banks, Camp) and Williams (Squires, Todd) are presented. Hopefully these pools constitutes a good representation of developments for similar pools.

A growing portion of wells have been/are being targeted the Three Forks formation which may suggest something about remaining attractive targets to drill in the Middle Bakken.
Read More