Did Peak Oil Arrive in 2014?

The recent price crash in crude oil, if it lasts for any length of time, will certainly affect oil production. The question is, just how great an effect will it have an how soon? But in this post I want to concentrate on what is, or was, happening to world oil production even before the price crash.

Russia, the largest producer of crude oil in the world, will peak in 2014. There are various estimates of how fast their production will decline but best case, for Russia, puts their decline at about 2% per year. They say they are depending on the Bazhenov Shale and Arctic offshore just to keep production flat in 2015. Well that is not going to happen, not in the next few years anyway. And if prices stay in the current range it is unlikely to ever happen.

OPEC is a wild card but there is little doubt that they are producing flat out right now. Only Iran has any real any real chance of increasing production very much and that only if sanctions are lifted. Libya has already increased production significantly and could increase more but very little. With the violence still going on in Libya, there is a greater chance that their production will decline.

But before we go any further let’s look at what the EIA is predicting for 2015 for both the USA and the rest of non-OPEC? The below charts are from the EIA’s Short-Term Energy Outlook. Current data is through October 2014 and the projected data is through December 2015. All data is in million barrels per day. Also, very important, the data is Total Liquids which includes NGLs, bio fuels and refinery process gain. The EIA, for US production even counts refinery process gain on imported oil.

STOE USA

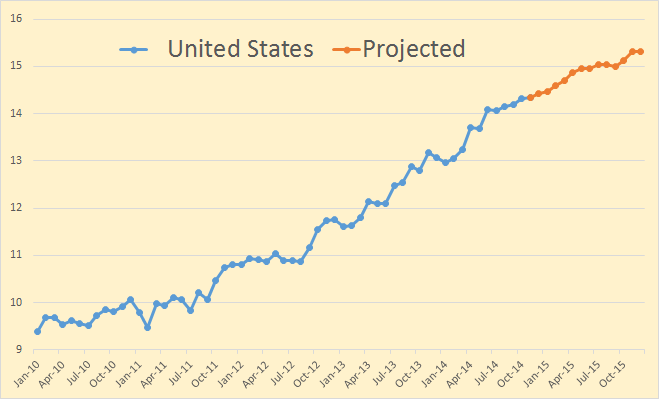
The EIA is predicting US average production total liquids will be up 1.49 million barrels per day in 2014 and up another 1.1 mbd in 2015. (I always use m for million and k for thousand.)

STOE non-OPEC

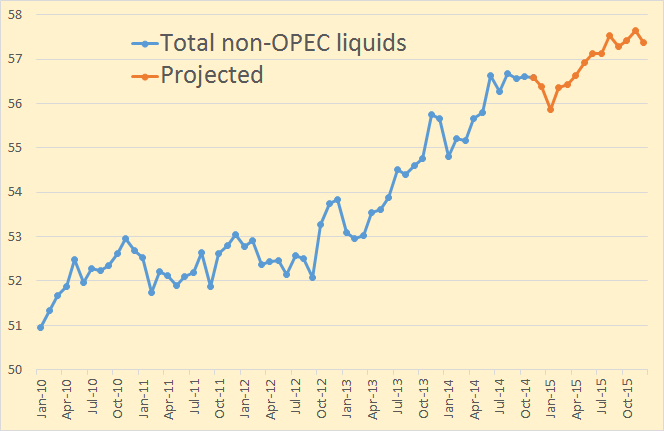
The EIA is predicting non-OPEC average total liquids will be up will be up 1.88 mbd in 2014 but only about half that, up .95 mbd, in 2015.

Read More

More on Bakken Production, Choke Theory

The US Petroleum Supply Monthly just came out with production data for every state and territory. US supply was up 168,000 bpd to 8,864,000 bpd in September. The biggest gainers were North Dakota, up 53,000 bpd to 1,185,000 bpd and Alaska up 79,000 to 477,000 bpd. Alaska  was way down in both July and August and are just recovering from that.  There was only one big loser, New Mexico, down 18,000 bpd. Texas was up only 9,000 barrels per day which was surprising. The Gulf of Mexico was down 3,000 bpd.

The Choke theory and why I ain’t buying it.

North Dakota publishes a Daily Activity Report Index of all permits and other well activity in the Bakken as well as the rest of North Dakota. In this report is a list of all producing wells completed as well as wells released from confidential (tight hole) status. Wells usually stay on this list from a few days to a few months, but the average is only a few weeks.

I have collected this data from October 2013 to present and found some startling results. But some have said this data means nothing, that wells are usually choked off by the driller so therefore we can gain nothing from the data. But looking at the individual wells that just doesn’t make any sense. No, I agree that the driller chokes but that he would not gradually choke more according to increasing well number.

Below I have posted the first 24 hour data for all 122 wells reported by North Dakota for the first 25 days of November. The first 24 hour production ranges from over 3000 barrels of oil per day to a low of only 10 barrels of oil per day. Barrels of water range from a high of 6663  bwpd to a low of 48 bwpd. And the percent water cut ranges form a high of 94.15% water to a low of 12.75% water.

It just seems incredible to me to claim that these numbers are meaningless. Throughout all the almost 14 months of data I have gathered there are lots of very large producing wells and a lot of small producing wells. The point is as the well number increases the number of very large producing wells seems to decrease while the number of small producing wells seems to increase. And I just don’t believe this is due to the many drillers, after checking their well number, decides what size choke to apply.

Bakken NovemberBakken November 2Bakken November 3

Just below the list of all wells I have averaged the production according to well number. The sample however is not large enough to really mean a lot. The number of wells in the sample are: Below 26000, 11 wells  – 26000s 35 wellw – 27000s 54 wells – 28000s 23 wells.
Read More

Bakken Sweet Spots are Petering Out

The Bakken, as well as other shale oil areas, is not one homogeneous area where equal amounts of can be found. David Hughes in DRILLING DEEPER puts it this way, though here he is talking about gas wells, the same applies to oil wells:

All shale gas plays invariably have “core” areas or “sweet spots”, where individual well production is highest and hence the economics are best. Sweet spots are targeted and drilled off early in a play’s lifecycle, leaving lesser quality rock to be drilled as the play matures (requiring higher gas prices to be economic); thus the number of wells required to offset field decline inevitably increases with time.

However the Bakken, at least through the September North Dakota Industrial Commission  production report, has given no real indication that the Bakken is even close to peaking. But a closer look at the data makes me believe that is all about to change.

The NDIC issues a Daily Activity Report where they list permits issued as well as wells completed and wells released from the tight hole confidential list. These reports usually, but not always, also give the number of barrels of oil per day and barrels of water per day for the first 24 hours of production.  I have gone through every day, back to November 1st, 2013 and collected the data on every well listed that gives production numbers and copied that data to Excel. In that one year and three weeks I have gathered the data form every one of the 2,171 wells that give production numbers. Sorting these wells by well number, which is the original permit number, gives some startling results.

ND 200 Well Avg

To smooth the chart I created a 200 well average of barrels per day per well. The first point on the chart is therefore the average to the 200th well, #23890 and the last point is the 200 well average to the 2171st well, #28971. As you can see there has been a continuous, though erratic, decline in first 24 hour production as the well numbers increase.

ND Prod per 1000

Breaking this down according to well numbers we see production peaked with the 2400s and have steady decline since. Every group of well numbers do not contain the same number of wells.
Read More

Texas RRC November Production Report

The Texas RRC Data Base came out a few days ago. The data is reported through September but of course it is incomplete. The data from the field comes in very slow in Texas and the RRC only reports the data they receive. All data is through September and is in barrels per day.

Texas Crude Only

Crude only has shown a slight downward trend for the last two months. After revision, when the final data comes in, production will likely still be up slightly but if this is any indication, it will be up less than in months past.

Texas Condensate

Texas condensate production started a dramatic slowdown in June of 2013. It actually declined three months in a row, June, July and August of 2013 but then started to recover. But production growth has slowed since that date.

Read More

Gulf of Mexico Crude Oil and Gas Production

This is a guest post by Jean Laherrere

BOEM and BSEE have published in 2014 the GOM oil & gas reserves at end 2010 few months ago and at end 2011 lately.

The big change is that they now report proved and probable reserves = 2P (in contrary to SEC rules for operators reporting at the US Stock Exchange, forbidding to report probable reserves), when before they reported only proved reserves = 1P

They argue:

In order to more closely align BOEM GOM reserves definitions with the Petroleum Resources Management System definitions (SPE/AAPG/WPC/SPEE 2007), this report clarifies that Proved Reserves in this and previous reports are Proved plus Probable (2P) estimates.

The difference between original reserves estimates from previous year found little difference for discoveries before 1995

The difference between 2P 2011 and 2P 2010 is a very large decrease for Thunder Horse (-488 Mb or 573 Mboe) and the largest increase is Great White +73 Mb

Jean 1

The difference between 2P 2010 and 1P 2009 displays a large increase in Tahiti +169 Gb and large decrease with Atlantis -92 Mb (already in decrease in 2009)

Jean 2

The difference between 1P 2009 and 1P 2008 is as important as the difference between 2P and 1P: large increase with WD 030 +61 Mb and large decrease for Atalntis -161 Mb

Jean 3

The change in reserves with time  and definitions does not change the estimate on GOM ultimates: 24 Gb and 210 Tcf
Read More