AEO 2015 Preliminary Report

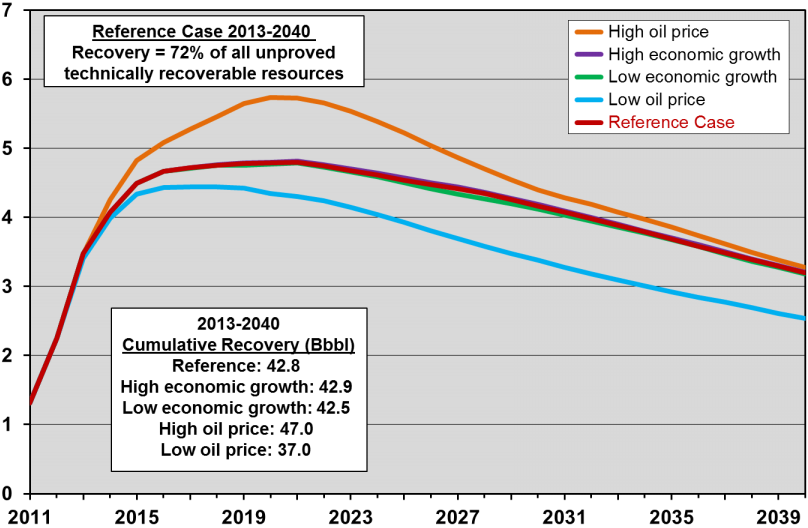
The EIA published, last month, AEO2015 Preliminary Oil & Natural Gas
Production & Price Results
. And just below the title they wrote:

                                    DRAFT – DO NOT CITE
But I am not citing anything, just informing you of what they said. 😉 What they mean however is that they reserve the right to change their mind before the report comes out early net year. And I can certainly understand that. All Oil data is in million barrels per day.

AEO 2015 1

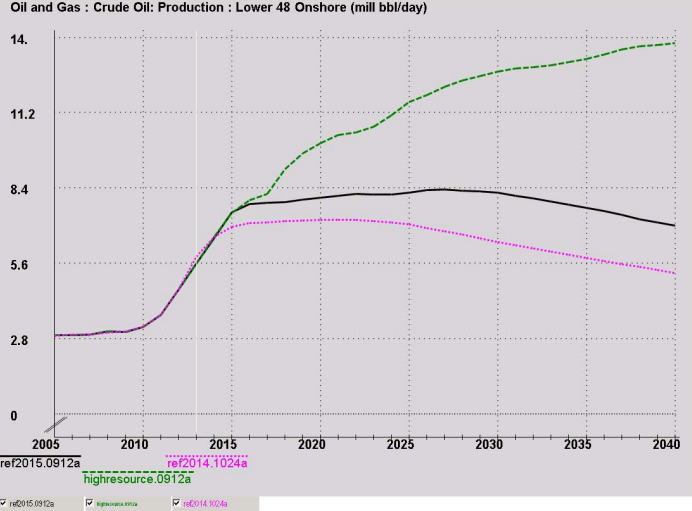
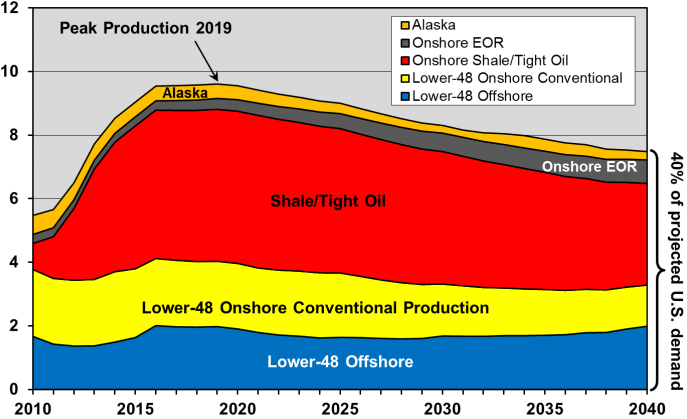
They have lower 48 production hitting a slowly increasing plateau in 2016 and peaking at just under 8.4 million barrels per day in 2027.

AEO 2015 2

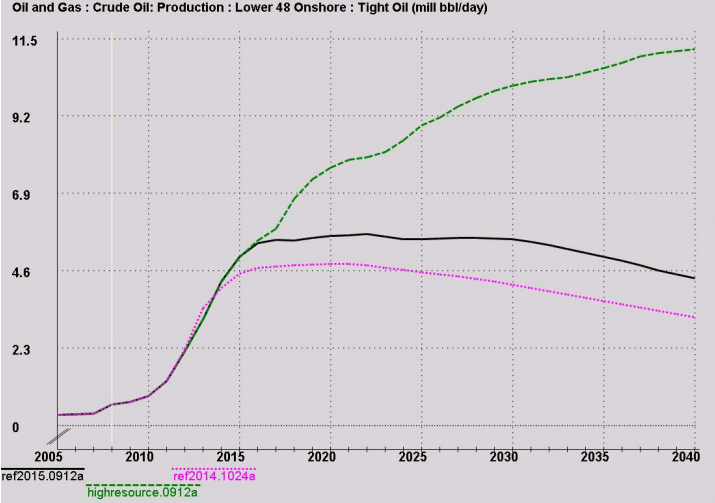
They have US Tight Oil production following pretty much the same profile, hitting a plateau in 2016 at about 5.5 million barrels per day and holding flat until starting a very slow decline in 2030.

Read More

Post Carbon Institute’s LTO Reality Check

The Post Carbon Institute has just released a critique of the EIA’s Light Tight Oil projections. It is titled DRILLING DEEPER. The report is highly critical of the EIA’s projections and should be read by everyone interested in Peak Oil.

All data on all charts is in million barrels per day unless otherwise specified.

EIA Oil Projection

 First a look at the EIA oil projections for US production from all sources. They expect offshore to increase to 2 million barrels per day by 2016, an increase of almost 600,000 bpd from current production. Also note that the EIA has US almost peaking in 2016 and increasing only slightly until the peak in 2019.

EIA LTO Hi Lo Projection

The EIA has several projections, covering all bases. However the reference, or most likely, will be the only one covered in this post.
Read More

Texas RRC Oil and Gas Report, August Data

The Texas Rail Road Commission just released their oil and gas production report with the August data. As you probably know by now that this data is incomplete. The latest months will all turn down but as more companies report their data, which can be up to two years late, the data will reflect what is actually produced.

There is something strange about the August data however. This is the first time since last November that all four data sets, Crude, Condensate, Gas Well Gas and Casinghead (Associated) gas, are show lower production than the previous month. So keeping in mind that the previous months data was just as incomplete as this months is, the data should, if production is increasing, still show an increase. This month however, it does not.

All oil data is in barrels per day and all Gas data is in MCF per day with the last data point August 2013.

Texas Crude Only

 The August crude only data was 124,723 bpd below July.

Texas Condensate

Texas Condensate was moving up rather smartly until June of 2013. Since then it has been erratic. It is clear that Texas condensate production is not increasing very much and may now actually be declining. Texas condensate (incomplete data) dropped 41,175 bpd, July to August.

Read More

Bakken Oil Production by County

North Dakota production by county is posted here: ND Historical Barrels of Oil Produced by County Confidential wells are not included in that data however but that estimated data can be found here:Monthly Production Report Index Click on the latest month.

Bakken by County

 This is a zero based chart and gives a better overall picture of production from each county. The charts below are not zero based but gives an amplified picture of production from each county.

Production in barrels per day for each county was as follows:
McKenzie      386,715 
Mountrail      278,940
Dunn              185,707 
Williams        149,437
Rest  of ND   131,531

McKenzie

McKenzie county production was up by 16,435 barrels per day. McKenzie remains the most productive county in North Dakota.
Read More

Bakken, North Dakota Update, August Data

The new Bakken and North Dakota production data is out with the August production numbers. The last data point for all charts is August 2014.

Bakken Barrels Per Day

Bakken oil production was up 16,864 bpd in August to  1,067,745 bpd. This is about 6,100 barrels per day less than the growth in July which was 22,965 bpd. However all North Dakota was up 17,910 bpd in August compared to 21,661 growth in July. This was a growth of 1,046 bpd for North Dakota production outside the Bakken. In July production outside the Bakken was down 1,304 bpd.

Bakken Well production

The big surprise this month was in wells completed and wells producing. Bakken wells producing increased by 211 and all north Dakota wells producing increased by 274. That meant wells producing outside the Bakken increased by 63. That is a real shocker since Helms says 95% of all activity is in the Bakken. From the Director’s Cut, bold mine: Read More